r user group meeting 25th jan 2017
TRANSCRIPT

R User Group MeetingUsing R in Kaggle Competitions
25th January 2017
Garrett Teoh Hor Keong


What is Kaggle?
Learn, Explore, Compete, Have Fun

Which Competition to Participate?
Featured
Competitive
(Count towards rank)
Recruitment
Competitive Solo(Count towards rank)
Playground
Non Competitive(Does not count towards rank)
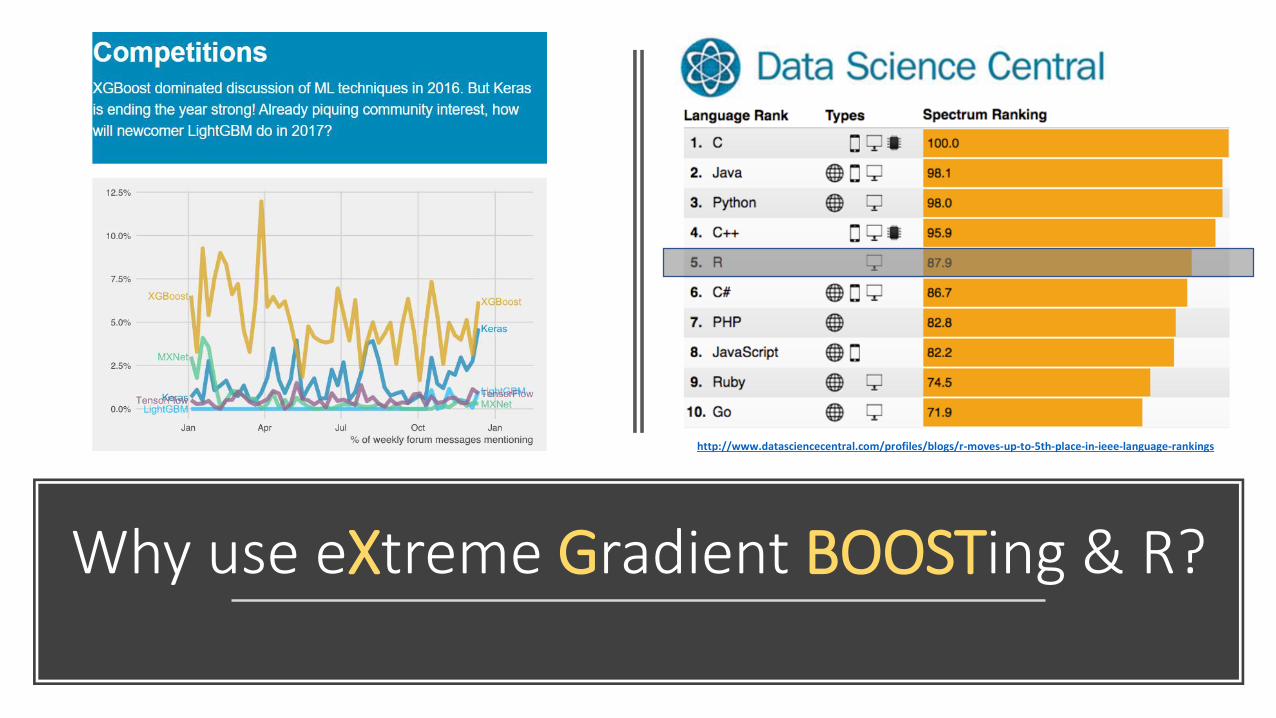
Why use eXtreme Gradient BOOSTing & R?
http://www.datasciencecentral.com/profiles/blogs/r-moves-up-to-5th-place-in-ieee-language-rankings

Choosing a Competition
• Objective – Binary/Multi-Class Classifications, Continuous Value predictions, Image Classifications, Recommendation, Optimization.
• Evaluation – AUC, LogLoss, RMSE, Mean Absolute Error (MAE), Mean Average Precision @n (MAP@n)
• Size of Datasets – Train/Test proportion, n Samples, n Dimensions.
• Team/Solo/Prize/Timeline/Kernel….

Starting a Competition
• Downloading datasets – Train, Test, and Submission. • Matching sample IDs in test.csv -> IDs in submission.csv
• Timeline – First submission, Merger (teams), Final submission.
• Rules – No sharing of information between teams, no public datasets, one account per competitor, daily submission limit of 5. *Take note for team forming criteria: Total Subs <= (Days competition running * 5)
• Public & Private LB – Only public scoring will be shown, private scores will be revealed at the end of the competition.

BNP Paribas Challenge Example
• Evaluation metric: Logloss
• Datasets: Train (114321), Test (114393), 131 features
• 2,926 teams participated, prize money: $30,000, timeline: 3 months
Objective (Problem Statement)

R Code: Essential Packages
READR- for reading in input files and writing output submission files in .csv
01
XGBOOST- machine learning algorithm, trees or linear regression based booster
02
CARET- data splitting and pre-processing. model tuning and feature selections
03
MLMETRICS- collection of various evaluation metrics.
04
BINR- cutting numerical values into evenly distributed groups (bins), for basic features engineering
05
DPLYR- handy tools for data manipulations e.g. n_distinct, arrange, filter and etc.
06
GGPLOT2- the famed R elegant data visualization tools for bar charts, line graphs, histograms and more…
07

R Code: Features Exploration (Basic)
• Check row IDs, submission IDs, and make copy of train set response/outcomes.
• Check for missing data – NAs.
• Check for valid and correct data types.• Integer (Nominal vs Ordinal)• Categorical (Nominal vs Ordinal)• Numerical• Boolean• Date
• Check for n unique values for Categorical/Integer features, range, mean, median for Numerical/Integer features.
• Run the nearZeroVar “CARET” package.• Review/Remove near zero variance features• Remove all zero variance features

R Code: Features Exploration (Basic)
DEMO
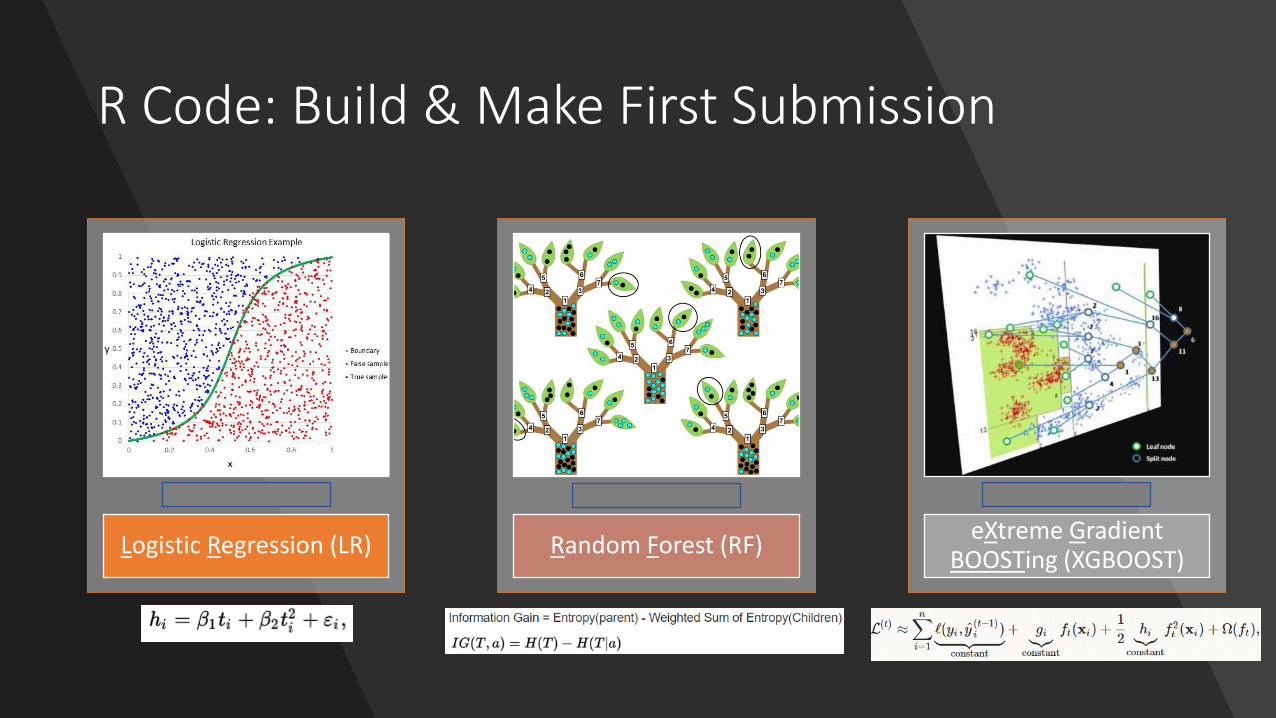
R Code: Build & Make First Submission
Logistic Regression (LR)
Rank on PB: 2,364
Random Forest (RF)
Rank on PB: 2,842
eXtreme Gradient BOOSTing (XGBOOST)
Rank on PB: 2,164

R Code: Your First Submission to Kaggle (GSD)
DEMO

Moving Up Ranks On Kaggle: Key Points
Cross Validation (Bread & Butter)
• Data Partitioning, how many K-folds?
Features Engineering (Most of time)
• One-Hot Encoding, log-scale or z-score transformations, binarized, recode, Quadratic Discriminant Analysis, entropy, hashing.
Tune Your Model! (Don’t be lazy)
• Regression Based: Alpha, Gamma, Regularization parameters and etc..
• Tree Based: Max depth, N trees, min leaf/child, and etc…
• Gradient Boosting: Learning rate, subsample, features subsampling, hessian gradient loss function, n rounds, gamma, max_depth
Ensemble (Stacking & Blending)
• Dark Art: Simple/rank averaging, weighted/geometric averaging
• White Magic: Blending features, stacking models, multi stage stacker
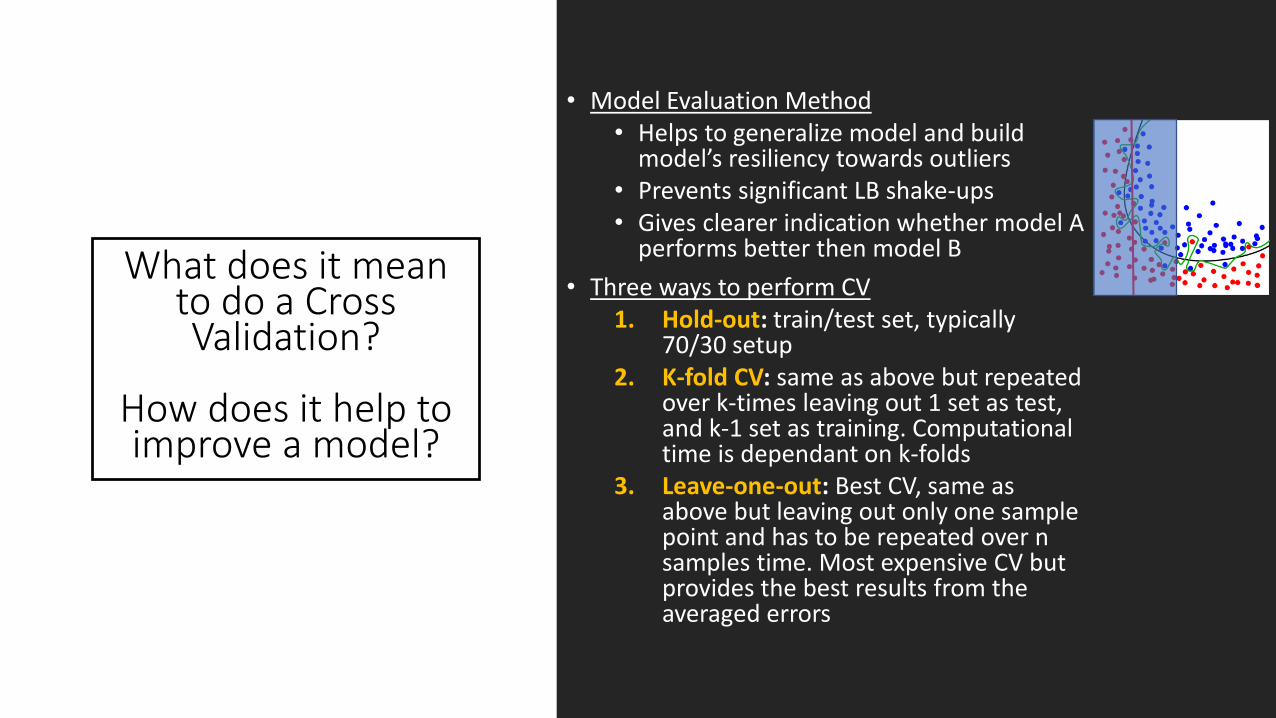
What does it mean to do a Cross Validation?
How does it help to improve a model?
• Model Evaluation Method• Helps to generalize model and build
model’s resiliency towards outliers• Prevents significant LB shake-ups• Gives clearer indication whether model A
performs better then model B
• Three ways to perform CV1. Hold-out: train/test set, typically
70/30 setup2. K-fold CV: same as above but repeated
over k-times leaving out 1 set as test, and k-1 set as training. Computational time is dependant on k-folds
3. Leave-one-out: Best CV, same as above but leaving out only one sample point and has to be repeated over n samples time. Most expensive CV but provides the best results from the averaged errors

How to Set Up Cross
Validation?
4 fold CV
Hold out 25% samples Train 75% samples
3 fold CV

eXtreme Gradient Boosting: Key
Considerations
• Developed by Chen TianQi (University of Washington, Large Scale Machine Learning)
• requires(xgboost)
• Relatively easy to set up in R, challenging to set up in Python, especially on a window machine.
• Multi-thread-able on R: nthread=n
• Three boosters to choose from (gbtree, dart, gblinear)
• Standard evaluation metrics (customizable)
• Objectives (loss function customizable)
• Full description/parameters of the model: https://github.com/dmlc/xgboost/blob/master/doc/parameter.md
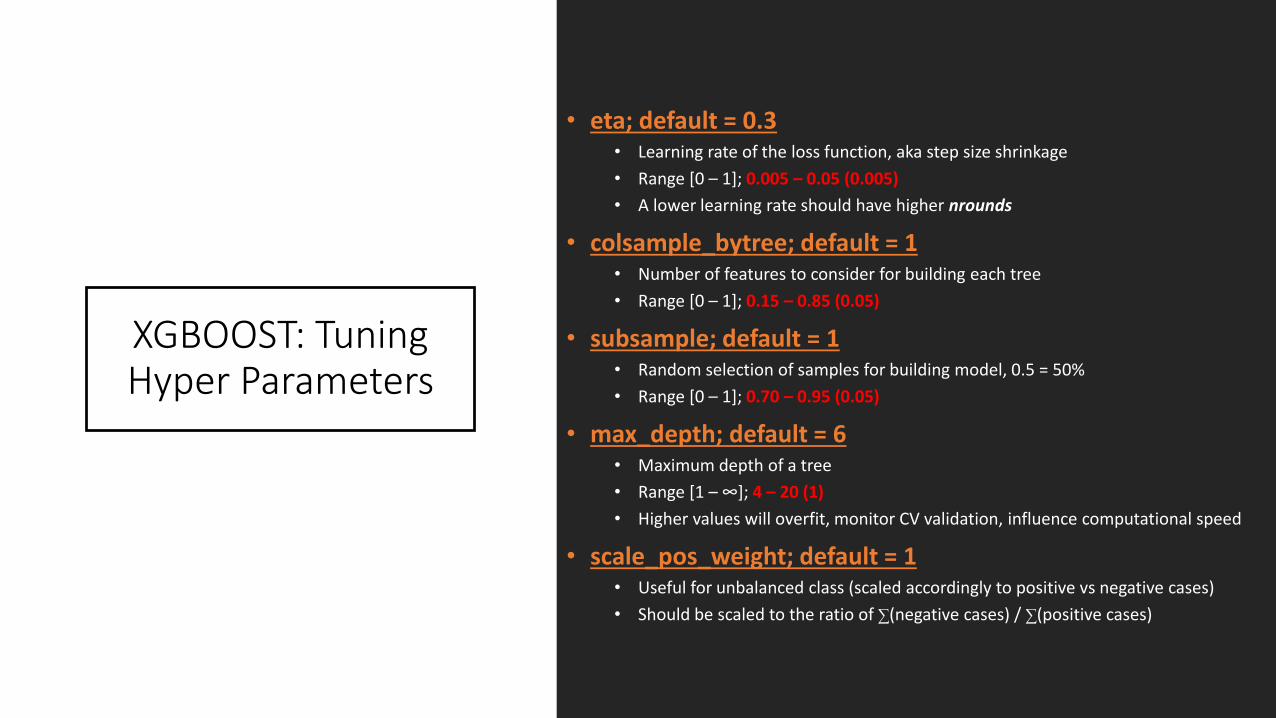
XGBOOST: Tuning Hyper Parameters
• eta; default = 0.3• Learning rate of the loss function, aka step size shrinkage
• Range [0 – 1]; 0.005 – 0.05 (0.005)
• A lower learning rate should have higher nrounds
• colsample_bytree; default = 1• Number of features to consider for building each tree
• Range [0 – 1]; 0.15 – 0.85 (0.05)
• subsample; default = 1• Random selection of samples for building model, 0.5 = 50%
• Range [0 – 1]; 0.70 – 0.95 (0.05)
• max_depth; default = 6• Maximum depth of a tree
• Range [1 – ∞]; 4 – 20 (1)
• Higher values will overfit, monitor CV validation, influence computational speed
• scale_pos_weight; default = 1• Useful for unbalanced class (scaled accordingly to positive vs negative cases)
• Should be scaled to the ratio of ∑(negative cases) / ∑(positive cases)

XGBOOST: Advance Tuning and
Customizations
• min_child_weight; default = 1• Minimum sum of instance weight (hessian gradient) in a child node, loss
derivatives.
• Range [0 – ∞]; 0 – 10 (1)
• Higher values to be conservative, adjust accordingly with max_depth
• gamma; default = 0• Minimum loss reduction to create a further partition leaf node. Pseudo
regularization hyperparameter of gradient boosting (hyper sensitive to datasets).
• Range [0 - ∞]; 0 – 20 (0.1, 0.01, 1)
• Higher values will make the model more conservative. Mostly used for stacking/ensemble models.
• eval_metric• Default metric assigned for respective objective, rmse for regression, auc for
binary logistic, map for ranking.
• Customized function takes in 2 input: “yhat” and “xgb.DMatix object”, where yhat = ground truth from train set and getinfo(dtrain, labels) = predicted.
• objective• Input same as eval_metric (yhat & xgb.Dmatrix)
• Needed output has to return a list(grad=grad, hess=hess)

Features Engineering: Most
Popular Picks
• One Hot Encoding (Dummy Variables)• Typically used to transform categorical/nominal features.
E.g. team ID (1=IT, 2=marketing, 3=sales, 4=media).
• Log Scale Transformations• Ideal for continuous / numeric features with extremely
large values. E.g. income ranges from 1,000 to 1,000,000 after log10() transformed will range between 3 to 6.
• Z-Score Transformations• Ideal for continuous / numeric features with skewed
distributions or flattened tail ends. QQ-plots.

Features Engineering: Most
Popular Picks (Cont.)
• Binarized Features• Ideally for converting continuous features into n bins. • Range of values that are highly correlated with
response. E.g. age (13-99), response = spending power (e.g. house, luxury goods, etc..) age groups < 18 (low); 18 > age <= 25 (medium); 25 > age <= 40 (high); age > 40 (sub medium high).
• “Categorized” bins and further One-Hot Encode it.
• Pairwise Linear Features• Using any 2 features to create new feature. • Applicable for Categorical/Integer features (interaction
term * or ratio is applicable). E.g. session time per article (ratio), article view by country (*). N (f1 nominal) x M (f2 nominal) of new features are created.
• Higher Order Polynomial Features• Same as above, but using second, third, ….and higher
order are used.• E.g. of a quadratic relationship with linear component:
features a, b given y:

Ensemble Models
• Different Models Definition• Different Seed• Combinations of different hyperparameters
• Combinations of different features set
• Algorithms (GLMNET, ENET, NNET, RF, XGBOOST, RLIGHTGBM and etc….)
• Dark Art• Averaging on all submissions.• Rank averaging – sort all predictions for each model and rank
them; distribute prediction scores according to their ranks.
• Weighted averaging/ranking. Same as previous but assigning different weights on each/combination of models.
• Random guess / based on modeler’s experience.
• White Magic• Model based approach to ensemble. (requires at least 100
models, or 50% of dataset dimensions)• Predict train + test dataset
• Model predictions are used as new features.
• Blended approach – Using model predictions + original data features to build next stage predictions.
• Stacking approach – Only use model predictions for next stage predictions.
• Multi-stages (usually 3rd stage and 4th is a dark art averaging)

R Code: Improving Your Submission on Getting a Decent Rank with XGB
DEMO

Kaggler Grandmasters Masterpiece
http://blog.kaggle.com/2016/04/08/homesite-quote-conversion-winners-write-up-1st-place-kazanova-faron-clobber/
Home Depot Product Search RelevanceAlex, Andreas, Nurlan
http://blog.kaggle.com/2016/05/18/home-depot-product-search-relevance-winners-interview-1st-place-alex-andreas-nurlan/


Thank You! 25th January 2017
RUGS SG
Garrett Teoh