r. van malderen 1,5, e. pottiaux 2,5, h. brenot 3 and s. beirle 4 r oyal m eteorological i nstitute...
TRANSCRIPT

R. Van Malderen1,5, E. Pottiaux2,5, H. Brenot3 and S. Beirle4
ROYAL METEOROLOGICAL INSTITUTE OF BELGIUM
1
ROYAL OBSERVATORY OF BELGIUM
2
BELGIAN INSTITUTE FOR SPACE AERONOMY
3
MAX PLANCK INSTITUTE FOR CHEMISTRY
4
SOLAR-TERRESTRIAL CENTRE OF
EXCELLENCE5

WMO CIMO TECO, Brussels,
16-18 Oct. 2012
What? inter-technique comparison between 4 different instruments measuring the same atmospheric variable
Which variable? integrated water vapour (IWV)
Where? world-wide, but first focus on Brussels, (50°48'N, 4°21'E, 100 m asl) as case
study
When? The different instruments cover different observation periods.
Aims? • assess the quality of the different measurements: the precision -
accuracy - performance of the instruments• obtain a better monitoring and understanding of the changing water
vapour content in the atmosphere
IntroductionIntroductionROB

WMO CIMO TECO, Brussels,
16-18 Oct. 2012
1. Instruments and datasets
2. Case study: Brusselsi. Data overviewii. Scatter plotsiii. Impact of cloud cover
3. World-wide data exploitationi. Site selection ii. Scatter plot properties
4. Conclusions & Perspectives
OutlineOutlineROB
WMO CIMO TECO, Brussels,
16-18 Oct. 2012
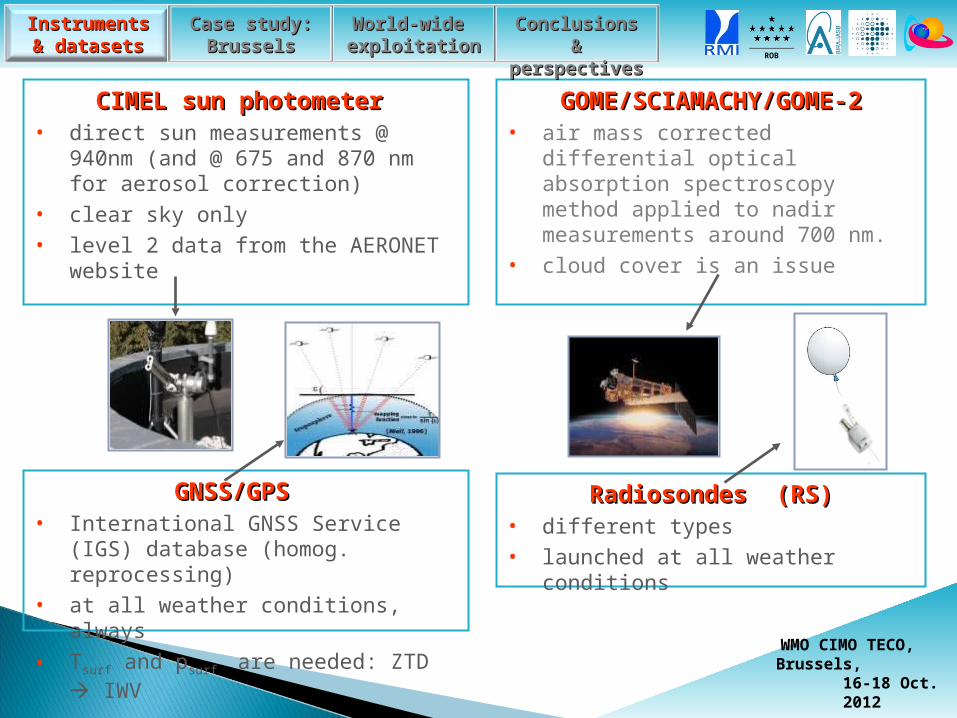
RadiosondesRadiosondes (RS)(RS)• different types• launched at all weather conditions
CIMEL sun photometerCIMEL sun photometer • direct sun measurements @ 940nm
(and @ 675 and 870 nm for aerosol correction)
• clear sky only• level 2 data from the AERONET
website
GNSS/GPS GNSS/GPS • International GNSS Service (IGS)
database (homog. reprocessing)• at all weather conditions, always
• Tsurf and psurf are needed: ZTD IWV
GOME/SCIAMACHY/GOME-2GOME/SCIAMACHY/GOME-2• air mass corrected differential
optical absorption spectroscopy method applied to nadir measurements around 700 nm.
• cloud cover is an issue
Instruments Instruments & datasets& datasets
World-wide World-wide exploitationexploitation
Case study: Case study: BrusselsBrussels
Conclusions Conclusions & &
perspectivesperspectivesROB

WMO CIMO TECO, Brussels,
16-18 Oct. 2012
different instruments = different observation periods scatter plots of simultaneous IWV measurements with respect to the
GNSS device as reference
Instruments Instruments & datasets& datasets
World-wide World-wide exploitationexploitation
Case study: Case study: BrusselsBrussels
Conclusions Conclusions & &
perspectivesperspectivesROB

GPS-CIMELGPS-CIMEL GPS-RS9xGPS-RS9x
GPS-GOME(2)/SCIAGPS-GOME(2)/SCIA
bias with GPS ranges between -0.6 mm and +0.6 mm
best overall agreement between GPS and CIMEL sun photometer
regression slope closest to 1 for all-weather devices scatter plot influence of cloud cover?
WMO CIMO TECO, Brussels,
16-18 Oct. 2012
Instruments Instruments & datasets& datasets
World-wide World-wide exploitationexploitation
Case study: Case study: BrusselsBrussels
Conclusions Conclusions & &
perspectivesperspectivesROB

cloud cover ↗ regression slopes ↘ and correlation coefficients ↘ GPS measurements incorporate contribution from clouds in directions
towards satellitesWMO CIMO TECO, Brussels,
16-18 Oct. 2012
GPS-CIMELGPS-CIMEL
Instruments Instruments & datasets& datasets
World-wide World-wide exploitationexploitation
Case study: Case study: BrusselsBrussels
Conclusions Conclusions & &
perspectivesperspectivesROB

selection of 28 sites world-wide (NH), with focus on CIMEL-GPS co-location and based on meteo data availability (GPS)!
WMO CIMO TECO, Brussels,
16-18 Oct. 2012
Instruments Instruments & datasets& datasets
World-wide World-wide exploitationexploitation
Case study: Case study: BrusselsBrussels
Conclusions Conclusions & &
perspectivesperspectivesROB

scatter plot properties for the 28 co-locations, ordered with increasing latitute from left to right
geographical dependency?WMO CIMO TECO, Brussels,
16-18 Oct. 2012
Instruments Instruments & datasets& datasets
World-wide World-wide exploitationexploitation
Case study: Case study: BrusselsBrussels
Conclusions Conclusions & &
perspectivesperspectivesROB

similar inter-technique conclusions as for the Brussels case study!
WMO CIMO TECO, Brussels,
16-18 Oct. 2012
Instruments Instruments & datasets& datasets
World-wide World-wide exploitationexploitation
Case study: Case study: BrusselsBrussels
Conclusions Conclusions & &
perspectivesperspectivesROB

although originally tracing other slants/directions, very good agreement between the ground-based (2) and in-situ (1) devices
The IGS database of GPS measurements and the AERONET sun photometer measurements are very promising to be used for IWV trend analysis due to their homogeneous data reprocessing (IGS) and their regular instrument calibration (AERONET).
The weather observations bias (partly clear sky needed) in the sun photometer and GOME(2)/SCIAMACHY data series affects the comparison with all-weather devices, but what is the impact on the trends? subject of a subsequent study
WMO CIMO TECO, Brussels,
16-18 Oct. 2012
Instruments Instruments & datasets& datasets
World-wide World-wide exploitationexploitation
Case study: Case study: BrusselsBrussels
Conclusions Conclusions & &
perspectivesperspectivesROB

WMO CIMO TECO, Brussels,
16-18 Oct. 2012
Brussels (Belgium) Calgary (Italy)
monthly means monthly means
although overall good agreement, small difference in trend slope between GPS and radiosonde time series (-0.15 vs. -0.45 mm/decade)
RS IWV < IGS IWV in early years: instrumentation change for RS?
Large difference in IWV trends (0.16 vs. 1.29 mm/decade)
Instruments Instruments & datasets& datasets
World-wide World-wide exploitationexploitation
Case study: Case study: BrusselsBrussels
Conclusions Conclusions & &
perspectivesperspectivesROB

WMO CIMO TECO, Brussels,
16-18 Oct. 2012
rather consistent picture: IWV ↑ , most significantly (> 0.5 mm/dec) in central Europe
trend difference in ZTD between 2 IGS stations (MADR, VILL) near Madrid (both use the same meteo station data)
Brussels?
Instruments Instruments & datasets& datasets
World-wide World-wide exploitationexploitation
Case study: Case study: BrusselsBrussels
Conclusions Conclusions & &
perspectivesperspectives
Summary: all European IGS stations starting in 1995/1996
ROB