raccoon roundworm encephalitis — chicago, illinois, and ... · january 4, 2002 / vol. 50 / nos....
TRANSCRIPT

January 4, 2002 / Vol. 50 / Nos. 51 & 52
U.S. DEPARTMENT OF HEALTH & HUMAN SERVICES
Raccoon Roundworm Encephalitis —Chicago, Illinois, and Los Angeles, California, 2000
Baylisascaris procyonis (BP), a common roundworm found in the small intestine ofraccoons, causes severe or fatal encephalitis (neural larva migrans [NLM]) in a variety ofbirds and mammals, including humans (1–8 ). BP also can cause human ocular and vis-ceral larva migrans (1,2,9 ). Humans become infected with BP by ingesting soil or othermaterials (e.g., bark or wood chips) contaminated with raccoon feces containing BP eggs(2 ). Young children are at particular risk for infection as a result of behaviors such as picaand geophagia and placing potentially contaminated fingers and other objects (e.g., toys)into their mouths. This report describes two cases of BP encephalitis in residents ofChicago and Los Angeles and illustrates the importance of reducing exposure to rac-coons and their feces in U.S. urban areas.
Chicago
During July 2000, a boy aged 2½ years with a history of iron deficiency anemia andpica was admitted to a Chicago hospital with a low-grade fever of 8 days duration andincreasing lethargy, irritability, and ataxia during the 3 days preceding admission. Adiagnosis of encephalitis was made based on the clinical presentation and laboratoryfindings on admission, including peripheral eosinophilia (28% of 21,000 white blood cells/mm3), cerebrospinal fluid (CSF) eosinophilic pleocytosis (32% of 80 white blood cells/mm3), and diffuse slow waves on an electroencephalogram. Less than 24 hours afteradmission, the patient lapsed into a coma with opisthotonus and decerebrate posturing;magnetic resonance imaging (MRI) revealed abnormalities in the deep white matter ofboth cerebellar hemispheres. Other possible causes of encephalitis (e.g., herpes sim-plex; arboviruses and enteroviruses; lymphocytic choriomeningitis; measles; and bacte-rial, fungal, and parasitic infections [e.g., toxocariasis and cysticercosis]) were excludedbased on direct examination, culture, serology, and polymerase chain reaction (PCR)testing of blood and CSF. Antibodies to BP were detected in CSF and serum specimens byindirect immunofluorescence assay (IFA) (6,8 ) with titers increasing several fold andreaching high levels (1:1,024 in CSF and 1:4,096 in serum specimens) during the 4 weeksfollowing admission. The child was treated with albendazole and corticosteroids, but hiscondition did not improve. After 4 weeks of hospitalization, he was transferred to arehabilitation center where he stayed for several months. He then was sent home wherehe remains profoundly neurologically disabled and in need of continuous nursing care.
Eighteen days before admission, the child’s parents had observed that he had dirt onhis mouth while playing beneath a cluster of trees in a nearby yard in a Chicago suburb
1153 Raccoon Roundworm Encephalitis —Chicago, Illinois, and Los Angeles,California, 2000
1156 Multidrug-Resistant Streptococcuspneumoniae in a Child Care Center —Southwest Georgia, December 2000
1159 Notices to Readers

1154 MMWR January 4, 2002
Raccoon Roundworm Encephalitis — Continued
where raccoons are common. A field study conducted in September 2000revealed several sites of raccoon fecal contamination positive for BP eggs in the yard.Infective BP eggs were recovered from soil and debris at the base of the tree cluster;mice infected with these eggs developed fatal encephalitis as a result of NLM.
Los Angeles
In January 2000, a boy aged 17 years with an 8-year history of severe developmentaldisabilities and geophagia was admitted to a Los Angeles hospital comatose and withgeneralized hypertonia and hyperreflexia. His mouth was tightly clenched, his eyes wan-dered rapidly, and he responded only to painful stimuli. Two days before admission, hehad a low-grade fever, drowsiness, and problems with coordination. Laboratory findingson admission included peripheral eosinophilia (15% of 15,900 white blood cells/mm3) anda CSF eosinophilic pleocytosis (37% of 19 white blood cells/mm3). He was treated withantibacterial, antiviral, antifungal, antiparasitic (albendazole), and antiinflammatoryagents, but his condition did not improve. Tests on CSF and blood failed to identify aninfectious agent. On examination by a pathologist, a brain biopsy revealed sections of anematode consistent with Baylisascaris species. Baylisascaris IFA tested strongly posi-tive with titers of 1:256 in CSF and 1:4,096 in serum specimens. The patient’s conditiondeteriorated and he had progressive, deep white matter abnormalities of the brain onMRI. After a 2-month hospitalization, he was transferred to a long-term–care facilitywhere he remained comatose until he died a year later.
The patient had resided in a group home for developmentally handicapped adoles-cents and adults in Los Angeles County. In February 2000, a field study conducted in theyard in which the patient regularly played revealed several sites containing raccoonfeces; a sample of sandbox soil was positive for BP eggs. Multiple sites in the adjoiningyard, to which he also had access, contained raccoon feces with BP eggs.Reported by: KR Kazacos, DVM, Purdue Univ, West Lafayette, Indiana. PJ Gavin, MD,ST Shulman, MD, TQ Tan, MD, Children’s Memorial Hospital and Northwestern Univ MedicalSchool; SI Gerber, MD, Chicago Dept of Public Health, Illinois. WA Kennedy, MD, Harbor-UCLAMedical Center, Torrance; WJ Murray, DVM, San José State Univ, San José; L Mascola, MD, LosAngeles County Dept of Health Svcs, California. Div of Applied Public Health Training, Epide-miology Program Office; Div of Parasitic Diseases, National Center for Infectious Diseases;and EIS officers, CDC.
Editorial Note: Including the two cases in this report, at least 12 cases of severe or fatalBP encephalitis have been identified since 1981 in the United States (California, Illinois,Michigan, Minnesota, New York, Oregon, and Pennsylvania) (2–8 ). Ten of the 12 casesoccurred in children aged 9 months–6 years; eight of the children were aged <19 months.Cases of BP ocular larva migrans also have been identified (2,9 ).
Raccoons infected with BP inhabit most of the United States; the highest prevalenceof BP infection in raccoons (68%–82%) occurs in the Midwest, Northeast, and on the Westcoast (1,2 ). Infected raccoons commonly shed millions of BP eggs daily in their feces, andthe eggs usually embryonate to the infective stage in 2–4 weeks. The eggs are resistantto most environmental conditions and with adequate moisture can survive for years.
Humans become infected by ingesting infective eggs; from the gastrointestinal tract,the larvae migrate to various somatic tissues, viscera, the eyes, and the central nervoussystem (CNS). The severity of neurologic disease in humans varies depending on thenumber of eggs ingested and the number of larvae migrating in the CNS (1,2 ). Larvae inthe CNS cause inflammatory reactions and tissue damage and can become encapsu-lated within granulomas.

Vol. 50 / Nos. 51 & 52 MMWR 1155
Raccoon Roundworm Encephalitis — Continued
A diagnosis of BP encephalitis should be considered in persons, especially children,with sudden onset of eosinophilic encephalitis and a history of potential exposure (e.g.,possible ingestion of raccoon feces or contaminated soil). Diagnostic findings includeCSF eosinophilic pleocytosis, peripheral eosinophilia, deep white matter abnormalitieson MRI, and positive titers on serologic testing of CSF and serum. Because CNS damagecan occur before symptom onset, treatment of symptomatic patients with antihelminthicor antiinflammatory drugs often will not improve outcome. Antihelminthic treatment(albendazole, 25–50 mg/kg/d for 10 days) started in 1–3 days of possible infection mightprevent clinical disease by killing larvae before they enter the CNS (2 ). Immediate treat-ment is recommended in cases of probable infection.
The risk for BP infection is greatly reduced by avoiding direct contact with raccoonsand their urban habitats, by removing access to food and potential denning sites, and bylimiting exposure to areas and materials that might be contaminated by raccoon feces.Raccoons typically defecate at the base of or in raised forks of trees or on raised horizon-tal surfaces such as fallen logs, stumps, or large rocks. Raccoon feces also can be foundon woodpiles, decks, rooftops, and in attics, garages, and haylofts. Feces usually are darkand tubular, have a pungent odor, and often contain undigested food items.
To eliminate BP eggs, feces and contaminated material should be removed carefullyand burned, buried, or sent to a landfill, and care should be taken to avoid contaminationof hands and clothes. Decks, patios, and other surfaces can be treated with boiling water.Newly deposited eggs take at least 2–4 weeks to become infective; therefore, promptremoval and destruction of raccoon feces will reduce risk for exposure and infection.Additional information about raccoon roundworm is available at http://www.cdc.gov/ncidod/dpd/parasites/baylisacaris/default.htm.References1. Kazacos KR, Boyce WM. Baylisascaris larva migrans. J Am Vet Med Assoc 1989;195:894–
903.2. Kazacos KR. Baylisascaris procyonis and related species. In: Samuel WM, Pybus MJ, Kocan
AA, eds. Parasitic diseases of wild mammals. 2nd ed. Ames, Iowa: Iowa State Univ Press,2001:301–41.
3. Huff DS, Neafie RC, Binder MJ, et al. The first fatal Baylisascaris infection in humans: aninfant with eosinophilic meningoencephalitis. Pediatr Pathol 1984;2:345–52.
4. Fox AS, Kazacos KR, Gould NS, et al. Fatal eosinophilic meningoencephalitis and viscerallarva migrans caused by the raccoon ascarid Baylisascaris procyonis . N Engl J Med1985;312:1619–23.
5. Cunningham CK, Kazacos KR, McMillan JA, et al. Diagnosis and management of Baylisascarisprocyonis infection in an infant with nonfatal meningoencephalitis. Clin Infect Dis1994;18:868–72.
6. Park SY, Glaser C, Murray WJ, et al. Raccoon roundworm (Baylisascaris procyonis )encephalitis: case report and field investigation. Pediatrics 2000;106:e56. Available at http://www.pediatrics.org/cgi/content/full/106/4/e56. Accessed December 2001.
7. Rowley HA, Uht RM, Kazacos KR, et al. Radiologic-pathologic findings in raccoon round-worm (Baylisascaris procyonis ) encephalitis. Am J Neuroradiol 2000;21:415–20.
8. Moertel CL, Kazacos KR, Butterfield JH, et al. Eosinophil-associated inflammation andelaboration of eosinophil-derived proteins in 2 children with raccoon roundworm(Baylisascaris procyonis ) encephalitis. Pediatrics 2001;108:e93. Available at http://www.pediatrics.org/cgi/content/full/108/5/e93. Accessed December 2001.
9. Goldberg MA, Kazacos KR, Boyce WM, et al. Diffuse unilateral subacute neuroretinitis:morphometric, serologic, and epidemiologic support for Baylisascaris as a causative agent.Ophthalmology 1993;100:1695–701.

1156 MMWR January 4, 2002
Multidrug-Resistant Streptococcus pneumoniae in a Child Care Center —Southwest Georgia, December 2000
On December 18, 2000, public health officials in southwest Georgia contacted theGeorgia Division of Public Health (GDPH) about a child aged 11 months hospitalized forrefractory otitis media. Eight days before hospitalization, a culture of drainage obtainedfrom the child’s middle ear revealed Streptococcus pneumoniae resistant to penicillin,clindamycin, erythromycin, trimethoprim/sulfamethoxazole, and tetracycline (indexstrain). The child attended a local child care center. GDPH and CDC conducted an inves-tigation to determine the rate of pneumococcal carriage among attendees of the childcare center, to identify risk factors for carriage of the index strain, and to characterizeparental knowledge and use of antibiotics and of pneumococcal conjugate vaccine (PCV7)(Prevnar™, Wyeth Lederle Vaccine, Philadelphia, Pennsylvania). GDPH met with parentsand physicians of children attending the child care center to discuss the results of theinvestigation and the importance of vaccination with PCV7. This report summarizes theresults of the investigation, which suggest that person-to-person transmission of theindex strain had occurred at the child care center and indicate that most parents hadbeen unaware of the dangers of frequent antibiotic use and of the availability of PCV7. Amultifaceted intervention targeting parents and health-care providers might improveprescribing practices and vaccination in this community.
The child care center is located in a rural county (1999 population: 6,318) in southwestGeorgia and serves approximately 54 children (median age: 26.4 months; age range: 9months–10 years). The children are divided into two groups on the basis of age (<18months and >18 months) and the two groups have separate rooms. After obtaininginformed consent from parents of children attending the child care center, nasopharyn-geal (NP) swabs were collected, inoculated into skim milk, tryptone, glucose, and glycerolmedium (STGG), and sent to CDC for serotyping and susceptibility testing. A case ofindex-strain carriage was defined as occurrence of S. pneumoniae with a susceptibilityprofile identical to the index-strain profile in a culture from an NP swab of a child whoattended the child care center. Parents of children from whom NP swabs were obtainedcompleted a knowledge, attitudes, and practices (KAP) questionnaire. A cross-sectionalsurvey was performed to assess risk factors for pneumococcal carriage.
NP swabs were obtained from five of the 12 children who had shared a room at thechild care center with the child who was hospitalized; NP swabs also were obtained from17 of the 42 children from the other room. One swab was lost during processing.S. pneumoniae was isolated from 19 (90%) of the 21 NP cultures; of these 19, a total of 10(53%) were serotype 14 and had susceptibility profiles that were identical to the indexstrain. Of the 19 isolates, 15 (79%) were penicillin nonsusceptible (i.e., intermediate orhigh-level resistance [minimum inhibitory concentration >0.12 µg/ml]), and 15 (79%)were resistant to more than one antibiotic or class of antibiotic. Five pneumococcalserotypes were identified: serotype 14 (10), 19F (five), 6B (two), 35B (one), and 33F (one).Of the 19 isolates, 17 were serotypes included in PCV7 (14, 19F, 6B, 4, 9V, 23F, and 18C).Four (40%) of the 10 children with index-strain carriage had shared a room at the childcare center with the hospitalized child (index patient).
Sixteen parents completed the questionnaire with one parent responding for eachchild, accounting for 20 (91%) of the 22 children from whom swabs were obtained. The 10children carrying the index strain were younger than 10 children not carrying the indexstrain (mean: aged 19 months versus 30 months; p=0.03). Of 20 children in the child care

Vol. 50 / Nos. 51 & 52 MMWR 1157
Multidrug-Resistant Streptococcus pneumoniae — Continued
center, 14 (82%) had an illness for which they received antibiotic treatment during the 2months preceding the questionnaire. No association was identified between carrying theindex strain and having received antibiotics during the preceding 2 months.
Of 16 parents, five (31%) were unaware of the health dangers of frequent antibioticuse, and 10 (63%) were unaware of the availability of PCV7. Among the parents of theseven children aware of the availability of PCV7, three had heard about it from theirhealth-care provider, two from their health department, and two from electronic media(e.g., television and radio).
Because of the high carriage rate of pneumococcus among attendees of the childcare center (90%), GDPH recommended that children aged <5 years attending the childcare center be vaccinated with PCV7 (1 ). In March 2001, GDPH met with parents andphysicians of children attending the child care center to discuss the investigation and theimportance of judicious antibiotic use. In addition, treatment guidelines for acute otitismedia (AOM) were reviewed with health-care providers, and appropriate therapy forviral infections was reviewed with parents.Reported by: A Addison, MSN, L Addison, Miller County Health Dept, Colquitt; H Perry, MT,J Jenkins, MPH, Georgia Health District 8-2; S Lance-Parker, DVM, K Arnold, MD, S Kramer,MPH, Notifiable Disease Epidemiology Section, P Blake, MD, State Epidemiologist, GeorgiaDiv of Public Health. Respiratory Disease Br, Div of Bacterial and Mycotic Diseases, NationalCenter for Infectious Diseases; and EIS officers, CDC.
Editorial Note: S. pneumoniae is a leading cause of community-acquired respiratoryinfection. Asymptomatic nasopharyngeal carriage of pneumococcus is intermittent.Cross-sectional studies suggest that pneumococcus can be found among 15% of adults;in child care settings, up to 65% of children are colonized (2 ). Although pneumococcalcarriage can lead to invasive disease (e.g., meningitis or bacteremia), AOM is the mostcommon clinical manifestation of pneumococcal infection among children and the mostcommon outpatient diagnosis resulting in antibiotic prescriptions among children (1 ).Pneumococcal resistance to penicillin and other antibiotics has increased since 1995 (3 ).
In the United States, recent antibiotic use, child care center attendance, and beingwhite are risk factors for carriage of and infection with drug-resistant pneumococcusamong children (4,5 ). Of the 21 children from whom NP swabs were collected for culture,90% were carrying pneumococcus, and approximately half of the isolates were serotype14 with the same susceptibility pattern as the index strain. The similarity of the 10 iso-lates obtained from this child care center suggests person-to-person transmission.
PCV7 offers protection against the seven serotypes that most commonly cause inva-sive disease in children in the United States (1 ). Licensed for use in February 2000, PCV7is effective in children aged <2 years. Although the efficacy of PCV7 against all AOMepisodes is 6%, efficacies against PCV7 serotype-related pneumococcal AOM and inva-sive pneumococcal disease are 57% and 94%, respectively (6,7 ). Of the pneumococcalisolates carried by children in the child care center, 90% belonged to PCV7-related sero-types. PCV7 became readily available to the community in February 2001, 2 monthsafter the investigation.
The findings in this report are subject to at least two limitations. First, because of thewinter holidays, some children who ordinarily attended the child care center were notavailable for NP culturing. Second, the small sample size limited the ability to draw otherconclusions (e.g., an association between recent antibiotic use and drug-resistant pneu-mococcal carriage).

1158 MMWR January 4, 2002
Multidrug-Resistant Streptococcus pneumoniae — Continued
In addition to groups who are recommended to receive PCV7 routinely, the AdvisoryCommittee on Immunization Practices recommends that health-care providers considerPCV7 for children aged 24–59 months who attend group child care centers (1 ). Health-care and child care providers and local health departments should inform parents aboutthe availability of PCV7. Interim recommendations have been published about PCV7 useduring the current temporary shortage (8 ). To ensure that vaccine reaches children athighest risk, only children aged <2 years and aged >2 years with high-risk medical condi-tions should receive vaccine until the shortage is resolved.
In the United States, children aged 0–4 years receive approximately half of all out-patient antibiotic prescriptions, and 30% of all antibiotic prescriptions are used to treatpresumptive AOM in this age group (9 ). Substantial decreases in overall antibiotic expo-sure could be achieved through the use of criteria for the diagnosis and treatment ofupper respiratory infection, including AOM (10 ). The results of the KAP survey suggestthat parents might benefit from improved communication with their health-care provid-ers about appropriate use of antibiotics.
CDC is tracking potential pneumococcal conjugate vaccine failures among childrenaged <5 years who have had invasive pneumococcal infections (e.g., meningitis or bac-teremia) following 1 or more doses of PCV7, and for whom pneumococcal isolates andreliable vaccination information are available. The pneumococcal conjugate vaccine fail-ure report form and instructions on completing the form and sending pneumococcalisolates to CDC are available at http://www.cdc.gov/nip/diseases/pneumo/PCV-survrpts/default.htm.
Information about practices that might prevent person-to-person transmission in childcare settings, such as hand washing and group separation of children, is available athttp://www.cdc.gov/ncidod/hip/abc/abc.htm. Additional resources are available at http://www.cdc.gov/antibioticresistance.References
1. CDC. Preventing pneumococcal disease among infants and young children: recommenda-tions of the Advisory Committee on Immunization Practices (ACIP). MMWR 2000;49(no. RR-9).
2. Craig AS, Erwin PC, Schaffner W, et al. Carriage of multidrug-resistant Streptococcuspneumoniae and impact of chemoprophylaxis during an outbreak of meningitis at a daycare center. Clin Infect Dis 1999;29:1257–64.
3. Whitney CG, Farley MM, Hadler J, et al. Increasing prevalence of multidrug-resistantStreptococcus pneumoniae in the United States. N Engl J Med 2000;343:1917–24.
4. Levine O, Farley M, Harrison L, Lefkowitz L, McGeer A, Schwartz B. Risk factors for inva-sive pneumococcal disease in children: a population-based case-control study in NorthAmerica. Pediatr 1999;103:28.
5. Arnold KE, Leggiadro RJ, Breiman RF, et al. Risk factors for carriage of drug-resistantStreptococcus pneumoniae among children in Memphis, Tennessee. J Pediatr1996;128:757–64.
6. Eskola J, Kilpi T, Palmu A, et al. Efficacy of a pneumococcal conjugate vaccine againstacute otitis media. N Engl J Med 2001;344:403–9.
7. Black S, Shinefield H, Fireman B, et al. Efficacy, safety, and immunogenicity of heptavalentpneumococcal conjugate vaccine in children. Pediatr Infect Dis J 2000;19:187–95.
8. CDC. Updated recommendations on the use of pneumococcal conjugate vaccine in asetting of vaccine shortage—Advisory Committee on Immunization Practices. MMWR2001;50:1140–2.
9. Nyquist AC, Gonzales R, Steiner JF, Sande MA. Antibiotic prescribing for children withcolds, upper respiratory tract infections, and bronchitis. JAMA 1998;279:875–7.
10. Dowell S, Marcy S, Phillips W, Gerber M, Schwartz B. Principles of judicious use ofantimicrobial agents for pediatric upper respiratory tract infections. Pediatr 1998;101:163–5.

Vol. 50 / Nos. 51 & 52 MMWR 1159
*Children traveling to countries where the risk for diphtheria is high should be vaccinatedaccording to the Recommended Childhood Immunization Schedule (3 ). Travelers might beat increased risk for exposure to toxigenic strains of Corynebacterium diphtheriae, especiallywith prolonged travel, extensive contact with children, or exposure to poor hygiene. High-risk countries include Africa—Algeria, Egypt, and sub-Saharan Africa; Americas—Brazil,Dominican Republic, Ecuador, and Haiti; Asia/Oceania—Afghanistan, Bangladesh, Cambodia,China, India, Indonesia, Iran, Iraq, Laos, Mongolia, Myanmar, Nepal, Pakistan, Philippines,Syria, Thailand, Turkey, Vietnam, and Yemen; and Europe—Albania and all countries of theformer Soviet Union.
Notice to Readers
Update: Supply of Diphtheria and Tetanus Toxoidsand Acellular Pertussis Vaccine
Diphtheria and tetanus toxoids and acellular pertussis vaccine (DTaP) remains inshort supply, and the shortage will continue into mid-2002 (1 ). Shortages are greatest inthe public sector. Despite high vaccination rates, pertussis continues to cause seriousillness and death, particularly among infants aged <6 months who are too young to havecompleted the 3-dose primary series of DTaP. In 2000, a total of 1,873 pertussis cases(rate: 99 per 100,000 infants aged <6 months) and 16 deaths werereported among infants aged <6 months. Vaccinating infants on time with the 3-doseprimary series of DTaP to protect them from serious disease remains a priority duringthis vaccine shortage.
The shortage began in 2000 when two manufacturers (Wyeth Lederle, Pearl River,New York, and Baxter Hyland Immuno Vaccines, Baltimore, Maryland) stopped produc-tion of DTaP (1 ). Aventis Pasteur (Swiftwater, Pennsylvania) and GlaxoSmithKline (Phila-delphia, Pennsylvania), producers of Tripedia® and Infanrix™, respectively, are the onlytwo U.S. suppliers.
DTaP is recommended as a 5-dose series: 3 doses administered to infants at ages 2,4, and 6 months, followed by 2 additional doses at age 15–18 months and at age 4–6years (2 ). During the shortage of DTaP, the Advisory Committee on Immunization Prac-tices recommends that providers who do not have enough DTaP to vaccinate all childrenwith 5 doses give priority to vaccinating infants with the first 3 doses. To ensure anadequate supply of DTaP to vaccinate infants, providers should first defer vaccination ofchildren aged 15–18 months with the fourth DTaP dose. If deferring the fourth dose doesnot leave enough DTaP to vaccinate infants, then the fifth DTaP dose (given to childrenaged 4–6 years) also should be deferred*. In areas with severe DTaP shortages, localpublic health officials might elect to recommend communitywide deferral of the fourthDTaP dose, and, if necessary, the fifth DTaP dose.
When the DTaP shortage ends, providers should recall and administer DTaP to allchildren who missed a dose. Vaccination of children aged 4–6 years is needed to ensureimmunity to pertussis, diphtheria, and tetanus during the elementary school years (2 ).References1. CDC. Update on the supply of tetanus and diphtheria toxoids and of tetanus and diphthe-
ria toxoids and acellular pertussis vaccine. MMWR 2001;50:189–90.2. CDC. Pertussis vaccination: use of acellular pertussis vaccine among infants and young
children—recommendations of the Advisory Committee on Immunization Practices. MMWR1997;46(no. RR-7).
3. CDC. Recommended childhood immunization schedule—United States, 2001. MMWR2001;50:7–10,19.

1160 MMWR January 4, 2002
Notices to Readers — Continued
Notice to Readers
Epi Info 2000: A Course for Teachers of Epidemiologic Computing
CDC and Emory University’s Rollins School of Public Health will co-sponsor a course,“Epi Info 2000: A Course for Teachers of Epidemiologic Computing” during March 11–14,2002, at Emory University. The course is designed for teachers of epidemiologic comput-ing with intermediate to advanced skills in computing.
The 4-day course provides hands-on experience with the new Windows® version ofEpi Info, programming Epi Info software at the intermediate to advanced level, methodsof teaching epidemiologic computing, computerized interactive exercises for teachingepidemiology, and computing. There is a tuition charge.
Application deadline is February 1. Additional information and applications are avail-able at http://www.sph.emory.edu/EPICOURSES or by e-mail: [email protected].

Vol. 50 / Nos. 51 & 52 MMWR 1161
FIGURE I. Selected notifiable disease reports, United States, comparison ofprovisional 4-week totals ending December 22, 2001, with historical data
* No measles or rubella cases were reported for the current 4-week period yielding a ratio forweek 51 of zero (0).
† Ratio of current 4-week total to mean of 15 4-week totals (from previous, comparable, andsubsequent 4-week periods for the past 5 years). The point where the hatched area beginsis based on the mean and two standard deviations of these 4-week totals.
DISEASE DECREASE INCREASECASES CURRENT
4 WEEKS
Ratio (Log Scale)†
Beyond Historical Limits
4210.50.250.03125
694
346
86
82
0
116
20
573
0
Hepatitis A
Hepatitis B
Hepatitis C; Non-A, Non-B
Legionellosis
Measles, Total
Mumps
Pertussis
Rubella
Meningococcal Infections
0.0625 0.125
*
*
TABLE I. Summary of provisional cases of selected notifiable diseases,United States, cumulative, week ending December 22, 2001 (51st Week)*
-:No reported cases. *Incidence data for reporting year 2001 are provisional and cumulative (year-to-date). † Not notifiable in all states. § Updated monthly from reports to the Division of HIV/AIDS Prevention — Surveillance and Epidemiology, National Center for HIV,
STD, and TB Prevention (NCHSTP). Last updated November 27, 2001. ¶ Updated from reports to the Division of STD Prevention, NCHSTP.
Cum. 2001 Cum. 2001
Anthrax 15 Poliomyelitis, paralytic -Brucellosis† 91 Psittacosis† 27Cholera 4 Q fever† 22Cyclosporiasis† 127 Rabies, human 1Diphtheria 2 Rocky Mountain spotted fever (RMSF) 604Ehrlichiosis: human granulocytic (HGE)† 215 Rubella, congenital syndrome 2
human monocytic (HME)† 97 Streptococcal disease, invasive, group A 3,673Encephalitis: California serogroup viral† 103 Streptococcal toxic-shock syndrome† 55
eastern equine† 8 Syphilis, congenital¶ 240St. Louis† 3 Tetanus 27western equine† - Toxic-shock syndrome 124
Hansen disease (leprosy)† 88 Trichinosis 25Hantavirus pulmonary syndrome† 6 Tularemia† 104Hemolytic uremic syndrome, postdiarrheal† 161 Typhoid fever 316HIV infection, pediatric†§ 200 Yellow fever -Plague 2

1162 MMWR January 4, 2002
TABLE II. Provisional cases of selected notifiable diseases, United States,weeks ending December 22, 2001, and December 23, 2000 (51st Week)*
N: Not notifiable. U: Unavailable. -: No reported cases. C.N.M.I.: Commonwealth of Northern Mariana Islands.* Incidence data for reporting year 2001 are provisional and cumulative (year-to-date). Incidence data for reporting year 2000 are finalized and
cumulative (year-to-date).† Individual cases can be reported through both the National Electronic Telecommunications System for Surveillance (NETSS) and the Public
Health Laboratory Information System (PHLIS).§ Chlamydia refers to genital infections caused by C. trachomatis.¶ Updated monthly from reports to the Division of HIV/AIDS Prevention — Surveillance and Epidemiology, National Center for HIV, STD, and
TB Prevention. Last updated November 27, 2001.
Cum. Cum. Cum. Cum. Cum. Cum. Cum. Cum. Cum. Cum.2001¶ 2000 2001 2000 2001 2000 2001 2000 2001 2000
AIDS Chlamydia§ Cryptosporidiosis NETSS PHLIS
Reporting Area
Escherichia coli O157:H7†
UNITED STATES 37,411 37,591 701,186 681,066 3,465 2,936 3,086 4,432 2,237 3,601
NEW ENGLAND 1,403 2,000 22,678 23,081 128 139 224 377 228 380Maine 44 40 1,299 1,440 18 20 27 31 27 29N.H. 37 30 1,327 1,103 17 24 36 39 31 38Vt. 15 38 622 520 34 28 14 37 10 37Mass. 704 1,188 9,855 9,982 51 37 115 166 112 174R.I. 95 91 2,831 2,577 8 4 17 20 11 18Conn. 508 613 6,744 7,459 - 26 15 84 37 84
MID. ATLANTIC 9,346 8,235 82,142 65,055 299 383 252 435 181 346Upstate N.Y. 945 676 15,204 3,746 111 130 160 295 136 82N.Y. City 5,253 4,090 28,464 25,737 107 170 14 23 11 18N.J. 1,607 1,799 12,901 10,443 26 19 78 117 34 117Pa. 1,541 1,670 25,573 25,129 55 64 N N - 129
E.N. CENTRAL 2,812 3,468 115,711 117,921 1,484 953 790 1,085 505 752Ohio 538 578 24,318 30,864 187 259 230 271 155 225Ind. 343 347 14,805 13,336 81 59 85 125 43 88Ill. 1,255 1,695 32,354 32,560 433 122 161 193 135 157Mich. 500 648 29,637 25,112 179 95 100 141 82 104Wis. 176 200 14,597 16,049 604 418 214 355 90 178
W.N. CENTRAL 808 861 35,248 38,707 518 351 562 665 457 624Minn. 133 160 7,049 8,008 185 123 274 205 212 231Iowa 85 83 4,611 5,262 81 76 79 180 62 148Mo. 405 413 12,882 13,155 45 31 61 110 94 98N. Dak. 2 3 874 875 13 16 18 21 34 21S. Dak. 23 7 1,751 1,818 8 15 43 56 41 59Nebr. 68 68 2,220 3,681 182 81 60 63 - 49Kans. 92 127 5,861 5,908 4 9 27 30 14 18
S. ATLANTIC 11,517 10,647 131,588 128,203 336 471 240 368 149 290Del. 231 220 2,511 2,811 6 6 4 3 7 1Md. 1,698 1,388 12,162 14,120 40 14 28 34 1 2D.C. 782 784 3,048 3,119 13 18 - 1 U UVa. 911 817 17,358 15,338 27 20 50 75 42 67W. Va. 95 58 2,257 2,105 2 3 10 15 8 13N.C. 845 673 19,799 21,405 31 28 57 90 43 73S.C. 645 761 10,506 9,740 7 - 23 21 11 16Ga. 1,528 1,120 28,739 27,257 132 170 33 41 15 39Fla. 4,782 4,826 35,208 32,308 78 212 35 88 22 79
E.S. CENTRAL 1,671 1,959 48,003 50,575 51 50 132 150 112 118Ky. 315 210 8,267 7,998 4 7 58 40 49 32Tenn. 540 838 14,976 14,846 16 11 46 61 48 55Ala. 415 482 13,824 15,209 18 16 18 10 6 9Miss. 401 429 10,936 12,522 13 16 10 39 9 22
W.S. CENTRAL 3,856 3,850 100,765 101,236 120 162 113 224 91 282Ark. 189 193 6,695 6,205 8 16 14 56 - 38La. 806 662 16,602 17,676 7 14 4 15 26 54Okla. 214 354 10,078 9,277 15 17 34 19 28 17Tex. 2,647 2,641 67,390 68,078 90 115 61 134 37 173
MOUNTAIN 1,288 1,355 41,204 36,888 239 174 288 423 171 305Mont. 15 16 1,849 1,438 37 10 20 31 - -Idaho 19 22 1,882 1,861 23 23 76 73 39 41Wyo. 4 10 818 779 7 5 7 21 1 11Colo. 267 326 10,391 9,157 43 72 88 156 54 110N. Mex. 137 140 5,767 5,170 29 22 16 22 11 18Ariz. 502 410 14,146 12,322 11 10 31 56 23 44Utah 110 148 1,870 2,187 83 28 32 49 42 71Nev. 234 283 4,481 3,974 6 4 18 15 1 10
PACIFIC 4,710 5,216 123,847 119,400 290 253 485 705 343 504Wash. 483 463 13,361 12,862 7 U 131 223 62 206Oreg. 213 170 7,300 6,939 53 20 82 134 61 114Calif. 3,898 4,445 96,885 93,625 226 233 249 302 211 167Alaska 18 23 2,605 2,469 1 - 4 32 1 6Hawaii 98 115 3,696 3,505 3 - 19 14 8 11
Guam 12 13 - 490 - - N N U UP.R. 1,113 1,298 2,404 U - - 1 7 U UV.I. 11 34 53 - - - - - U UAmer. Samoa 1 - U U U U U U U UC.N.M.I. - - 129 U - U - U U U

Vol. 50 / Nos. 51 & 52 MMWR 1163
TABLE II. (Cont’d) Provisional cases of selected notifiable diseases, United States,weeks ending December 22, 2001, and December 23, 2000 (51st Week)*
N: Not notifiable. U: Unavailable. - : No reported cases.* Incidence data for reporting year 2001 are provisional and cumulative (year-to-date). Incidence data for reporting year 2000 are finalized and
cumulative (year-to-date).
Reporting AreaCum. Cum. Cum. Cum. Cum. Cum. Cum. Cum. Cum.2001 2000 2001 2000 2001 2000 2001 2001 2000
Hepatitis C; LymeGonorrhea Non-A, Non-B Legionellosis Listeriosis Disease
UNITED STATES 321,763 348,858 3,199 3,073 1,065 1,059 529 13,208 16,840
NEW ENGLAND 6,517 6,498 32 33 73 56 45 3,911 5,495Maine 141 88 - 2 8 2 2 - -N.H. 180 108 - - 12 4 4 114 69Vt. 73 64 7 4 5 5 3 17 40Mass. 3,092 2,743 25 21 21 18 26 826 1,156R.I. 813 636 - 6 13 9 2 493 611Conn. 2,218 2,859 - - 14 18 8 2,461 3,619
MID. ATLANTIC 41,430 38,713 1,598 643 231 296 89 6,996 8,754Upstate N.Y. 8,776 7,277 58 39 70 95 29 3,607 3,906N.Y. City 12,183 11,468 - - 39 47 18 10 177N.J. 7,624 7,011 1,473 561 25 23 25 1,854 2,453Pa. 12,847 12,957 67 43 97 131 17 1,525 2,218
E.N. CENTRAL 60,482 70,218 160 226 312 279 75 677 770Ohio 13,607 19,032 9 12 149 116 17 113 60Ind. 6,732 6,246 1 - 25 37 8 23 23Ill. 18,074 20,392 14 21 19 33 16 22 35Mich. 16,714 17,667 136 193 83 50 24 17 23Wis. 5,355 6,881 - - 36 43 10 502 629
W.N. CENTRAL 15,060 17,592 747 617 49 58 21 400 425Minn. 2,285 3,129 12 7 9 7 3 332 322Iowa 1,224 1,264 - 2 8 15 2 36 33Mo. 7,905 8,671 715 594 23 26 10 26 46N. Dak. 40 71 - 1 1 - - - 2S. Dak. 278 275 - - 3 2 - - -Nebr. 713 1,495 8 4 4 4 1 4 5Kans. 2,615 2,687 12 9 1 4 5 2 17
S. ATLANTIC 80,950 90,371 112 112 202 190 75 941 1,125Del. 1,545 1,713 7 2 12 10 2 151 167Md. 6,904 9,654 17 14 37 68 16 550 661D.C. 2,727 2,634 - 3 8 7 - 17 11Va. 10,428 10,174 2 3 28 34 13 118 146W. Va. 701 635 9 20 N N 5 13 34N.C. 15,578 17,426 21 20 11 16 6 41 46S.C. 6,943 8,265 6 3 14 6 5 7 21Ga. 15,889 17,812 1 3 10 7 14 - -Fla. 20,235 22,058 49 44 82 42 14 44 39
E.S. CENTRAL 31,235 36,214 180 448 56 40 21 63 50Ky. 3,345 3,481 9 38 11 20 5 22 13Tenn. 9,863 11,702 66 100 30 12 9 30 28Ala. 10,829 11,944 5 10 13 5 7 10 6Miss. 7,198 9,087 100 300 2 3 - 1 3
W.S. CENTRAL 49,294 53,505 179 734 13 26 29 82 90Ark. 4,162 3,628 4 9 - - 1 1 5La. 11,428 13,113 90 451 2 7 - 2 8Okla. 4,587 4,191 4 10 3 5 2 - 1Tex. 29,117 32,573 81 264 8 14 26 79 76
MOUNTAIN 9,805 10,288 60 80 60 43 38 13 14Mont. 101 57 1 5 - 2 - - -Idaho 72 95 2 3 3 5 1 5 4Wyo. 78 51 9 2 1 - 2 1 3Colo. 2,914 3,107 13 17 19 15 10 1 -N. Mex. 969 1,144 12 16 3 1 7 1 -Ariz. 3,865 4,072 9 20 23 7 9 2 -Utah 142 231 3 1 7 12 2 1 3Nev. 1,664 1,531 11 16 4 1 7 2 4
PACIFIC 26,990 25,459 131 180 69 71 136 125 117Wash. 2,940 2,341 23 34 10 18 10 8 9Oreg. 1,124 1,020 13 26 N N 9 13 13Calif. 21,935 21,270 95 118 55 52 111 102 93Alaska 426 351 - - - - - 2 2Hawaii 565 477 - 2 4 1 6 N N
Guam - 54 - 3 - - - - -P.R. 578 513 1 1 2 1 - N NV.I. 6 - - - - - - - -Amer. Samoa U U U U U U - U UC.N.M.I. 14 U - U - U - - U
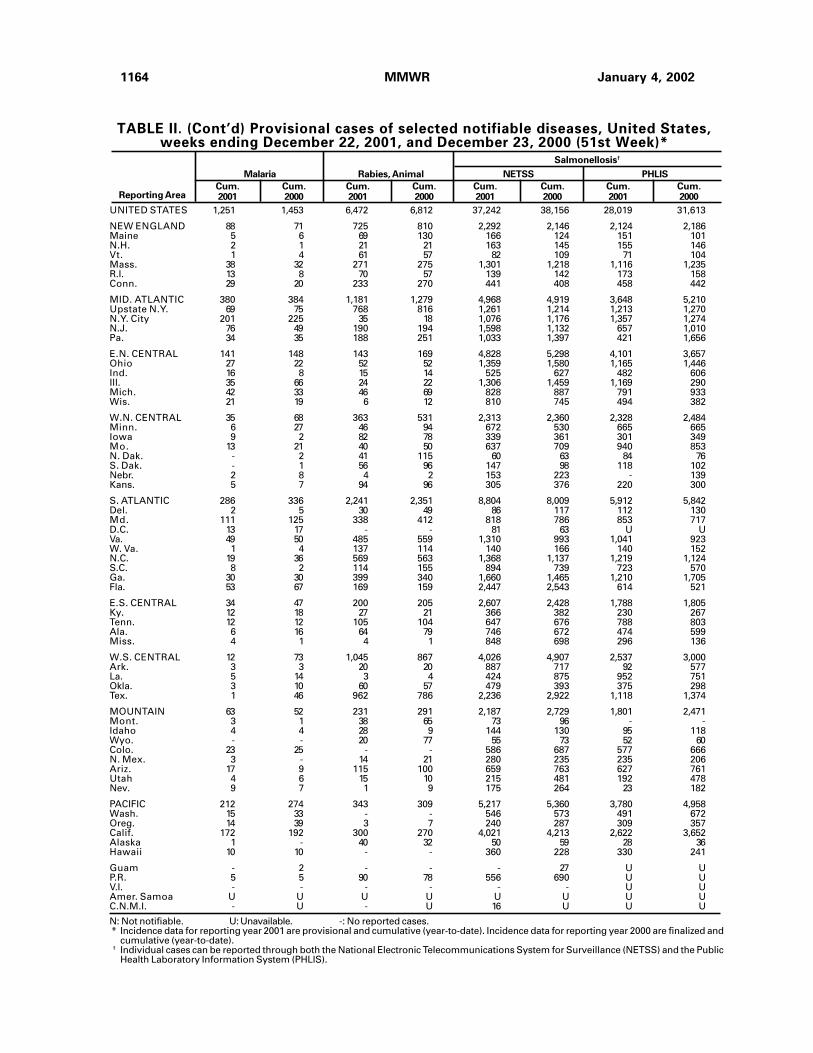
1164 MMWR January 4, 2002
N: Not notifiable. U: Unavailable. -: No reported cases.* Incidence data for reporting year 2001 are provisional and cumulative (year-to-date). Incidence data for reporting year 2000 are finalized and
cumulative (year-to-date).† Individual cases can be reported through both the National Electronic Telecommunications System for Surveillance (NETSS) and the Public
Health Laboratory Information System (PHLIS).
TABLE II. (Cont’d) Provisional cases of selected notifiable diseases, United States,weeks ending December 22, 2001, and December 23, 2000 (51st Week)*
Malaria Rabies, Animal NETSS PHLIS
Cum. Cum. Cum. Cum. Cum. Cum. Cum. Cum.2001 2000 2001 2000 2001 2000 2001 2000Reporting Area
Salmonellosis†
UNITED STATES 1,251 1,453 6,472 6,812 37,242 38,156 28,019 31,613
NEW ENGLAND 88 71 725 810 2,292 2,146 2,124 2,186Maine 5 6 69 130 166 124 151 101N.H. 2 1 21 21 163 145 155 146Vt. 1 4 61 57 82 109 71 104Mass. 38 32 271 275 1,301 1,218 1,116 1,235R.I. 13 8 70 57 139 142 173 158Conn. 29 20 233 270 441 408 458 442
MID. ATLANTIC 380 384 1,181 1,279 4,968 4,919 3,648 5,210Upstate N.Y. 69 75 768 816 1,261 1,214 1,213 1,270N.Y. City 201 225 35 18 1,076 1,176 1,357 1,274N.J. 76 49 190 194 1,598 1,132 657 1,010Pa. 34 35 188 251 1,033 1,397 421 1,656
E.N. CENTRAL 141 148 143 169 4,828 5,298 4,101 3,657Ohio 27 22 52 52 1,359 1,580 1,165 1,446Ind. 16 8 15 14 525 627 482 606Ill. 35 66 24 22 1,306 1,459 1,169 290Mich. 42 33 46 69 828 887 791 933Wis. 21 19 6 12 810 745 494 382
W.N. CENTRAL 35 68 363 531 2,313 2,360 2,328 2,484Minn. 6 27 46 94 672 530 665 665Iowa 9 2 82 78 339 361 301 349Mo. 13 21 40 50 637 709 940 853N. Dak. - 2 41 115 60 63 84 76S. Dak. - 1 56 96 147 98 118 102Nebr. 2 8 4 2 153 223 - 139Kans. 5 7 94 96 305 376 220 300
S. ATLANTIC 286 336 2,241 2,351 8,804 8,009 5,912 5,842Del. 2 5 30 49 86 117 112 130Md. 111 125 338 412 818 786 853 717D.C. 13 17 - - 81 63 U UVa. 49 50 485 559 1,310 993 1,041 923W. Va. 1 4 137 114 140 166 140 152N.C. 19 36 569 563 1,368 1,137 1,219 1,124S.C. 8 2 114 155 894 739 723 570Ga. 30 30 399 340 1,660 1,465 1,210 1,705Fla. 53 67 169 159 2,447 2,543 614 521
E.S. CENTRAL 34 47 200 205 2,607 2,428 1,788 1,805Ky. 12 18 27 21 366 382 230 267Tenn. 12 12 105 104 647 676 788 803Ala. 6 16 64 79 746 672 474 599Miss. 4 1 4 1 848 698 296 136
W.S. CENTRAL 12 73 1,045 867 4,026 4,907 2,537 3,000Ark. 3 3 20 20 887 717 92 577La. 5 14 3 4 424 875 952 751Okla. 3 10 60 57 479 393 375 298Tex. 1 46 962 786 2,236 2,922 1,118 1,374
MOUNTAIN 63 52 231 291 2,187 2,729 1,801 2,471Mont. 3 1 38 65 73 96 - -Idaho 4 4 28 9 144 130 95 118Wyo. - - 20 77 55 73 52 60Colo. 23 25 - - 586 687 577 666N. Mex. 3 - 14 21 280 235 235 206Ariz. 17 9 115 100 659 763 627 761Utah 4 6 15 10 215 481 192 478Nev. 9 7 1 9 175 264 23 182
PACIFIC 212 274 343 309 5,217 5,360 3,780 4,958Wash. 15 33 - - 546 573 491 672Oreg. 14 39 3 7 240 287 309 357Calif. 172 192 300 270 4,021 4,213 2,622 3,652Alaska 1 - 40 32 50 59 28 36Hawaii 10 10 - - 360 228 330 241
Guam - 2 - - - 27 U UP.R. 5 5 90 78 556 690 U UV.I. - - - - - - U UAmer. Samoa U U U U U U U UC.N.M.I. - U - U 16 U U U

Vol. 50 / Nos. 51 & 52 MMWR 1165
TABLE II. (Cont’d) Provisional cases of selected notifiable diseases, United States,weeks ending December 22, 2001, and December 23, 2000 (51st Week)*
N: Not notifiable. U: Unavailable. -: No reported cases.* Incidence data for reporting year 2001 are provisional and cumulative (year-to-date). Incidence data for reporting year 2000 are finalized and
cumulative (year-to-date).† Individual cases can be reported through both the National Electronic Telecommunications System for Surveillance (NETSS) and the Public
Health Laboratory Information System (PHLIS).
SyphilisNETSS PHLIS (Primary & Secondary) Tuberculosis
Cum. Cum. Cum. Cum. Cum. Cum. Cum. Cum.2001 2000 2001 2000 2001 2000 2001 2000Reporting Area
Shigellosis†
UNITED STATES 18,126 22,021 7,747 12,555 5,720 5,863 12,089 14,474
NEW ENGLAND 272 404 276 382 68 84 404 449Maine 6 11 3 11 1 1 3 23N.H. 7 7 4 8 1 2 17 21Vt. 7 4 6 - 3 - 4 4Mass. 199 282 185 262 43 61 240 265R.I. 23 33 26 34 9 4 39 32Conn. 30 67 52 67 11 16 101 104
MID. ATLANTIC 1,388 2,762 724 1,709 488 274 2,241 2,256Upstate N.Y. 474 786 113 212 28 12 347 323N.Y. City 352 935 362 627 269 116 1,124 1,184N.J. 366 502 184 431 142 70 486 541Pa. 196 539 65 439 49 76 284 208
E.N. CENTRAL 4,320 4,090 1,837 1,300 1,006 1,185 1,351 1,485Ohio 2,974 437 1,182 322 76 68 273 313Ind. 223 1,510 50 155 159 346 109 139Ill. 537 1,161 362 167 352 412 624 692Mich. 300 656 216 600 397 314 265 256Wis. 286 326 27 56 22 45 80 85
W.N. CENTRAL 1,960 2,453 1,267 2,039 85 64 444 515Minn. 452 795 440 908 28 16 226 167Iowa 364 535 290 348 4 11 34 36Mo. 305 660 218 463 22 29 135 192N. Dak. 22 51 35 51 - - 4 5S. Dak. 643 8 246 6 1 - 13 16Nebr. 98 151 - 117 5 2 32 23Kans. 76 253 38 146 25 6 - 76
S. ATLANTIC 2,751 2,945 841 1,156 1,897 1,956 2,554 2,899Del. 17 24 14 23 12 8 15 14Md. 159 198 91 114 249 304 228 246D.C. 53 80 U U 41 37 51 37Va. 599 447 268 349 105 126 256 265W. Va. 8 22 10 17 4 3 28 33N.C. 354 389 170 264 426 471 394 447S.C. 250 136 123 93 222 228 189 280Ga. 447 256 130 189 366 378 441 612Fla. 864 1,393 35 107 472 401 952 965
E.S. CENTRAL 1,565 1,187 608 577 646 860 792 912Ky. 716 518 327 117 45 85 111 120Tenn. 113 343 120 376 324 519 291 343Ala. 210 98 130 77 143 121 265 303Miss. 526 228 31 7 134 135 125 146
W.S. CENTRAL 2,391 3,472 1,146 1,148 739 817 800 2,110Ark. 537 219 155 61 45 103 150 173La. 149 290 166 194 168 208 - 310Okla. 108 124 36 44 66 116 138 142Tex. 1,597 2,839 789 849 460 390 512 1,485
MOUNTAIN 992 1,254 708 861 228 220 512 549Mont. 8 8 - - - - 14 17Idaho 40 44 15 25 1 1 8 10Wyo. 3 5 5 3 1 1 3 4Colo. 245 266 258 218 22 11 120 88N. Mex. 121 184 79 117 17 16 25 43Ariz. 444 546 290 348 171 185 240 246Utah 64 81 53 84 8 1 33 48Nev. 67 120 8 66 8 5 69 93
PACIFIC 2,487 3,454 340 3,383 563 403 2,991 3,299Wash. 213 455 167 408 54 66 224 247Oreg. 94 164 111 109 13 12 108 102Calif. 2,112 2,790 - 2,830 484 323 2,470 2,715Alaska 7 7 6 3 - - 50 102Hawaii 61 38 56 33 12 2 139 133
Guam - 45 U U - 3 - 51P.R. 9 35 U U 257 167 76 152V.I. - - U U - - - -Amer. Samoa U U U U U U U UC.N.M.I. 8 U U U 13 U 32 U

1166 MMWR January 4, 2002
N: Not notifiable. U: Unavailable. - : No reported cases.* Incidence data for reporting year 2001 are provisional and cumulative (year-to-date). Incidence data for reporting year 2000 are finalized and
cumulative (year-to-date).† For imported measles, cases include only those resulting from importation from other countries.§ Of 282 cases among children aged <5 years, serotype was reported for 132, and of those, 21 were type b.
TABLE III. Provisional cases of selected notifiable diseases preventableby vaccination, United States, weeks ending December 22, 2001,
and December 23, 2000 (51st Week)*
A B Indigenous Imported† Total
Cum. Cum. Cum. Cum. Cum. Cum. Cum. Cum. Cum. Cum.2001§ 2000 2001 2000 2001 2000 2001 2001 2001 2001 2001 2000Reporting Area
Hepatitis (Viral), By TypeH. influenzae,Invasive
UNITED STATES 1,383 1,264 10,432 12,797 6,565 6,961 - 61 - 47 108 80
NEW ENGLAND 93 110 661 389 95 117 - 4 - 1 5 6Maine 2 2 11 21 5 5 - - - - - -N.H. 7 12 18 19 16 19 - - - - - 3Vt. 5 10 16 10 4 6 - 1 - - 1 3Mass. 41 44 311 136 11 15 - 2 - 1 3 -R.I. 7 4 72 25 28 24 - - - - - -Conn. 31 38 233 178 31 48 - 1 - - 1 -
MID. ATLANTIC 231 230 1,185 1,498 1,163 1,135 - 5 - 11 16 24Upstate N.Y. 77 101 275 251 133 139 - 1 - 4 5 10N.Y. City 50 60 304 516 447 547 - 3 - 1 4 13N.J. 81 41 401 287 338 179 - - - 1 1 -Pa. 23 28 205 444 245 270 - 1 - 5 6 1
E.N. CENTRAL 227 177 1,199 1,649 897 740 - - - 10 10 8Ohio 74 54 261 264 93 105 - - - 3 3 2Ind. 51 30 102 117 48 49 - - - 4 4 -Ill. 63 59 445 683 152 124 - - - 3 3 3Mich. 13 11 322 486 604 420 - - - - - 3Wis. 26 23 69 99 - 42 U - U - - -
W.N. CENTRAL 72 78 404 646 213 298 - 4 - 1 5 3Minn. 46 43 42 173 31 42 - 2 - 1 3 1Iowa - - 36 66 21 34 - - - - - -Mo. 16 23 105 254 109 147 - 2 - - 2 -N. Dak. 7 4 3 4 2 2 - - - - - -S. Dak. - 1 3 3 1 2 - - - - - -Nebr. 2 3 35 37 28 44 U - U - - -Kans. 1 4 180 109 21 27 - - - - - 2
S. ATLANTIC 380 277 2,503 1,456 1,499 1,268 - 4 - 1 5 4Del. - - 15 15 11 15 - - - - - -Md. 92 78 317 207 141 123 - 2 - 1 3 -D.C. - - 73 35 13 34 - - - - - -Va. 28 39 135 154 181 165 - 1 - - 1 2W. Va. 16 8 27 56 25 25 U - U - - -N.C. 49 23 240 150 214 250 - - - - - -S.C. 9 7 75 86 30 23 - - - - - -Ga. 104 71 969 288 463 222 - 1 - - 1 -Fla. 82 51 652 465 421 411 - - - - - 2
E.S. CENTRAL 76 52 405 408 431 479 - 2 - - 2 -Ky. 2 12 127 61 45 80 - 2 - - 2 -Tenn. 44 24 169 148 244 220 - - - - - -Ala. 28 14 79 56 88 71 - - - - - -Miss. 2 2 30 143 54 108 U - U - - -
W.S. CENTRAL 52 63 1,310 2,395 670 1,074 - - - 1 1 1Ark. 2 2 67 132 98 96 U - U - - 1La. 6 16 61 106 48 152 U - U - - -Okla. 43 43 117 255 107 152 - - - - - -Tex. 1 2 1,065 1,902 417 674 - - - 1 1 -
MOUNTAIN 142 131 743 949 487 546 - 2 - - 2 12Mont. - 1 12 7 3 7 U - U - - -Idaho 2 4 57 43 11 10 - 1 - - 1 -Wyo. - 1 7 4 3 3 - - - - - -Colo. 38 33 89 221 103 106 - - - - - 2N. Mex. 27 26 37 70 131 139 - - - - - -Ariz. 56 49 410 457 161 201 - 1 - - 1 -Utah 8 11 69 62 27 28 U - U - - 3Nev. 11 6 62 85 48 52 - - - - - 7
PACIFIC 110 146 2,022 3,407 1,110 1,304 - 40 - 22 62 22Wash. 7 8 160 279 140 110 - 13 - 2 15 3Oreg. 22 33 78 170 117 119 - 4 - - 4 -Calif. 51 35 1,767 2,932 826 1,050 - 21 - 15 36 15Alaska 6 45 14 13 9 13 - - - - - 1Hawaii 24 25 3 13 18 12 - 2 - 5 7 3
Guam - 3 - 1 - 10 U - U - - -P.R. 1 4 132 247 188 290 U - U - - 2V.I. - - - - - - U - U - - -Amer. Samoa U U U U U U U U U U U UC.N.M.I. - U - U 35 U U - U - - U
Measles (Rubeola)

Vol. 50 / Nos. 51 & 52 MMWR 1167
TABLE III. (Cont’d) Provisional cases of selected notifiable diseases preventableby vaccination, United States, weeks ending December 22, 2001,
and December 23, 2000 (51st Week)*
N: Not notifiable. U: Unavailable. - : No reported cases.* Incidence data for reporting year 2001 are provisional and cumulative (year-to-date). Incidence data for reporting year 2000 are finalized and
cumulative (year-to-date).
MeningococcalDisease Mumps Pertussis Rubella
Cum. Cum. Cum. Cum. Cum. Cum. Cum. Cum.2001 2000 2001 2001 2000 2001 2001 2000 2001 2001 2000Reporting Area
UNITED STATES 2,226 2,125 7 226 316 241 5,177 7,122 - 20 166
NEW ENGLAND 114 119 - - 5 8 492 1,888 - - 12Maine 7 8 - - - - 21 45 - - -N.H. 14 12 - - - - 39 127 - - 2Vt. 7 4 - - - 8 76 253 - - -Mass. 55 68 - - 1 - 333 1,392 - - 8R.I. 6 9 - - 1 - 6 25 - - 1Conn. 25 18 - - 3 - 17 46 - - 1
MID. ATLANTIC 255 253 1 24 30 25 305 708 - 5 10Upstate N.Y. 64 75 1 4 12 9 148 345 - 1 1N.Y. City 42 45 - 12 8 - 49 90 - 3 9N.J. 93 53 - 4 3 - 22 36 - 1 -Pa. 56 80 - 4 7 16 86 237 - - -
E.N. CENTRAL 324 384 - 20 24 25 738 870 - 2 1Ohio 92 94 - 1 8 19 326 366 - - -Ind. 42 46 - 3 2 5 96 127 - - -Ill. 72 87 - 11 6 - 80 115 - 2 1Mich. 70 114 - 5 6 1 138 127 - - -Wis. 48 43 U - 2 U 98 135 U - -
W.N. CENTRAL 163 150 1 17 19 23 432 639 - 3 2Minn. 26 21 - 5 - 19 207 395 - - 1Iowa 31 35 - 1 8 3 76 59 - 1 -Mo. 55 67 - 4 5 - 102 97 - 1 -N. Dak. 6 2 - - 1 - 5 7 - - -S. Dak. 5 6 - - - 1 5 11 - - -Nebr. 25 7 U 1 2 U 7 28 U - 1Kans. 15 12 1 6 3 - 30 42 - 1 -
S. ATLANTIC 367 289 1 42 46 87 352 512 - 6 112Del. 5 1 - - - - - 9 - - 1Md. 41 27 - 7 9 2 45 130 - - -D.C. - - - - - - 1 3 - - -Va. 40 42 - 8 11 84 141 116 - - -W. Va. 14 14 U - - U 4 1 U - -N.C. 63 38 - 5 7 1 74 110 - - 82S.C. 35 26 - 7 11 - 34 40 - 2 27Ga. 52 46 - 7 2 - 27 40 - 1 -Fla. 117 95 1 8 6 - 26 63 - 3 2
E.S. CENTRAL 133 134 - 9 7 2 162 119 - - 6Ky. 23 26 - 3 1 - 59 60 - - 1Tenn. 60 57 - 1 2 2 62 35 - - 1Ala. 34 36 - - 4 - 37 20 - - 4Miss. 16 15 U 5 - U 4 4 U - -
W.S. CENTRAL 339 229 - 14 35 6 535 363 - 2 8Ark. 20 14 U 1 3 U 45 37 U - 1La. 66 45 U 2 5 U 3 21 U - 1Okla. 32 28 - - - 3 33 50 - - -Tex. 221 142 - 11 27 3 454 255 - 2 6
MOUNTAIN 96 102 1 15 22 60 1,400 828 - - 2Mont. 4 6 U 1 1 U 37 35 U - -Idaho 8 7 1 2 1 - 171 64 - - -Wyo. 5 2 - 2 1 - 1 4 - - -Colo. 36 34 - 3 1 16 336 474 - - 1N. Mex. 11 11 - 2 1 - 144 91 - - -Ariz. 16 30 - 1 4 44 595 112 - - 1Utah 8 7 U 1 7 U 76 33 U - -Nev. 8 5 - 3 6 - 40 15 - - -
PACIFIC 435 465 3 85 128 5 761 1,195 - 2 13Wash. 65 62 - 2 10 4 170 416 - - 7Oreg. 44 70 N N N 1 52 108 - - -Calif. 310 316 3 46 87 - 495 609 - 1 6Alaska 3 9 - 1 8 - 11 21 - - -Hawaii 13 8 - 36 23 - 33 41 - 1 -
Guam - - U - 16 U - 4 U - 1P.R. 5 10 U - - U 2 10 U - -V.I. - - U - - U - - U - -Amer. Samoa U U U U U U U U U U UC.N.M.I. - U U - U U - U U - U

1168 MMWR January 4, 2002
TABLE IV. Deaths in 122 U.S. cities,* week endingDecember 22, 2001 (51st Week)
U: Unavailable. -:No reported cases.* Mortality data in this table are reported voluntarily from 122 cities in the United States, most of which have populations of >100,000. A death
is reported by the place of its occurrence and by the week that the death certificate was filed. Fetal deaths are not included.† Pneumonia and influenza.§ Because of changes in reporting methods in this Pennsylvania city, these numbers are partial counts for the current week. Complete
counts will be available in 4 to 6 weeks.¶ Total includes unknown ages.
�65 45-64 25-44 1-24 <1Reporting Area
All Causes, By Age (Years)
AllAges
P&I†
Total������65 45-64 25-44 1-24 <1
Reporting Area
All Causes, By Age (Years)
AllAges
P&I†
Total
NEW ENGLAND 271 199 51 15 5 1 29Boston, Mass. U U U U U U UBridgeport, Conn. 31 20 8 1 2 - 3Cambridge, Mass. 19 17 1 1 - - 1Fall River, Mass. 23 20 2 1 - - 3Hartford, Conn. U U U U U U ULowell, Mass. 24 17 2 4 1 - 2Lynn, Mass. 5 4 1 - - - 1New Bedford, Mass. U U U U U U UNew Haven, Conn. 37 24 10 2 1 - 2Providence, R.I. U U U U U U USomerville, Mass. 7 6 1 - - - 1Springfield, Mass. 40 28 9 3 - - 3Waterbury, Conn. 14 11 2 - 1 - 2Worcester, Mass. 71 52 15 3 - 1 11
MID. ATLANTIC 2,221 1,504 438 203 42 32 102Albany, N.Y. 50 31 10 5 - 4 3Allentown, Pa. 19 18 - 1 - - 1Buffalo, N.Y. 67 42 17 4 2 2 7Camden, N.J. 26 12 9 2 2 1 4Elizabeth, N.J. 12 11 1 - - - -Erie, Pa.§ 44 38 3 2 1 - 1Jersey City, N.J. 31 19 11 - - 1 -New York City, N.Y. 1,201 813 255 97 23 11 40Newark, N.J. U U U U U U UPaterson, N.J. 19 9 5 3 - 2 1Philadelphia, Pa. 409 233 90 66 12 8 19Pittsburgh, Pa.§ 21 6 6 7 1 1 3Reading, Pa. 26 19 4 3 - - 1Rochester, N.Y. 123 102 15 5 - 1 9Schenectady, N.Y. 22 16 1 5 - - 1Scranton, Pa.§ 20 18 1 1 - - 1Syracuse, N.Y. 87 80 4 1 1 1 8Trenton, N.J. 22 17 4 1 - - 2Utica, N.Y. 22 20 2 - - - 1Yonkers, N.Y. U U U U U U U
E.N. CENTRAL 1,645 1,158 302 117 31 37 112Akron, Ohio 62 44 8 5 2 3 8Canton, Ohio 35 30 5 - - - 6Chicago, Ill. U U U U U U UCincinnati, Ohio 98 72 15 6 1 4 11Cleveland, Ohio 137 91 26 15 1 4 8Columbus, Ohio 198 139 30 20 4 5 5Dayton, Ohio 116 97 14 4 1 - 3Detroit, Mich. 220 128 57 21 7 7 19Evansville, Ind. 46 36 8 2 - - 3Fort Wayne, Ind. 57 42 9 3 2 1 -Gary, Ind. 15 10 2 2 1 - 1Grand Rapids, Mich. 55 38 10 4 1 2 10Indianapolis, Ind. 252 168 56 17 6 5 14Lansing, Mich. U U U U U U UMilwaukee, Wis. 86 63 14 4 1 4 8Peoria, Ill. 54 39 11 4 - - 5Rockford, Ill. 57 41 12 3 1 - 4South Bend, Ind. U U U U U U UToledo, Ohio 86 67 11 4 3 1 5Youngstown, Ohio 71 53 14 3 - 1 2
W.N. CENTRAL 802 569 135 53 29 16 56Des Moines, Iowa 81 63 12 5 1 - 10Duluth, Minn. 37 30 6 - 1 - 3Kansas City, Kans. 35 20 5 8 2 - -Kansas City, Mo. 93 65 13 8 4 3 7Lincoln, Nebr. 55 44 8 1 2 - 5Minneapolis, Minn. 119 86 20 6 6 1 7Omaha, Nebr. 76 59 12 3 1 1 6St. Louis, Mo. 123 73 28 9 6 7 -St. Paul, Minn. 97 74 12 5 3 3 12Wichita, Kans. 86 55 19 8 3 1 6
S. ATLANTIC 1,148 732 242 116 32 26 56Atlanta, Ga. 154 96 30 15 7 6 -Baltimore, Md. 223 126 61 26 7 3 21Charlotte, N.C. 65 45 12 4 3 1 3Jacksonville, Fla. U U U U U U UMiami, Fla. 167 112 28 17 2 8 10Norfolk, Va. 68 43 15 6 3 1 4Richmond, Va. 62 35 15 5 4 3 6Savannah, Ga. 67 50 11 5 - 1 5St. Petersburg, Fla. 60 45 9 6 - - -Tampa, Fla. 171 117 30 22 1 1 6Washington, D.C. 100 57 26 10 5 2 1Wilmington, Del. 11 6 5 - - - -
E.S. CENTRAL 789 528 170 59 22 10 49Birmingham, Ala. 155 107 34 8 2 4 9Chattanooga, Tenn. 59 43 7 3 3 3 1Knoxville, Tenn. 108 77 20 8 3 - 5Lexington, Ky. U U U U U U UMemphis, Tenn. 138 88 23 21 6 - 7Mobile, Ala. 77 53 19 3 2 - 2Montgomery, Ala. 53 32 13 6 2 - 1Nashville, Tenn. 199 128 54 10 4 3 24
W.S. CENTRAL 1,550 996 316 143 49 46 100Austin, Tex. 89 52 23 11 2 1 3Baton Rouge, La. 70 44 17 8 - 1 1Corpus Christi, Tex. 48 30 13 2 - 3 7Dallas, Tex. 230 137 56 21 8 8 18El Paso, Tex. 72 48 10 11 3 - 1Ft. Worth, Tex. 170 115 30 14 4 7 5Houston, Tex. 369 221 79 37 17 15 24Little Rock, Ark. 70 49 12 2 3 4 4New Orleans, La. U U U U U U USan Antonio, Tex. 214 147 40 19 5 3 20Shreveport, La. 46 33 6 3 3 1 6Tulsa, Okla. 172 120 30 15 4 3 11
MOUNTAIN 944 615 211 67 24 21 66Albuquerque, N.M. 130 82 33 11 3 1 10Boise, Idaho 51 36 9 4 - 1 4Colo. Springs, Colo. 64 46 12 1 2 3 3Denver, Colo. 102 69 23 4 1 5 6Las Vegas, Nev. 247 153 64 23 4 3 12Ogden, Utah 33 28 4 - 1 - 3Phoenix, Ariz. 154 87 35 15 7 5 12Pueblo, Colo. 39 33 6 - - - 2Salt Lake City, Utah 124 81 25 9 6 3 14Tucson, Ariz. U U U U U U U
PACIFIC 1,430 1,068 241 73 24 23 117Berkeley, Calif. 16 10 5 - - 1 1Fresno, Calif. 64 50 9 2 3 - 4Glendale, Calif. 1 1 - - - - -Honolulu, Hawaii 58 42 12 3 1 - 4Long Beach, Calif. 82 62 15 2 1 2 12Los Angeles, Calif. 121 81 19 12 4 5 6Pasadena, Calif. 20 19 1 - - - 8Portland, Oreg. 131 97 21 7 5 1 7Sacramento, Calif. 213 147 44 13 3 6 20San Diego, Calif. 164 137 19 5 - 3 11San Francisco, Calif. U U U U U U USan Jose, Calif. 231 174 35 15 4 3 25Santa Cruz, Calif. 45 41 4 - - - 2Seattle, Wash. 130 95 26 6 1 2 7Spokane, Wash. 55 38 12 4 1 - 4Tacoma, Wash. 99 74 19 4 1 - 6
TOTAL 10,800¶ 7,369 2,106 846 258 212 687
Vol. 50 / Nos. 51 & 52 MMWR 1169
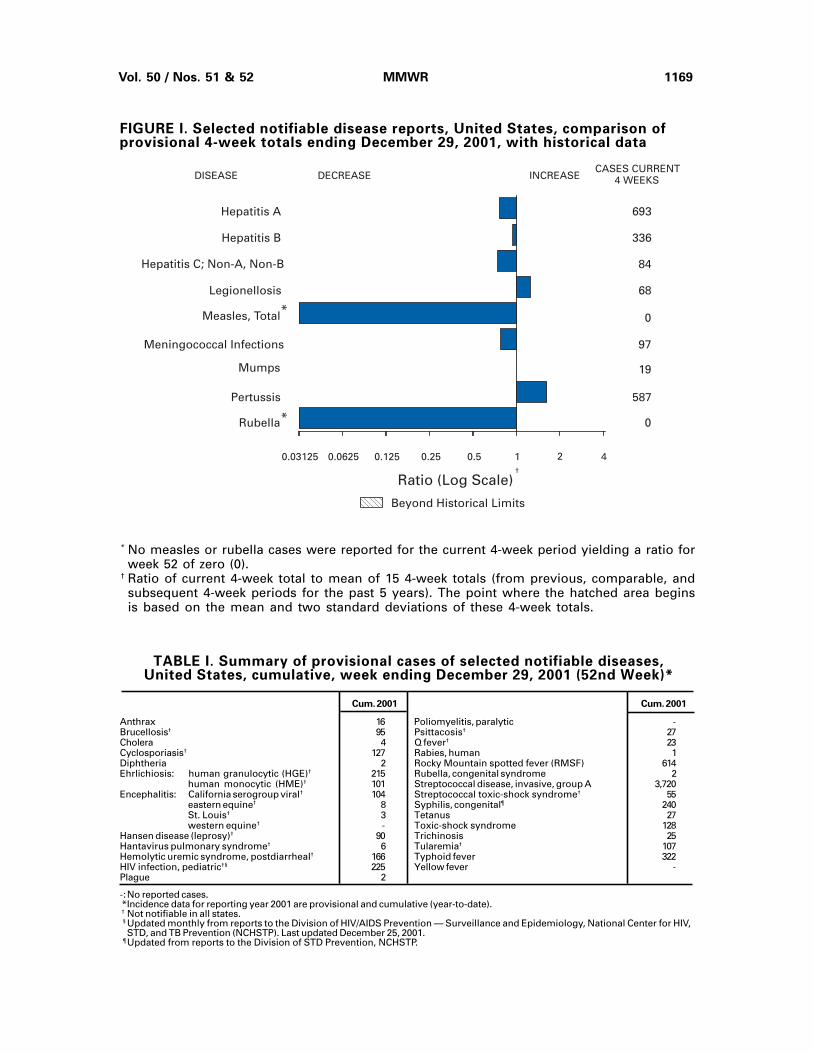
* No measles or rubella cases were reported for the current 4-week period yielding a ratio forweek 52 of zero (0).
† Ratio of current 4-week total to mean of 15 4-week totals (from previous, comparable, andsubsequent 4-week periods for the past 5 years). The point where the hatched area beginsis based on the mean and two standard deviations of these 4-week totals.
TABLE I. Summary of provisional cases of selected notifiable diseases,United States, cumulative, week ending December 29, 2001 (52nd Week)*
-:No reported cases. *Incidence data for reporting year 2001 are provisional and cumulative (year-to-date). † Not notifiable in all states. § Updated monthly from reports to the Division of HIV/AIDS Prevention — Surveillance and Epidemiology, National Center for HIV,
STD, and TB Prevention (NCHSTP). Last updated December 25, 2001. ¶ Updated from reports to the Division of STD Prevention, NCHSTP.
Cum. 2001 Cum. 2001
Anthrax 16 Poliomyelitis, paralytic -Brucellosis† 95 Psittacosis† 27Cholera 4 Q fever† 23Cyclosporiasis† 127 Rabies, human 1Diphtheria 2 Rocky Mountain spotted fever (RMSF) 614Ehrlichiosis: human granulocytic (HGE)† 215 Rubella, congenital syndrome 2
human monocytic (HME)† 101 Streptococcal disease, invasive, group A 3,720Encephalitis: California serogroup viral† 104 Streptococcal toxic-shock syndrome† 55
eastern equine† 8 Syphilis, congenital¶ 240St. Louis† 3 Tetanus 27western equine† - Toxic-shock syndrome 128
Hansen disease (leprosy)† 90 Trichinosis 25Hantavirus pulmonary syndrome† 6 Tularemia† 107Hemolytic uremic syndrome, postdiarrheal† 166 Typhoid fever 322HIV infection, pediatric†§ 225 Yellow fever -Plague 2
FIGURE I. Selected notifiable disease reports, United States, comparison ofprovisional 4-week totals ending December 29, 2001, with historical data
DISEASE DECREASE INCREASECASES CURRENT
4 WEEKS
Ratio (Log Scale)
Beyond Historical Limits
4210.50.250.03125
693
336
84
68
0
97
19
587
0
Hepatitis A
Hepatitis B
Hepatitis C; Non-A, Non-B
Legionellosis
Measles, Total
Mumps
Pertussis
Rubella
Meningococcal Infections
0.0625 0.125
*
*
†

1170 MMWR January 4, 2002
TABLE II. Provisional cases of selected notifiable diseases, United States,weeks ending December 29, 2001, and December 30, 2000 (52nd Week)*
N: Not notifiable. U: Unavailable. -: No reported cases. C.N.M.I.: Commonwealth of Northern Mariana Islands.* Incidence data for reporting year 2001 are provisional and cumulative (year-to-date). Incidence data for reporting year 2000 are finalized and
cumulative (year-to-date).† Individual cases can be reported through both the National Electronic Telecommunications System for Surveillance (NETSS) and the Public
Health Laboratory Information System (PHLIS).§ Chlamydia refers to genital infections caused by C. trachomatis.¶ Updated monthly from reports to the Division of HIV/AIDS Prevention — Surveillance and Epidemiology, National Center for HIV, STD, and
TB Prevention. Last updated December 25, 2001.
Cum. Cum. Cum. Cum. Cum. Cum. Cum. Cum. Cum. Cum.2001¶ 2000 2001 2000 2001 2000 2001 2000 2001 2000
AIDS Chlamydia§ Cryptosporidiosis NETSS PHLIS
Reporting Area
Escherichia coli O157:H7†
UNITED STATES 42,008 38,864 710,690 697,757 3,496 3,128 3,130 4,528 2,237 3,620
NEW ENGLAND 1,565 2,008 23,253 23,431 130 143 224 380 228 382Maine 48 40 1,334 1,474 19 20 27 32 27 29N.H. 40 30 1,353 1,130 17 25 36 40 31 39Vt. 25 38 633 526 34 28 14 37 10 37Mass. 765 1,188 10,068 10,065 51 37 115 167 112 175R.I. 103 99 2,875 2,632 9 4 17 20 11 18Conn. 584 613 6,990 7,604 - 29 15 84 37 84
MID. ATLANTIC 11,301 8,429 83,067 68,426 300 393 252 443 181 348Upstate N.Y. 1,584 703 15,409 5,316 112 139 160 303 136 82N.Y. City 6,115 4,165 29,065 26,170 107 171 14 23 11 18N.J. 1,761 1,891 13,020 10,814 26 19 78 117 34 119Pa. 1,841 1,670 25,573 26,126 55 64 N N - 129
E.N. CENTRAL 3,031 3,705 117,412 120,473 1,489 983 793 1,103 505 755Ohio 584 588 24,318 31,190 187 260 230 275 155 226Ind. 378 383 14,805 13,735 81 72 85 131 43 88Ill. 1,327 1,760 33,544 32,991 437 126 163 194 135 158Mich. 549 761 30,148 26,237 180 97 101 141 82 104Wis. 193 213 14,597 16,320 604 428 214 362 90 179
W.N. CENTRAL 892 936 35,861 40,126 521 422 566 683 457 624Minn. 157 185 7,286 8,102 185 190 278 212 212 231Iowa 90 93 4,611 5,987 81 77 79 180 62 148Mo. 445 452 13,085 13,448 46 31 61 111 94 98N. Dak. 3 3 874 908 15 18 18 23 34 21S. Dak. 25 8 1,751 1,834 8 15 43 56 41 59Nebr. 74 68 2,220 3,791 182 82 60 71 - 49Kans. 98 127 6,034 6,056 4 9 27 30 14 18
S. ATLANTIC 12,594 11,041 132,655 132,950 350 524 252 387 149 294Del. 248 220 2,793 2,856 6 9 4 3 7 1Md. 1,860 1,457 12,275 14,528 40 14 28 35 1 2D.C. 870 873 3,145 3,205 13 18 - 1 U UVa. 951 819 17,358 15,352 27 21 50 77 42 68W. Va. 100 61 2,318 2,135 2 3 10 15 8 13N.C. 947 673 19,907 22,175 31 28 58 93 43 75S.C. 729 789 10,506 9,950 7 - 23 21 11 16Ga. 1,750 1,238 28,739 29,359 132 191 33 44 15 40Fla. 5,139 4,911 35,614 33,390 92 240 46 98 22 79
E.S. CENTRAL 1,793 1,960 49,467 51,156 52 51 137 151 112 119Ky. 333 210 8,874 8,063 5 7 63 40 49 33Tenn. 602 839 15,391 15,073 16 12 46 62 48 55Ala. 438 482 14,155 15,323 18 16 18 10 6 9Miss. 420 429 11,047 12,697 13 16 10 39 9 22
W.S. CENTRAL 4,196 3,851 102,586 102,286 121 175 115 227 91 285Ark. 200 194 6,695 6,219 9 16 14 56 - 38La. 861 662 16,871 17,922 7 14 4 15 26 54Okla. 243 354 10,222 9,331 15 30 36 19 28 17Tex. 2,892 2,641 68,798 68,814 90 115 61 137 37 176
MOUNTAIN 1,387 1,389 41,626 37,271 242 182 296 424 171 306Mont. 15 16 1,855 1,469 37 10 20 31 - -Idaho 19 22 1,939 1,907 23 28 81 73 39 41Wyo. 5 11 840 807 7 5 7 21 1 11Colo. 288 326 10,526 9,161 44 72 89 156 54 110N. Mex. 143 140 5,767 5,204 29 25 17 22 11 18Ariz. 541 443 14,348 12,514 11 10 31 56 23 45Utah 124 148 1,870 2,190 85 28 33 50 42 71Nev. 252 283 4,481 4,019 6 4 18 15 1 10
PACIFIC 5,249 5,545 124,763 121,638 291 255 495 730 343 507Wash. 533 498 13,361 13,066 7 U 135 237 62 206Oreg. 259 207 7,457 7,107 54 20 84 134 61 115Calif. 4,315 4,702 97,460 95,349 226 235 251 313 211 169Alaska 18 23 2,645 2,569 1 - 4 32 1 6Hawaii 124 115 3,840 3,547 3 - 21 14 8 11
Guam 12 13 - 492 - - N N U UP.R. 1,242 1,346 2,404 U - - 1 7 U UV.I. 35 34 53 - - - - - U UAmer. Samoa 1 - U U U U U U U UC.N.M.I. - - 129 U - U - U U U

Vol. 50 / Nos. 51 & 52 MMWR 1171
TABLE II. (Cont’d) Provisional cases of selected notifiable diseases, United States,weeks ending December 29, 2001, and December 30, 2000 (52nd Week)*
N: Not notifiable. U: Unavailable. - : No reported cases.* Incidence data for reporting year 2001 are provisional and cumulative (year-to-date). Incidence data for reporting year 2000 are finalized and
cumulative (year-to-date).
Reporting AreaCum. Cum. Cum. Cum. Cum. Cum. Cum. Cum. Cum.2001 2000 2001 2000 2001 2000 2001 2001 2000
Hepatitis C; LymeGonorrhea Non-A, Non-B Legionellosis Listeriosis Disease
UNITED STATES 326,346 357,570 3,227 3,197 1,085 1,127 542 13,452 17,730
NEW ENGLAND 6,707 6,613 32 36 73 56 46 4,044 5,801Maine 141 90 - 2 8 2 2 - 71N.H. 180 110 - - 12 4 4 117 84Vt. 75 65 7 5 5 5 3 18 40Mass. 3,167 2,775 25 22 21 18 26 895 1,158R.I. 826 661 - 7 13 9 3 493 675Conn. 2,318 2,912 - - 14 18 8 2,521 3,773
MID. ATLANTIC 41,784 40,701 1,598 652 230 306 91 7,077 9,131Upstate N.Y. 8,888 8,442 58 46 69 100 30 3,688 4,152N.Y. City 12,404 11,672 - - 39 47 19 10 177N.J. 7,645 7,232 1,473 561 25 23 25 1,854 2,459Pa. 12,847 13,355 67 45 97 136 17 1,525 2,343
E.N. CENTRAL 61,508 71,565 162 235 312 292 75 677 773Ohio 13,607 19,303 9 12 149 121 17 113 61Ind. 6,732 6,417 1 - 25 41 8 23 23Ill. 18,735 20,671 15 21 19 33 16 22 35Mich. 17,079 18,182 137 202 83 53 24 17 23Wis. 5,355 6,992 - - 36 44 10 502 631
W.N. CENTRAL 15,360 18,114 755 637 49 69 21 401 570Minn. 2,372 3,160 13 15 9 16 3 333 465Iowa 1,224 1,392 - 2 8 15 2 36 34Mo. 8,062 8,883 722 605 23 26 10 26 47N. Dak. 40 73 - 1 1 1 - - 2S. Dak. 278 277 - - 3 2 - - -Nebr. 713 1,534 8 5 4 5 1 4 5Kans. 2,671 2,795 12 9 1 4 5 2 17
S. ATLANTIC 81,772 93,591 127 128 219 211 82 965 1,176Del. 1,733 1,735 7 2 12 10 2 151 167Md. 6,983 9,836 17 16 37 70 16 563 688D.C. 2,816 2,706 - 3 8 7 - 17 11Va. 10,428 10,175 2 3 28 37 15 119 149W. Va. 721 643 9 23 N N 5 13 35N.C. 15,823 17,937 22 20 11 16 6 41 47S.C. 6,943 8,383 6 3 14 7 5 7 25Ga. 15,889 19,395 1 4 10 10 14 - -Fla. 20,436 22,781 63 54 99 54 19 54 54
E.S. CENTRAL 31,955 36,659 182 466 57 45 21 64 50Ky. 3,584 3,502 10 40 12 22 5 23 13Tenn. 10,069 11,877 67 112 30 15 9 30 28Ala. 11,032 12,063 5 10 13 5 7 10 6Miss. 7,270 9,217 100 304 2 3 - 1 3
W.S. CENTRAL 50,083 54,056 179 755 13 27 29 82 93Ark. 4,162 3,642 4 12 - - 1 1 7La. 11,600 13,266 90 456 2 7 - 2 8Okla. 4,688 4,229 4 16 3 5 2 - 1Tex. 29,633 32,919 81 271 8 15 26 79 77
MOUNTAIN 10,017 10,365 61 97 60 47 38 13 16Mont. 101 60 1 5 - 2 - - -Idaho 74 98 2 3 3 5 1 5 4Wyo. 78 53 9 2 1 - 2 1 3Colo. 3,071 3,112 14 18 19 15 10 1 -N. Mex. 969 1,152 12 16 3 1 7 1 -Ariz. 3,918 4,106 9 22 23 11 9 2 2Utah 142 231 3 13 7 12 2 1 3Nev. 1,664 1,553 11 18 4 1 7 2 4
PACIFIC 27,160 25,906 131 191 72 74 139 129 120Wash. 2,940 2,418 23 44 10 19 11 9 9Oreg. 1,144 1,038 13 27 N N 9 14 13Calif. 22,065 21,606 95 118 58 54 113 104 96Alaska 434 361 - - - - - 2 2Hawaii 577 483 - 2 4 1 6 N N
Guam - 57 - 3 - - - - -P.R. 578 527 1 1 2 1 - N NV.I. 6 - - - - - - - -Amer. Samoa U U U U U U - U UC.N.M.I. 14 U - U - U - - U

1172 MMWR January 4, 2002
N: Not notifiable. U: Unavailable. -: No reported cases.* Incidence data for reporting year 2001 are provisional and cumulative (year-to-date). Incidence data for reporting year 2000 are finalized and
cumulative (year-to-date).† Individual cases can be reported through both the National Electronic Telecommunications System for Surveillance (NETSS) and the Public
Health Laboratory Information System (PHLIS).
TABLE II. (Cont’d) Provisional cases of selected notifiable diseases, United States,weeks ending December 29, 2001, and December 30, 2000 (52nd Week)*
Malaria Rabies, Animal NETSS PHLIS
Cum. Cum. Cum. Cum. Cum. Cum. Cum. Cum.2001 2000 2001 2000 2001 2000 2001 2000Reporting Area
Salmonellosis†
UNITED STATES 1,266 1,560 6,563 6,934 38,367 39,574 28,019 31,949
NEW ENGLAND 91 79 737 829 2,312 2,191 2,124 2,209Maine 5 7 69 139 167 127 151 101N.H. 2 1 21 23 164 148 155 149Vt. 1 4 62 57 83 110 71 104Mass. 38 32 273 277 1,314 1,236 1,116 1,250R.I. 16 13 72 60 143 152 173 158Conn. 29 22 240 273 441 418 458 447
MID. ATLANTIC 380 392 1,187 1,294 5,005 5,045 3,648 5,266Upstate N.Y. 69 80 772 823 1,275 1,293 1,213 1,281N.Y. City 201 228 35 18 1,099 1,197 1,357 1,281N.J. 76 49 192 195 1,598 1,138 657 1,025Pa. 34 35 188 258 1,033 1,417 421 1,679
E.N. CENTRAL 141 155 143 169 4,854 5,451 4,101 3,700Ohio 27 23 52 52 1,359 1,602 1,165 1,456Ind. 16 11 15 14 529 678 482 613Ill. 35 68 24 22 1,317 1,502 1,169 303Mich. 42 34 46 69 839 904 791 942Wis. 21 19 6 12 810 765 494 386
W.N. CENTRAL 35 84 364 542 2,357 2,483 2,328 2,509Minn. 6 42 46 98 706 614 665 679Iowa 9 2 82 81 340 373 301 350Mo. 13 21 40 50 639 713 940 859N. Dak. - 3 42 117 60 73 84 78S. Dak. - 1 56 96 147 100 118 103Nebr. 2 8 4 3 153 231 - 139Kans. 5 7 94 97 312 379 220 301
S. ATLANTIC 296 382 2,310 2,402 9,521 8,629 5,912 5,908Del. 2 5 30 49 86 125 112 134Md. 113 126 361 413 812 804 853 730D.C. 13 17 - - 81 64 U UVa. 49 55 485 574 1,320 1,020 1,041 931W. Va. 1 4 140 114 142 181 140 152N.C. 19 36 577 571 1,378 1,149 1,219 1,136S.C. 8 2 114 163 899 781 723 575Ga. 30 47 399 357 1,661 1,689 1,210 1,722Fla. 61 90 204 161 3,142 2,816 614 528
E.S. CENTRAL 34 48 202 210 2,630 2,483 1,788 1,832Ky. 12 18 28 21 383 393 230 269Tenn. 12 13 106 107 651 709 788 819Ala. 6 16 64 81 748 676 474 607Miss. 4 1 4 1 848 705 296 137
W.S. CENTRAL 12 73 1,045 880 4,168 4,952 2,537 3,020Ark. 3 3 20 32 903 729 92 578La. 5 14 3 4 424 877 952 755Okla. 3 10 60 58 482 405 375 302Tex. 1 46 962 786 2,359 2,941 1,118 1,385
MOUNTAIN 63 60 232 294 2,212 2,786 1,801 2,494Mont. 3 1 38 65 78 97 - -Idaho 4 5 28 10 146 132 95 118Wyo. - - 20 78 57 76 52 60Colo. 23 30 - - 592 692 577 677N. Mex. 3 - 14 21 280 239 235 208Ariz. 17 11 116 101 659 798 627 770Utah 4 6 15 10 225 487 192 479Nev. 9 7 1 9 175 265 23 182
PACIFIC 214 287 343 314 5,308 5,554 3,780 5,011Wash. 15 43 - - 579 659 491 677Oreg. 14 40 3 7 248 297 309 360Calif. 174 194 300 272 4,063 4,300 2,622 3,693Alaska 1 - 40 35 51 61 28 36Hawaii 10 10 - - 367 237 330 245
Guam - 2 - - - 28 U UP.R. 5 5 90 80 556 742 U UV.I. - - - - - - U UAmer. Samoa U U U U U U U UC.N.M.I. - U - U 16 U U U

Vol. 50 / Nos. 51 & 52 MMWR 1173
TABLE II. (Cont’d) Provisional cases of selected notifiable diseases, United States,weeks ending December 29, 2001, and December 30, 2000 (52nd Week)*
N: Not notifiable. U: Unavailable. -: No reported cases.* Incidence data for reporting year 2001 are provisional and cumulative (year-to-date). Incidence data for reporting year 2000 are finalized and
cumulative (year-to-date).† Individual cases can be reported through both the National Electronic Telecommunications System for Surveillance (NETSS) and the Public
Health Laboratory Information System (PHLIS).
SyphilisNETSS PHLIS (Primary & Secondary) Tuberculosis
Cum. Cum. Cum. Cum. Cum. Cum. Cum. Cum.2001 2000 2001 2000 2001 2000 2001 2000Reporting Area
Shigellosis†
UNITED STATES 18,653 22,922 7,747 12,709 5,790 5,978 12,294 15,976
NEW ENGLAND 273 409 276 384 68 85 420 489Maine 6 11 3 11 1 1 3 24N.H. 7 7 4 8 1 2 17 22Vt. 7 4 6 - 3 - 4 4Mass. 199 283 185 262 43 62 246 285R.I. 24 35 26 34 9 4 49 49Conn. 30 69 52 69 11 16 101 105
MID. ATLANTIC 1,394 2,879 724 1,723 493 280 2,255 2,575Upstate N.Y. 476 859 113 212 30 15 351 412N.Y. City 356 939 362 628 271 117 1,124 1,332N.J. 366 508 184 439 143 71 496 565Pa. 196 573 65 444 49 77 284 266
E.N. CENTRAL 4,329 4,215 1,837 1,329 1,020 1,207 1,368 1,607Ohio 2,974 437 1,182 332 76 69 273 340Ind. 225 1,591 50 156 159 351 111 145Ill. 542 1,188 362 179 360 412 636 743Mich. 302 667 216 606 403 330 268 287Wis. 286 332 27 56 22 45 80 92
W.N. CENTRAL 1,983 2,627 1,267 2,060 85 64 451 551Minn. 467 901 440 925 28 16 232 178Iowa 370 569 290 350 4 11 34 40Mo. 307 671 218 463 22 29 136 211N. Dak. 22 61 35 52 - - 4 5S. Dak. 643 8 246 6 1 - 13 16Nebr. 98 162 - 117 5 2 32 24Kans. 76 255 38 147 25 6 - 77
S. ATLANTIC 2,996 3,196 841 1,169 1,910 2,009 2,584 3,266Del. 17 25 14 23 12 9 15 14Md. 164 202 91 115 253 307 232 282D.C. 53 80 U U 43 37 51 38Va. 640 460 268 350 105 126 256 292W. Va. 8 26 10 17 5 3 28 33N.C. 356 400 170 270 431 483 398 447S.C. 251 144 123 94 222 229 207 286Ga. 451 339 130 193 366 402 445 703Fla. 1,056 1,520 35 107 473 413 952 1,171
E.S. CENTRAL 1,663 1,213 608 586 660 877 810 1,013Ky. 813 530 327 121 48 85 115 147Tenn. 113 354 120 379 329 532 294 383Ala. 211 100 130 79 148 123 265 310Miss. 526 229 31 7 135 137 136 173
W.S. CENTRAL 2,502 3,525 1,146 1,165 752 825 803 2,190Ark. 543 235 155 63 45 104 153 199La. 149 300 166 200 169 209 - 331Okla. 109 131 36 44 67 116 138 154Tex. 1,701 2,859 789 858 471 396 512 1,506
MOUNTAIN 997 1,295 708 868 230 225 545 589Mont. 9 8 - - - - 14 21Idaho 40 44 15 25 1 1 10 16Wyo. 3 5 5 3 1 1 3 4Colo. 246 269 258 221 22 11 120 97N. Mex. 121 188 79 119 17 16 25 45Ariz. 444 577 290 350 173 189 269 261Utah 67 82 53 84 8 2 35 49Nev. 67 122 8 66 8 5 69 96
PACIFIC 2,516 3,563 340 3,425 572 406 3,058 3,696Wash. 218 501 167 414 54 66 258 258Oreg. 96 164 111 110 13 12 108 119Calif. 2,132 2,853 - 2,865 493 326 2,493 3,075Alaska 7 7 6 3 - - 51 108Hawaii 63 38 56 33 12 2 148 136
Guam - 46 U U - 3 - 53P.R. 9 39 U U 257 175 76 174V.I. - - U U - - - -Amer. Samoa U U U U U U U UC.N.M.I. 8 U U U 13 U 32 U

1174 MMWR January 4, 2002
N: Not notifiable. U: Unavailable. - : No reported cases.* Incidence data for reporting year 2001 are provisional and cumulative (year-to-date). Incidence data for reporting year 2000 are finalized and
cumulative (year-to-date).† For imported measles, cases include only those resulting from importation from other countries.§ Of 290 cases among children aged <5 years, serotype was reported for 129, and of those, 22 were type b.
TABLE III. Provisional cases of selected notifiable diseases preventableby vaccination, United States, weeks ending December 29, 2001,
and December 30, 2000 (52nd Week)*
A B Indigenous Imported† Total
Cum. Cum. Cum. Cum. Cum. Cum. Cum. Cum. Cum. Cum.2001§ 2000 2001 2000 2001 2000 2001 2001 2001 2001 2001 2000Reporting Area
Hepatitis (Viral), By TypeH. influenzae,Invasive
UNITED STATES 1,428 1,398 10,777 13,397 6,718 8,036 - 61 - 47 108 86
NEW ENGLAND 93 132 664 399 98 140 - 4 - 1 5 6Maine 2 2 11 22 5 5 - - - - - -N.H. 7 14 18 19 16 19 - - - - - 3Vt. 5 10 16 10 4 6 - 1 - - 1 3Mass. 41 46 311 139 11 15 - 2 - 1 3 -R.I. 7 9 74 31 31 46 - - - - - -Conn. 31 51 234 178 31 49 - 1 - - 1 -
MID. ATLANTIC 234 243 1,197 1,527 1,173 1,165 - 5 - 11 16 24Upstate N.Y. 79 109 283 265 133 154 - 1 - 4 5 10N.Y. City 51 65 308 528 457 556 - 3 - 1 4 13N.J. 81 41 401 288 338 179 - - - 1 1 -Pa. 23 28 205 446 245 276 - 1 - 5 6 1
E.N. CENTRAL 227 186 1,216 1,691 901 832 - - - 10 10 10Ohio 74 55 261 267 93 107 - - - 3 3 3Ind. 51 33 104 132 48 84 - - - 4 4 -Ill. 63 62 458 696 152 170 - - - 3 3 3Mich. 13 11 324 491 608 427 - - - - - 3Wis. 26 25 69 105 - 44 - - - - - 1
W.N. CENTRAL 74 86 404 666 213 321 - 4 - 1 5 3Minn. 47 51 42 185 31 58 - 2 - 1 3 1Iowa - - 36 67 22 38 - - - - - -Mo. 16 23 105 258 108 149 - 2 - - 2 -N. Dak. 7 4 3 4 2 3 - - - - - -S. Dak. - 1 3 3 1 2 - - - - - -Nebr. 2 3 35 38 28 44 - - - - - -Kans. 2 4 180 111 21 27 - - - - - 2
S. ATLANTIC 391 333 2,738 1,771 1,614 1,630 - 4 - 1 5 4Del. - - 15 15 11 15 - - - - - -Md. 93 81 324 210 144 131 - 2 - 1 3 -D.C. - - 73 40 13 35 - - - - - -Va. 30 41 143 164 186 174 - 1 - - 1 2W. Va. 16 15 28 56 25 30 - - - - - -N.C. 50 23 242 154 222 256 - - - - - -S.C. 9 7 78 97 32 23 - - - - - -Ga. 104 85 969 376 466 350 - 1 - - 1 -Fla. 89 81 866 659 515 616 - - - - - 2
E.S. CENTRAL 77 54 421 418 435 501 - 2 - - 2 -Ky. 2 12 137 63 51 81 - 2 - - 2 -Tenn. 44 26 173 156 242 239 - - - - - -Ala. 29 14 81 56 88 71 - - - - - -Miss. 2 2 30 143 54 110 - - - - - -
W.S. CENTRAL 55 68 1,338 2,460 674 1,503 - - - 1 1 1Ark. 2 2 68 144 102 109 - - - - - 1La. 6 16 61 107 48 157 - - - - - -Okla. 45 46 120 272 107 178 - - - - - -Tex. 2 4 1,089 1,937 417 1,059 - - - 1 1 -
MOUNTAIN 165 135 746 977 488 580 - 2 - - 2 12Mont. - 1 13 7 3 8 U - U - - -Idaho 2 4 57 45 11 10 - 1 - - 1 -Wyo. - 1 7 4 3 3 - - - - - -Colo. 38 33 90 223 103 108 - - - - - 2N. Mex. 28 26 37 70 131 144 - - - - - -Ariz. 74 53 411 467 161 215 - 1 - - 1 -Utah 12 11 69 71 28 37 - - - - - 3Nev. 11 6 62 90 48 55 - - - - - 7
PACIFIC 112 161 2,053 3,488 1,122 1,364 - 40 - 22 62 26Wash. 7 9 161 298 143 132 - 13 - 2 15 3Oreg. 24 34 82 172 119 124 - 4 - - 4 -Calif. 51 48 1,793 2,992 831 1,083 - 21 - 15 36 19Alaska 6 45 14 13 9 13 - - - - - 1Hawaii 24 25 3 13 20 12 - 2 - 5 7 3
Guam - 3 - 1 - 10 - - - - - -P.R. 1 4 132 255 188 313 - - - - - 3V.I. - - - - - - - - - - - -Amer. Samoa U U U U U U U U U U U UC.N.M.I. - U - U 35 U U - U - - U
Measles (Rubeola)

Vol. 50 / Nos. 51 & 52 MMWR 1175
TABLE III. (Cont’d) Provisional cases of selected notifiable diseases preventableby vaccination, United States, weeks ending December 29, 2001,
and December 30, 2000 (52nd Week)*
N: Not notifiable. U: Unavailable. - : No reported cases.* Incidence data for reporting year 2001 are provisional and cumulative (year-to-date). Incidence data for reporting year 2000 are finalized and
cumulative (year-to-date).
MeningococcalDisease Mumps Pertussis Rubella
Cum. Cum. Cum. Cum. Cum. Cum. Cum. Cum.2001 2000 2001 2001 2000 2001 2001 2000 2001 2001 2000Reporting Area
UNITED STATES 2,255 2,256 2 231 338 96 5,396 7,867 - 19 176
NEW ENGLAND 115 123 - - 5 23 579 1,952 - - 12Maine 7 9 - - - - 21 46 - - -N.H. 14 12 - - - - 39 159 - - 2Vt. 7 4 - - - 23 107 254 - - -Mass. 56 70 - - 1 - 389 1,411 - - 8R.I. 6 9 - - 1 - 6 28 - - 1Conn. 25 19 - - 3 - 17 54 - - 1
MID. ATLANTIC 255 262 - 24 31 1 307 819 - 5 11Upstate N.Y. 64 79 - 4 12 1 150 385 - 1 1N.Y. City 42 46 - 12 8 - 49 90 - 3 9N.J. 93 54 - 4 4 - 22 56 - 1 1Pa. 56 83 - 4 7 - 86 288 - - -
E.N. CENTRAL 326 403 - 20 27 1 739 942 - 2 1Ohio 92 94 - 1 9 - 326 389 - - -Ind. 43 59 - 3 2 - 96 153 - - -Ill. 72 91 - 11 6 - 80 133 - 2 1Mich. 71 115 - 5 7 1 139 127 - - -Wis. 48 44 - - 3 - 98 140 - - -
W.N. CENTRAL 165 157 - 17 26 5 443 829 - 3 2Minn. 27 23 - 5 7 - 207 575 - - 1Iowa 31 37 - 1 8 2 81 67 - 1 -Mo. 56 67 - 4 5 3 108 97 - 1 -N. Dak. 6 3 - - 1 - 5 9 - - -S. Dak. 5 6 - - - - 5 11 - - -Nebr. 25 9 - 1 2 - 7 28 - - 1Kans. 15 12 - 6 3 - 30 42 - 1 -
S. ATLANTIC 380 337 - 42 50 2 356 593 - 5 119Del. 5 1 - - - - - 9 - - 1Md. 42 28 - 7 9 - 45 133 - - -D.C. - - - - - - 1 3 - - -Va. 44 42 - 8 11 1 142 134 - - -W. Va. 14 15 - - 1 - 4 3 - - -N.C. 63 39 - 5 9 - 74 129 - - 89S.C. 35 26 - 7 11 - 34 63 - 2 27Ga. 52 53 - 7 2 - 27 52 - 1 -Fla. 125 133 - 8 7 1 29 67 - 2 2
E.S. CENTRAL 134 137 - 9 7 3 188 132 - - 6Ky. 23 26 - 3 1 2 84 63 - - 1Tenn. 60 59 - 1 2 1 63 45 - - 1Ala. 35 36 - - 4 - 37 20 - - 4Miss. 16 16 - 5 - - 4 4 - - -
W.S. CENTRAL 340 245 - 14 38 7 543 452 - 2 10Ark. 21 19 - 1 3 1 47 44 - - 3La. 66 46 - 2 5 - 3 21 - - 1Okla. 32 34 - - 3 - 33 60 - - -Tex. 221 146 - 11 27 6 460 327 - 2 6
MOUNTAIN 99 106 - 15 24 52 1,468 887 - - 2Mont. 4 6 U 1 1 U 54 35 U - -Idaho 8 7 - 2 1 1 171 64 - - -Wyo. 5 2 - 2 1 - 1 4 - - -Colo. 36 35 - 3 1 8 344 488 - - 1N. Mex. 11 11 - 2 1 1 145 91 - - -Ariz. 19 33 - 1 6 42 637 143 - - 1Utah 8 7 - 1 7 - 76 47 - - -Nev. 8 5 - 3 6 - 40 15 - - -
PACIFIC 441 486 2 90 130 2 773 1,261 - 2 13Wash. 66 71 - 2 10 1 171 458 - - 7Oreg. 46 70 N N N 1 53 110 - - -Calif. 313 328 - 46 89 - 495 631 - 1 6Alaska 3 9 - 1 8 - 11 21 - - -Hawaii 13 8 2 41 23 - 43 41 - 1 -
Guam - - - - 16 - - 4 - - 1P.R. 5 10 - - 2 - 2 12 - - -V.I. - - - - - - - - - - -Amer. Samoa U U U U U U U U U U UC.N.M.I. - U U - U U - U U - U

1176 MMWR January 4, 2002
TABLE IV. Deaths in 122 U.S. cities,* week endingDecember 29, 2001 (52nd Week)
U: Unavailable. -:No reported cases.* Mortality data in this table are reported voluntarily from 122 cities in the United States, most of which have populations of >100,000. A death
is reported by the place of its occurrence and by the week that the death certificate was filed. Fetal deaths are not included.† Pneumonia and influenza.§ Because of changes in reporting methods in this Pennsylvania city, these numbers are partial counts for the current week. Complete
counts will be available in 4 to 6 weeks.¶ Total includes unknown ages.
�65 45-64 25-44 1-24 <1Reporting Area
All Causes, By Age (Years)
AllAges
P&I†
Total������65 45-64 25-44 1-24 <1
Reporting Area
All Causes, By Age (Years)
AllAges
P&I†
Total
NEW ENGLAND 276 211 39 20 3 3 37Boston, Mass. U U U U U U UBridgeport, Conn. U U U U U U UCambridge, Mass. 16 14 1 1 - - 2Fall River, Mass. 26 21 4 1 - - 5Hartford, Conn. U U U U U U ULowell, Mass. 21 16 2 3 - - 2Lynn, Mass. 10 6 1 3 - - -New Bedford, Mass. 29 27 1 1 - - -New Haven, Conn. 31 22 6 2 1 - 3Providence, R.I. U U U U U U USomerville, Mass. 6 4 2 - - - 1Springfield, Mass. 39 27 6 4 1 1 9Waterbury, Conn. 43 34 7 - 1 1 6Worcester, Mass. 55 40 9 5 - 1 9
MID. ATLANTIC 1,552 1,117 304 87 24 20 95Albany, N.Y. 48 31 13 2 1 1 5Allentown, Pa. 23 22 1 - - - 3Buffalo, N.Y. 60 43 14 - 3 - 6Camden, N.J. 22 12 7 2 - 1 1Elizabeth, N.J. 21 16 5 - - - -Erie, Pa.§ 25 22 3 - - - 4Jersey City, N.J. 33 23 10 - - - -New York City, N.Y. 982 697 189 67 15 14 51Newark, N.J. U U U U U U UPaterson, N.J. 31 15 11 4 1 - -Philadelphia, Pa. U U U U U U UPittsburgh, Pa.§ 29 21 8 - - - 2Reading, Pa. 22 18 2 1 - 1 2Rochester, N.Y. 124 92 21 6 4 1 8Schenectady, N.Y. 34 28 5 1 - - 3Scranton, Pa.§ 35 28 6 1 - - 2Syracuse, N.Y. 39 34 2 1 - 2 5Trenton, N.J. 8 4 4 - - - 1Utica, N.Y. 16 11 3 2 - - 2Yonkers, N.Y. U U U U U U U
E.N. CENTRAL 1,027 683 219 63 32 30 58Akron, Ohio 29 24 1 1 1 2 1Canton, Ohio 33 22 7 3 1 - 4Chicago, Ill. U U U U U U UCincinnati, Ohio 58 36 17 - 3 2 1Cleveland, Ohio 80 52 21 5 2 - 3Columbus, Ohio 161 111 34 8 4 4 6Dayton, Ohio 77 57 14 2 1 3 4Detroit, Mich. 77 46 23 8 - - 8Evansville, Ind. 29 21 5 3 - - 1Fort Wayne, Ind. 46 33 7 2 3 1 2Gary, Ind. 21 7 7 3 3 1 -Grand Rapids, Mich. 32 18 8 1 1 4 2Indianapolis, Ind. 122 79 23 11 3 6 11Lansing, Mich. U U U U U U UMilwaukee, Wis. 83 50 20 6 5 2 4Peoria, Ill. U U U U U U URockford, Ill. 45 30 8 6 - 1 2South Bend, Ind. 28 18 8 2 - - 2Toledo, Ohio 63 42 11 2 5 3 5Youngstown, Ohio 43 37 5 - - 1 2
W.N. CENTRAL 572 383 118 42 21 8 42Des Moines, Iowa U U U U U U UDuluth, Minn. 27 15 9 3 - - 2Kansas City, Kans. 43 23 9 4 6 1 3Kansas City, Mo. 106 72 25 5 1 3 8Lincoln, Nebr. 25 21 3 1 - - 1Minneapolis, Minn. 125 97 19 4 4 1 10Omaha, Nebr. 49 35 11 3 - - 2St. Louis, Mo. 53 33 13 4 2 1 9St. Paul, Minn. 63 43 13 4 2 1 4Wichita, Kans. 81 44 16 14 6 1 3
S. ATLANTIC 990 635 206 102 26 21 69Atlanta, Ga. 125 70 30 20 3 2 3Baltimore, Md. 164 92 44 24 2 2 24Charlotte, N.C. 79 47 19 10 1 2 14Jacksonville, Fla. 118 75 27 8 5 3 3Miami, Fla. 111 76 22 10 2 1 3Norfolk, Va. 17 8 5 2 1 1 3Richmond, Va. 39 31 5 1 1 1 2Savannah, Ga. 71 52 8 7 2 2 5St. Petersburg, Fla. 46 36 7 2 1 - 4Tampa, Fla. 120 88 18 8 4 2 7Washington, D.C. 100 60 21 10 4 5 1Wilmington, Del. U U U U U U U
E.S. CENTRAL 532 377 90 44 14 6 35Birmingham, Ala. 100 65 23 5 4 2 9Chattanooga, Tenn. 42 35 6 - 1 - 2Knoxville, Tenn. 72 51 11 7 3 - 3Lexington, Ky. U U U U U U UMemphis, Tenn. 162 118 26 13 2 3 17Mobile, Ala. 44 34 5 4 1 - 1Montgomery, Ala. U U U U U U UNashville, Tenn. 112 74 19 15 3 1 3
W.S. CENTRAL 848 543 171 77 39 18 47Austin, Tex. 67 41 16 7 3 - 3Baton Rouge, La. 26 19 5 1 1 - -Corpus Christi, Tex. 56 38 12 5 1 - 7Dallas, Tex. 115 60 36 8 10 1 9El Paso, Tex. 27 20 4 - 1 2 -Ft. Worth, Tex. 67 46 13 2 5 1 3Houston, Tex. 284 167 54 38 15 10 11Little Rock, Ark. 42 21 14 4 - 3 1New Orleans, La. U U U U U U USan Antonio, Tex. U U U U U U UShreveport, La. 56 46 6 3 1 - 9Tulsa, Okla. 108 85 11 9 2 1 4
MOUNTAIN 668 472 132 45 10 8 60Albuquerque, N.M. 79 60 12 5 1 1 12Boise, Idaho 29 19 9 1 - - 2Colo. Springs, Colo. 38 26 8 4 - - -Denver, Colo. 97 61 19 12 2 3 9Las Vegas, Nev. 194 133 42 11 5 2 10Ogden, Utah 29 24 5 - - - 4Phoenix, Ariz. U U U U U U UPueblo, Colo. 33 24 6 3 - - 4Salt Lake City, Utah 77 57 14 4 1 1 11Tucson, Ariz. 92 68 17 5 1 1 8
PACIFIC 1,046 766 184 54 23 18 84Berkeley, Calif. 18 12 3 2 - - 3Fresno, Calif. 59 46 9 2 2 - 7Glendale, Calif. 5 4 1 - - - -Honolulu, Hawaii 66 52 5 7 1 1 6Long Beach, Calif. 54 36 11 2 4 1 5Los Angeles, Calif. 83 64 15 3 1 - 3Pasadena, Calif. 17 10 3 - 1 3 1Portland, Oreg. 167 131 25 4 1 6 12Sacramento, Calif. 146 98 32 10 4 2 19San Diego, Calif. 120 91 20 4 3 2 8San Francisco, Calif. U U U U U U USan Jose, Calif. 127 93 24 5 3 2 8Santa Cruz, Calif. 23 18 5 - - - 2Seattle, Wash. 81 53 15 10 2 1 7Spokane, Wash. U U U U U U UTacoma, Wash. 80 58 16 5 1 - 3
TOTAL 7,511¶ 5,187 1,463 534 192 132 527

Vol. 50 / Nos. 51 & 52 MMWR 1177

1178 MMWR January 4, 2002

Vol. 50 / Nos. 51 & 52 MMWR 1179
Contributors to the Production of the MMWR (Weekly)
Weekly Notifiable Disease Morbidity Data and 122 Cities Mortality Data
Samuel L. Groseclose, D.V.M., M.P.H.Wayne S. Brathwaite
State Support Team CDC Operations TeamRobert Fagan Carol M. KnowlesJose Aponte Deborah A. AdamsGerald Jones Willie J. AndersonDavid Nitschke Lateka M. DammondScott Noldy Patsy A. HallJim Vaughan Mechele A. HesterCarol A. Worsham Felicia J. Connor
Pearl Sharp
Informatics
T. Demetri Vacalis, Ph.D.
Michele D. Renshaw Erica R. Shaver
All MMWR references are available on the Internet at http://www.cdc.gov/mmwr/. Use the search function tofind specific articles.
Use of trade names and commercial sources is for identification only and does not imply endorsement by theU.S. Department of Health and Human Services.
References to non-CDC sites on the Internet are provided as a service to MMWR readers and do not constituteor imply endorsement of these organizations or their programs by CDC or the U.S. Department of Health andHuman Services. CDC is not responsible for the content of pages found at these sites.

The Morbidity and Mortality Weekly Report (MMWR) Series is prepared by the Centers for Disease Control andPrevention (CDC) and is available free of charge in electronic format and on a paid subscription basis for papercopy. To receive an electronic copy on Friday of each week, send an e-mail message to [email protected] body content should read SUBscribe mmwr-toc. Electronic copy also is available from CDC’s World-Wide Webserver at http://www.cdc.gov/mmwr or from CDC’s file transfer protocol server at ftp://ftp.cdc.gov/pub/Publi-cations/mmwr. To subscribe for paper copy, contact Superintendent of Documents, U.S. Government PrintingOffice, Washington, DC 20402; telephone (202) 512-1800.
Data in the weekly MMWR are provisional, based on weekly reports to CDC by state health departments. Thereporting week concludes at close of business on Friday; compiled data on a national basis are officially releasedto the public on the following Friday. Address inquiries about the MMWR Series, including material to beconsidered for publication, to: Editor, MMWR Series, Mailstop C-08, CDC, 1600 Clifton Rd., N.E., Atlanta, GA30333; telephone (888) 232-3228.
All material in the MMWR Series is in the public domain and may be used and reprinted without permission;citation as to source, however, is appreciated.
IU.S. Government Printing Office: 2002-733-100/49034 Region IV
1180 MMWR January 4, 2002
Director, Centers for DiseaseControl and Prevention
Jeffrey P. Koplan, M.D., M.P.H.
Deputy Director for Science andPublic Health, Centers for DiseaseControl and Prevention
David W. Fleming, M.D.
Director, Epidemiology Program OfficeStephen B. Thacker, M.D., M.Sc.
Editor, MMWR SeriesJohn W. Ward, M.D.
Guest Editor, MMWR SeriesTerence L. Chorba, M.D., M.P.H.
Acting Managing Editor, MMWR (Weekly)Teresa F. Rutledge
Writers-Editors, MMWR (Weekly)Jill CraneDavid C. Johnson
Desktop PublishingLynda G. CupellMorie M. Higgins