racine county head start - impact inc
TRANSCRIPT

Community Assessment
RACINE
COUNTY
HEAD
START
2013
Planning Council for Health and Human Services, Inc.
1243 North 10th Street, Suite 200, Milwaukee, WI 53205
414 224-0404 fax 414-224-0243 www.planningcouncil.org
Community Needs Assessment – Racine County June 2013
Page 2 Planning Council for Health and Human Services, Inc.
This page left intentionally blank

Community Needs Assessment – Racine County June 2013
Page 3 Planning Council for Health and Human Services, Inc.
2013 Racine County Head Start Community Assessment
TABLE OF CONTENTS
The Need for Head Start in Racine County ................................................................................ 5 Demographic Trends.................................................................................................................. 6
Race ....................................................................................................................................... 7 Ethnicity .................................................................................................................................. 9 Racine Children Living in Poverty ..........................................................................................11 Racine Single Mother Families and Poverty ..........................................................................13 Children with disabilities ........................................................................................................15 Child abuse and neglect ........................................................................................................17 Need for Early Head Start......................................................................................................18 YoungStar .............................................................................................................................18 Dual-language learning .........................................................................................................20 Home-based learning ............................................................................................................21 Year-round programming.......................................................................................................21 Licensed child care providers in Racine County ....................................................................24 Early education assets ..........................................................................................................25
Employment Needs & Assets ....................................................................................................27 Unemployment ......................................................................................................................27 Employment & Income ..........................................................................................................27 Employment assets and recommendations ...........................................................................30
Housing Needs & Assets ..........................................................................................................35 Rental Housing ......................................................................................................................35 Homelessness .......................................................................................................................35 Homeless children .................................................................................................................36 Homelessness and domestic violence ...................................................................................36 Effects of unstable housing on children .................................................................................36 Housing assets ......................................................................................................................37
Health/Nutrition Needs & Assets ...............................................................................................39 Healthy growth and development ..........................................................................................39
Birth to three ......................................................................................................................39 Pre- and inter-conception care ...........................................................................................39 Infant mortality and low birthweight disparities ...................................................................40 Breastfeeding for infants ....................................................................................................42
Asthma ..................................................................................................................................44 Lead poisoning ......................................................................................................................45 Child obesity ..........................................................................................................................46 Access to healthy food ..........................................................................................................47 Immunizations .......................................................................................................................50 Access to health professionals ..............................................................................................52
Food Security Needs & Assets ..................................................................................................53 Children in FoodShare and free/reduced lunch ......................................................................53 Food pantries in Racine County * ..........................................................................................54 Racine County stores accepting WIC* ...................................................................................55 Racine County SNAP retailers* .............................................................................................55

Community Needs Assessment – Racine County June 2013
Page 4 Planning Council for Health and Human Services, Inc.
Methodology .............................................................................................................................56 References ...............................................................................................................................57 Appendices ...............................................................................................................................61
Appendix A: Zip Code Map of Racine County .......................................................................61 Appendix B: Racine Schools and School Districts: 2006 ......................................................62 Appendix C: Disabilities by school district for Racine County, 2012-2013 .............................63 Appendix D: Map of City of Racine child care centers, January 2013 ...................................72 Appendix E: Map of Racine County child care centers, 2013 ................................................73 Appendix F: Child care center capacity in Racine County January 2013 ..............................74 Appendix G: Food pantries in Racine County 2013 ..............................................................77
Community Needs Assessment – Racine County June 2013
Page 5 Planning Council for Health and Human Services, Inc.
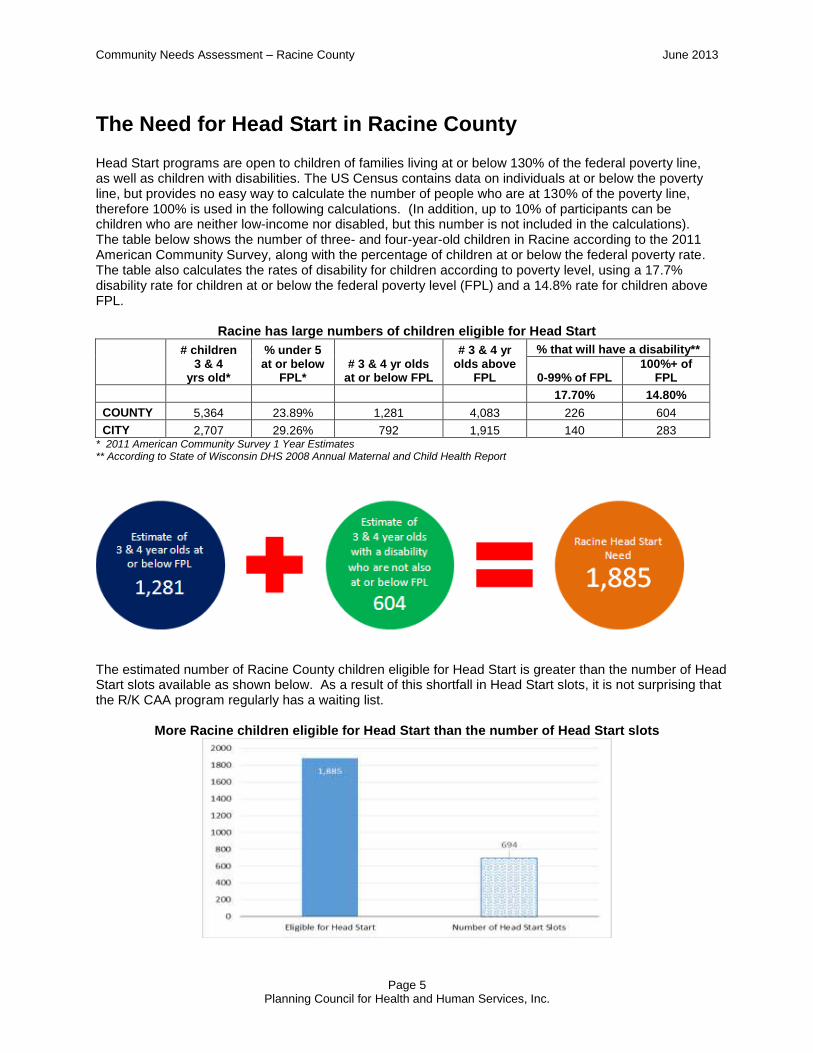
The Need for Head Start in Racine County Head Start programs are open to children of families living at or below 130% of the federal poverty line, as well as children with disabilities. The US Census contains data on individuals at or below the poverty line, but provides no easy way to calculate the number of people who are at 130% of the poverty line, therefore 100% is used in the following calculations. (In addition, up to 10% of participants can be children who are neither low-income nor disabled, but this number is not included in the calculations). The table below shows the number of three- and four-year-old children in Racine according to the 2011 American Community Survey, along with the percentage of children at or below the federal poverty rate. The table also calculates the rates of disability for children according to poverty level, using a 17.7% disability rate for children at or below the federal poverty level (FPL) and a 14.8% rate for children above FPL.
Racine has large numbers of children eligible for Head Start
# children 3 & 4
yrs old*
% under 5 at or below
FPL* # 3 & 4 yr olds
at or below FPL
# 3 & 4 yr olds above
FPL
% that will have a disability**
0-99% of FPL 100%+ of
FPL
17.70% 14.80%
COUNTY 5,364 23.89% 1,281 4,083 226 604
CITY 2,707 29.26% 792 1,915 140 283 * 2011 American Community Survey 1 Year Estimates ** According to State of Wisconsin DHS 2008 Annual Maternal and Child Health Report
The estimated number of Racine County children eligible for Head Start is greater than the number of Head Start slots available as shown below. As a result of this shortfall in Head Start slots, it is not surprising that the R/K CAA program regularly has a waiting list.
More Racine children eligible for Head Start than the number of Head Start slots

Community Needs Assessment – Racine County June 2013
Page 6 Planning Council for Health and Human Services, Inc.
Demographic Trends The number of children under age five living in Racine County has decreased seven percent in the past two decades.
Racine population under 5 years of age decreasing
Racine County 1990 2000 2010
Racine County Population under 5 years of age 13,635 13,220 12,747
Racine City Population under 5 years of age 7,404 6,565 6,557 (US Census)
Breaking these figures down into sub-categories by age, and comparing data from the 2010 Census (100% data) with that from the 2007-2011 American Community Survey (random sample data), it appears the area’s population of very young children is remaining steady (any variations in the numbers between the two data sets is within the margin of error for the American Community Survey). This conclusion is further backed up by data from the Wisconsin Department of Health Services showing that the birth rate in Racine County went down very slightly between 2010 and 2012. There were 2,459 resident births reported from January through December 2010 and 2,357 reported for the same period in 2012.
Population under 3 years remains stable
City of Racine Racine County
2010 2007-2011 2010 2007-2011
# # Margin of
Error # #
Margin of Error
Under 3 yrs 3,988 3,849 +/-318 7,521 7,470 +/-305
3 and 4 yrs 2,579 2,739 +/- 307 5,176 5,352 +/-304
TOTALS 6,517 6,588 NA 12,747 12,822 NA
(US Census ACS 2007-2011 Table B09001 “Population under 18” and 2010 Census*)
The American Community Survey (ACS) uses data collected form a sample of the total population that is averages over the specified multi-year period, resulting in estimates that have a fairly large margin of error. In contrast, the decennial census collects data on close to 100% of the population
and has a much smaller margin of error.

Community Needs Assessment – Racine County June 2013
Page 7 Planning Council for Health and Human Services, Inc.
Race
Children under the age of five who live in Racine County are more likely to be non-White than the overall population of the county. About one in six (19%) county residents is a person of color, but that rate doubles to nearly one in three (30%) children under the age of five, indicating that the county population will become increasingly composed of people of color as the decade progresses.
Racine County by Race
(ACS 2007-2011, Table B02001)
Racine County Children under 5 by Race
(ACS 2007-2011, Table B01001)

Community Needs Assessment – Racine County June 2013
Page 8 Planning Council for Health and Human Services, Inc.
The majority of people of color in Racine County live in the City of Racine, and the youngest residents of the city are more likely to be people of color than the general population of the city. Nearly one-half (49%) of children under the age of five who live in the City of Racine are non-White, while about one in three (35%) city residents is a person of color. As these children grow up and have families of their own, the city will grow to be a majority-minority city in the not-too-distant future.
City of Racine by race
(ACS 2007-2011 Table B02001)
City of Racine Children under 5 by race
(ACS 2007-2011, Table B01001)
Community Needs Assessment – Racine County June 2013
Page 9 Planning Council for Health and Human Services, Inc.
Ethnicity
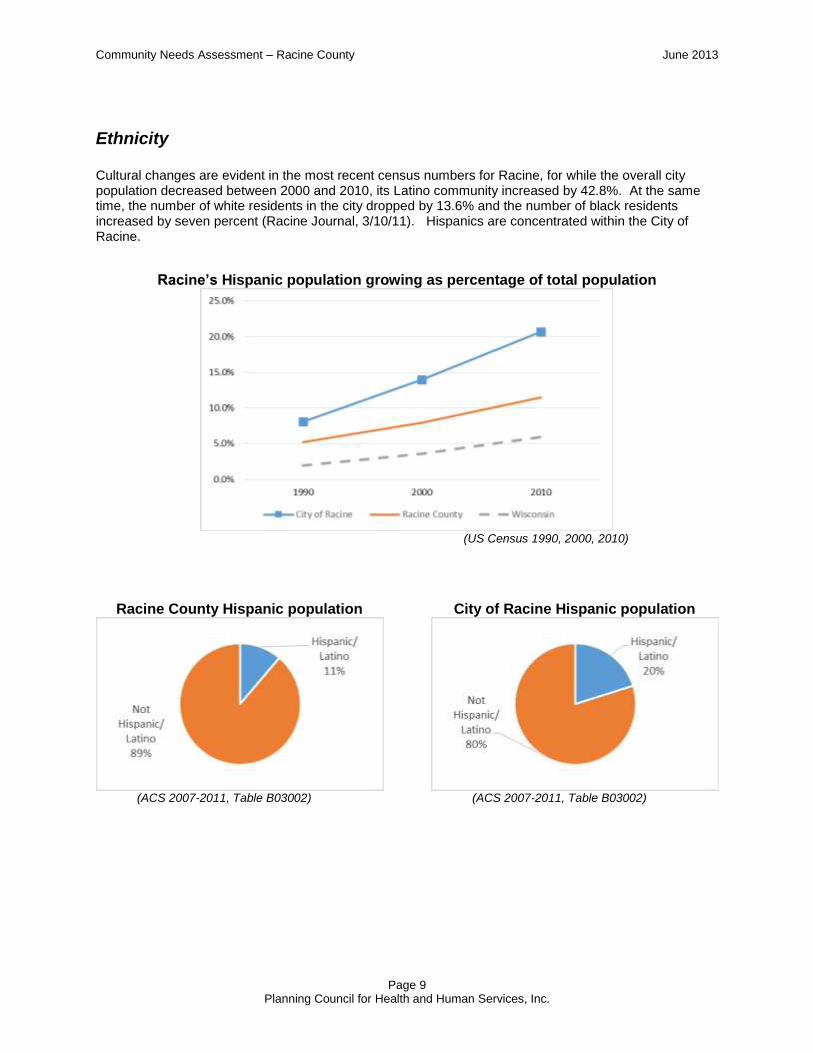
Cultural changes are evident in the most recent census numbers for Racine, for while the overall city population decreased between 2000 and 2010, its Latino community increased by 42.8%. At the same time, the number of white residents in the city dropped by 13.6% and the number of black residents increased by seven percent (Racine Journal, 3/10/11). Hispanics are concentrated within the City of Racine.
Racine’s Hispanic population growing as percentage of total population
(US Census 1990, 2000, 2010)
Racine County Hispanic population
(ACS 2007-2011, Table B03002)
City of Racine Hispanic population
(ACS 2007-2011, Table B03002)
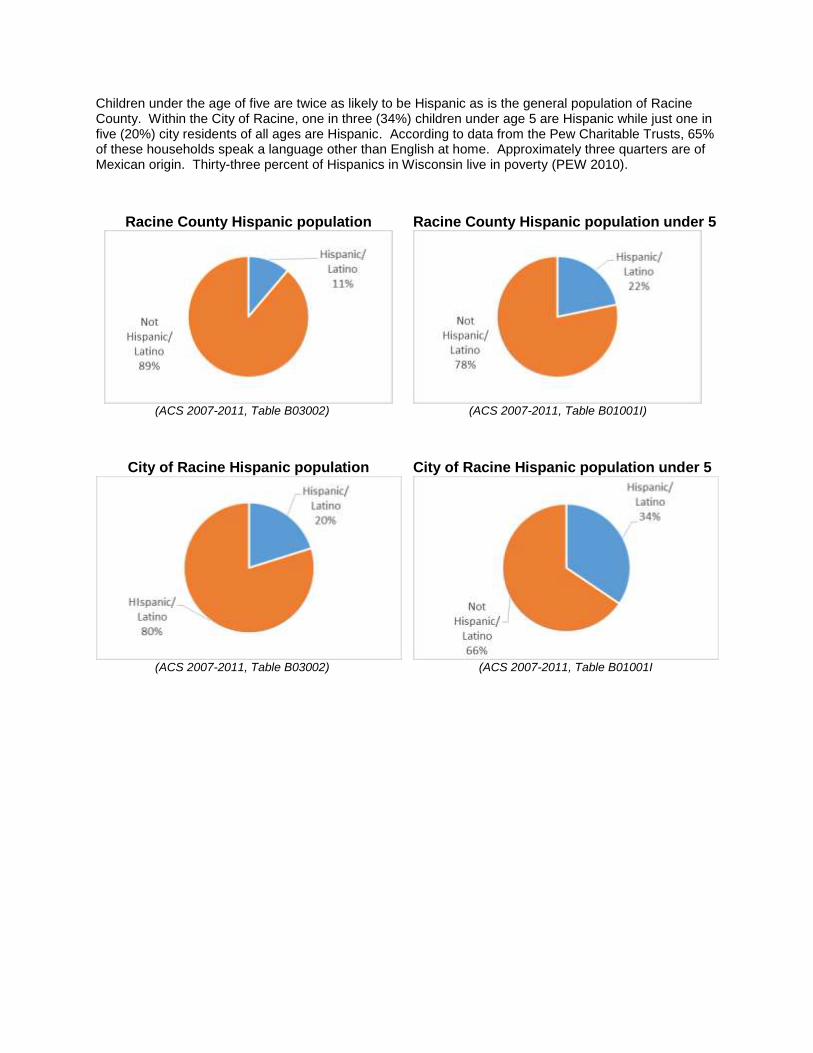
Children under the age of five are twice as likely to be Hispanic as is the general population of Racine County. Within the City of Racine, one in three (34%) children under age 5 are Hispanic while just one in five (20%) city residents of all ages are Hispanic. According to data from the Pew Charitable Trusts, 65% of these households speak a language other than English at home. Approximately three quarters are of Mexican origin. Thirty-three percent of Hispanics in Wisconsin live in poverty (PEW 2010).
Racine County Hispanic population
(ACS 2007-2011, Table B03002)
City of Racine Hispanic population
(ACS 2007-2011, Table B03002)
Racine County Hispanic population under 5
(ACS 2007-2011, Table B01001I)
City of Racine Hispanic population under 5
(ACS 2007-2011, Table B01001I

Racine Head Start Community Needs Assessment June 2013
Page 11 Planning Council for Health and Human Services, Inc.
Racine Children Living in Poverty
Children living in the City of Racine are more likely to be living in poverty than their counterparts in Racine County or the State of Wisconsin. More than one-quarter (28%) of children in the city under the age of five is living in poverty.
Children living in the City of Racine more likely to be living in poverty
(US Census ACS 2007-2011, Table B17001)
In Racine County, the population of children under the age of five living in poverty is concentrated primarily within the City of Racine, and in the city, within certain groups of census blocks, as depicted in the maps below and on the next page.

Racine Head Start Community Needs Assessment June 2013
Page 12 Planning Council for Health and Human Services, Inc.
Racine Head Start Community Needs Assessment June 2013
Page 13 Planning Council for Health and Human Services, Inc.
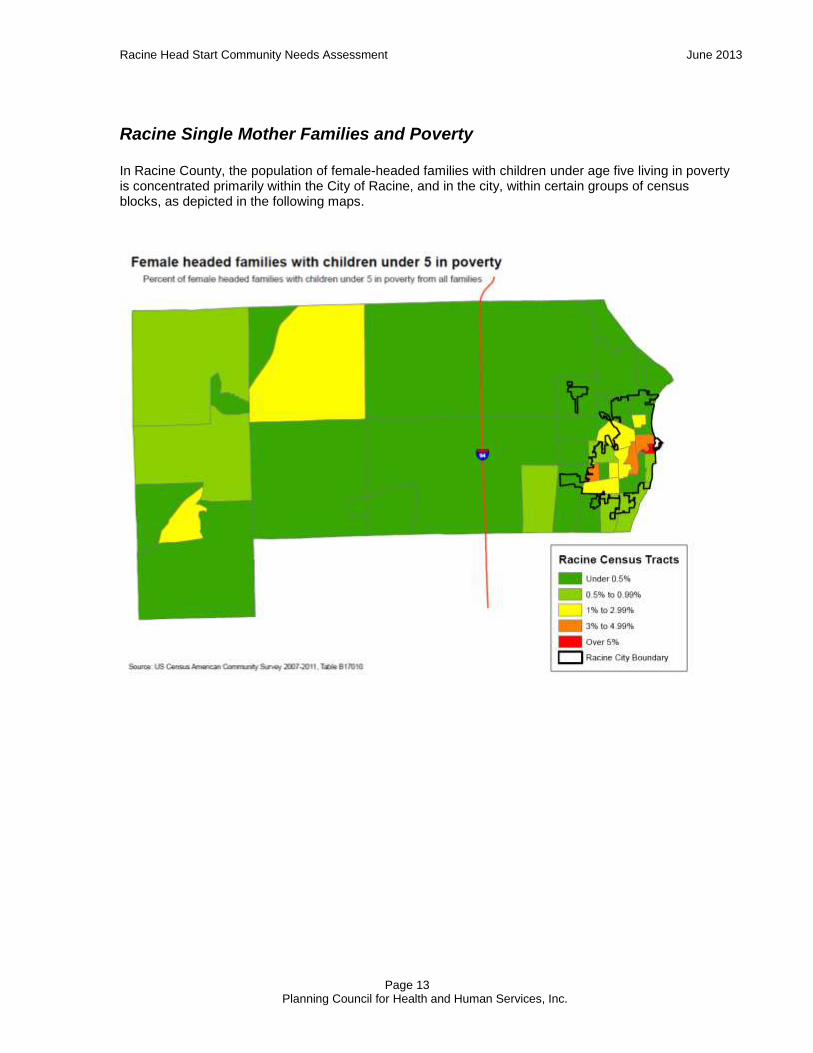
Racine Single Mother Families and Poverty In Racine County, the population of female-headed families with children under age five living in poverty is concentrated primarily within the City of Racine, and in the city, within certain groups of census blocks, as depicted in the following maps.

Racine Head Start Community Needs Assessment June 2013
Page 14 Planning Council for Health and Human Services, Inc.
In the City of Racine, female-headed households with children under the age of 18 are more likely to be living in poverty than either households headed by males alone or married-couple households. In the City of Racine, for families with children under the age of 5, more than half (48%) of female-headed households are living below the poverty level, compared to 40% of single male-headed households and 24% of married-couple households (US Census ACS 2007-2011).
Racine Head Start Community Needs Assessment June 2013
Page 15 Planning Council for Health and Human Services, Inc.
Children with disabilities
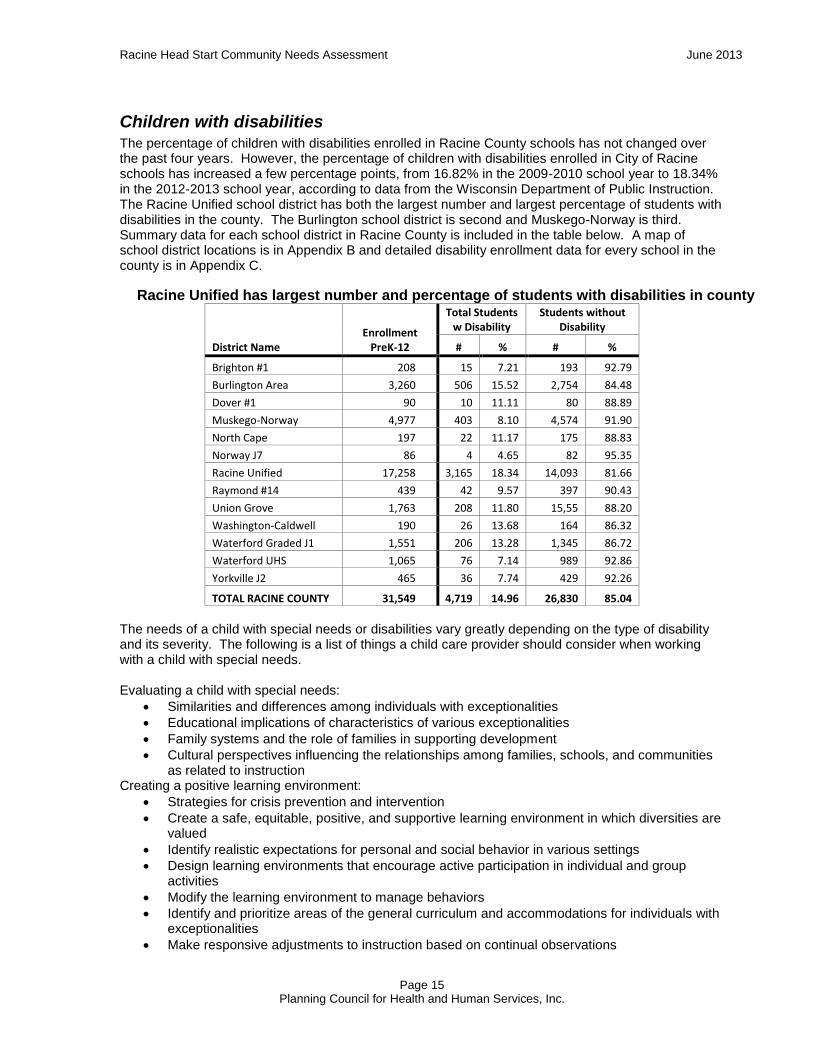
The percentage of children with disabilities enrolled in Racine County schools has not changed over the past four years. However, the percentage of children with disabilities enrolled in City of Racine schools has increased a few percentage points, from 16.82% in the 2009-2010 school year to 18.34% in the 2012-2013 school year, according to data from the Wisconsin Department of Public Instruction. The Racine Unified school district has both the largest number and largest percentage of students with disabilities in the county. The Burlington school district is second and Muskego-Norway is third. Summary data for each school district in Racine County is included in the table below. A map of school district locations is in Appendix B and detailed disability enrollment data for every school in the county is in Appendix C.
Racine Unified has largest number and percentage of students with disabilities in county
District Name
Enrollment PreK-12
Total Students w Disability
Students without Disability
# % # %
Brighton #1 208 15 7.21 193 92.79
Burlington Area 3,260 506 15.52 2,754 84.48
Dover #1 90 10 11.11 80 88.89
Muskego-Norway 4,977 403 8.10 4,574 91.90
North Cape 197 22 11.17 175 88.83
Norway J7 86 4 4.65 82 95.35
Racine Unified 17,258 3,165 18.34 14,093 81.66
Raymond #14 439 42 9.57 397 90.43
Union Grove 1,763 208 11.80 15,55 88.20
Washington-Caldwell 190 26 13.68 164 86.32
Waterford Graded J1 1,551 206 13.28 1,345 86.72
Waterford UHS 1,065 76 7.14 989 92.86
Yorkville J2 465 36 7.74 429 92.26
TOTAL RACINE COUNTY 31,549 4,719 14.96 26,830 85.04
The needs of a child with special needs or disabilities vary greatly depending on the type of disability and its severity. The following is a list of things a child care provider should consider when working with a child with special needs. Evaluating a child with special needs:
Similarities and differences among individuals with exceptionalities
Educational implications of characteristics of various exceptionalities
Family systems and the role of families in supporting development
Cultural perspectives influencing the relationships among families, schools, and communities as related to instruction
Creating a positive learning environment:
Strategies for crisis prevention and intervention
Create a safe, equitable, positive, and supportive learning environment in which diversities are valued
Identify realistic expectations for personal and social behavior in various settings
Design learning environments that encourage active participation in individual and group activities
Modify the learning environment to manage behaviors
Identify and prioritize areas of the general curriculum and accommodations for individuals with exceptionalities
Make responsive adjustments to instruction based on continual observations
Racine Head Start Community Needs Assessment June 2013
Page 16 Planning Council for Health and Human Services, Inc.
Evaluate instruction and monitor progress of individuals with exceptionalities
Emphasize child’s strengths and needs in assessment reports
Sequence, implement, and evaluate individualized learning objectives
Assist individuals with exceptionalities and their families in becoming active participants in the educational team (CEC 2012)
The following are a few of the many community assets that are available to the parents of children with disabilities in Racine, as well as to those who provide child care to these children.
Disabilities Rights Wisconsin o The CORE of a Good Life: Guided Conversations with Parents on Raising Children
with Disabilities, 2009 http://www.disabilityrightswi.org/wp-content/uploads/2009/10/core_guide.pdf
o A Thinking Guide to Inclusive Child Care for Those Who Care About Children With and Without Disabilities, 2008 http://www.disabilityrightswi.org/uploads/2008/02/thinking-guide-to-inclusive-childcare. pdf
Wisconsin Family Assistance Center for Education, Training, and Support (FACETS)
Wisconsin Statewide Parent/Educator Initiative (WSPEI)
Supporting Families Together Association - assists child care programs in linking to resources and other programs available for children with or without disabilities (SFTA)
The Registry - A professional development agency that offers course training and information to early childhood and school-age practitioners in order to effectively provide services to all children.
Wisconsin Alliance for Infant Mental Health (WI-AIMH) – promotes social and emotional well-being for all infants and children in Wisconsin
Wisconsin Child Care Information Center – a free lending library for child care professionals.
Wisconsin Department of Health Services, Birth to 3 Program - provides early intervention services in the form of physical, occupational, educational or speech therapy for children from birth to 3 years of age.
Agencies serving children with special needs in Racine County include the Arc of Racine County, which provides advocacy, support and education programs for Children & Adults with intellectual & developmental disabilities and their families.
As mentioned earlier in this report, the federal sequester is expected to reduce funding available for ongoing programs and operations of many federally funded programs. According to a recent article in the Racine Journal Times, beginning in October 2013 funding to educate disabled students in Wisconsin could be cut by $10.1 million, possibly resulting in 120 fewer teachers and aides (RJT 5/6/13).
Racine Head Start Community Needs Assessment June 2013
Page 17 Planning Council for Health and Human Services, Inc.
Child abuse and neglect
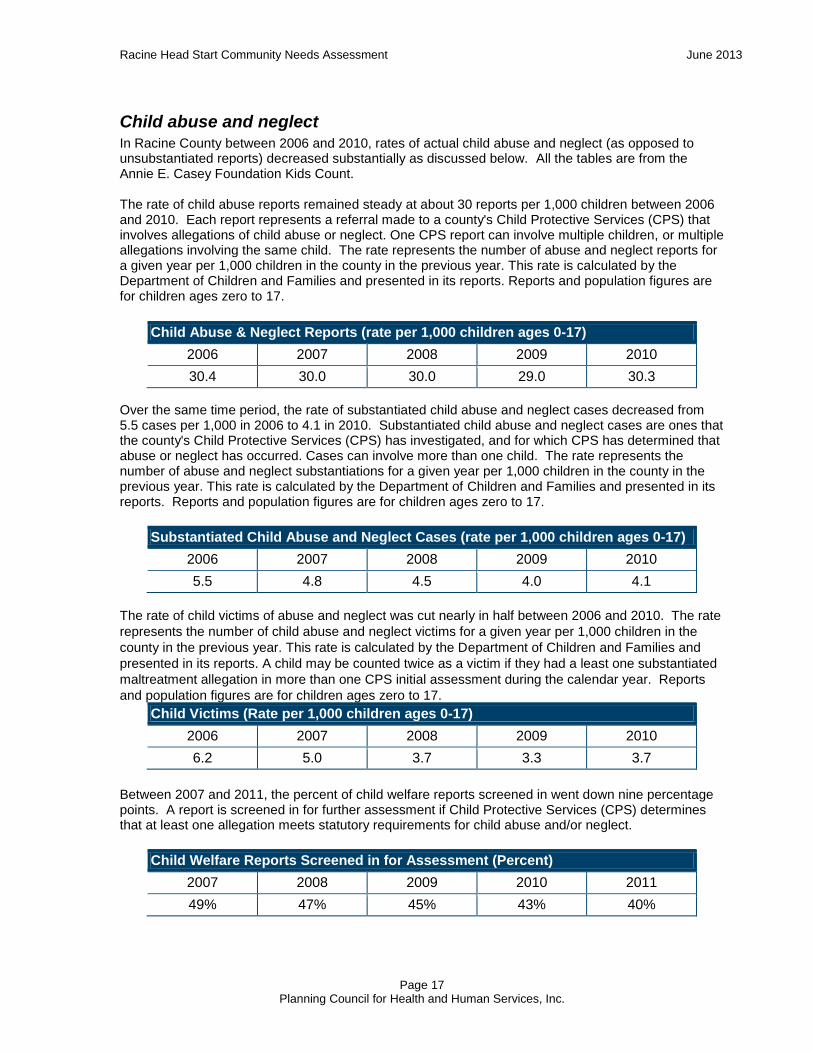
In Racine County between 2006 and 2010, rates of actual child abuse and neglect (as opposed to unsubstantiated reports) decreased substantially as discussed below. All the tables are from the Annie E. Casey Foundation Kids Count. The rate of child abuse reports remained steady at about 30 reports per 1,000 children between 2006 and 2010. Each report represents a referral made to a county's Child Protective Services (CPS) that involves allegations of child abuse or neglect. One CPS report can involve multiple children, or multiple allegations involving the same child. The rate represents the number of abuse and neglect reports for a given year per 1,000 children in the county in the previous year. This rate is calculated by the Department of Children and Families and presented in its reports. Reports and population figures are for children ages zero to 17.
Child Abuse & Neglect Reports (rate per 1,000 children ages 0-17)
2006 2007 2008 2009 2010
30.4 30.0 30.0 29.0 30.3
Over the same time period, the rate of substantiated child abuse and neglect cases decreased from 5.5 cases per 1,000 in 2006 to 4.1 in 2010. Substantiated child abuse and neglect cases are ones that the county's Child Protective Services (CPS) has investigated, and for which CPS has determined that abuse or neglect has occurred. Cases can involve more than one child. The rate represents the number of abuse and neglect substantiations for a given year per 1,000 children in the county in the previous year. This rate is calculated by the Department of Children and Families and presented in its reports. Reports and population figures are for children ages zero to 17.
Substantiated Child Abuse and Neglect Cases (rate per 1,000 children ages 0-17)
2006 2007 2008 2009 2010
5.5 4.8 4.5 4.0 4.1
The rate of child victims of abuse and neglect was cut nearly in half between 2006 and 2010. The rate
represents the number of child abuse and neglect victims for a given year per 1,000 children in the
county in the previous year. This rate is calculated by the Department of Children and Families and
presented in its reports. A child may be counted twice as a victim if they had a least one substantiated
maltreatment allegation in more than one CPS initial assessment during the calendar year. Reports
and population figures are for children ages zero to 17.
Child Victims (Rate per 1,000 children ages 0-17)
2006 2007 2008 2009 2010
6.2 5.0 3.7 3.3 3.7
Between 2007 and 2011, the percent of child welfare reports screened in went down nine percentage points. A report is screened in for further assessment if Child Protective Services (CPS) determines that at least one allegation meets statutory requirements for child abuse and/or neglect.
Child Welfare Reports Screened in for Assessment (Percent)
2007 2008 2009 2010 2011
49% 47% 45% 43% 40%
Racine Head Start Community Needs Assessment June 2013
Page 18 Planning Council for Health and Human Services, Inc.
Need for Early Head Start
According to the Head Start website, Early Head Start “provides early, continuous, intensive and comprehensive child development and family support services to low-income infants and toddlers [under the age of three] and their families, and pregnant women and their families.” Early Head Start can be provided via center-based services, home-based services, family child care services, or a combination of both home-and center-based services. Currently, there are no Early Head Start services in Racine County. Screenings done by the School Readiness Coalition Pilot Project show the need for Early Head Start services in the City of Racine. The coalition released a preliminary report in June 2012 documenting the school readiness of children entering kindergarten in RUSD. The group found that, among a sample of 114 children who were screened at about age five, “4% showed a delay in communication, 4% in fine motor skills, and 1% in gross motor skills. The screening tool also identified between 3% and 7% of children needing to be monitored for possible delays in at least one of the five developmental areas” (PPF 2012). These screening results, along with the extremely high levels of child poverty and disability in the City of Racine, demonstrate the advisability of offering Early Head Start in Racine. Early Head Start services could also help meet many of the food, health and nutrition needs examined later in this report.
YoungStar
YoungStar is program of the Wisconsin Department of Children and Families that helps child care programs to provide effective early learning programs, with an emphasis on those receiving Wisconsin Shares funding. The program:
Evaluates and rates the quality of care given by child care providers; Helps parents choose the best child care for their kids; Supports providers with tools and training to deliver high quality early care; and Sets a consistent standard for child care quality.
In Wisconsin, 72% of children under age six have all available parents in the workforce. A large portion of those children are in out-of-home care, particularly in child care settings. YoungStar helps to ensure that state investments in child care services are going to programs that meet reasonable standards of quality. As of July 1, 2012, all providers who accept Wisconsin Shares subsidy payments are required to participate in YoungStar. Wisconsin Shares subsidy reimbursement levels are based on the child care provider's star rating in the following manner:
5 Star Provider - Meets highest levels of quality standards. Wisconsin Shares subsidy reimbursement is increased by 25%;
4 Star Provider - Meets elevated levels of quality standards. Wisconsin Shares subsidy reimbursement is increased by 5%;
3 Star Provider - Meets proficient levels of quality standards. Wisconsin Shares subsidy reimbursement remains the same;
2 Star Provider - Meets health and safety standards. Wisconsin Shares subsidy reimbursement is reduced by 5%; and
1 Star Provider - Not eligible for Wisconsin Shares subsidy reimbursement. These providers' child care licenses or certifications have been revoked, denied or suspended, or their Wisconsin Shares payments have been ended due to fraud or suspected fraud. (WDCF 2013)
Racine and Kenosha Counties together have just two child care providers that have been YoungStar rated with only one star, a qualification that makes those providers ineligible for Wisconsin Shares

Racine Head Start Community Needs Assessment June 2013
Page 19 Planning Council for Health and Human Services, Inc.
subsidy reimbursement. The majority of child care providers in the two counties are rated at the two-star level.
(WDCF March 2013)

Racine Head Start Community Needs Assessment June 2013
Page 20 Planning Council for Health and Human Services, Inc.
Dual-language learning
According to data from the Wisconsin Department of Public Instruction (DPI), in the 2012-1013 school year 12% (1,478) of students in the Racine Unified School District (RUSD) were limited English speakers whose primary language was Spanish and one percent (184) of RUSD students were limited English speakers with some language other than Spanish being their primary language. The table below shows the other languages spoken in RUSD.
March 2010 Census of (non-Spanish) Limited-English Proficient Pupils in RUSD Language Number of students
Albanian 3
American Sign Language 1
Arabic, Standard 19
Bulgarian 3
Chinese, Mandarin 2
Chinese, Other 8
Croatian 1
Czech 2
French 3
German 2
Greek 1
Gujarati 16
Hindi 13
Hmong 3
Ho-Chunk 1
Hungarian 2
Italian 5
Japanese 1
Kannada 1
Khmu 2
Korean 1
Lao 5
Malay 2
Malayalam 2
Norwegian 2
Panjabi, Western 13
Polish 10
Russian 4
Serbian 10
Sinhala 1
South Asian, Other 4
Tagalog 2
Tamil 1
Telugu 5
Thai 3
Urdu 7
Vietnamese 10 (Wisconsin DPI 2010)
Racine Head Start Community Needs Assessment June 2013
Page 21 Planning Council for Health and Human Services, Inc.
If these proportions are applied to the current population of children under five in the City of Racine, it can be estimated that nearly 800 of those children have Spanish as their primary language, and 66 speak some other non-English language as their primary language. Given the significant upward trend in the Hispanic/Latino population of Racine County, it can be expected that the number of Spanish-speaking children with limited English proficiency will increase in the next few years. All of these children would benefit from early education conducted in their primary language, as well as in English. This is known as dual-language learning, the goal of which is bilingual biliteracy. Such instruction places both native English and native Spanish speaking children in the same classroom. The teacher talks in both languages with the goal of making all the children bilingual. According to an article in the Racine Journal Times, studies show it’s better for Spanish-speaking students to receive instruction in their native language first, so they can learn and understand basic concepts like counting and translate it instead of simply memorizing terms. In 2011, RUSD had several dual-language classes for kindergartners through fifth grade. Standardized tests show RUSD students in these dual-language classes perform as well as other students at their schools.
Home-based learning
Under Wisconsin Statute 118.15(4), a parent or guardian has the right to select a home-based private educational program, commonly referred to as homeschooling, for his or her child or children, in order to comply with the compulsory school attendance law. Wisconsin Statute 115.001(3g) further states, "Home-based private educational program means a program of educational instruction provided to a child by the child's parent or guardian or by a person designated by the parent or guardian. An instructional program provided to more than one family unit does not constitute a home-based private educational program." Wisconsin Statute 118.165(1) specifies that a home-based private educational program must provide "… at least 875 hours of instruction each school year." In addition, the program must provide a "… sequentially progressive curriculum of fundamental instruction in reading, language arts, mathematics, social studies, science and health."
According to the Wisconsin Department of Public Instruction, 462 children were enrolled in the Racine Unified School District as being home-based learners in the 2011-2012 school year. That was 2.22 percent of total enrollment in the district. If this percentage is applied to the population of children under age five in the City of Racine, it can be assumed that approximately 147 children in the City of Racine might be candidates for the Early Head Start home-based model.
Year-round programming
There is much evidence that children who do not have structured programming during the summer experience negative consequences including weight gain and learning losses. Known as the “summer slide,” this is a phenomenon in which low-income children fall behind over the summer months because they lack access to programming during that time. While the parents of their wealthier counterparts in the middle and upper classes invest money in structured summer activities like sports, music, tutors and camp, the parents of low-income children simply cannot afford to do the same for their children.
A 2013 study found that in 1972, upper income Americans were spending five times as much per child as low-income families. By 2007 that gap had grown to nine to one. This study points out that beginning in the 1990s and continuing into the 2000s, parental spending on children changed significantly. In previous decades, the researchers found that parental spending was lowest for families with very young children or those of college age. However, in the 1990s and 2000s, this pattern reversed itself. Parental spending is now highest when children are either young or nearing leaving the household. According to the researchers, these results match recent evidence about childhood achievement showing the gap in test scores between children of parents at the 90th
Racine Head Start Community Needs Assessment June 2013
Page 22 Planning Council for Health and Human Services, Inc.
percentile of the income distribution and those at the 10th percentile has grown over time. (Kornrich and Furstenberg 2013). According to the National Summer Learning Association, research shows there are many negative consequences for youth who do not have access to structured summer programming. o Children gain weight two or three times faster during summer vacation than during the school year,
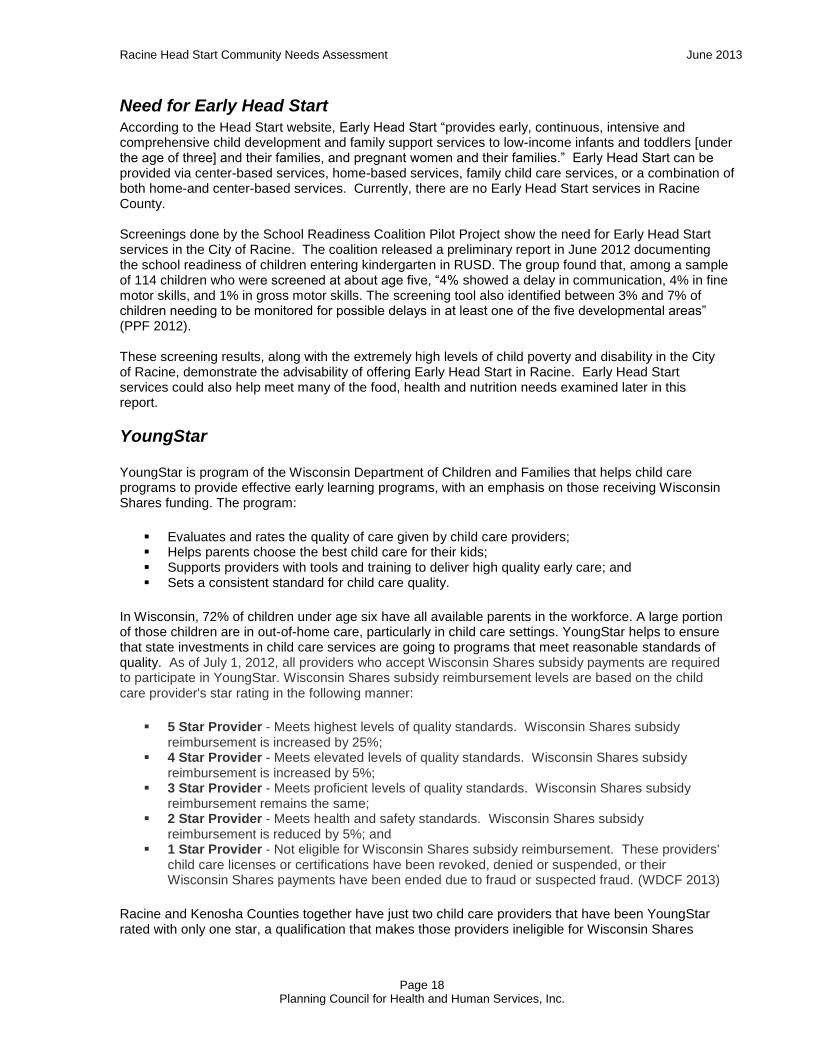
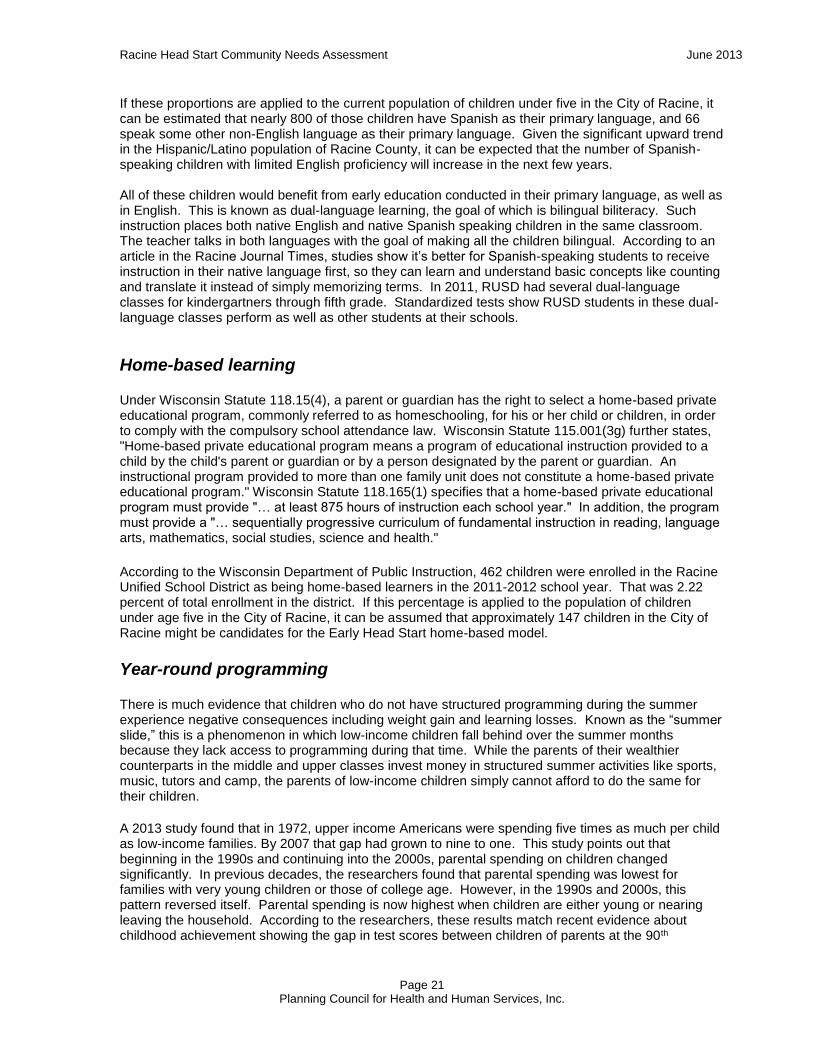
possibly because schools provide a structured environment where children are constantly supervised, have limited opportunities to eat, and get physical exercise a few times a week. In the summer, if they aren’t involved in a structured program, children have less supervision and more access to food. Also, low income children often lack safe access to outdoor play and exercise.
BMI of overweight children decreases more during school and increases more during summer
(NSLA 2009)
School does more to restrain the weight of overweight students; Hispanic & African-American students also benefit
(NSLA 2009)
Racine Head Start Community Needs Assessment June 2013
Page 23 Planning Council for Health and Human Services, Inc.
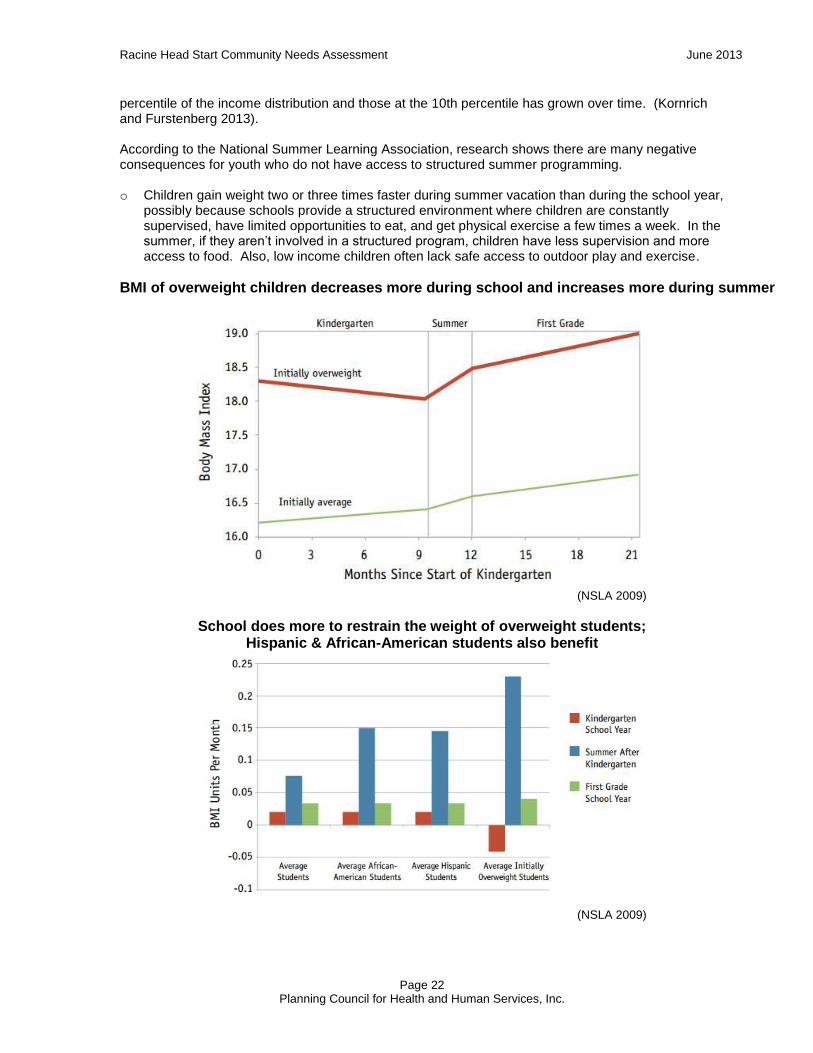
o Low-income youth suffer significantly from a loss of academic skills over the summertime and these losses are cumulative. Research shows that the achievement gap at 9th grade between high and low socioeconomic status (SES) children “mainly traces to differential summer learning over the elementary years. These early out-of-school summer learning differences, in turn, substantially account for achievement-related differences by family SES in high school track placements (college preparatory or not), high school noncompletion, and four-year college attendance” (Alexander 2007).
Middle & upper-income youth fare better in summer and their summer gains are cumulative
Disadvantaged youth by year Better-off youth by year
(NSLA 2009)
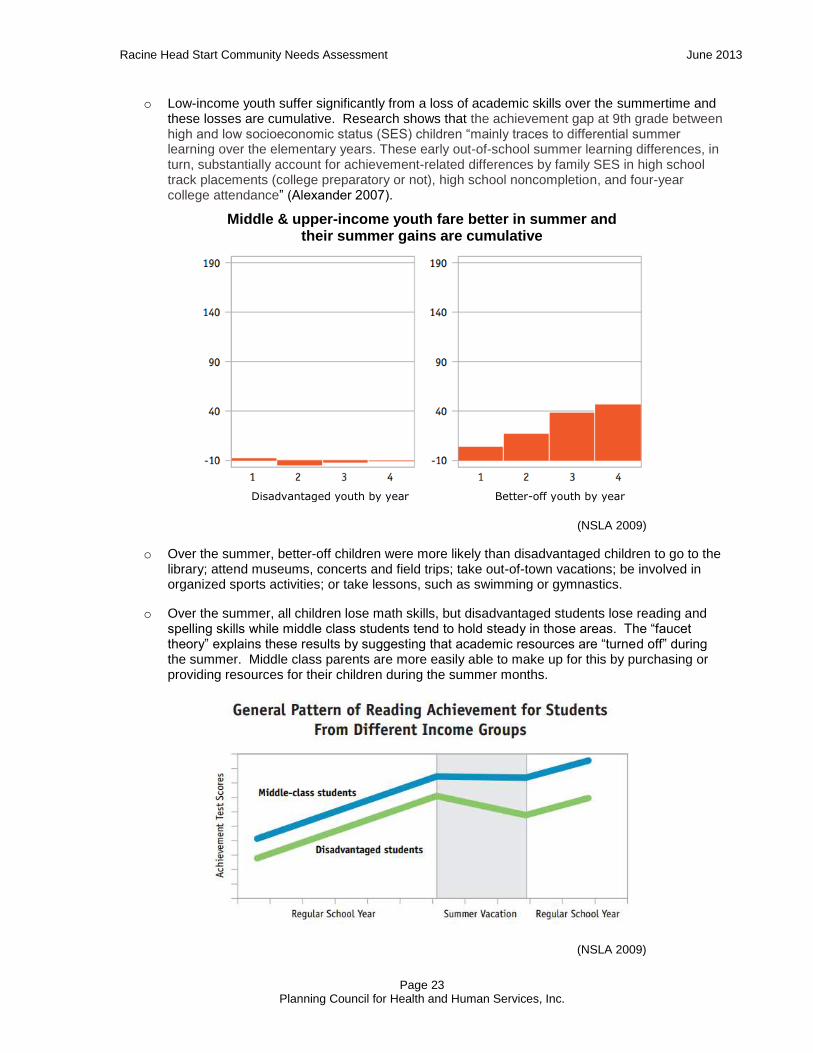
o Over the summer, better-off children were more likely than disadvantaged children to go to the library; attend museums, concerts and field trips; take out-of-town vacations; be involved in organized sports activities; or take lessons, such as swimming or gymnastics.
o Over the summer, all children lose math skills, but disadvantaged students lose reading and spelling skills while middle class students tend to hold steady in those areas. The “faucet theory” explains these results by suggesting that academic resources are “turned off” during the summer. Middle class parents are more easily able to make up for this by purchasing or providing resources for their children during the summer months.
(NSLA 2009)
Racine Head Start Community Needs Assessment June 2013
Page 24 Planning Council for Health and Human Services, Inc.
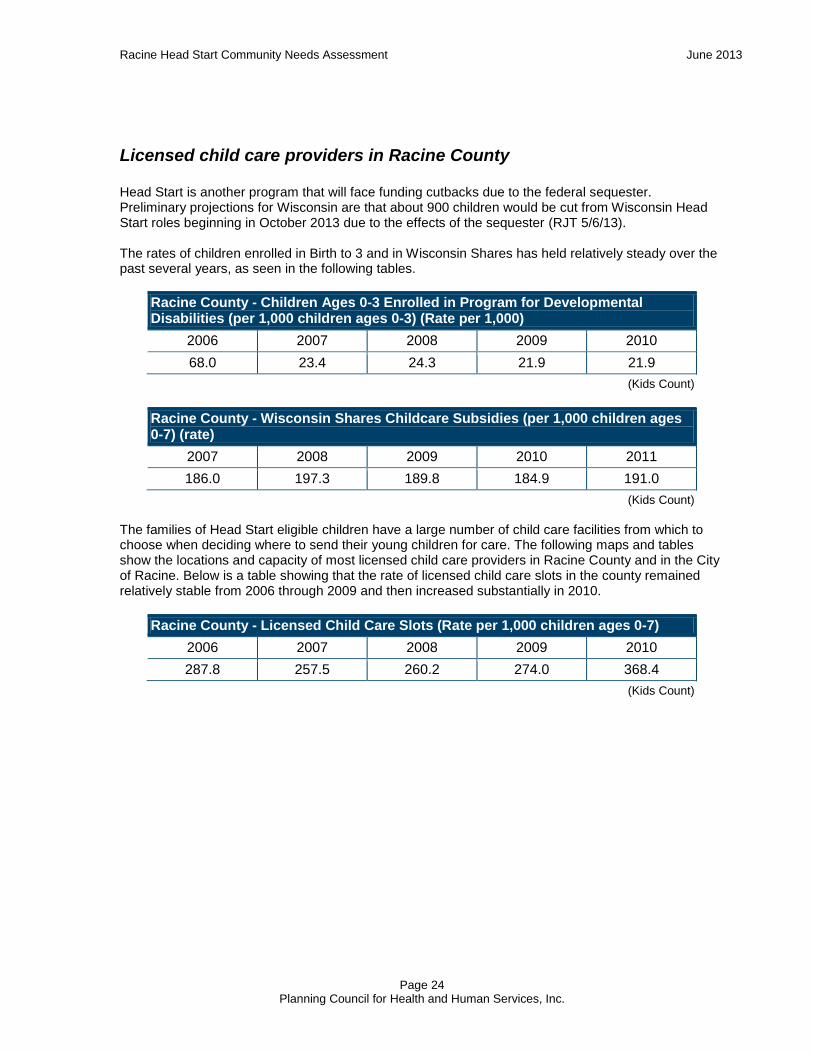
Licensed child care providers in Racine County
Head Start is another program that will face funding cutbacks due to the federal sequester. Preliminary projections for Wisconsin are that about 900 children would be cut from Wisconsin Head Start roles beginning in October 2013 due to the effects of the sequester (RJT 5/6/13). The rates of children enrolled in Birth to 3 and in Wisconsin Shares has held relatively steady over the past several years, as seen in the following tables.
Racine County - Children Ages 0-3 Enrolled in Program for Developmental Disabilities (per 1,000 children ages 0-3) (Rate per 1,000)
2006 2007 2008 2009 2010
68.0 23.4 24.3 21.9 21.9
(Kids Count)
Racine County - Wisconsin Shares Childcare Subsidies (per 1,000 children ages 0-7) (rate)
2007 2008 2009 2010 2011
186.0 197.3 189.8 184.9 191.0
(Kids Count)
The families of Head Start eligible children have a large number of child care facilities from which to choose when deciding where to send their young children for care. The following maps and tables show the locations and capacity of most licensed child care providers in Racine County and in the City of Racine. Below is a table showing that the rate of licensed child care slots in the county remained relatively stable from 2006 through 2009 and then increased substantially in 2010.
Racine County - Licensed Child Care Slots (Rate per 1,000 children ages 0-7)
2006 2007 2008 2009 2010
287.8 257.5 260.2 274.0 368.4
(Kids Count)
Racine Head Start Community Needs Assessment June 2013
Page 25 Planning Council for Health and Human Services, Inc.
Early education assets
Racine Head Start is funded to serve 694 children annually. The program serves low-income children and children with disabilities. In addition, up to 10% of participants can be children who are neither low-income nor disabled. The program operates at full capacity throughout the year. Birth to 3 is Wisconsin’s early intervention program for infants and toddlers with developmental delays and disabilities and their families; the program is overseen by the Wisconsin Department of Health Services. In Racine County, the Racine County Human Services is the lead agency for the program. According to the county website, eligibility is based on a diagnosed disability or significant delay in one or more areas of development and is not based on family income (some families may need to contribute to the cost of services). A team evaluates the child’s ability to:
Learn, also referred to as cognitive development; Move, see and hear, also referred to as physical motor development; Communicate, also referred to as speech and language development; Respond and relate to others, also referred to as social and emotional development; and Daily living needs, also referred to as adaptive development.
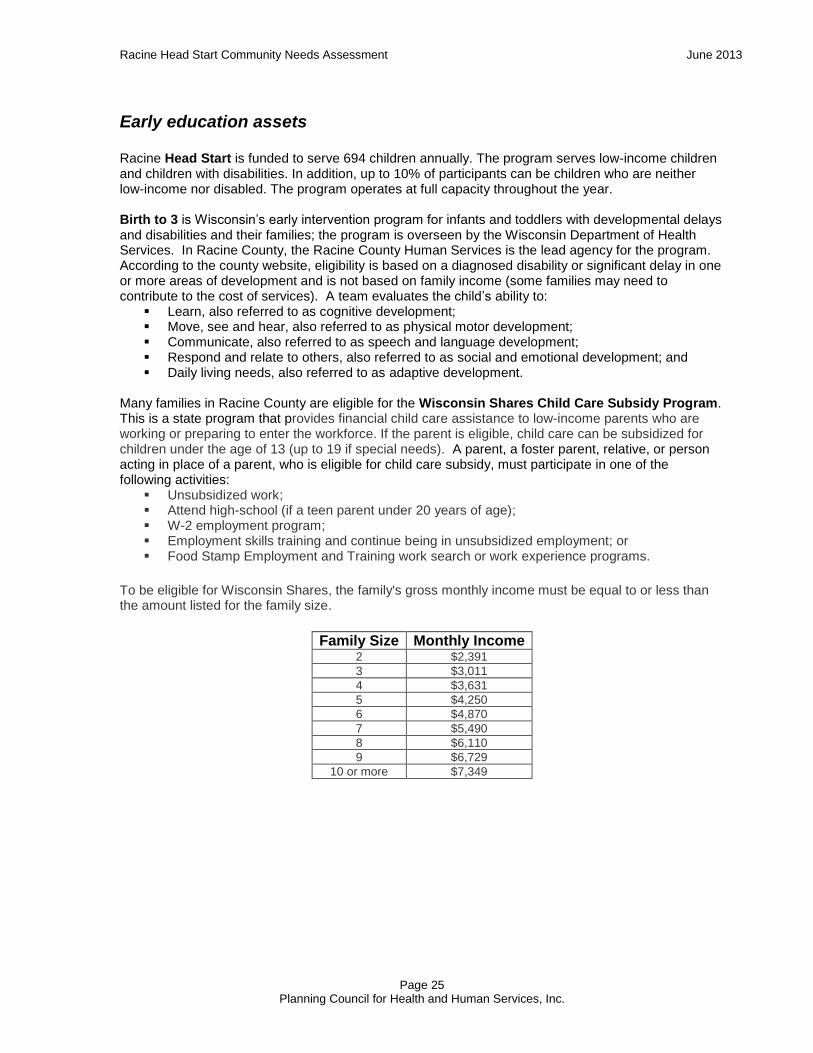
Many families in Racine County are eligible for the Wisconsin Shares Child Care Subsidy Program. This is a state program that provides financial child care assistance to low-income parents who are working or preparing to enter the workforce. If the parent is eligible, child care can be subsidized for children under the age of 13 (up to 19 if special needs). A parent, a foster parent, relative, or person acting in place of a parent, who is eligible for child care subsidy, must participate in one of the following activities:
Unsubsidized work; Attend high-school (if a teen parent under 20 years of age); W-2 employment program; Employment skills training and continue being in unsubsidized employment; or Food Stamp Employment and Training work search or work experience programs.
To be eligible for Wisconsin Shares, the family's gross monthly income must be equal to or less than the amount listed for the family size.
Family Size Monthly Income 2 $2,391
3 $3,011
4 $3,631
5 $4,250
6 $4,870
7 $5,490
8 $6,110
9 $6,729
10 or more $7,349
Racine Head Start Community Needs Assessment June 2013
Page 26 Planning Council for Health and Human Services, Inc.
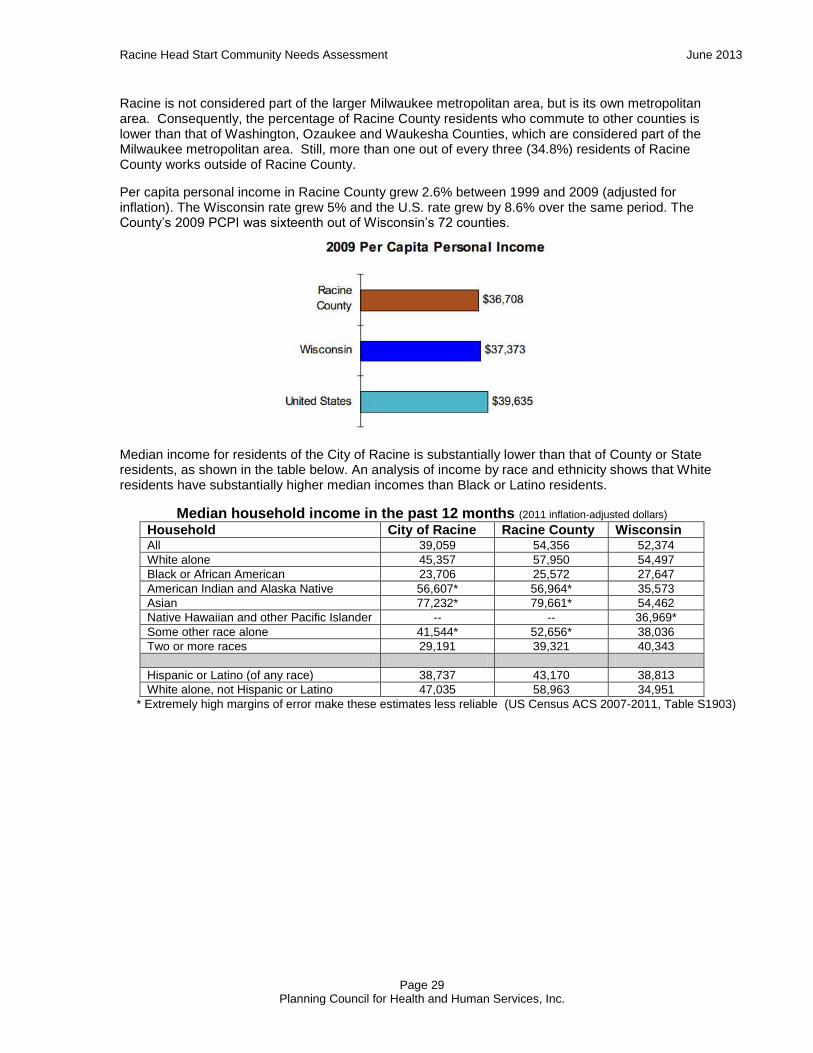
Racine County families have access to the Family Support Program, a state-funded program that helps families meet the needs of children with disabilities. Some of the services offered include child care, recreation, adaptive equipment, counseling, special medical supplies and therapeutic activities. Funding is limited and so families may be placed on a waiting list. In Racine and Kenosha, the agency that operates the program is Developmental Disabilities Information Services. The Community Options Program is another similar program administered by the same agency that supports services that will allow a child with a disability to remain in the community. (Compass Wisconsin)
The Katie Beckett Program is a special eligibility process that allows certain children with long-term disabilities, mental illness, or complex medical needs, living at home with their families, to obtain a Wisconsin ForwardHealth Medicaid card. Children, who are not eligible for other Medicaid programs because the income or assets of their parents are too high, may be eligible for Medicaid through the Katie Beckett Program. A child may be eligible for this source of Medicaid even if they are currently covered under a private health insurance policy. (Compass Wisconsin) In focus groups conducted with Racine Head Start parents by students from UW-Parkside, participants mentioned that there are programs available to help parents.
“They’re starting to do more things/programs for fathers with children. ‘Daddy’s Day Out’ is a day for children to spend doing activities….[This has a] very positive impact.” -- Racine Head Start Parent
Participants in the focus group also said they had access to some educational resources.
“There has been great collaboration with community partners and the school district what are allowing families who may be in poverty to access educational resources for children who will benefit from early intervention.” – Racine Head Start Parent.
Teachers were mentioned as a crucial connection between the classroom and the home. The attitudes of the teacher encourage parental involvement. Providing verbal reminders as well as written communication would be more inclusive of parents and children as well as insuring a clear understanding of the information distributed. Phone call reminders would be valuable, as well.
“People sometimes are literally not aware that such resources exist or could be accessible.” – Racine Head Start Parent
For maps and lists of child care centers in Racine County, see Appendices D, E and F.

Racine Head Start Community Needs Assessment June 2013
Page 27 Planning Council for Health and Human Services, Inc.
Employment Needs & Assets The period from the end of 2007 through mid-2009 may be primarily remembered for the “Great Recession” that negatively impacted employment and housing throughout the United States. As of this writing, there remain economic indicators that have not yet returned to their pre-recession levels. Unemployment rates in Wisconsin peaked in June and July of 2009 at 9.2%, and that rate was matched again in January 2010. The subsequent recovery has been called a “jobless” recovery, with the number of jobs in Wisconsin still more than four percent below pre-recession levels nearly two years after reaching peak unemployment. The information in this section of the report is taken from the Wisconsin Department of Workforce Development’s Racine County Workforce Profile 2011, unless stated otherwise.
Unemployment Unemployment in Racine County has been higher than the state rate for at least two decades, and the rate in the City of Racine always exceeds the county rate by three to four percentage points. The jobless rates released by the Wisconsin Department of Workforce Development for May 2013 showed that unemployment in the City of Racine was 11.6% for the month, up from 11.1% the previous May. This was the second-highest rate in the state, after Beloit. For Racine County, the May 2013 unemployment rate was 8.4%, up slightly from 8.2% the previous May (Racine Journal Times 2013).
Jobless rates do not reflect underemployment, or people working part-time but wanting full-time work. The labor force participation rate is one way to understand how many people have simply dropped out of the labor force. A high labor force participation rate is usually an indication that jobs
are plentiful, pulling formerly unemployed individuals into the labor force. As seen in the graph below, the labor force participation rate for the entire country has been falling throughout the 2000’s. The contraction of the labor market over the course of the decade has caused many unemployed workers to quit looking for jobs. When these individuals drop out of the labor force, it lowers the unemployment rate but their absence can be observed through the labor force participation rate.
Racine County’s labor force participation rate lower than state average
Employment & Income
Manufacturing is still the largest Racine employer, both by number of employees and by payroll. This results in comparatively high wages in the county, which have a positive economic impact. However, the recessions of the 2000s hit the manufacturing sector very hard, resulting in the elimination of many high wage jobs in this sector. There was a bright note in 2010, when Racine’s manufacturing job base

Racine Head Start Community Needs Assessment June 2013
Page 28 Planning Council for Health and Human Services, Inc.
netted 95 new jobs, at a time when Wisconsin overall experienced a net loss of 1.25 percent in the manufacturing sector. The Workforce Development report notes that Racine’s high average manufacturing wage can be explained, in part, by very high compensation paid to executive staff of large manufacturing corporations headquartered in the county. High public administration wages do not impact the average county wage much because the sector only makes up 5% of the county’s total employment base. More recent increases in jobs in the service sector, with its comparatively low wages, cannot make up for these lost manufacturing jobs.
Most Racine industries pay below state average wages
Nursing and residential care facilities show largest recent job increases
Racine Head Start Community Needs Assessment June 2013
Page 29 Planning Council for Health and Human Services, Inc.
Racine is not considered part of the larger Milwaukee metropolitan area, but is its own metropolitan area. Consequently, the percentage of Racine County residents who commute to other counties is lower than that of Washington, Ozaukee and Waukesha Counties, which are considered part of the Milwaukee metropolitan area. Still, more than one out of every three (34.8%) residents of Racine County works outside of Racine County.
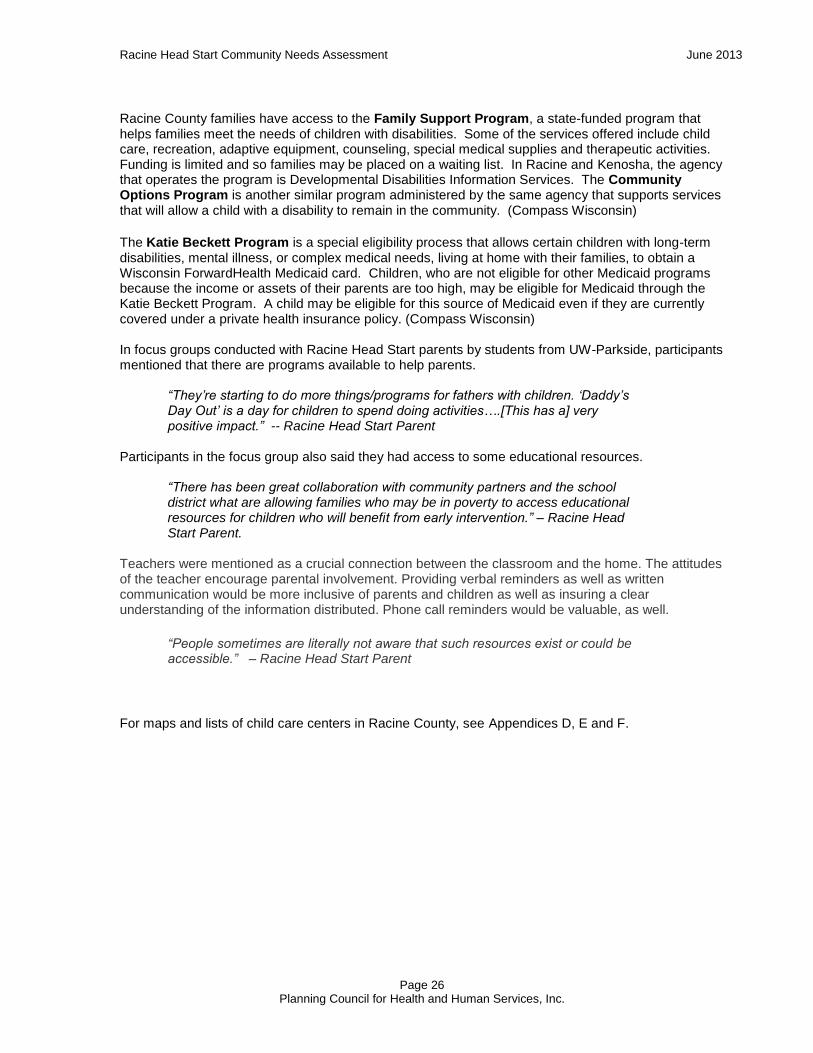
Per capita personal income in Racine County grew 2.6% between 1999 and 2009 (adjusted for inflation). The Wisconsin rate grew 5% and the U.S. rate grew by 8.6% over the same period. The County’s 2009 PCPI was sixteenth out of Wisconsin’s 72 counties.
Median income for residents of the City of Racine is substantially lower than that of County or State residents, as shown in the table below. An analysis of income by race and ethnicity shows that White residents have substantially higher median incomes than Black or Latino residents.
Median household income in the past 12 months (2011 inflation-adjusted dollars)
Household City of Racine Racine County Wisconsin All 39,059 54,356 52,374
White alone 45,357 57,950 54,497
Black or African American 23,706 25,572 27,647
American Indian and Alaska Native 56,607* 56,964* 35,573
Asian 77,232* 79,661* 54,462
Native Hawaiian and other Pacific Islander -- -- 36,969*
Some other race alone 41,544* 52,656* 38,036
Two or more races 29,191 39,321 40,343
Hispanic or Latino (of any race) 38,737 43,170 38,813
White alone, not Hispanic or Latino 47,035 58,963 34,951
* Extremely high margins of error make these estimates less reliable (US Census ACS 2007-2011, Table S1903)
Racine Head Start Community Needs Assessment June 2013
Page 30 Planning Council for Health and Human Services, Inc.
Employment assets and recommendations
RKCAA Head Start parents in focus groups said a lack of employment makes it difficult for people in poverty to succeed. Some of the participants mentioned specific challenges facing people in poverty who are seeking employment, and specific programs they would like to see.
“I believe one of the main issues is the lack of suitable employment for many who do not have a specific education and training background.” – Racine Head Start Parent
“[We need] more programming like Head Start, job training to lead to more jobs.” – Racine Head Start Parent
“Computer classes for children and adults and access to computers [are needed].” – Racine Head Start Parent
“Computer classes offered to parents to improve accessibility in communication. CPR classes to inform parents of proper protocols in emergencies.” – Racine Head Start Parent
For the Spanish- Speaking parents the issue of the language barrier is very prevalent. The lack of information and Spanish-speaking teachers is also a problem.
“Communication. People are not aware of the various programs that they qualify for because they don’t speak the language.” – Racine Head Start Parent
“It is difficult to gain important information through primarily written means and not in one’s own language.” – Racine Head Start Parent
In the focus groups, people said most parents don’t know what information is relevant for them to use or if it pertains to them. If they knew what resources were available and accessible to them, they would be more educated and take advantage of those resources. Also, an overall issue is that no one knows where exactly to locate certain information regarding programs and services. Better communication needs to be addressed in order to help the community.
“[There is] lack of knowledge of what is available and people available to answer questions in their own language.” – Racine Head Start Parent
“Many in the community will not go out to look for available services so I think it’s key that the services are marketed to those that need them the most.” – Racine Head Start Parent
Racine Head Start Community Needs Assessment June 2013
Page 31 Planning Council for Health and Human Services, Inc.
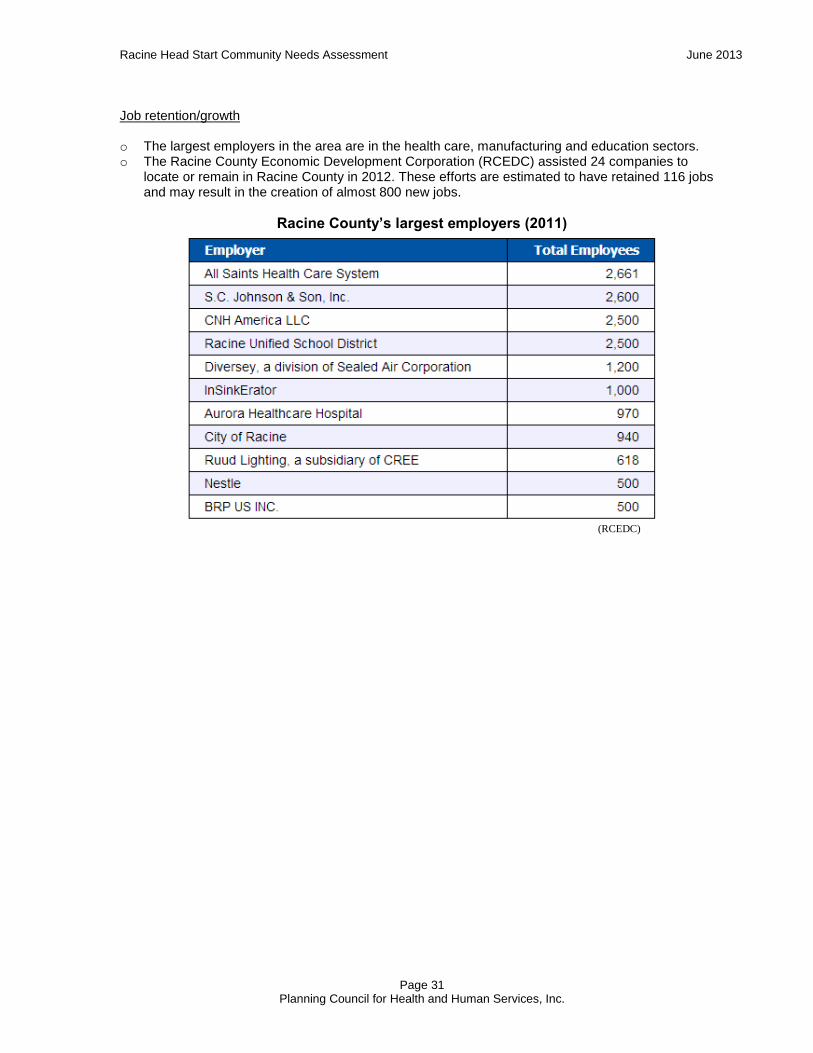
Job retention/growth o The largest employers in the area are in the health care, manufacturing and education sectors. o The Racine County Economic Development Corporation (RCEDC) assisted 24 companies to
locate or remain in Racine County in 2012. These efforts are estimated to have retained 116 jobs and may result in the creation of almost 800 new jobs.
Racine County’s largest employers (2011)
(RCEDC)
Racine Head Start Community Needs Assessment June 2013
Page 32 Planning Council for Health and Human Services, Inc.
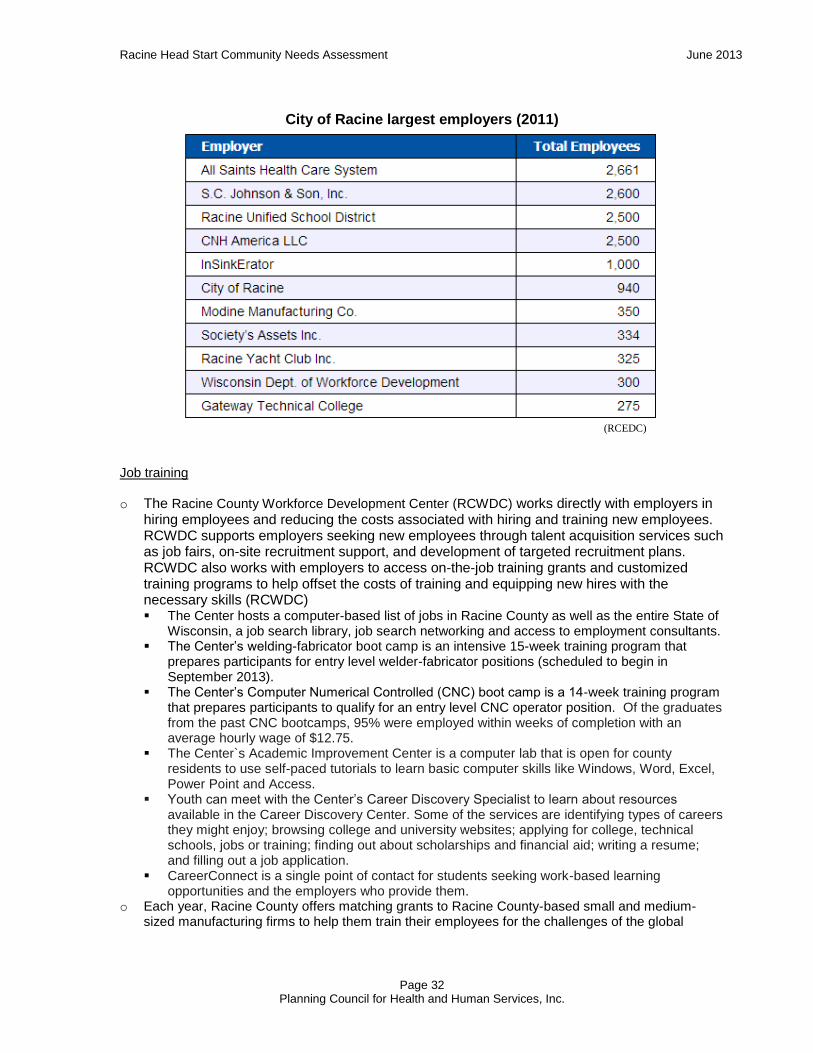
City of Racine largest employers (2011)
(RCEDC)
Job training
o The Racine County Workforce Development Center (RCWDC) works directly with employers in hiring employees and reducing the costs associated with hiring and training new employees. RCWDC supports employers seeking new employees through talent acquisition services such as job fairs, on-site recruitment support, and development of targeted recruitment plans. RCWDC also works with employers to access on-the-job training grants and customized training programs to help offset the costs of training and equipping new hires with the necessary skills (RCWDC) The Center hosts a computer-based list of jobs in Racine County as well as the entire State of
Wisconsin, a job search library, job search networking and access to employment consultants. The Center’s welding-fabricator boot camp is an intensive 15-week training program that
prepares participants for entry level welder-fabricator positions (scheduled to begin in September 2013).
The Center’s Computer Numerical Controlled (CNC) boot camp is a 14-week training program that prepares participants to qualify for an entry level CNC operator position. Of the graduates from the past CNC bootcamps, 95% were employed within weeks of completion with an average hourly wage of $12.75.
The Center`s Academic Improvement Center is a computer lab that is open for county residents to use self-paced tutorials to learn basic computer skills like Windows, Word, Excel, Power Point and Access.
Youth can meet with the Center’s Career Discovery Specialist to learn about resources available in the Career Discovery Center. Some of the services are identifying types of careers they might enjoy; browsing college and university websites; applying for college, technical schools, jobs or training; finding out about scholarships and financial aid; writing a resume; and filling out a job application.
CareerConnect is a single point of contact for students seeking work-based learning opportunities and the employers who provide them.
o Each year, Racine County offers matching grants to Racine County-based small and medium-sized manufacturing firms to help them train their employees for the challenges of the global
Racine Head Start Community Needs Assessment June 2013
Page 33 Planning Council for Health and Human Services, Inc.
economy. They also offer similar grants to small and medium-sized minority-owned businesses. (RCE 2012)
o Since 2008, Racine County has had $250,000 invested in Wisconsin Women’s Business Initiative Corporation (WWBIC), to be lent by WWBIC to qualifying Racine County-based small and medium-sized businesses. (RCE 2012)
o The county committed to provide RCEDC a million dollars per year for four years, for the county’s Revolving Loan Fund. (RCE 2012)
o Gateway Technical College serves more than 25,000 students in the Southeastern Wisconsin counties of Kenosha, Racine and Walworth, specializing in career and technical education.
The college’s Workforce and Economic Development Division (WEDD) helps businesses
successfully compete in the global economy by offering innovative training solutions for
employers and incumbent workers in a variety of disciplines. From basic skills, to
technical skills and even customized training programs, WEDD offers an integrated
education and workforce training system that produces highly skilled workers. o Racine Area Manufacturers and Commerce (RAMAC) provides training services that include
supervisory and leadership training, computer training, forklift certification, safety, and more.
Racine Head Start Community Needs Assessment June 2013
Page 34 Planning Council for Health and Human Services, Inc.
This page has been left blank intentionally
Racine Head Start Community Needs Assessment June 2013
Page 35 Planning Council for Health and Human Services, Inc.
Housing Needs & Assets
Rental Housing
Stable housing has become increasingly difficult for families to maintain recently, in part due to the after effects of the housing collapse and foreclosure crisis. Racine children eligible for Head Start are more likely to be living in rental housing than in homes owned by their families. More than two-thirds (69.8%) of Racine County households live in housing they own; that percentage drops to 56.2% of households in the City of Racine (ACS 2007-2011). Rental payments for nearly half of low-income residents in the city of Racine consume more than 30% of their income, the benchmark for what is considered affordable rent (WCCF 2011). Households that spend more than 30% of their income on housing have less money available for other important expenses, like utilities, food and medications.
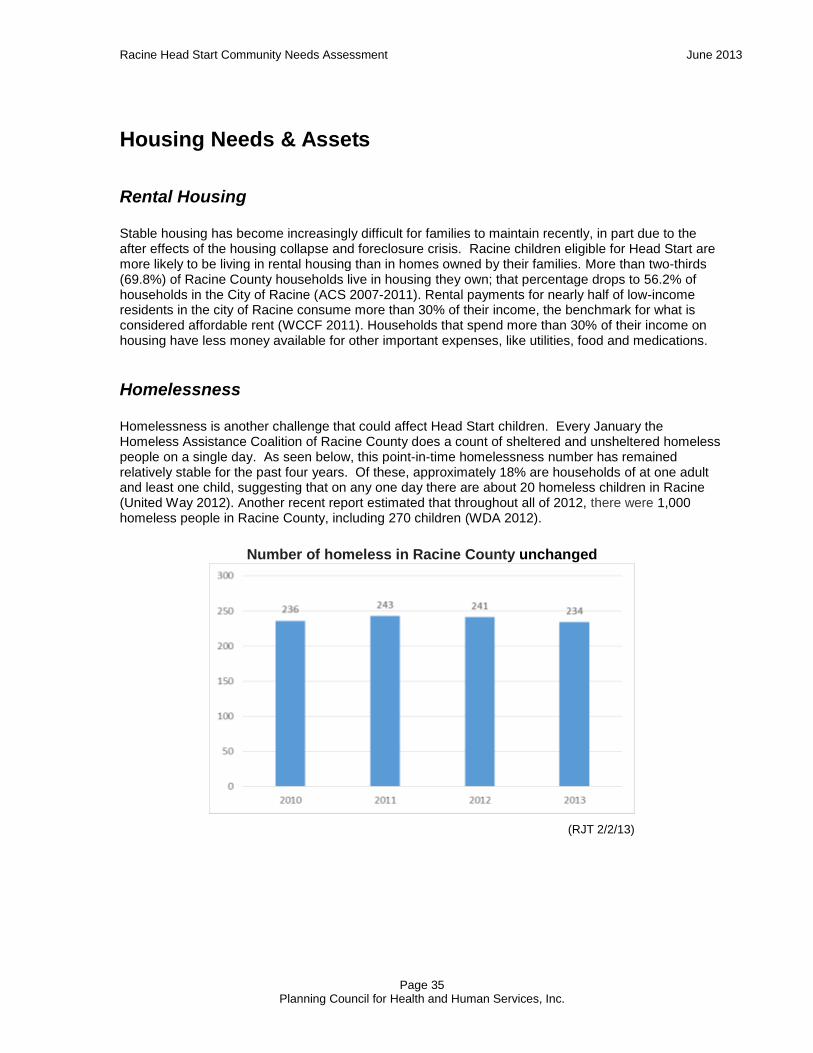
Homelessness Homelessness is another challenge that could affect Head Start children. Every January the Homeless Assistance Coalition of Racine County does a count of sheltered and unsheltered homeless people on a single day. As seen below, this point-in-time homelessness number has remained relatively stable for the past four years. Of these, approximately 18% are households of at one adult and least one child, suggesting that on any one day there are about 20 homeless children in Racine (United Way 2012). Another recent report estimated that throughout all of 2012, there were 1,000 homeless people in Racine County, including 270 children (WDA 2012).
Number of homeless in Racine County unchanged
(RJT 2/2/13)
Racine Head Start Community Needs Assessment June 2013
Page 36 Planning Council for Health and Human Services, Inc.
Homeless children According to the Wisconsin Division of Housing, the number of children in shelters is increasing slightly but the number in transitional housing is decreasing. One reason given by the Division for this shift may be that many families with young children are being diverted from transitional housing programs into the Rapid Re-housing program. Another reason given is that families may be staying longer in transitional housing, causing a backlog whereby fewer families can get into transitional housing and so they remain in shelters. Although it was very successful, helping 97% of those facing homelessness and 91% of those who were actually homeless get placed in permanent housing, the federal funding ended in September 2012 (WDA 2012). Since then, existing Emergency Solutions Grant (ESG) funds have been eligible for “Rapid Re-housing.”
Homelessness and domestic violence
Another homeless trend in Wisconsin is a significant increase in the numbers of people who are becoming homeless due to domestic violence. From 2011 to 2012, homeless individuals in this category increased 18% (WDA 2012). Due to privacy provisions, many homeless victims of domestic violence are not counted in the State of Homelessness in Wisconsin report, because shelters serving domestic violence victims do not use the same reporting system. Nonetheless, increasing numbers of clients in mainstream shelters report that they are victims of domestic violence, not an uncommon trend during difficult economic times (USA Today 4/30/12). According to the Wisconsin Division of Housing, this the fastest-growing subpopulation of clients in Wisconsin’s residential homeless programs, nearly all of them women, many with children who accompany them in the shelters. “It is difficult to tell from existing data whether or not this represents an actual sharp and ongoing increase in the number of women being abused, or a change in reporting practices. In recent years, homeless service providers have been more diligent about asking their clients whether or not they experienced domestic violence. At the same time, anecdotal evidence from homeless service providers suggests that they are indeed seeing an upswing in the number of domestic violence victims.” (WDA 2012)
Effects of unstable housing on children
For Head Start children, unstable housing situations faced by their parents could have negative effects. One recent study found that children living in poverty who also move frequently are more likely to exhibit behavioral problems. As reported by MedLine Plus, “Among the children in the study who moved three or more times, 44% were poor. These children had more attention problems, anxiety or depression, and aggressiveness and hyperactivity at age 5 than those who had moved fewer times or never moved.” (MedLine 2013)
Racine Head Start Community Needs Assessment June 2013
Page 37 Planning Council for Health and Human Services, Inc.
Housing assets Government programs meant to assist individuals to find affordable housing have huge waiting lists. The waiting list of the Housing Authority Racine County (HARC) has 1,217 people on it and has been closed since January 2012 (RJT 4/7/13). Approximately 1,500 families in Racine County receive housing vouchers, totaling about $7 million annually. Federal assistance for agencies like HARC will be less in 2013 than it has been recently. From 2009 – 2012, the $27 million in stimulus funds known as Homeless Prevention and Rapid Re-housing (HPRP) were made available, but that program ended in 2012 and further federal funding is not likely (WDA 2012). In addition to letting funding lapse for programs like HPRP, the sequester (billions of dollars in mandatory federal budget cuts) is expected to further reduce funding available for ongoing programs and operations of agencies like HARC. Housing authorities across the country are expecting their administrative budgets to be cut by 5.9% for fiscal year 2013, which starts in September (RJT 4/7/13). Individuals with no place to stay have access to several homeless shelters in Racine County, including: SAFE Haven of Racine, Inc. 1030 Washington Ave. Racine, WI 53403
Transitional Living Program shelters homeless young adults ages 18 through 21 in need of housing, education, life skills training, and health services. Participants identify their strengths, set goals and implement their plans to attain those goals.
The SAFE Haven Youth Shelter provides food, clothing, shelter, family mediation, crisis intervention and case management services to runaway, homeless and youth in crises ages 10 through 17.
Homeless Assistance Leadership Organization, Inc. (HALO) 2000 De Koven Avenue Racine, WI 53403
The Homeless Assistance Leadership Organization, Inc. (HALO) is a 120 bed emergency shelter. HALO meets emergency shelter needs for all men, women and children who are experiencing homelessness, coordinates supportive services that help homeless adults become self-sufficient, provides community leadership to prevent chronic homelessness and ensures children get positive support through stable living and learning environments. HALO also leases 20 independent apartments in Racine for families transitioning from homelessness to independence.
The Children’s Program serves children from birth to 18 years old and families. In 2006, HALO served over 200 children. The program assists parents in identifying and overcoming obstacles so that children experiencing homelessness gain support and the necessary resources to succeed. The children either reside at HALO homeless shelter or are a part of our Transitional Housing Program (THP) or are in our Outreach Program. Families complete an individual success plan to determine goals.
Racine Head Start Community Needs Assessment June 2013
Page 38 Planning Council for Health and Human Services, Inc.
Transitional Living Center Shelter Program 482 South Pine Street Burlington, WI 53105 http://tlcburlington.com/
TLC is able to house 15-20 adults and children Women's Resource Center of Racine Safe Emergency Shelter and Continuum of Safety Services (does not publish address for client privacy reasons) http://www.wrcracine.com/
The shelter is an eight bedroom, 32 bed home with plenty of community living spaces. Homeless Assistance Coalition of Racine County http://www.facebook.com/pages/Homeless-Assistance-Coalition-of-Racine-County-HAC/127968343885958
The Homeless Assistance Coalition aims to assist low income, at-risk, and homeless individuals and families in Racine County. The Coalition is made up of many partner organizations that provide services including shelter, rental and energy assistance, and healthcare to eligible applicants. The coordination and ease of accessibility of services are the Coalition's main goals.

Racine Head Start Community Needs Assessment June 2013
Page 39 Planning Council for Health and Human Services, Inc.
Health/Nutrition Needs & Assets
Healthy growth and development
Because early growth and development have a profound effect on health across the lifespan, the Healthier Wisconsin 2020 plan has several objectives related to this area, including goals for reducing racial and ethnic disparities.
Birth to three
To increase the proportion of children who receive periodic developmental screening and individualized interventions, the Healthier Wisconsin 2020 plan advocates increasing the number of children in the Birth-to Three program. According to the Kids Count Data Center, 21.9 per one thousand Racine County children ages 0-3 are enrolled in the program, making Racine the 54th out of 72 Wisconsin counties for this measure.
Pre- and inter-conception care Research shows that low birth weight babies are at a higher risk for death before the age of one (infant mortality) and also for developmental problems which can affect them their entire lives, such as delayed speech, difficulty paying attention, hyperactivity, and lower IQ” (United Way 2012) . As stated in a recent United Way of Racine report, “Women who do not receive prenatal care (medical care before giving birth) are at greater risk for having a low birthweight baby. Prenatal care also improves birth outcomes by linking women with nutrition and smoking cessation information. The earlier the prenatal care, the better the life chances are for newborns” (United Way 2012). In Racine County, the percentage of pregnant women who receive prenatal care during their first trimester is below the state average.
(United Way 2012)
Racine Head Start Community Needs Assessment June 2013
Page 40 Planning Council for Health and Human Services, Inc.
Infant mortality and low birthweight disparities
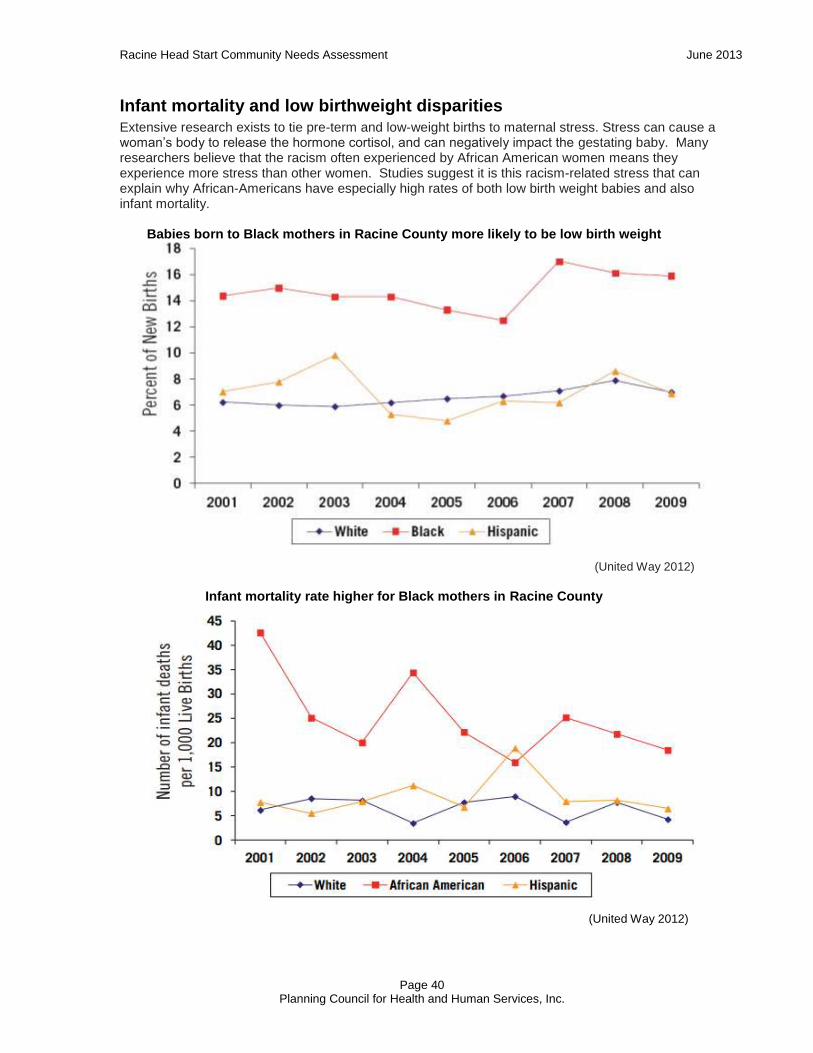
Extensive research exists to tie pre-term and low-weight births to maternal stress. Stress can cause a woman’s body to release the hormone cortisol, and can negatively impact the gestating baby. Many researchers believe that the racism often experienced by African American women means they experience more stress than other women. Studies suggest it is this racism-related stress that can explain why African-Americans have especially high rates of both low birth weight babies and also infant mortality.
Babies born to Black mothers in Racine County more likely to be low birth weight
(United Way 2012)
Infant mortality rate higher for Black mothers in Racine County
(United Way 2012)
Racine Head Start Community Needs Assessment June 2013
Page 41 Planning Council for Health and Human Services, Inc.
The good news is that in early 2013, several Racine initiatives that are working to reduce negative birth outcomes received significant funding. The Wisconsin Partnership Program has pledged $45,000 to each of three Racine projects aimed at improving support for African American women to ultimately eliminate the racial disparities in birth outcomes in Racine. These projects are:
Focus on Fathers Initiative: increasing father involvement in the lives of their children;
Centering Pregnancy Program: providing health assessment, education, and support in prenatal care; and
Reducing African American Infant Birth Disparities through Decreased Prison Recidivism and Increased Living-Wage Employment of Mothers and Fathers: addressing problems of repeat imprisonment and its effect on family stability (Racine LIHF).
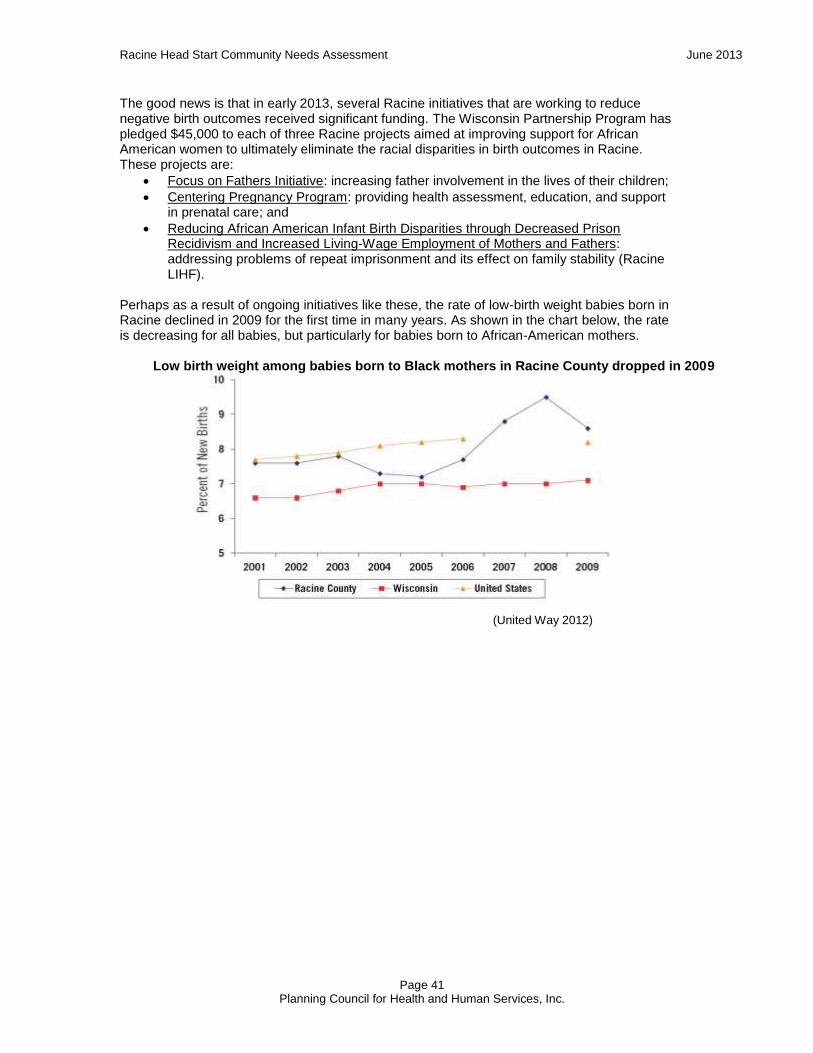
Perhaps as a result of ongoing initiatives like these, the rate of low-birth weight babies born in Racine declined in 2009 for the first time in many years. As shown in the chart below, the rate is decreasing for all babies, but particularly for babies born to African-American mothers.
Low birth weight among babies born to Black mothers in Racine County dropped in 2009
(United Way 2012)
Racine Head Start Community Needs Assessment June 2013
Page 42 Planning Council for Health and Human Services, Inc.
Breastfeeding for infants
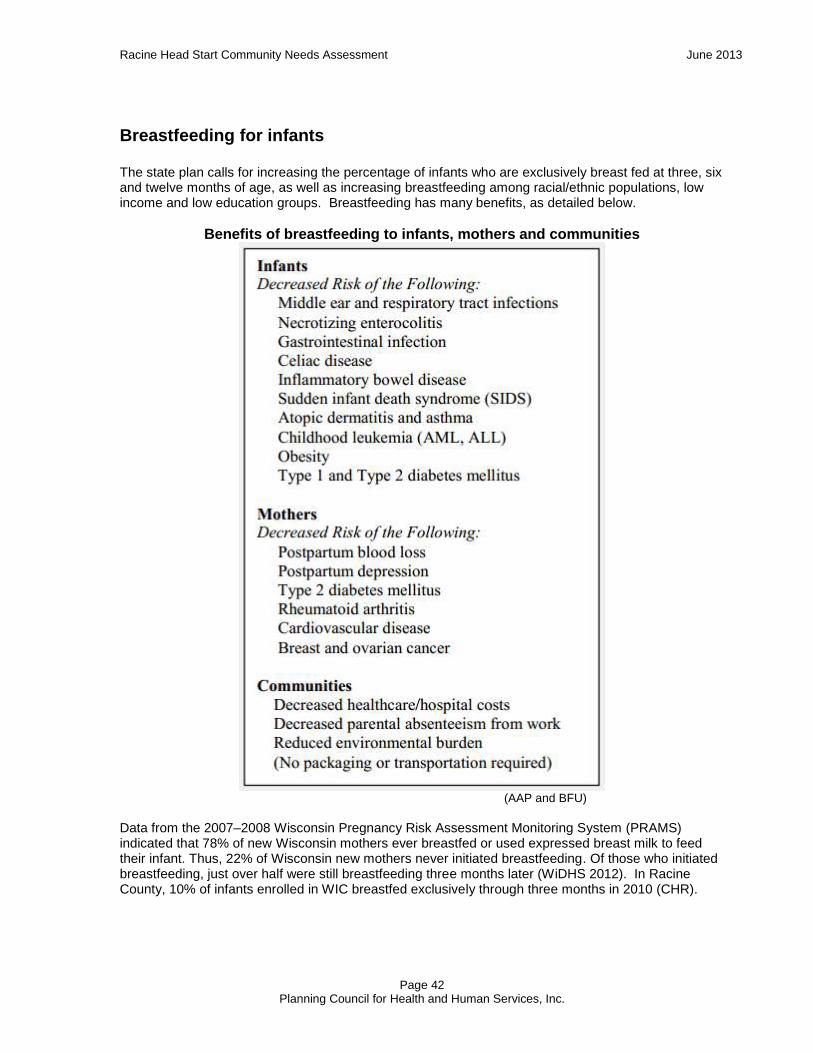
The state plan calls for increasing the percentage of infants who are exclusively breast fed at three, six and twelve months of age, as well as increasing breastfeeding among racial/ethnic populations, low income and low education groups. Breastfeeding has many benefits, as detailed below.
Benefits of breastfeeding to infants, mothers and communities
(AAP and BFU)
Data from the 2007–2008 Wisconsin Pregnancy Risk Assessment Monitoring System (PRAMS) indicated that 78% of new Wisconsin mothers ever breastfed or used expressed breast milk to feed their infant. Thus, 22% of Wisconsin new mothers never initiated breastfeeding. Of those who initiated breastfeeding, just over half were still breastfeeding three months later (WiDHS 2012). In Racine County, 10% of infants enrolled in WIC breastfed exclusively through three months in 2010 (CHR).
Racine Head Start Community Needs Assessment June 2013
Page 43 Planning Council for Health and Human Services, Inc.
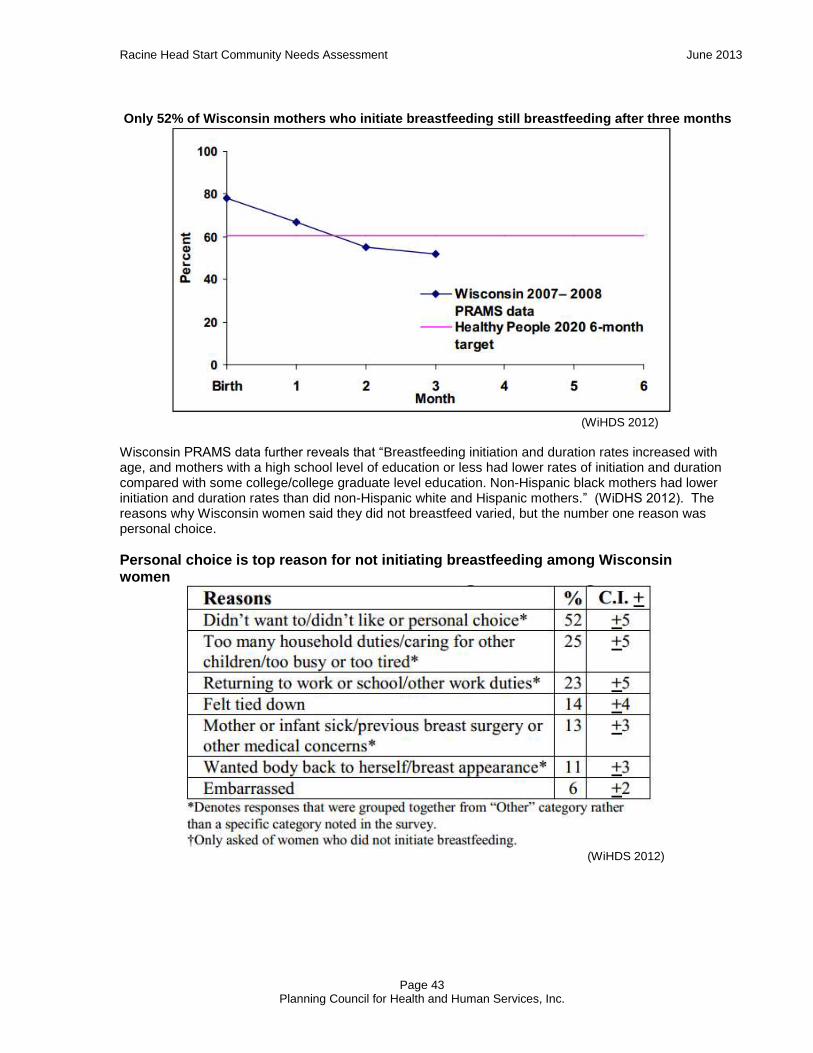
Only 52% of Wisconsin mothers who initiate breastfeeding still breastfeeding after three months
(WiHDS 2012)
Wisconsin PRAMS data further reveals that “Breastfeeding initiation and duration rates increased with age, and mothers with a high school level of education or less had lower rates of initiation and duration compared with some college/college graduate level education. Non-Hispanic black mothers had lower initiation and duration rates than did non-Hispanic white and Hispanic mothers.” (WiDHS 2012). The reasons why Wisconsin women said they did not breastfeed varied, but the number one reason was personal choice.
Personal choice is top reason for not initiating breastfeeding among Wisconsin women
(WiHDS 2012)

Racine Head Start Community Needs Assessment June 2013
Page 44 Planning Council for Health and Human Services, Inc.
Asthma
Asthma is one of the most common chronic childhood diseases and is a leading cause in school absenteeism. In Wisconsin, asthma is an important public health issue and has routinely been a high priority in state and federal public health plans. In 2009, 9.7% of children in Wisconsin had been diagnosed with asthma in the past and 6.9% had current asthma. Racine County has a higher rate of asthma hospitalizations compared to the overall state rate. While there is no cure for asthma it can be controlled through short- and long-acting medications as well as reducing exposure to asthma triggers such as pollution, seasonal allergies, smoke, dandruff, and cockroaches (RCEHP 2012).
Racine County asthma hospitalization rate higher than the overall state rate*
(Racine County Environmental Health Profile, 2012)
* Rates are based on the number of hospitalizations per 10,000 county
population and not the number of individuals admitted to the hospital. For example, if a person is hospitalized twice, this is counted as two hospitalizations. All rates are age-adjusted based on age groups 0-4, 5-14, 15-34, 35-64, and 65+.

Racine Head Start Community Needs Assessment June 2013
Page 45 Planning Council for Health and Human Services, Inc.
Lead poisoning
Lead is a toxic metal that interferes with the normal development of a child's brain and can result in lower IQ and a greater likelihood of behavior problems like aggression, hyperactivity, juvenile delinquency, and adult violent crime. Children under age six are the most vulnerable because of their rapid brain development and high absorption rate. Lead poisoning is more common in children two years of age, children in low income families, African American children, and children living in housing built before 1950. Children at risk for lead poisoning should be tested by a health care provider. Lead-based paint is the primary source of lead in a child's environment, and lead poisoning can be best prevented by removing this hazard.
Lead poisoning in Racine County children decreasing (under age six)
(RCEHP 2012)
The Kenosha/Racine Lead-Free Communities Partnership is a joint partnership among Kenosha County and the city of Racine along with various community organizations was created in 2006. The
goals of the partnership include lead education, home lead abatement, and lead-safe contractor training in order to make homes safer for the citizens of Kenosha County and the City of Racine. The Partnership has received several Lead Hazard Reduction Grants from the U.S. Office of Housing
and Urban Development. According to the partnership’s website, to date 450 homes have been cleared of lead hazards. In addition, Racine County now offers listings online in order to provide information about the existence of potential lead-based hazards in various properties where lead abatement work orders are outstanding (K/R LFCP).

Racine Head Start Community Needs Assessment June 2013
Page 46 Planning Council for Health and Human Services, Inc.
Child obesity
Racine County children in the WIC program are exhibiting increased rates of obesity, according to data from the Pediatric and Pregnancy Nutrition Surveillance System. As reported by KidsCount, 12.9% of Racine county children in the WIC program in 2010 were obese and this percentage increased to 13.9% in 2011. (Data taken from chart generated on Annie E. Casey Foundation Kids Count website 4/30/13; data based on Pediatric and Pregnancy Nutrition Surveillance System).
Racine County has more convenience stores in high poverty ZIP codes *
Legend: Number of convenience stores by ZIP codes
* Map generated on Wisconsin Food Security Network website 4/30/13 (data is from 2010).
http://foodsecurity.wisc.edu/background.php
Racine Head Start Community Needs Assessment June 2013
Page 47 Planning Council for Health and Human Services, Inc.
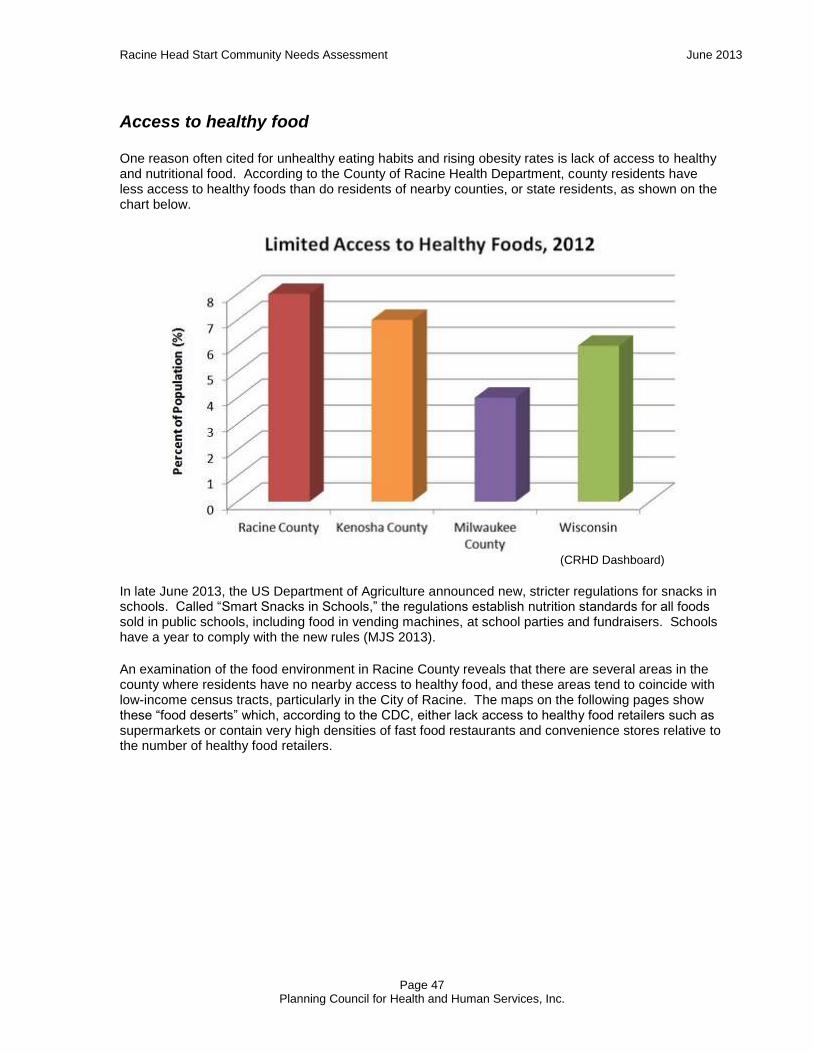
Access to healthy food
One reason often cited for unhealthy eating habits and rising obesity rates is lack of access to healthy and nutritional food. According to the County of Racine Health Department, county residents have less access to healthy foods than do residents of nearby counties, or state residents, as shown on the chart below.
(CRHD Dashboard)
In late June 2013, the US Department of Agriculture announced new, stricter regulations for snacks in schools. Called “Smart Snacks in Schools,” the regulations establish nutrition standards for all foods sold in public schools, including food in vending machines, at school parties and fundraisers. Schools have a year to comply with the new rules (MJS 2013).
An examination of the food environment in Racine County reveals that there are several areas in the county where residents have no nearby access to healthy food, and these areas tend to coincide with low-income census tracts, particularly in the City of Racine. The maps on the following pages show these “food deserts” which, according to the CDC, either lack access to healthy food retailers such as supermarkets or contain very high densities of fast food restaurants and convenience stores relative to the number of healthy food retailers.

Racine Head Start Community Needs Assessment June 2013
Page 48 Planning Council for Health and Human Services, Inc.

Racine Head Start Community Needs Assessment June 2013
Page 49 Planning Council for Health and Human Services, Inc.
Racine Head Start Community Needs Assessment June 2013
Page 50 Planning Council for Health and Human Services, Inc.
Immunizations
Healthiest Wisconsin 2020 aims to increase the proportion of the population that is fully immunized across the lifespan. Immunizations have had an enormous impact in helping to improve the health of children in the United States, according the US Centers for Disease Control and Prevention (CDC). While vaccination has helped to reduce many childhood diseases, some of these diseases still exist and could reappear if vaccination coverage wanes. Most schools, and all public schools, require immunizations before a child is allowed to attend. But due to growing concerns about the safety of vaccinations, concerns which are strongly refuted by public health officials, some parents refuse to get their children vaccinated. These parents are increasingly seeking exemptions from vaccinations, a trend that is seen by many public health officials as worrisome at best and dangerous at worst. According to a 2011 Milwaukee Journal Sentinel article, Wisconsin was among 10 states with vaccine exemptions that increased over the past five years by 1.5 percentage points or more. Wisconsin lets parents obtain vaccine waivers because of "personal convictions" or for medical or religious reasons. The article quotes Geoffrey Swain, associate professor at the University of Wisconsin School of Medicine and Public Health and chief medical officer for the Milwaukee Health Department: "People frame this as a personal, private matter. And it's not," Swain said. "When we have parents who take a personal convictions waiver (so their kids don't have to get shots), it puts all these other kids who can't be vaccinated at risk, too. That's what makes me so angry and concerned." (MJS 11/29/11) Nationwide, exemption seekers are often middle-class, college-educated white people, according to the MJS article, which goes on to say that personal conviction waivers are often also used by parents who are fine with vaccinations but have difficulty accessing vaccine services in a timely fashion. These parents seek personal conviction waivers because they don't want their children excluded from school, and tend to catch up on vaccinations later. The problem with exemptions is that measles or other communicable diseases can re-emerge, with children too young to be vaccinated among the victims.
Among Wisconsin’s 72 counties, Racine is ranked 29th for immunization rate, with 72.8% of children aged 19 to 35 months who have received the recommended doses of DTaP (diphtheria, tetanus, pertussis [whooping cough]); polio, MMR (Measles, mumps, rubella); Hib (haemophilus influenza type B); hepatitis B, varicella (chicken pox); and PCV (pneumococcal conjugate vaccine).

Racine Head Start Community Needs Assessment June 2013
Page 51 Planning Council for Health and Human Services, Inc.
The City of Racine and Racine County have not had any cases of measles in the past five years. The city has not had a case of mumps in the last five years, and the county had a single case in 2009. However, rates of pertussis have increased in 2011 and 2012, as shown in the chart below.
Rates of pertussis have been on the rise in Racine
(CRHD Dashboard)
A recent article in the Racine Journal Times (RJT 9/8/12) pointed out that due to provisions in the Affordable Care Act that require insurance companies to cover vaccinations as a preventive service, people with insurance will no longer be able to get free vaccinations at the public health department beginning January 1, 2014. The article quotes Margaret Gesner, health officer for the Central Racine County Health Department on what effect the ACA will have on immunization rates in the area: “I don’t think any of us know how it will play out,” Gesner said. “But one of the things that works well in Racine County is we do have an immunization coalition, and we have good public and private partnerships, so we always work well with our local health care providers to ensure all our kids get immunized and that will continue.” (RJT 9/8/12)
Racine Head Start Community Needs Assessment June 2013
Page 52 Planning Council for Health and Human Services, Inc.
Access to health professionals
In a 2012 Racine community health assessment commissioned by the largest health care providers in the county, several other children’s health issues were discussed. “Eighty-four percent of respondents reported they have one or more persons they think of as their child’s personal doctor or nurse, with 91% reporting their child visited their personal doctor or nurse for preventive care during the past 12 months.” (Aurora 2012) Ten percent of respondents reported there was a time in the last 12 months their child did not receive the dental care needed while 4% reported their child did not receive the medical care needed. Zero percent reported their child did not visit a specialist they needed to see.” (Aurora 2012) A recent a recent report by the Pew Charitable Trust named Wisconsin as having the nation’s second-worst dental care access for low-income children. According to the report, 71.5% of Medicaid-enrolled children in Wisconsin did not see a dentist in 2011. The situation will not improve until the Wisconsin legislature increases the Medicaid dental budget, which currently allocates less than 1% to dental care, according to the executive director of the Wisconsin Dental Association as quoted in the Milwaukee Journal Sentinel (MJS 6/28/13) In focus groups conducted with Racine Head Start parents by students from UW-Parkside, participants mentioned that there are programs available to help parents. The Community Health Care Plan was mentioned as deciding payment on an individual basis determined by salary.
“There are services in the community that people who do not have insurance can take advantage of such as the Crisis Center, the Community Health Center and the Women’s Wellness Center….which meet the mental health needs of families without insurance.” -- Racine Head Start Parent
Transportation was mentioned in the focus group as a big issue. Some parents don’t have cars and find it extremely troublesome to take their children to doctor’s appointments if they don’t have a reliable vehicle. Also, many can’t afford bus fare or find the buses inconvenient due to bad weather.
“One of the most significant needs/challenges that I see facing people in poverty in our community is transportation. Although parents may have good intentions of getting their children to school and doctor/dentist appointments, if they do not have a vehicle, the children do not attend their preschool/4k/Head Start class and doctor appointments consistently. Many of the families attempt to use the city bus as transportation however, I believe that parents are discouraged by inclement weather and bus schedule/fees. If these families could receive bussing free of cost to them, I believe that attendance rates for these early learning programs would rise dramatically.” -- Racine Head Start Parent

Racine Head Start Community Needs Assessment June 2013
Page 53 Planning Council for Health and Human Services, Inc.
Food Security Needs & Assets According to the Wisconsin Food Security Project, over the past several years, food insecurity has increased in the state, meaning more people lack access to sufficient food for a healthy and active life.
“Wisconsin's food insecurity rate during 2008-2010 increased by 30 percent from the previous 3-year period, and is 40 percent higher than a decade ago.” (WFSN)
Children in FoodShare and free/reduced lunch Federal programs such as FoodShare and the free/reduced school lunch program help thousands of Racine residents avoid food insecurity. Children in the Racine Unified School District (serving City of Racine, Village of Caledonia , Village of Elmwood Park, Village of Mt. Pleasant, Village of Sturtevant, and Village of Wind Point) are more likely to be receiving assistance through the free/reduced lunch program, than are children in Racine County overall or the State of Wisconsin. Children in the county are more likely than their counterparts statewide to be receiving FoodShare.
Children in Racine Unified School District more likely to experience food insecurity
Racine Unified School District Racine County Wisconsin
FoodShare participants, % of population NA 19.6% 18.6%
FoodShare participants, % of children NA 37.4% 30.0%
Children qualifying for free/reduced lunch (2010) 58.0% 49.7% 42.0%
Rate of qualifying children participating daily in free/reduced price lunch program (2011)
74.0% 73.7% 73.3%
(WFSN)

Racine Head Start Community Needs Assessment June 2013
Page 54 Planning Council for Health and Human Services, Inc.
One in three children in Racine County participate in FoodShare
* The percentage of the child population (0-19) that receive FoodShare (also called the
Supplemental Nutrition Assistance Program, or SNAP) ** Chart generated on Wisconsin Food Security Network website 4/30/13; data based
on Wisconsin Department of Health Services & Census Bureau Population Estimates, http://www.dhs.wisconsin.gov/em/rsdata/index.htm
Food pantries in Racine County *
* Chart generated on Wisconsin Food Security Network website 4/30/13; data based on 211 Wisconsin; various
county resource guides and local contacts
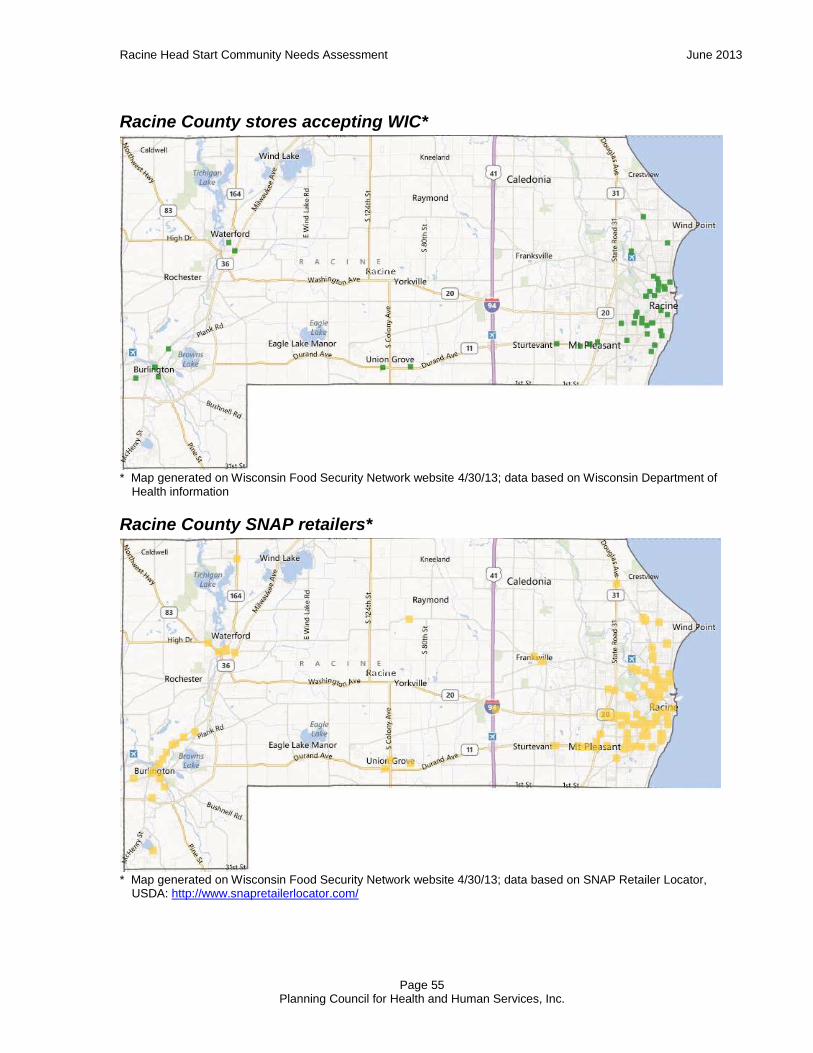
Racine Head Start Community Needs Assessment June 2013
Page 55 Planning Council for Health and Human Services, Inc.
Racine County stores accepting WIC*
* Map generated on Wisconsin Food Security Network website 4/30/13; data based on Wisconsin Department of
Health information
Racine County SNAP retailers*
* Map generated on Wisconsin Food Security Network website 4/30/13; data based on SNAP Retailer Locator,
USDA: http://www.snapretailerlocator.com/
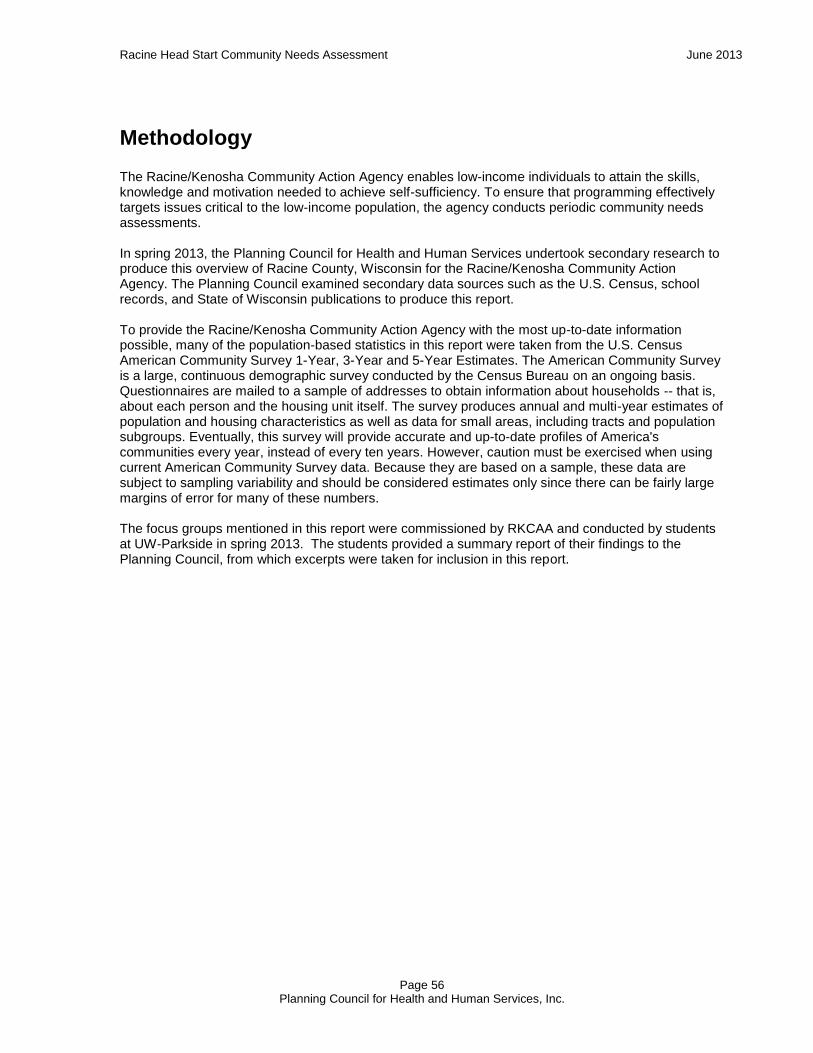
Racine Head Start Community Needs Assessment June 2013
Page 56 Planning Council for Health and Human Services, Inc.
Methodology The Racine/Kenosha Community Action Agency enables low-income individuals to attain the skills, knowledge and motivation needed to achieve self-sufficiency. To ensure that programming effectively targets issues critical to the low-income population, the agency conducts periodic community needs assessments. In spring 2013, the Planning Council for Health and Human Services undertook secondary research to produce this overview of Racine County, Wisconsin for the Racine/Kenosha Community Action Agency. The Planning Council examined secondary data sources such as the U.S. Census, school records, and State of Wisconsin publications to produce this report. To provide the Racine/Kenosha Community Action Agency with the most up-to-date information possible, many of the population-based statistics in this report were taken from the U.S. Census American Community Survey 1-Year, 3-Year and 5-Year Estimates. The American Community Survey is a large, continuous demographic survey conducted by the Census Bureau on an ongoing basis. Questionnaires are mailed to a sample of addresses to obtain information about households -- that is, about each person and the housing unit itself. The survey produces annual and multi-year estimates of population and housing characteristics as well as data for small areas, including tracts and population subgroups. Eventually, this survey will provide accurate and up-to-date profiles of America's communities every year, instead of every ten years. However, caution must be exercised when using current American Community Survey data. Because they are based on a sample, these data are subject to sampling variability and should be considered estimates only since there can be fairly large margins of error for many of these numbers. The focus groups mentioned in this report were commissioned by RKCAA and conducted by students at UW-Parkside in spring 2013. The students provided a summary report of their findings to the Planning Council, from which excerpts were taken for inclusion in this report.

References Alexander, K et al (April 2007). American Sociological Review. Lasting consequences of the summer learning gap.
American Academy of Pediatric: Sample Hospital Breastfeeding Policy for Newborn
http://www2.aap.org/breastfeeding/curriculum/documents/pdf/Hospital%20Breastfeeding%20Policy_FINAL.pdf
Annie E. Casey Foundation, KidsCount Data Center. http://datacenter.kidscount.org Aurora Health Care, Children’s Hospital of Wisconsin, Wheaton Franciscan Healthcare (2012). Central Racine County Community
Health Survey Report. http://www.aurorahealthcare.org/yourhealth/comm-health-reports/art/2012-racine-county-survey-report.pdf
Baby-Friendly USA, Inc: Baby-Friendly Hospital Initiatives in the U.S. http://www.babyfriendlyusa.org/eng/10steps.html City of Racine Health Department Health Indicators Dashboard. http://www.cityofracine.org/HealthIndicatorsDashboard-
CommunityHealth.aspx Compass Wisconsin website. http://www.compasswisconsin.org/ Council for Exceptional Children (2012), Initial Early Childhood Special Education Specialty Set,
http://www.cec.sped.org/Standards/Special-Educator-Professional-Preparation/CEC-Initial-and-Advanced-Specialty-Sets County Health Rankings (Racine).
http://www.countyhealthrankings.org/app/wisconsin/2013/racine/county/outcomes/overall/snapshot/by-rank
Domestic Violence Rises in Sluggish Economy, Police Report. Johnson, Kevin. USA Today Online, April 30, 2012.
http://usatoday30.usatoday.com/news/nation/story/2012-04-29/domestic-violence-policesurvey/54633282/1?csp=34news Johnson, Kevin. “Domestic Violence Rises in Sluggish Economy, Police Report”, USA Today Online, April 30, 2012.
http://usatoday30.usatoday.com/news/nation/story/2012-04-29/domestic-violence-police-survey/54633282/1 Kenosha/Racine Lead-Free Communities Partnership wehbsite. http://www.legacyoflead.com/ Kornrich, S. and Furstenberg, F. (February 2013). Investing in children: Changes in parental spending on children, 1972 – 2007.
Demography. http://link.springer.com/article/10.1007/s13524-012-0146-4 MedLine Plus, 3/28/13. Frequent Moves Take Toll on Poor Kids, Study Suggests,
http://www.nlm.nih.gov/medlineplus/news/fullstory_135365.html#.UVmkgBbf5BV.twitter Milwaukee Journal Sentinel (6/28/13). Schools assess new rules on healthier snacks.
http://www.jsonline.com/news/wisconsin/new-standards-intended-to-make-school-snacks-healthier-b9944043z1-213580281.html
Milwaukee Journal Sentinel (6/28/13). Mission of mercy brings dental care to those in need.
http://www.jsonline.com/features/health/mission-of-mercy-brings-dental-care-to-those-in-need-b9943926z1-213603651.html Milwaukee Journal Sentinel (11/29/11) More kids are missing school shots. http://www.jsonline.com/features/health/more-kids-
missing-school-shots-k437l0i-134655418.html National Summer Learning Association (2009). More than a hunch: kids lose learning skills over the summer months.
http://c.ymcdn.com/sites/www.summerlearning.org/resource/collection/CB94AEC5-9C97-496F-B230-1BECDFC2DF8B/Research_Brief_04_-_Cooper.pdf
National Summer Learning Association (2009). Summer can set kids on the right—or wrong--course.
http://c.ymcdn.com/sites/www.summerlearning.org/resource/collection/CB94AEC5-9C97-496F-B230-1BECDFC2DF8B/Research_Brief_02_-_Alexander.pdf
National Summer Learning Association (2009). Summertime and weight gain.
http://c.ymcdn.com/sites/www.summerlearning.org/resource/collection/CB94AEC5-9C97-496F-B230-1BECDFC2DF8B/Research_Brief_01_-_von_Hippel.pdf
Pew Hispanic Research Center. Demographic Profile of Hispanics in Wisconsin, 2010. http://www/pewhispanic.org/states/state/WI/ Point in Time Summary for Racine County, 2011. http://xa.yimg.com/kq/groups/16011998/2045689008/name/AR-
M455N_20120305_154746.pdf
Racine Head Start Community Needs Assessment June 2013
Page 58 Planning Council for Health and Human Services, Inc.
Racine City Community Health Survey Report, 2012. http://www.aurorahealthcare.org/yourhealth/comm-health-reports/art/2012-racine-city-report.pdf
Racine County Economic Development Corporation lists of largest employers. http://www.racinecountyedc.org/content/largest-
employers
Racine County Executive State of the County Report 2012 (5/22/12).
http://www.racineco.com/CRepository/RacineMedia/RNM20120522_000.pdf Racine County Executive State of the County Report 2013 (5/14/13).
http://www.racineco.com/CRepository/RacineMedia/RNM20130514_000.pdf
Racine County Environmental Health Profile, March 2012, http://www.dhs.wisconsin.gov/epht/CHP/Racine_profile.pdf Racine County Workforce Development Center website.
http://www.wdc.racineco.com/JobSeekerServices/Learning/Training/tabid/471/Default.aspx
Racine Journal Times (9/8/12). Effective Oct 1, no shots at health departments for the fully insured.
http://journaltimes.com/news/local/effective-oct-no-shots-at-health-departments-for-the-fully/article_465b2282-fa31-11e1-9f18-0019bb2963f4.html
Racine Journal Times (4/7/13). Housing help on hiatus: Sequestration means those seeking rental assistance will have even longer
wait. Racine Journal Times (2/2/13). Hundreds living homeless in Racine. http://journaltimes.com/news/local/hundreds-living-homeless-
in-racine/article_8c82b32a-6dc1-11e2-8e2a-001a4bcf887a.html Racine Journal Times (6/28/13) May jobless rates higher than in 2012. http://journaltimes.com/news/local/may-jobless-rates-higher-
than-in/article_623de046-df70-11e2-81f8-0019bb2963f4.html Racine Journal Times (5/6/13). Sequester may hit many programs in Wisconsin. http://journaltimes.com/news/local/govt-and-
politics/sequester-may-hit-many-programs-in-wisconsin/article_8f8032b3-99c1-5599-818f-e2b157d6de05.html Racine LIHF (Lifecourse Initiative for Healthy Families) website. http://www.healthybabiesracine.org/racine-lihf.html Public Policy Forum (2012). 15th comparative analysis of RUSD. http://publicpolicyforum.org/sites/default/files/2012RacineReport.pdf
United Way of Racine County (2012). Community Indicators Report.
http://www.unitedwayracine.org/sites/default/files/imce/files/2012%20Community%20Indicators%20Report%201-31-12.pdf U.S. Census Bureau, 2007-2011 American Community Survey 5-Year Estimates, generated by Todd Clausen. U.S. Census Bureau, 2009-2011 American Community Survey 3-Year Estimates, generated by Michelle Heintze, using American
FactFinder, http://factfinder.census.gov. April 2013. U.S. Census Bureau, 2011 American Community Survey 1-Year Estimates, generated by Michelle Heintze, using American
FactFinder, http://factfinder2.census.gov/main.html. April 2013. U.S. Census Bureau, 2010 Decennial Census, generated by Julie Whelan Capell, using American FactFinder,
http://factfinder2.census.gov/main.html . April 2012. U.S. Department of Agriculture. Food Access Research Atlas. http://www.ers.usda.gov/data-products/food-access-research-atlas/ United Way of Racine County (2012). The 2012 United Way of Racine County Community Indicators Report.
http://www.unitedwayracine.org/sites/default/files/imce/files/2012%20Community%20Indicators%20Report%201-31-12.pdf Western Racine County Health Department, 2012 Annual Report, http://www.wrchd.org/ Wisconsin Council on Children and Families (2011). How are Racine County and Wisconsin Faring in the Recession?
http://www.wccf.org/pdf/kidscount_data_racine_county.pdf Wisconsin Council on Children and Families (2011). WISKIDS Count 2011. www.wccf.org Wisconsin Department of Administration, Division of Housing (2012). State of Homelessness in Wisconsin 2012.
http://ourneighborsplace.org/wp-content/uploads/2013/04/State-of-Homelessness-2012-Final.pdf Wisconsin Department of Health Services, Division of Maternal and Child Health (2008). 2008 Annual MCH Report.
http://www.dhs.wisconsin.gov/health/children/overview/SLAITS-CSHCN%20report%20final%20September%202008.pdf

Racine Head Start Community Needs Assessment June 2013
Page 59 Planning Council for Health and Human Services, Inc.
Wisconsin Department of Health Services Division of Public Health, Office of Health Informatics, 2007-2008 Wisconsin PRAMS (09/2012). Wisconsin PRAMS: What moms tell us about breastfeeding. http://www.dhs.wisconsin.gov/publications/p0/p00398.pdf
Wisconsin Department of Public Instruction website download. Disabilities by school district enrollment data for 2012-2013 school year.
http://data.dpi.state.wi.us/data/DisabilEnroll.aspx?OrgLevel=st&GraphFile=BlankPageUrl&S4orALL=1&SRegion=1&SCounty=47&SAthleticConf=45&SCESA=05&Qquad=demographics.aspx
Wisconsin Department of Public Instruction (2010). March 2010 census of limited-English proficient pupils in Wisconsin by District.
http://ell.dpi.wi.gov/files/ell/pdf/census2010dist.pdf
Wisconsin Department of Public Instruction WINSS online database download.
http://data.dpi.state.wi.us/data/GroupEnroll.aspx?OrgLevel=st&GraphFile=GROUPS&S4orALL=1&SRegion=1&SCounty=47&SAthleticConf=45&SCESA=05&Qquad=demographics.aspx&Group=ELP
Wisconsin Department of Workforce Development (2011). Racine County Workforce Profile 2011.
http://worknet.wisconsin.gov/worknet_info/Downloads/CP/racine_profile.pdf Wisconsin Food Security network, http://foodsecurity.wisc.edu/background.php summer meal program data from Wisconsin
Department of Public Instruction http://dpi.wi.gov/fns/sfsp1.html

Racine Head Start Community Needs Assessment June 2013
Page 60 Planning Council for Health and Human Services, Inc.
This page has been left blank intentionally
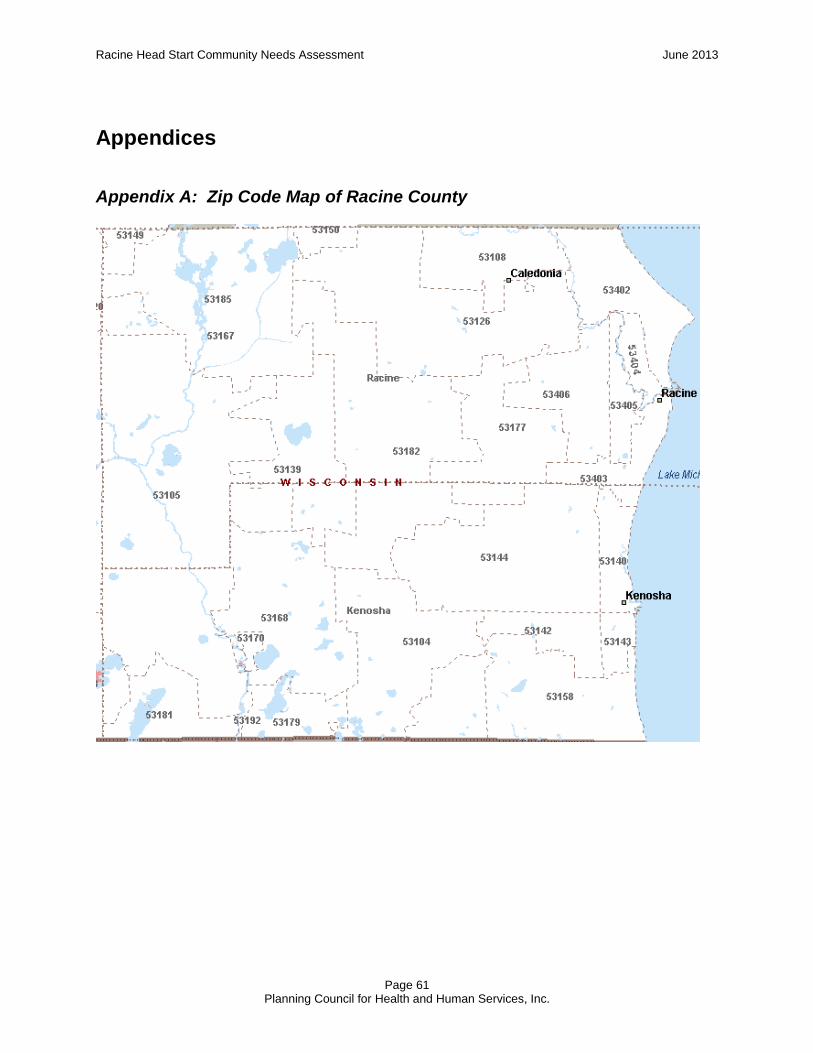
Racine Head Start Community Needs Assessment June 2013
Page 61 Planning Council for Health and Human Services, Inc.
Appendices
Appendix A: Zip Code Map of Racine County

Racine Head Start Community Needs Assessment June 2013
Page 62 Planning Council for Health and Human Services, Inc.
Appendix B: Racine Schools and School Districts: 2006
(RC
DP
D 2
00
9)

Appendix C: Disabilities by school district for Racine County, 2012-2013
District Name School Name
Enrollment PreK-12
Autism Cognitively
Disabled Deaf Blind
Significant Development
Delay
Emotional Behavioral Disability
Hearing Impairment
# % # % # % # % # % # %
Brighton #1 Brighton El 208 0 0.00 1 0.48 0 0.00 0 0.00 0 0.00 0 0.00
Burlington Area Burlington Hi 1201 12 1.00 15 1.25 0 0.00 0 0.00 22 1.83 2 0.17
Burlington Area Cooper El 404 5 1.24 2 0.50 0 0.00 5 1.24 4 0.99 0 0.00
Burlington Area Dr Edward G Dyer Sch 429 10 2.33 4 0.93 0 0.00 0 0.00 1 0.23 2 0.47
Burlington Area Lyons Ctr 139 0 0.00 0 0.00 0 0.00 0 0.00 1 0.72 0 0.00
Burlington Area Nettie E Karcher Sch 513 6 1.17 8 1.56 0 0.00 0 0.00 12 2.34 1 0.19
Burlington Area Waller El 381 13 3.41 4 1.05 0 0.00 12 3.15 9 2.36 1 0.26
Burlington Area Winkler El 193 1 0.52 0 0.00 0 0.00 0 0.00 1 0.52 0 0.00
Burlington Area 3260 47 1.44 33 1.01 0 0.00 17 0.52 50 1.53 6 0.18
Dover #1 Kansasville El 90 0 0.00 0 0.00 0 0.00 0 0.00 3 3.33 0 0.00
Muskego-Norway Bay Lane Mid 682 3 0.44 9 1.32 0 0.00 0 0.00 5 0.73 2 0.29
Muskego-Norway Country Meadows El 319 1 0.31 1 0.31 0 0.00 3 0.94 1 0.31 1 0.31
Muskego-Norway Lake Denoon Mid 730 5 0.68 7 0.96 0 0.00 0 0.00 7 0.96 0 0.00
Muskego-Norway Lakeview El 412 3 0.73 1 0.24 0 0.00 1 0.24 2 0.49 1 0.24
Muskego-Norway Mill Valley El 361 1 0.28 0 0.00 0 0.00 3 0.83 1 0.28 0 0.00
Muskego-Norway Muskego El 265 2 0.75 0 0.00 0 0.00 0 0.00 0 0.00 0 0.00
Muskego-Norway Muskego Hi 1692 15 0.89 15 0.89 0 0.00 0 0.00 15 0.89 2 0.12
Muskego-Norway Tess Corners El 516 4 0.78 3 0.58 0 0.00 4 0.78 1 0.19 0 0.00
Muskego-Norway 4977 34 0.68 36 0.72 0 0.00 11 0.22 32 0.64 6 0.12
North Cape North Cape El 197 1 0.51 2 1.02 0 0.00 1 0.51 0 0.00 0 0.00
Norway J7 Drought El 86 0 0.00 0 0.00 0 0.00 0 0.00 0 0.00 0 0.00
(Wi Dpt Public Instruction)
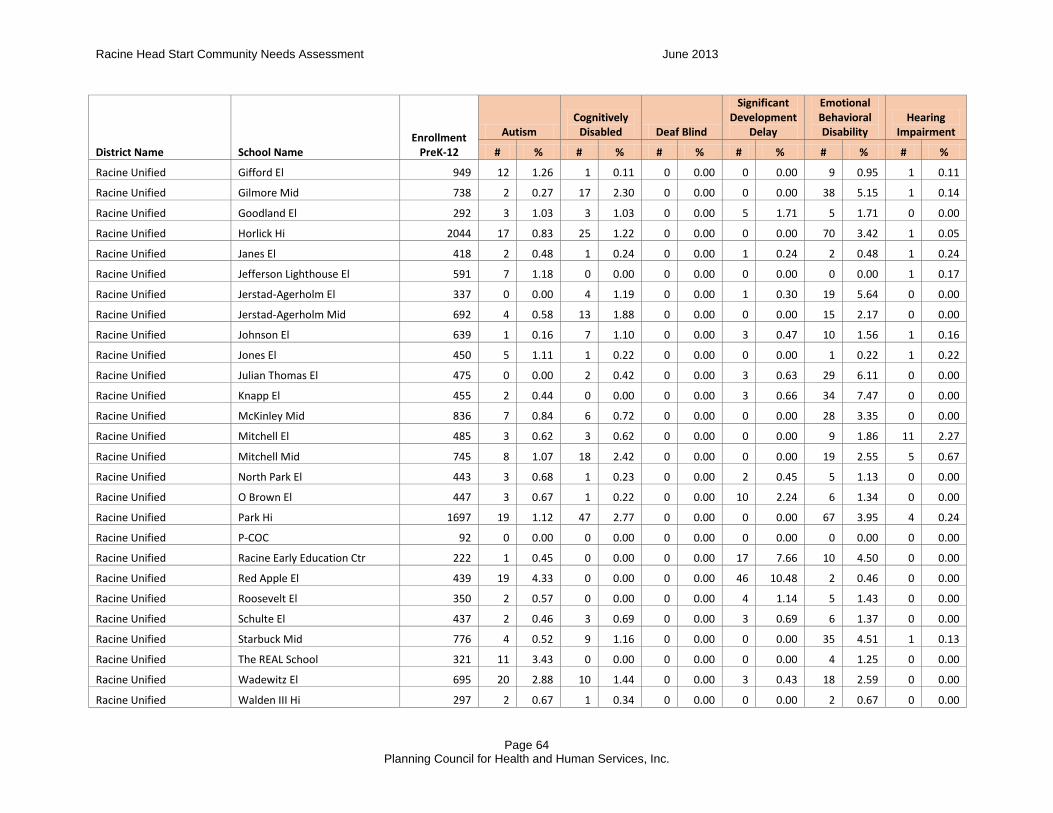
Racine Head Start Community Needs Assessment June 2013
Page 64 Planning Council for Health and Human Services, Inc.
District Name School Name
Enrollment PreK-12
Autism Cognitively
Disabled Deaf Blind
Significant Development
Delay
Emotional Behavioral Disability
Hearing Impairment
# % # % # % # % # % # %
Racine Unified Gifford El 949 12 1.26 1 0.11 0 0.00 0 0.00 9 0.95 1 0.11
Racine Unified Gilmore Mid 738 2 0.27 17 2.30 0 0.00 0 0.00 38 5.15 1 0.14
Racine Unified Goodland El 292 3 1.03 3 1.03 0 0.00 5 1.71 5 1.71 0 0.00
Racine Unified Horlick Hi 2044 17 0.83 25 1.22 0 0.00 0 0.00 70 3.42 1 0.05
Racine Unified Janes El 418 2 0.48 1 0.24 0 0.00 1 0.24 2 0.48 1 0.24
Racine Unified Jefferson Lighthouse El 591 7 1.18 0 0.00 0 0.00 0 0.00 0 0.00 1 0.17
Racine Unified Jerstad-Agerholm El 337 0 0.00 4 1.19 0 0.00 1 0.30 19 5.64 0 0.00
Racine Unified Jerstad-Agerholm Mid 692 4 0.58 13 1.88 0 0.00 0 0.00 15 2.17 0 0.00
Racine Unified Johnson El 639 1 0.16 7 1.10 0 0.00 3 0.47 10 1.56 1 0.16
Racine Unified Jones El 450 5 1.11 1 0.22 0 0.00 0 0.00 1 0.22 1 0.22
Racine Unified Julian Thomas El 475 0 0.00 2 0.42 0 0.00 3 0.63 29 6.11 0 0.00
Racine Unified Knapp El 455 2 0.44 0 0.00 0 0.00 3 0.66 34 7.47 0 0.00
Racine Unified McKinley Mid 836 7 0.84 6 0.72 0 0.00 0 0.00 28 3.35 0 0.00
Racine Unified Mitchell El 485 3 0.62 3 0.62 0 0.00 0 0.00 9 1.86 11 2.27
Racine Unified Mitchell Mid 745 8 1.07 18 2.42 0 0.00 0 0.00 19 2.55 5 0.67
Racine Unified North Park El 443 3 0.68 1 0.23 0 0.00 2 0.45 5 1.13 0 0.00
Racine Unified O Brown El 447 3 0.67 1 0.22 0 0.00 10 2.24 6 1.34 0 0.00
Racine Unified Park Hi 1697 19 1.12 47 2.77 0 0.00 0 0.00 67 3.95 4 0.24
Racine Unified P-COC 92 0 0.00 0 0.00 0 0.00 0 0.00 0 0.00 0 0.00
Racine Unified Racine Early Education Ctr 222 1 0.45 0 0.00 0 0.00 17 7.66 10 4.50 0 0.00
Racine Unified Red Apple El 439 19 4.33 0 0.00 0 0.00 46 10.48 2 0.46 0 0.00
Racine Unified Roosevelt El 350 2 0.57 0 0.00 0 0.00 4 1.14 5 1.43 0 0.00
Racine Unified Schulte El 437 2 0.46 3 0.69 0 0.00 3 0.69 6 1.37 0 0.00
Racine Unified Starbuck Mid 776 4 0.52 9 1.16 0 0.00 0 0.00 35 4.51 1 0.13
Racine Unified The REAL School 321 11 3.43 0 0.00 0 0.00 0 0.00 4 1.25 0 0.00
Racine Unified Wadewitz El 695 20 2.88 10 1.44 0 0.00 3 0.43 18 2.59 0 0.00
Racine Unified Walden III Hi 297 2 0.67 1 0.34 0 0.00 0 0.00 2 0.67 0 0.00

Racine Head Start Community Needs Assessment June 2013
Page 65 Planning Council for Health and Human Services, Inc.
District Name School Name
Enrollment PreK-12 Autism
Cognitively Disabled Deaf Blind
Significant Development
Delay
Emotional Behavioral Disability
Hearing Impairment
Racine Unified Walden III Mid 247 2 0.81 0 0.00 0 0.00 0 0.00 0 0.00 0 0.00
Racine Unified West Ridge El 419 3 0.72 2 0.48 0 0.00 5 1.19 10 2.39 0 0.00
Racine Unified Wind Point El 230 3 1.30 4 1.74 0 0.00 0 0.00 4 1.74 0 0.00
Racine Unified 17258 167 0.97 179 1.04 0 0.00 106 0.61 462 2.68 28 0.16
Raymond #14 Raymond El 439 2 0.46 1 0.23 0 0.00 2 0.46 5 1.14 0 0.00
Union Grove J1 Union Grove El 792 17 2.15 4 0.51 0 0.00 5 0.63 12 1.52 2 0.25
Union Grove UHS Union Grove Hi 971 8 0.82 7 0.72 0 0.00 0 0.00 12 1.24 0 0.00
Union Grove 1763 25 1.42 11 0.62 0 0.00 5 0.28 24 1.36 2 0.11
Washington-Caldwell Washington El 190 2 1.05 2 1.05 0 0.00 0 0.00 0 0.00 2 1.05
Waterford Graded J1
1200 11 0.92 5 0.42 0 0.00 8 0.67 6 0.50 3 0.25
Waterford Graded J1
351 6 1.71 2 0.57 0 0.00 0 0.00 1 0.28 0 0.00
Waterford Graded J1
n/a n/a n/a n/a n/a n/a n/a n/a n/a n/a n/a n/a n/a
Waterford Graded J1
n/a n/a n/a n/a n/a n/a n/a n/a n/a n/a n/a n/a n/a
Waterford Graded J1 1551 17 1.10 7 0.45 0 0.00 8 0.52 7 0.45 3 0.19
Waterford UHS
n/a n/a n/a n/a n/a n/a n/a n/a n/a n/a n/a n/a n/a
Waterford UHS
n/a n/a n/a n/a n/a n/a n/a n/a n/a n/a n/a n/a n/a
Waterford UHS
1065 6 0.56 4 0.38 0 0.00 0 0.00 14 1.31 0 0.00
Waterford UHS
n/a n/a n/a n/a n/a n/a n/a n/a n/a n/a n/a n/a n/a
Waterford UHS 1065 6 0.56 4 0.38 0 0.00 0 0.00 14 1.31 0 0.00
Yorkville J2
465 3 0.65 0 0.00 0 0.00 0 0.00 0 0.00 0 0.00
Yorkville J2
n/a n/a n/a n/a n/a n/a n/a n/a n/a n/a n/a n/a n/a
Yorkville J2
n/a n/a n/a n/a n/a n/a n/a n/a n/a n/a n/a n/a n/a
Yorkville J2
n/a n/a n/a n/a n/a n/a n/a n/a n/a n/a n/a n/a n/a
Yorkville J2 465 3 0.65 0 0.00 0 0.00 0 0.00 0 0.00 0 0.00
TOTAL RACINE COUNTY 31549 304 0.96 276 0.87 0 0.00 150 0.48 597 1.89 47 0.15

Racine Head Start Community Needs Assessment June 2013
Page 66 Planning Council for Health and Human Services, Inc.
(Appendix C continued)
District Name School Name
Enroll-ment
PreK-12
Specific Learning
Disabilities Orthopedic Impairment
Other Health Impairment
Speech or Language
Impairment Traumatic
Brain Injury Visual
Impairment
# % # % # % # % # % # %
Brighton #1 Brighton El 208 2 0.96 0 0.00 5 2.40 7 3.37 0 0.00 0 0.00
Burlington Area Burlington Hi 1201 62 5.16 0 0.00 20 1.67 5 0.42 1 0.08 4 0.33
Burlington Area Cooper El 404 12 2.97 3 0.74 4 0.99 43 10.64 0 0.00 1 0.25
Burlington Area Dr Edward G Dyer Sch 429 24 5.59 1 0.23 8 1.86 9 2.10 0 0.00 0 0.00
Burlington Area Lyons Ctr 139 2 1.44 0 0.00 0 0.00 14 10.07 0 0.00 0 0.00
Burlington Area Nettie E Karcher Sch 513 33 6.43 2 0.39 16 3.12 8 1.56 0 0.00 0 0.00
Burlington Area Waller El 381 15 3.94 2 0.52 5 1.31 42 11.02 0 0.00 0 0.00
Burlington Area Winkler El 193 3 1.55 0 0.00 1 0.52 13 6.74 0 0.00 0 0.00
Burlington Area 3260 151 4.63 8 0.25 54 1.66 134 4.11 1 0.03 5 0.15
Dover #1 Kansasville El 90 2 2.22 0 0.00 3 3.33 2 2.22 0 0.00 0 0.00
Muskego-Norway Bay Lane Mid 682 17 2.49 0 0.00 16 2.35 14 2.05 0 0.00 1 0.15
Muskego-Norway Country Meadows El 319 1 0.31 0 0.00 6 1.88 13 4.08 0 0.00 0 0.00
Muskego-Norway Lake Denoon Mid 730 17 2.33 0 0.00 18 2.47 12 1.64 1 0.14 1 0.14
Muskego-Norway Lakeview El 412 3 0.73 0 0.00 6 1.46 22 5.34 0 0.00 0 0.00
Muskego-Norway Mill Valley El 361 0 0.00 0 0.00 3 0.83 13 3.60 0 0.00 0 0.00
Muskego-Norway Muskego El 265 3 1.13 0 0.00 5 1.89 8 3.02 0 0.00 0 0.00
Muskego-Norway Muskego Hi 1692 30 1.77 2 0.12 32 1.89 5 0.30 0 0.00 0 0.00
Muskego-Norway Tess Corners El 516 3 0.58 0 0.00 9 1.74 21 4.07 0 0.00 2 0.39
Muskego-Norway 4977 74 1.49 2 0.04 95 1.91 108 2.17 1 0.02 4 0.08
North Cape North Cape El 197 8 4.06 0 0.00 1 0.51 9 4.57 0 0.00 0 0.00
Norway J7 Drought El 86 2 2.33 0 0.00 1 1.16 1 1.16 0 0.00 0 0.00

Racine Head Start Community Needs Assessment June 2013
Page 67 Planning Council for Health and Human Services, Inc.
District Name School Name
Enroll-ment
PreK-12
Specific Learning
Disabilities Orthopedic Impairment
Other Health Impairment
Speech or Language
Impairment Traumatic
Brain Injury Visual
Impairment
# % # % # % # % # % # %
Racine Unified Gifford El 949 22 2.32 2 0.21 18 1.90 97 10.22 0 0.00 0 0.00
Racine Unified Gilmore Mid 738 69 9.35 1 0.14 21 2.85 17 2.30 2 0.27 1 0.14
Racine Unified Goodland El 292 13 4.45 0 0.00 8 2.74 34 11.64 0 0.00 1 0.34
Racine Unified Horlick Hi 2044 117 5.72 1 0.05 60 2.94 6 0.29 1 0.05 0 0.00
Racine Unified Janes El 418 10 2.39 0 0.00 9 2.15 41 9.81 0 0.00 0 0.00
Racine Unified Jefferson Lighthouse El 591 2 0.34 0 0.00 2 0.34 33 5.58 0 0.00 0 0.00
Racine Unified Jerstad-Agerholm El 337 8 2.37 0 0.00 4 1.19 34 10.09 0 0.00 0 0.00
Racine Unified Jerstad-Agerholm Mid 692 34 4.91 2 0.29 25 3.61 26 3.76 0 0.00 0 0.00
Racine Unified Johnson El 639 18 2.82 1 0.16 9 1.41 41 6.42 0 0.00 0 0.00
Racine Unified Jones El 450 7 1.56 0 0.00 6 1.33 75 16.67 1 0.22 0 0.00
Racine Unified Julian Thomas El 475 12 2.53 0 0.00 3 0.63 73 15.37 0 0.00 0 0.00
Racine Unified Knapp El 455 15 3.30 2 0.44 13 2.86 46 10.11 0 0.00 0 0.00
Racine Unified McKinley Mid 836 39 4.67 1 0.12 18 2.15 14 1.67 0 0.00 0 0.00
Racine Unified Mitchell El 485 10 2.06 0 0.00 7 1.44 48 9.90 1 0.21 0 0.00
Racine Unified Mitchell Mid 745 58 7.79 0 0.00 22 2.95 10 1.34 0 0.00 0 0.00
Racine Unified North Park El 443 18 4.06 0 0.00 8 1.81 47 10.61 1 0.23 0 0.00
Racine Unified O Brown El 447 14 3.13 3 0.67 12 2.68 62 13.87 0 0.00 0 0.00
Racine Unified Park Hi 1697 122 7.19 4 0.24 59 3.48 9 0.53 1 0.06 0 0.00
Racine Unified P-COC 92 0 0.00 0 0.00 0 0.00 2 2.17 0 0.00 0 0.00
Racine Unified Racine Early Education Ctr 222 0 0.00 0 0.00 0 0.00 12 5.41 0 0.00 1 0.45
Racine Unified Red Apple El 439 11 2.51 1 0.23 5 1.14 100 22.78 0 0.00 1 0.23
Racine Unified Roosevelt El 350 8 2.29 0 0.00 4 1.14 47 13.43 0 0.00 1 0.29
Racine Unified Schulte El 437 14 3.20 1 0.23 11 2.52 29 6.64 0 0.00 0 0.00
Racine Unified Starbuck Mid 776 61 7.86 1 0.13 32 4.12 19 2.45 0 0.00 0 0.00
Racine Unified The REAL School 321 6 1.87 0 0.00 7 2.18 2 0.62 0 0.00 0 0.00
Racine Unified Wadewitz El 695 20 2.88 11 1.58 23 3.31 57 8.20 1 0.14 0 0.00

Racine Head Start Community Needs Assessment June 2013
Page 68 Planning Council for Health and Human Services, Inc.
District Name School Name
Enroll-ment
PreK-12
Specific Learning
Disabilities Orthopedic Impairment
Other Health Impairment
Speech or Language
Impairment Traumatic
Brain Injury Visual
Impairment
# % # % # % # % # % # %
Racine Unified Walden III Hi 297 6 2.02 0 0.00 4 1.35 1 0.34 0 0.00 0 0.00
Racine Unified Walden III Mid 247 9 3.64 0 0.00 3 1.21 3 1.21 0 0.00 1 0.40
Racine Unified West Ridge El 419 12 2.86 2 0.48 7 1.67 25 5.97 0 0.00 0 0.00
Racine Unified Wind Point El 230 8 3.48 0 0.00 2 0.87 21 9.13 0 0.00 0 0.00
Racine Unified 17258 743 4.31 33 0.19 402 2.33 1031 5.97 8 0.05 6 0.03
Raymond #14 Raymond El 439 13 2.96 0 0.00 2 0.46 17 3.87 0 0.00 0 0.00
Union Grove J1 Union Grove El 792 23 2.90 0 0.00 25 3.16 33 4.17 0 0.00 2 0.25
Union Grove UHS Union Grove Hi 971 34 3.50 1 0.10 18 1.85 4 0.41 1 0.10 0 0.00
Union Grove 1763 57 3.23 1 0.06 43 2.44 37 2.10 1 0.06 2 0.11
Washington-Caldwell Washington El 190 7 3.68 0 0.00 5 2.63 8 4.21 0 0.00 0 0.00
Waterford Graded J1
1200 24 2.00 3 0.25 33 2.75 87 7.25 0 0.00 0 0.00
Waterford Graded J1
351 8 2.28 0 0.00 7 1.99 2 0.57 0 0.00 0 0.00
Waterford Graded J1
n/a n/a n/a n/a n/a n/a n/a n/a n/a n/a n/a n/a n/a
Waterford Graded J1
n/a n/a n/a n/a n/a n/a n/a n/a n/a n/a n/a n/a n/a
Waterford Graded J1 1551 32 2.06 3 0.19 40 2.58 89 5.74 0 0.00 0 0.00
Waterford UHS
n/a n/a n/a n/a n/a n/a n/a n/a n/a n/a n/a n/a n/a
Waterford UHS
n/a n/a n/a n/a n/a n/a n/a n/a n/a n/a n/a n/a n/a
Waterford UHS
1065 28 2.63 1 0.09 20 1.88 2 0.19 1 0.09 0 0.00
Waterford UHS
n/a n/a n/a n/a n/a n/a n/a n/a n/a n/a n/a n/a n/a
Waterford UHS 1065 28 2.63 1 0.09 20 1.88 2 0.19 1 0.09 0 0.00
Yorkville J2
465 12 2.58 0 0.00 8 1.72 13 2.80 0 0.00 0 0.00
Yorkville J2
n/a n/a n/a n/a n/a n/a n/a n/a n/a n/a n/a n/a n/a
Yorkville J2
n/a n/a n/a n/a n/a n/a n/a n/a n/a n/a n/a n/a n/a
Yorkville J2
n/a n/a n/a n/a n/a n/a n/a n/a n/a n/a n/a n/a n/a
Yorkville J2 465 12 2.58 0 0.00 8 1.72 13 2.80 0 0.00 0 0.00
TOTAL RACINE COUNTY 31549 1131 3.58 48 0.15 679 2.15 1458 4.62 12 0.04 17 0.05
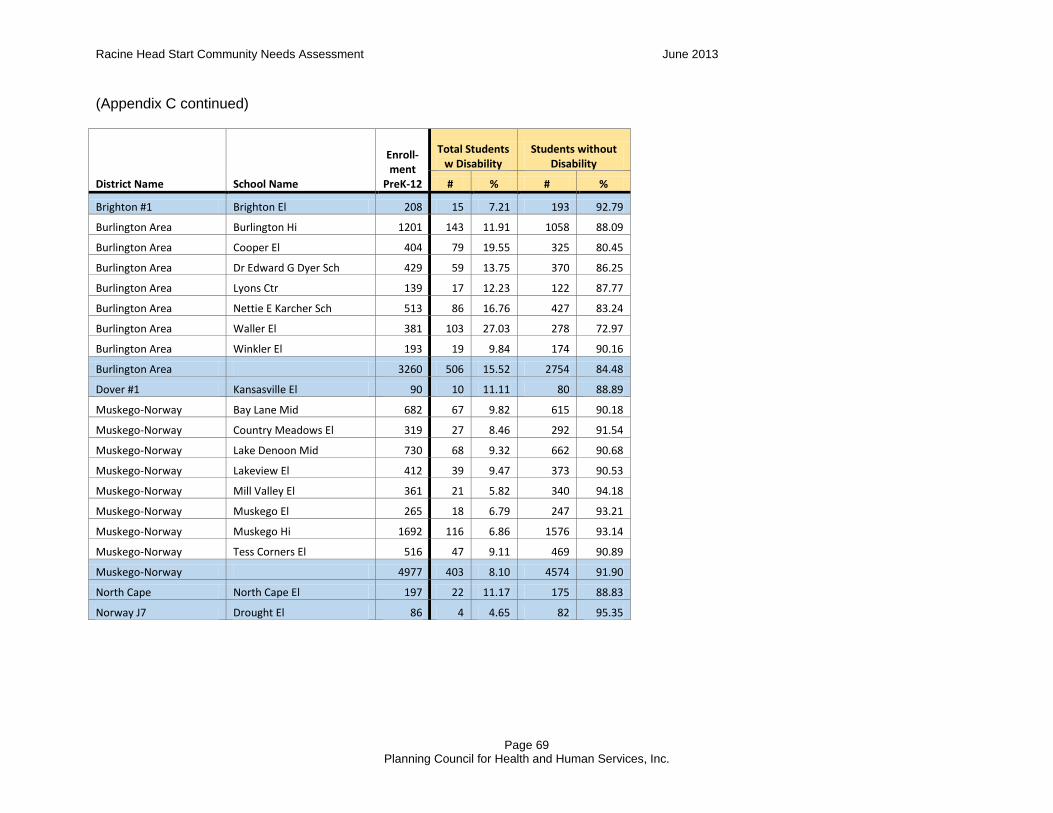
Racine Head Start Community Needs Assessment June 2013
Page 69 Planning Council for Health and Human Services, Inc.
(Appendix C continued)
District Name School Name
Enroll-ment
PreK-12
Total Students w Disability
Students without Disability
# % # %
Brighton #1 Brighton El 208 15 7.21 193 92.79
Burlington Area Burlington Hi 1201 143 11.91 1058 88.09
Burlington Area Cooper El 404 79 19.55 325 80.45
Burlington Area Dr Edward G Dyer Sch 429 59 13.75 370 86.25
Burlington Area Lyons Ctr 139 17 12.23 122 87.77
Burlington Area Nettie E Karcher Sch 513 86 16.76 427 83.24
Burlington Area Waller El 381 103 27.03 278 72.97
Burlington Area Winkler El 193 19 9.84 174 90.16
Burlington Area 3260 506 15.52 2754 84.48
Dover #1 Kansasville El 90 10 11.11 80 88.89
Muskego-Norway Bay Lane Mid 682 67 9.82 615 90.18
Muskego-Norway Country Meadows El 319 27 8.46 292 91.54
Muskego-Norway Lake Denoon Mid 730 68 9.32 662 90.68
Muskego-Norway Lakeview El 412 39 9.47 373 90.53
Muskego-Norway Mill Valley El 361 21 5.82 340 94.18
Muskego-Norway Muskego El 265 18 6.79 247 93.21
Muskego-Norway Muskego Hi 1692 116 6.86 1576 93.14
Muskego-Norway Tess Corners El 516 47 9.11 469 90.89
Muskego-Norway 4977 403 8.10 4574 91.90
North Cape North Cape El 197 22 11.17 175 88.83
Norway J7 Drought El 86 4 4.65 82 95.35

Racine Head Start Community Needs Assessment June 2013
Page 70 Planning Council for Health and Human Services, Inc.
District Name School Name
Enroll-ment
PreK-12
Total Students w Disability
Students without Disability
# % # %
Racine Unified Gifford El 949 162 17.07 787 82.93
Racine Unified Gilmore Mid 738 169 22.90 569 77.10
Racine Unified Goodland El 292 72 24.66 220 75.34
Racine Unified Horlick Hi 2044 298 14.58 1746 85.42
Racine Unified Janes El 418 67 16.03 351 83.97
Racine Unified Jefferson Lighthouse El 591 45 7.61 546 92.39
Racine Unified Jerstad-Agerholm El 337 70 20.77 267 79.23
Racine Unified Jerstad-Agerholm Mid 692 119 17.20 573 82.80
Racine Unified Johnson El 639 91 14.24 548 85.76
Racine Unified Jones El 450 97 21.56 353 78.44
Racine Unified Julian Thomas El 475 122 25.68 353 74.32
Racine Unified Knapp El 455 115 25.27 340 74.73
Racine Unified McKinley Mid 836 113 13.52 723 86.48
Racine Unified Mitchell El 485 92 18.97 393 81.03
Racine Unified Mitchell Mid 745 140 18.79 605 81.21
Racine Unified North Park El 443 85 19.19 358 80.81
Racine Unified O Brown El 447 111 24.83 336 75.17
Racine Unified Park Hi 1697 332 19.56 1365 80.44
Racine Unified P-COC 92 2 2.17 90 97.83
Racine Unified Racine Early Education Ctr 222 41 18.47 181 81.53
Racine Unified Red Apple El 439 185 42.14 254 57.86
Racine Unified Roosevelt El 350 71 20.29 279 79.71
Racine Unified Schulte El 437 69 15.79 368 84.21
Racine Unified Starbuck Mid 776 162 20.88 614 79.12
Racine Unified The REAL School 321 30 9.35 291 90.65
Racine Unified Wadewitz El 695 163 23.45 532 76.55
Racine Unified Walden III Hi 297 16 5.39 281 94.61

Racine Head Start Community Needs Assessment June 2013
Page 71 Planning Council for Health and Human Services, Inc.
District Name School Name
Enroll-ment
PreK-12
Total Students w Disability
Students without Disability
Racine Unified Walden III Mid 247 18 7.29 229 92.71
Racine Unified West Ridge El 419 66 15.75 353 84.25
Racine Unified Wind Point El 230 42 18.26 188 81.74
Racine Unified 17258 3165 18.34 14093 81.66
Raymond #14 Raymond El 439 42 9.57 397 90.43
Union Grove J1 Union Grove El 792 123 15.53 669 84.47
Union Grove UHS Union Grove Hi 971 85 8.75 886 91.25
Union Grove 1763 208 11.80 1555 88.20
Washington-Caldwell Washington El 190 26 13.68 164 86.32
Waterford Graded J1
1200 180 15.00 1020 85.00
Waterford Graded J1
351 26 7.41 325 92.59
Waterford Graded J1
n/a n/a n/a n/a n/a
Waterford Graded J1
n/a n/a n/a n/a n/a
Waterford Graded J1 1551 206 13.28 1345 86.72
Waterford UHS
n/a n/a n/a n/a n/a
Waterford UHS
n/a n/a n/a n/a n/a
Waterford UHS
1065 76 7.14 989 92.86
Waterford UHS
n/a n/a n/a n/a n/a
Waterford UHS 1065 76 7.14 989 92.86
Yorkville J2
465 36 7.74 429 92.26
Yorkville J2
n/a n/a n/a n/a n/a
Yorkville J2
n/a n/a n/a n/a n/a
Yorkville J2
n/a n/a n/a n/a n/a
Yorkville J2 465 36 7.74 429 92.26
TOTAL RACINE COUNTY 31549 4719 14.96 26830 85.04
(Wi DPI 2012-2013)

Appendix D: Map of City of Racine child care centers, January 2013
(see Appendix F for key to the numbers on this map)
(RCDPD 2009)
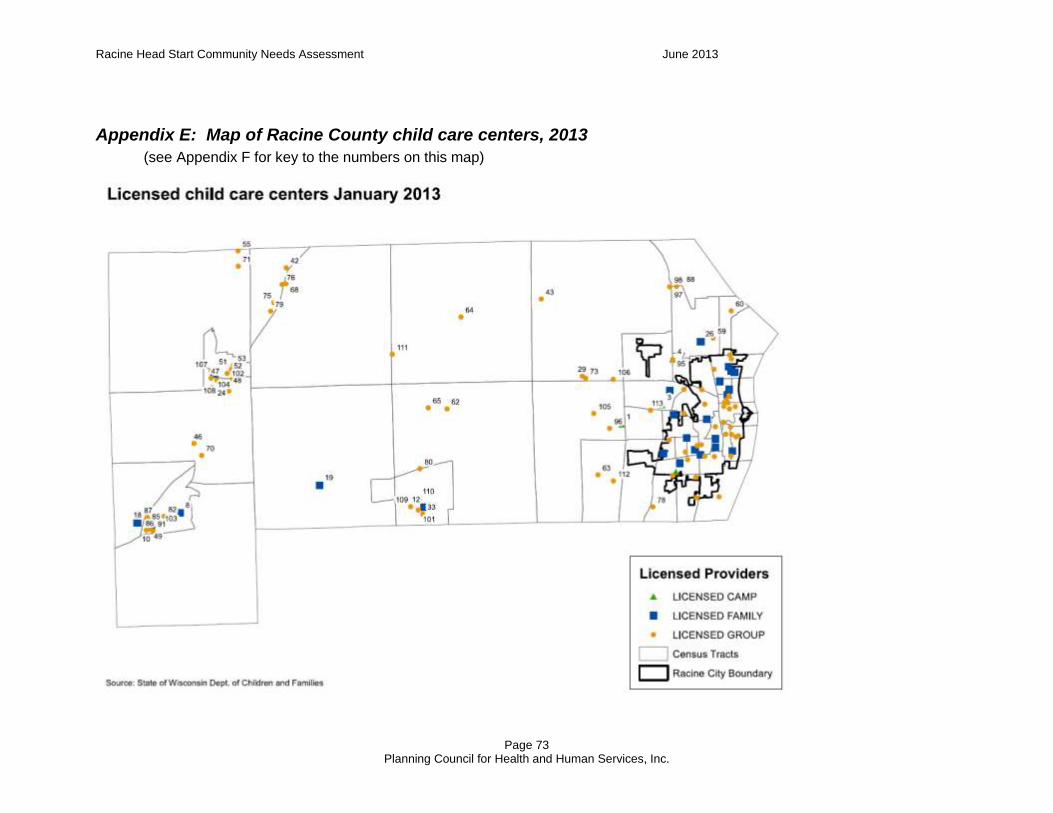
Racine Head Start Community Needs Assessment June 2013
Page 73 Planning Council for Health and Human Services, Inc.
Appendix E: Map of Racine County child care centers, 2013
(see Appendix F for key to the numbers on this map)
(RC
DP
D 2
00
9)

Racine Head Start Community Needs Assessment June 2013
Page 74 Planning Council for Health and Human Services, Inc.
Appendix F: Child care center capacity in Racine County January 2013
Map ID Facility Name Capacity Age Range
1 CAMP COOL WATERS SMOLENSKI PARK 75 5 Years- 11 Years
2 KIDS OUTDOORS KAMP 30 4 Years-12 Years
3 KIDS SPORTS KAMP 50 4 Years- 12 Years
4 SC JOHNSON SUMMER DAY CAMP 160 5 Years- 12 Years
5 ADVENTURELAND DAYCARE CENTER 8 0 Years- 12 Years
6 A PLACE TO CALL HOME 8 6 Weeks- 12 Years
7 BRIGHTER FUTURES FAMILY CHILD CARE 8 6 Weeks- 13 Years
8 DISCOVERY PRESCHOOL 8 6 Weeks- 12 Years
9 DREXXI KIDZ 8 6 Weeks- 12 Years
10 FRIENDS FOREVER FAMILY DAY CARE 8 6 Weeks- 10 Years
11 HARRIS LIL ANGELS 8 6 Weeks - 12 Years
12 JUNIE B'S DAY CARE 8 6 Weeks- 12 Years
13 KAY'S CUDDLE CARE 8 2 Years- 9 Years
14 LATASHA'S HOUSE OF LEARNING 8 6 Weeks- 11 Years
15 LITTLE BEAN SPROUTS DAYCARE 8 6 weeks- 12 Years
16 LITTLE INSPIRATION'S LEARNING CTR 8 1 Week- 8 Years
17 LITTLE RED WAGON DAY CARE 8 1 Week- 12 Years
18 LOIS FAMILY CHILD CARE 8 6 Weeks- 17 Years
19 MOTHER'S BLESSING FAMILY CHILD CARE 8 6 Weeks- 12 Years
20 NANCY'S LITTLE TREASURES LLC 8 6 Weeks- 13 Years
21 OUR WEE ONES FAMILY DAYCARE CENTER 8 3 Weeks- 12 Years
22 RIVER VIEW CHILD CARE 8 6 Weeks- 12 Years
23 SANDRA'S DAY CARE 8 1 Week- 13 Years
24 SHANNON'S FAMILY HOME DAY CARE 8 6 Weeks- 12 Years
25 TC TOTS 8 2 Months- 12 Years
26 TINY TOT UNIVERSITY 8 6 Weeks - 13 Years
27 TODDLER WORLD DAY CARE 8 2 Weeks- 12 Years
28 WEE CARE DAY CARE 8 6 Weeks- 6 Years
29 ACADEMY OF PRSCH LRNG NORTHWESTERN
14 2 .5 Years- 6 Years
30 ALMOST HOME ACADEMY II 74 4 Weeks-11 Years
31 ATONEMENT LUTHERAN CHILD CARE 105 6 Weeks- 14 Years
32 BRIGHT AND BEAUTIFUL CHRISTIAN CC 70 6 Weeks- 11 Years
33 BRIGHT AND BEAUTIFUL KIDS CLUB PROG 68 5 Years- 11 Years
34 BUILDING BLOCKS INTERACTIVE CENTER 40 4 Weeks- 11 Years
35 BUNDLES OF BLESSINGS KIDS KARE INC 50 6 Weeks- 12 Years
36 BUSY BEE'S CHILD CARE CENTER LLC 2 50 6 Weeks- 12 Years
37 CARE BEAR CHILDCARE CENTER 42 6 Weeks- 12 Years
38 CHILD HARBOR LEARNING CENTER 87 6 Weeks- 12 Years
39 CHILDREN'S PLACE CHILD DEV CENTER 50 3 Weeks- 12 Years
40 CHILD UNIVERSE DAY CARE 98 2 Weeks- 12 Years

Racine Head Start Community Needs Assessment June 2013
Page 75 Planning Council for Health and Human Services, Inc.
Map ID Facility Name Capacity Age Range
41 CHRIST CHURCH CC/SUNSHINE MNTN PRSC 100 6 Weeks- 12 Years
42 DISCOVERY DAYS CHILDCARE II INC 66 6 Weeks- 11 Years
43 DISCOVERY STAGE PRESCHOOL & CC 110 6 Weeks- 12 Years
44 EV UNITED METH MOTHERS DAY OUT 89 1 Year- 5 Years
45 HALO CHILD CARE CENTER 22 2 Weeks- 13 Years
46 HOLY FAMILY CHILDCARE CENTER 40 6 Weeks- 5 Years
47 HOMESTEAD DAY CARE LCC-WOODFLD ELEM
40 5 Years- 14 Years
48 HOMESTEAD DAY CARE LLC II 34 6 Weeks- 14 Years
49 IN HIS ARMS EARLY CHILDHOOD CENTER 50 6 Weeks- 12 Years
50 INNOVATIVE CHILD CARE CENTER 44 6 Weeks- 12 Years
51 IT'S ALL ABOUT KIDS 38 2 Years- 7 Years
52 IT'S ALL ABOUT KIDS 16 6 Weeks- 3 Years
53 ITS ALL ABOUT KIDS AT TRAILSIDE ELE 44 5 Years- 13 Years
54 JACK & JILL DAY CARE CENTER 50 2 Years- 10 Years
55 KAS BEFORE AND AFTER SCHOOL PROGRAM
20 5 Years- 13 Years
56 KIDS KLUB DR. JONES 12 5 Years- 11 Years
57 KIDS KLUB FINE ARTS 20 5 Years- 11 Years
58 KIDS KLUB JEFFERSON LIGHTHOUSE 25 5 Years- 11 Years
59 KIDS KLUB NORTH PARK 20 5 Years- 11 Years
60 KIDS KLUB OLYMPIA BROWN 8 5 Years- 11 Years
61 KIDS KLUB RED APPLE 25 3 Years- 11 Years
62 KIDS KORNER PRSCH & SCH AGE PROGS 26 2 Years- 13 Years
63 KIDS TOWN USA CHILD CARE CTR INC 50 2 Years- 12 Years
64 KIDZ CONNECTION B AND A SCH PRG LLC 35 4 Years- 14 Years
65 KIDZ CONNECTION B & A SCH PROG LLC 30 5 Years- 15 Years
66 KIMBERLAND DAYCARE LLC 43 4 Weeks- 12 Years
67 KINDERCARE LEARNING CTRS-3 MILE RD 134 6 Weeks- 12 Years
68 LAKEVIEW ELEMENTARY SCHOOL SACC 56 5 Years- 13 Years
69 LA PRE ENTERPRISE DBA X-CITE CC 51 4 Weeks- 13 Years
70 LEAPIN LEARNERS 10 3 Years- 5 Years
71 LITTLE BEAR LEARNING CTR LLC 20 6 Weeks- 5 Years
72 LITTLE CHAMPIONS LEARNING CTR II 55 6 Weeks- 13 Years
73 LITTLE CHAMPIONS LEARNING CTR LLC 80 6 Weeks- 12 Years
74 LITTLE SAINTS CHILD CARE CENTER 184 4 Weeks- 11 Years
75 LITTLE V I P CHILD CARE 45 6 Weeks- 12 Years
76 LOTS FOR TOTS EARLY EDUCATIONAL CTR 48 6 Weeks- 13 Years
77 LOV N CARE CHILDREN'S ACADEMY 76 4 Weeks- 12 Years
78 MOUNT PLEASANT RENAISSANCE SCHOOL 84 1 Year- 12 Years
79 MUSTARD SEED PRESCHOOL 48 2.5 Years- 5 Years
80 MY LITTLE SCHOOL HOUSE ECC 50 4 Weeks- 12 Years
81 NEXT GENERATION NOW 159 2 Weeks- 12 Years
82 NOAH'S ARK PRESCHOOL 36 3 Years- 5 Years
83 NORTH SIDE PRESCHOOL 20 3 Years- 6 Years
84 ONE STEP AHEAD DAY CARE CENTER 110 2 Weeks- 12 Years
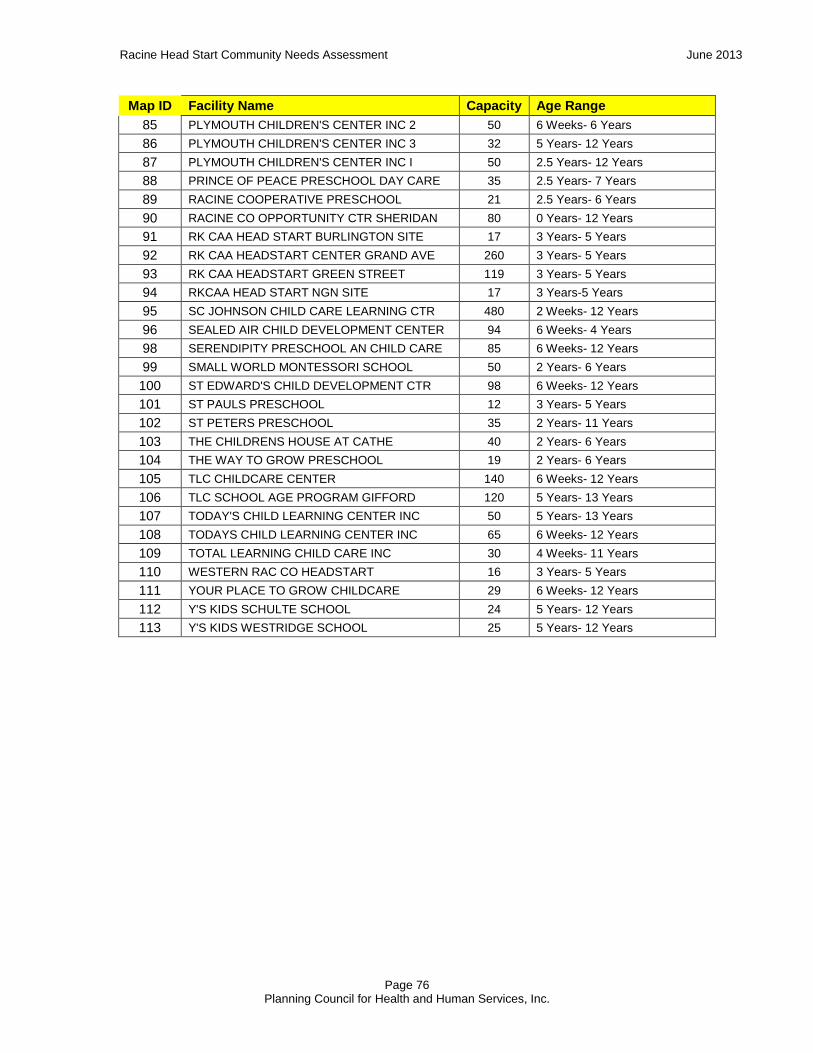
Racine Head Start Community Needs Assessment June 2013
Page 76 Planning Council for Health and Human Services, Inc.
Map ID Facility Name Capacity Age Range
85 PLYMOUTH CHILDREN'S CENTER INC 2 50 6 Weeks- 6 Years
86 PLYMOUTH CHILDREN'S CENTER INC 3 32 5 Years- 12 Years
87 PLYMOUTH CHILDREN'S CENTER INC I 50 2.5 Years- 12 Years
88 PRINCE OF PEACE PRESCHOOL DAY CARE 35 2.5 Years- 7 Years
89 RACINE COOPERATIVE PRESCHOOL 21 2.5 Years- 6 Years
90 RACINE CO OPPORTUNITY CTR SHERIDAN 80 0 Years- 12 Years
91 RK CAA HEAD START BURLINGTON SITE 17 3 Years- 5 Years
92 RK CAA HEADSTART CENTER GRAND AVE 260 3 Years- 5 Years
93 RK CAA HEADSTART GREEN STREET 119 3 Years- 5 Years
94 RKCAA HEAD START NGN SITE 17 3 Years-5 Years
95 SC JOHNSON CHILD CARE LEARNING CTR 480 2 Weeks- 12 Years
96 SEALED AIR CHILD DEVELOPMENT CENTER 94 6 Weeks- 4 Years
98 SERENDIPITY PRESCHOOL AN CHILD CARE 85 6 Weeks- 12 Years
99 SMALL WORLD MONTESSORI SCHOOL 50 2 Years- 6 Years
100 ST EDWARD'S CHILD DEVELOPMENT CTR 98 6 Weeks- 12 Years
101 ST PAULS PRESCHOOL 12 3 Years- 5 Years
102 ST PETERS PRESCHOOL 35 2 Years- 11 Years
103 THE CHILDRENS HOUSE AT CATHE 40 2 Years- 6 Years
104 THE WAY TO GROW PRESCHOOL 19 2 Years- 6 Years
105 TLC CHILDCARE CENTER 140 6 Weeks- 12 Years
106 TLC SCHOOL AGE PROGRAM GIFFORD 120 5 Years- 13 Years
107 TODAY'S CHILD LEARNING CENTER INC 50 5 Years- 13 Years
108 TODAYS CHILD LEARNING CENTER INC 65 6 Weeks- 12 Years
109 TOTAL LEARNING CHILD CARE INC 30 4 Weeks- 11 Years
110 WESTERN RAC CO HEADSTART 16 3 Years- 5 Years
111 YOUR PLACE TO GROW CHILDCARE 29 6 Weeks- 12 Years
112 Y'S KIDS SCHULTE SCHOOL 24 5 Years- 12 Years
113 Y'S KIDS WESTRIDGE SCHOOL 25 5 Years- 12 Years
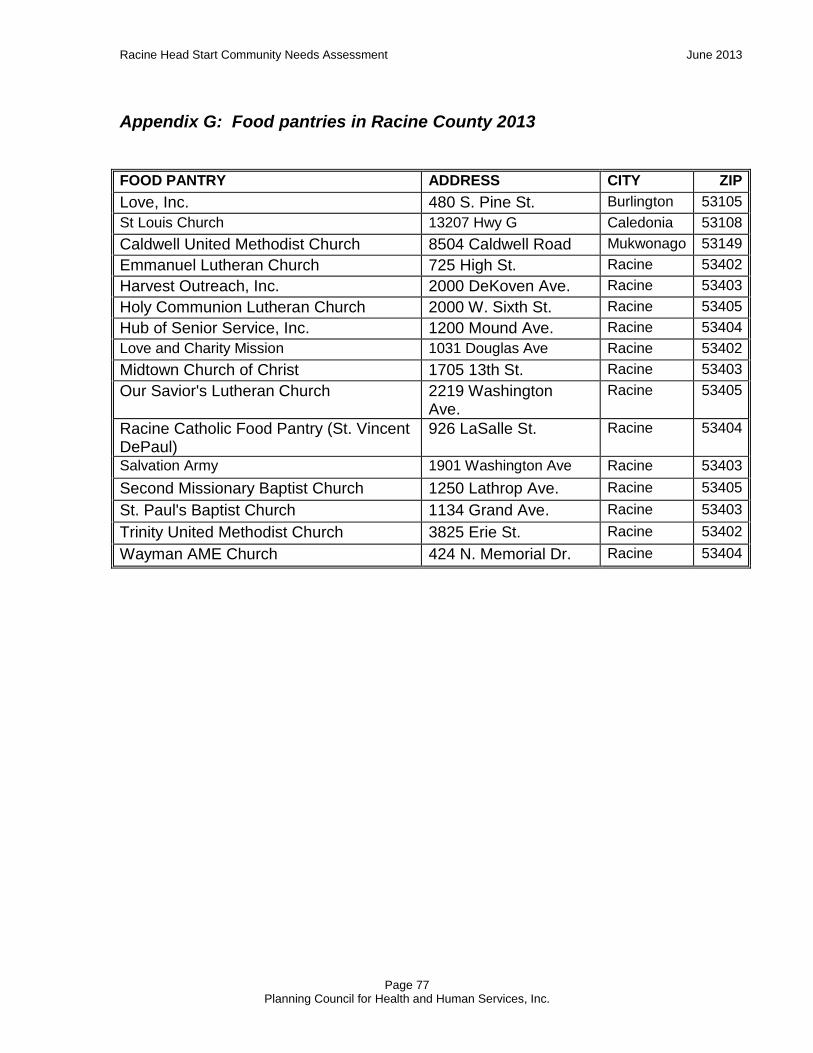
Racine Head Start Community Needs Assessment June 2013
Page 77 Planning Council for Health and Human Services, Inc.
Appendix G: Food pantries in Racine County 2013
FOOD PANTRY ADDRESS CITY ZIP
Love, Inc. 480 S. Pine St. Burlington 53105
St Louis Church 13207 Hwy G Caledonia 53108
Caldwell United Methodist Church 8504 Caldwell Road Mukwonago 53149
Emmanuel Lutheran Church 725 High St. Racine 53402
Harvest Outreach, Inc. 2000 DeKoven Ave. Racine 53403
Holy Communion Lutheran Church 2000 W. Sixth St. Racine 53405
Hub of Senior Service, Inc. 1200 Mound Ave. Racine 53404
Love and Charity Mission 1031 Douglas Ave Racine 53402
Midtown Church of Christ 1705 13th St. Racine 53403
Our Savior's Lutheran Church 2219 Washington Ave.
Racine 53405
Racine Catholic Food Pantry (St. Vincent DePaul)
926 LaSalle St. Racine 53404
Salvation Army 1901 Washington Ave Racine 53403
Second Missionary Baptist Church 1250 Lathrop Ave. Racine 53405
St. Paul's Baptist Church 1134 Grand Ave. Racine 53403
Trinity United Methodist Church 3825 Erie St. Racine 53402
Wayman AME Church 424 N. Memorial Dr. Racine 53404