radar interferometry technique for urban subsidence...
TRANSCRIPT

RADAR INTERFEROMETRY TECHNIQUE FOR URBAN SUBSIDENCE MONITORING A CASE STUDY IN BANGKOK AND ITS VICINITY
J. Worawattanamateekul(1,3), J. Hoffmann(1), N. Adam(2), B. Kampes(2) W. Altermann(3)
(1) German Remote Sensing Data Center-DFD, German Aerospace Center-DLR (2) Remote Sensing Technolology Institute-IMF,German Aerospace Center-DLR
Münchner Strasse 20 Oberpfaffenhofen, Wessling 82234 Germany. (3) Department for Earth and Environmenal Science, Ludwig-Maximilians Universität München
Luisenstrasse 37, 80333 Munich Germany [email protected]
ABSTRACT
Temporal decorrelation and inhomogeneous atmospheric conditions in tropical climates restrict the successful application of classical differential interferometry for displacement detection. The recently developed ‘Permanent Scatterer’ interferometry can overcome these difficulties by analyzing phase histories of coherent point targets within a multi-interferogram framework. Temporal phase unwrapping is applied to obtain a displacement rate estimate based on a linear deformation model. Two tracks of 11 and 21 scenes of ERS-1/2 SAR data were used to derive an estimate of the displacement rate field in Bangkok by this approach. The results are compared with precise levelling measurements.
1 INTRODUCTION
Effects of temporal decorrelation and a highly dynamic atmosphere in the tropical climate of Bangkok are the two main limitations restricting a successful application of Differential Interferometric Synthetic Aperture Radar (DInSAR) for displacement detection and monitoring. Recently, the so called “Permanent Scatterer (PS)” Interferometry (PSInSAR) [1-3] has been suggested to provide a solution to these difficulties. This technique relies on analyzing only pixels for which the scattering is dominated by point-like targets that remain coherent over long time periods and a wide range of baseline geometries. Therefore, radar pixels dominated by these coherent scatterers are less affected by temporal decorrelation. When enough interferograms can be used, the phase time-series at these PS can be exploited for displacement rate estimation. The contribution of atmospheric phase components can also be estimated statistically and removed.
Subsidence in Bangkok has been measured primarily using conventional surface levelling. Though it is very accurate, it can provide only point-wise subsidence information. However, this point-wise information is insufficient to fully understand the subsidence mechanism in the heterogeneous aquifer system. In
contrast, radar interferometry enables high resolution displacement measurements on a regular grid (in DInSAR case only) , low cost and time requirement and large coverage. Such high resolution displacement maps are useful for future strategic planning, better groundwater resource management and urban planning. This paper presents the application of radar interferometry, and the permanent scatterer analysis in particular, for the derivation of urban subsidence rates in Bangkok. We investigate the feasibility and reliability of applying this technique with relatively few acquisitions.
2 GEOLOGICAL INFORMATION RELATED TO SUBSIDENCE
Bangkok is situated in the flat, low-lying area of the Lower Central Plain or Lower Chao Phraya Basin about 25 km north of the Gulf of Thailand. The Lower Central Plain has a tropical savanna climate influenced by the monsoons with an average annual rainfall of 1176 mm. The average elevation of Bangkok is 1.5m A.S.L [4]. Unconsolidated sediments deposited since the Quaternary-period constitute the multi-aquifer system of Bangkok, which can be classified into 8 aquifers. Fig. 1 shows a hydrogeological strata cross section of the Lower Central Plain in the north to south direction. The basin is composed of unconsolidated alluvial deposits such as sand and gravel separated by thick confining layers of clay and silty, sandy clay [5]. Among these aquifers, the Nakorn Luang (NL) aquifer (100-140m depth) can provide good quality of water and is used as the main groundwater resource for water supply in Bangkok [4].
_____________________________________________________Proc. of the 2004 Envisat & ERS Symposium, Salzburg, Austria 6-10 September 2004 (ESA SP-572, April 2005)

Fig 1. Geological strata cross-section of southern part of Lower Chao Phraya Basin (N-S direction)
Fig 2. Geological map of Bangkok and surroundings Sediments deposited during the marine transgression in the Holocene epoch now constitute the Holocene delta sequence. This sequence consists of marine or soft clay, or ‘Bangkok clay’ (proposed by Groundwater Division, Department of Mineral Resources (DMR), Bangkok), underlying the intertidal deposit and recent floodplain sediments. The Bangkok clay is the top confining layer and its compaction causes the most serious problems to buildings, roads and major infrastructures. Fig. 2 presents the geological map of southern part of the Lower Central Plain including Bangkok and surroundings. Both natural processes and human-induced activities lead to degradation of the Chao Phraya deltaic environment. These factors are land subsidence especially in highly populated area, compaction and coastal erosion. Evidence of land subsidence has been documented mainly in the southern part of the Lower Central Plain, i.e. Bangkok and adjacent provinces. Many past studies have confirmed the relationship between the extensive extraction of groundwater and the subsidence in Bangkok [6-8]. Over the past years, mitigation of Bangkok’s subsidence by artificial recharge has been highly interested. Ref.[8] found that surface and deep recharging of water into Bangkok aquifer could result in the rebound of the recharged
aquifer at different magnitudes depending on the pore pressure deficits histories before recharging.
3 INTERFEROMETRIC STACKS Fig.3a shows the ERS-1/2 satellite coverage over Bangkok and its surrounding provinces. In section 4, we present the result obtained for the overlapping area of two adjacent ERS tracks, indicated by the red rectangle in Fig. 3b. Both are descending track. This aims to increase number of usable interferograms (IFGMs) that cover the same area for cross validation purposes. However, due to limited number of interferograms and density of PS available in the area, a smaller area of 8x10 km. (Fig. 3c) is selected for subsidence parameter estimation initially.
Source: Kuehn et al., 2004
Track 247
a
Bangkok
AOI b
Track 018 a
Source: Kuehn et al., 2004
c
Fig 3. (a) Two scenes of ERS coverage (black squares) over Bangkok and its surroundings obtained for PS analysis (b) Shows the Area of Interest (AOI) located south of Bangkok as the initial test site used for this study. (c) zoom-in of the test area. A total of 17 and 11 Single Look Complex (SLC) images of the left stack (track 018) and the right stack (track 247), respectively, were processed using the scientific permanent scatterer system developed at DLR [10]. Recently, an additional 4 SLC scenes have been acquired for the left stack so that now 20 IFGMs can be used. In section 6, result from PS analysis of 20 IFGMs will be presented and compared with 10 and 16 IFGMs.

Fig 4. presents the spatio-temporal baseline diagram of the left interferometric stack for the master scene (orbit 6886). The master scene is chosen in the middle of this diagram in order to minimize the spatial and temporal baselines for the interferogram stack. Temporal and spatial baseline distribution of the left interferometric stacks (blue diamond: 20 slave scenes, orange triangle: selected master scene).
4 CLASSICAL DIFFERENTIAL INTERFEROMETRY FOR DISPLACEMENT DETECTION IN BANGKOK
4.1 Derivation of differential interferograms A radar antenna transmits the radar signal and receives the backscattered echoes from the Earths surface. The returned signal is preserved in a complex signal format with its real and imaginary components. In interferometric technique, two radar images are acquired at different time t1 and t2 from slightly different satellite positions characterized by an interferometric baseline (B). R and R’ as illustrated in Fig.5 represent the radar range at t1 and t2 respectively, θ depicts the satellite look angle while Hsat represents the satellite altitude which is about 785 km. Based on the InSAR geometry, the range difference between R and R’ or ∆R indicated by red line in Fig.5 is proportional to the interferometric phase (ΦP). Alteration of topographic height, atmospheric phase contribution, and small displacement during the two acquisitions therefore could contribute to ∆R inducing an interferometric phase. Fig. 5 illustrates the basic imaging geometry for InSAR. Hence, the phase at particular point P in an interferogram can be expressed as
(1)
2442124922
440941540314401
5884488224555
108947387
22050
7888240544381
5383
25056
6385
13399
16405
13900
6886
-1000
-500
0
500
1000
1500
2000
-500 0 500 1000 1500Time (Days)
Bas
elin
e (m
)
Fig 5. InSAR imaging geometry and its related small displacement component Eq.1 shows that an interferometric phase ΦP is the sum of several phase contribution terms, namely Φtopo which is related directly to topographic height (h) and perpendicular baseline (B⊥), displacement Φdisp, changes in atmospheric propagation Φatmo, orbit error Φorbit and noise Φnoise. With only a single interferogram, one cannot separate all different phase contributions. Therefore, either phase terms from other sources must be known, or a multi-interferogram approach is necessary to separate the displacement phase from another phase components. The topography of Bangkok area is extremely flat with elevation ranging from 0.5 to 1.5 A.S.L. [7]. Therefore, the topographic phase contribution in this case is insignificant for all but the largest perpendicular baselines. However, the topographic phase component is subtracted based on elevation information derived from the SRTM-X SAR mission, while orbit inaccuracy is reduced using precise orbit information processed by DPAF. After topographic correction, the differential interferometric phase is composed of the parts in Eq. 2.
noiseorbitatmdispdemerrorP φφφφφφ ++++= (2)
When all other phase components are known or estimated, the displacement phase can be obtained and the displacement value can then be derived. Eq. 3 presents the relationship between the small displacement ∆Rdiff in and its displacement phase Φdisp . (3) dispdiffR φλ
•=∆π4
noiseorbitatmdisptopoP Bh φφφφφφ ++++= ⊥),(

4.2 Limitation of DInSAR
(4)
Interferometric techniques like DInSAR rely on the coherence of the image signals. Eq. 4 expresses a relationship between observed phase Ψti with its two deterministic phase components Ψgeom,ti and Ψscat,ti and a stochastic or noise component nti in a simplified way after [11]. ti represent acquisition time where i=1,2 for the first and the second acquisition. Temporal decorrelation occurs due to scatterers’ change in a radar resolution cell that cause Ψscat,t1 ≠ Ψscat,t2 give rise to fluctuations in the interferometric phase. This leads to image decorrelation. The atmospheric path delay is in this case included in the geometric phase component and can also contribute to the observed phase variation Ψgeom,t1 ≠ Ψgeom,t2.
Fig. 6 shows the difficulty to maintain coherence for several interferometric pairs over Bangkok. In Bangkok case, small perpendicular baselines and long temporal baselines of an interferometric pair are preferable for subsidence detection. Unfortunately, strong temporal decorrelation effects affect images of Bangkok for longer temporal baselines preventing the detection of a displacement signal. Fig 6. Amplitude image and differential interferograms of Bangkok annotated with temporal and spatial baselines, respectively. The Chao Phraya river is highlighted in blue. It also shows that it is not possible to detect surface elevation changes in those data pairs due to decorrelation. Although some coherent phase signals can be seen locally (indicated by the red ellipse in Fig. 6), they are difficult to discern and cannot be used for
spatially extensive estimates. Based on this background, we therefore use the permanent scatterer technique to derive subsidence information for Bangkok.
iiii ttscattgeomt n++= ,, ψψψ5 PERMANENT SCATTERER ANALYSIS Unlike classical DInSAR, the PS technique analyzes phase time-series of the ‘coherent point scatterers’ or ‘Permanent Scatterer’ [1] based on an assumed displacement model. Depending on the phase noise level at the PS, the reliability of the estimation increases with the number of interferograms used. Past experiments have indicated that the minimum number of interferograms is around 20-30 [1, 12]. Fig. 7 shows a flow diagram for PS analysis. After differential interferogram generation the amplitude images for the interferometric stack are calibrated. A PS selection procedure is then applied to these calibrated amplitude images.
Fig 7. PS analysis flow diagram
35D,478 m 2M,497 m
3Y5M,201m 1Y3M,29m
∆Φ
Amplitude and selected PS
∆
Phase distribution in 2D solution space
HP,
coh
VP,
Example maximizing function
Series of Interferograms
2. Reference Network Creation
4. Statistical Testing
3. Parameter Estimation (WLS)
lATMOQP
KQPK
PP
KPK
PP QPVTh
rB
,,,11
12,1
4sin
4 φλπ
θλπφ +••−•−= ⊥
1. PS selection
5. Estimate more points
5.1 Permanent scatterer selection The procedure aims to select radar pixels containing coherent point scatterers or ‘permanent scatterer’. These pixels are considered to be unaffected or less affected by geometrical and temporal decorrelation and their phase time-series (phase history) can be exploited for displacement rate estimation based on the assumed linear deformation model. Two estimators for phase error estimation have been proposed. Ref. [3] invented and proposed to use the dispersion index (DA) which is the ratio between the amplitude’s standard deviation (σA) and the mean amplitude (mA) especially for PS technique. An estimate of phase error is derived from the average of the calibrated amplitude and its standard deviation of all SAR time-series. Unlike the former estimator, Signal to Clutter (SCR) ratio [13] requires an estimation window containing a point scatterer and its neighbourhood pixels. By this mean, SCR of every radar scenes can be estimated and used to track SCR evolution over time. These two estimator’s properties are discussed and compared in [14].
5.2 Parameter estimation on a network After the PSs are selected, these are connected by arcs which form a ‘reference network’, on which the further parameter estimation is performed. For each arc, the difference in topographic height error, LOS linear displacement rate, and the master atmosphere parameters between the two points connected by the arc are estimated in a grid search maximizing the coherence function (see Fig.7). Then, the parameters are estimated at the PS by weighted least-square (WLS) adjustment. Additional statistical testing is performed to assure the reliability of the result. Unreliable arcs and points will be eliminated at this step. Finally, parameters for additional PS will be estimated relative to the reference network. More detail about this network algorithm can be found in [12]. In section 6, linear displacement rate estimates resulting from PS analysis using 10, 16 and 20 IFGMs will be presented and discussed.
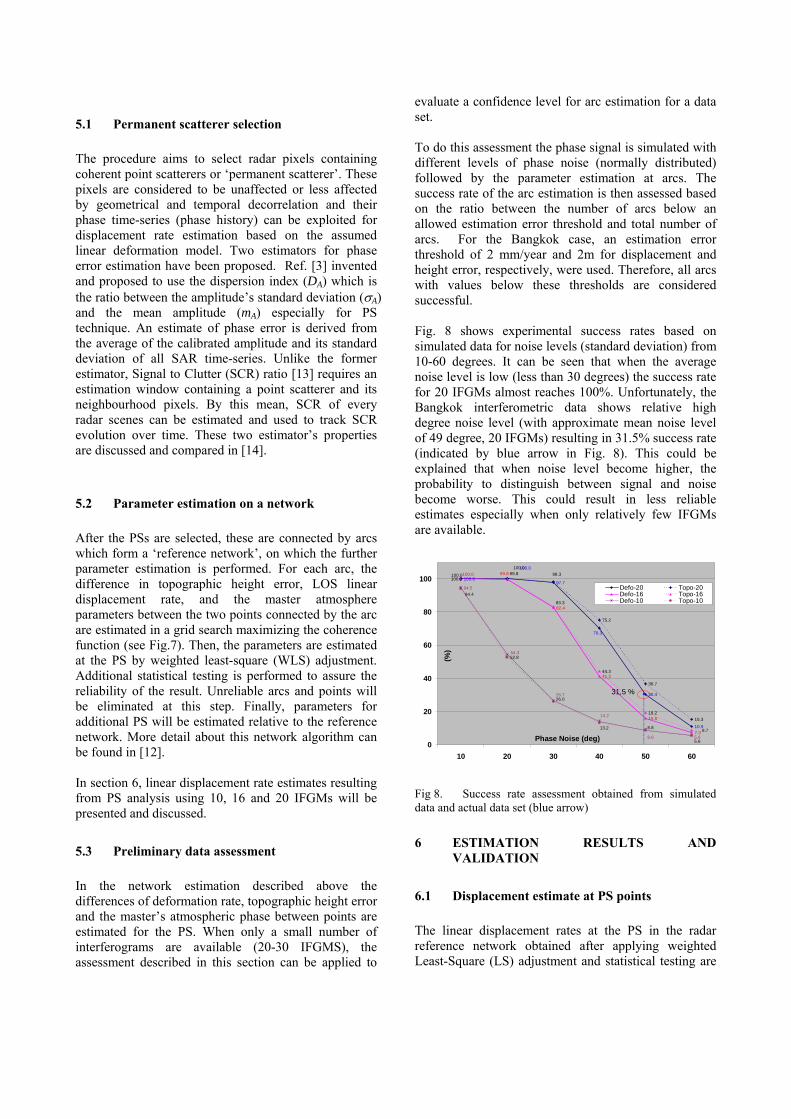
5.3 Preliminary data assessment In the network estimation described above the differences of deformation rate, topographic height error and the master’s atmospheric phase between points are estimated for the PS. When only a small number of interferograms are available (20-30 IFGMS), the assessment described in this section can be applied to
evaluate a confidence level for arc estimation for a data set. To do this assessment the phase signal is simulated with different levels of phase noise (normally distributed) followed by the parameter estimation at arcs. The success rate of the arc estimation is then assessed based on the ratio between the number of arcs below an allowed estimation error threshold and total number of arcs. For the Bangkok case, an estimation error threshold of 2 mm/year and 2m for displacement and height error, respectively, were used. Therefore, all arcs with values below these thresholds are considered successful. Fig. 8 shows experimental success rates based on simulated data for noise levels (standard deviation) from 10-60 degrees. It can be seen that when the average noise level is low (less than 30 degrees) the success rate for 20 IFGMs almost reaches 100%. Unfortunately, the Bangkok interferometric data shows relative high degree noise level (with approximate mean noise level of 49 degree, 20 IFGMs) resulting in 31.5% success rate (indicated by blue arrow in Fig. 8). This could be explained that when noise level become higher, the probability to distinguish between signal and noise become worse. This could result in less reliable estimates especially when only relatively few IFGMs are available.
100.097.7
30.4
10.9
75.2
36.7
15.3
Fig 8. Success rate assessment obtained from simulated data and actual data set (blue arrow)
6 ESTIMATION RESULTS AND VALIDATION
6.1 Displacement estimate at PS points The linear displacement rates at the PS in the radar reference network obtained after applying weighted Least-Square (LS) adjustment and statistical testing are
82.4
15.8
7.3
44.341.3
99.8100.0 99.8
8.
19.2
94.5
52.8
100.0
70.3
98.3100.0
100.0
83.3
100.0
78.6 5.6
26.7
14.2
54.3
13.2 8.8
5.6
94.4
26.0
0
20
40
60
80
100
10 20 30 40 50 60
Phase Noise (deg)
(%)
Defo-20 Topo-20Defo-16 Topo-16Defo-10 Topo-10
31,5 %

presented in Fig.9. The initial PS density in the test area is approximately 430 PS/km2. In general, not all PS behave like ideal point scatterers. During parameter estimation, LS adjustment and statistically testing of the established radar reference network eliminate unreliable PS while preserving reliable PS from which later form a more stable reference network. This results in a PS density reduction of about 5 PS/km2 in resulted reference network. It should be noted that the number of IFGMs used in the PS analysis and the noise level highly influence the reliability of the resulting estimate. In addition, if the level of phase noise increases, the chances for successful temporal phase unwrapping also decreases. As indicated in Fig.9, the vertical displacement rates estimated at the PS in the test area range from 0-5 mm/year (no movement to uplift) to approximately -50 mm/year (subsidence). The minimum displacement rate (blue-square PS in Fig. 9) is found next to Chao Phraya river in the Poochao Saming-Prai area, Samutprakarn. The maximum displacement rate (black-square PS) is found near the intersection between Sukhumvit and Bangna-Trad road.
Fig 9. Displacement estimate result at PS location obtained from PS analysis of 20 IFGMs
6.2 Spatial displacement fields Based on the estimation at the PS, the displacement rate field was derived by kriging interpolation. The resulting distribution of subsidence (displacement) rates is depicted in Fig. 10. Comparison of interpolated displacement fields derived from 10, 16 and 20 IFGMs gives an impression how the number of IFGMs used for PS analysis affecting on the variability of displacement estimates. Generally, we can observe the same spatial trends in all the three fields. The subsidence rates increase from the northwest to the southeast. Note though, that the displacement estimate shown in Fig. 10a was obtained from PS analysis of a
different interferometric stack. We still observe relatively similar subsidence estimates in all 3 cases. Comparing the interpolated fields derived from 16 and 20 interferograms from the same data stack (Fig. 10b and 10c), we can observe that the extent and delineation of displacement are relatively similar, except that the field derived from only 16 IFGMs shows more variability of the subsidence rate magnitudes. This might be due to the higher uncertainty of the estimation.
Fig 10. Subsidence fields derived by kriging interpolation of PS estimates (a) 10 IFGMs (b) 16 IFGMs and (c) 20 IFGMs. The estimate shown in (a) is derived from an independed set of data.
a
b
c
Interpolated Displacement (mm/year)20,01 - 25
15,01 - 20
10,01 - 15
5,01 - 10
0,01 - 5
-4,99 - 0
-9,99 - -5
-14,99 - -10
-19,99 - -15
-24,99 - -20
-29,99 - -25
-34,99 - -30
-39,99 - -35
-40,99 - -40

-13.6
-21.9-19.9
-4.2
-20.9
-4.0
-9.8
-13.8
-24.4
-8.9
-35.00
-30.00
-25.00
-20.00
-15.00
-10.00
-5.00
0.00
5.00
10.00
15.00
20.00667300 667720 670800 671473 672200 672400 672600 673300 674200 675380
Ave
rage
Sub
side
nce
(mm
/yea
r) Leveling-Benchmark20 IFGMs16 IFGMs10 IFGMs
WEST EAST
KR1308 KR3402/42DMR82 KR1307 KR1304/4 DMR15 KR1201 KR1202KR1303DMR13
The next section will present a quantitative comparison between the estimates and reference information derived from precise levelling information. It should be noted, however, that interpolation error, uncertainty due to non-linear displacement contribute to the estimates compared with the levelling data.
6.3 Comparison with levelling benchmarks To validate the linear displacement rate estimates from the PS analysis using the levelling data the line-of-sight displacement rates must be converted to vertical displacement rates and be interpolated at the available levelling benchmarks in the test area. Levelling information was available for 10 benchmarks in the area (Fig. 10c) and only the levelling information from the benchmark at depth not more than 1 meter is used. Linear subsidence rates were estimated from the data for each benchmark in order to compare with the linear subsidence rates derived from PS. It should be noted that the standard deviation of the subsidence rates estimated from the levelling measurements at each benchmark varies, depending on the levelling measurements. Fig 11. West- East comparison profile as delineated in Fig. 10c between leveling measurement and displacement estimates from PS analysis A comparison of the leveling and PS-derived estimates along a profile in the east-west direction (indicated by red-dashed line in Fig. 10c) demonstrates a reasonable agreement (Fig.11). An estimated interpolation error of each PS-derived estimate is indicated as error bar in Fig. 11. The mean error standard deviation from the interpolation is 5-7 mm/year. The error bars on the levelling measurements show only standard deviation from the linear Least-Square estimation (less than 1
mm/year). The levelling measurement is however within one standard deviation of the PS estimate. The estimates using more interferograms (from 10, 16 to 20 IFGMs) generally show a closer agreement with the reference information from the levelling. However, there are still significant discrepancies at some benchmark locations. This is probably due to the relatively poor quality of the PS estimates, which is compromised by the high noise-level and small number of interferograms. The minimum difference of 0.09 mm/year was found at benchmark KR3402/42 while the maximum difference was found at benchmark KR1303 (8 mm/year). Further analysis of these discrepancies is currently conducted. We aim at obtaining more robust estimates from the existing data set. However, despite the fact that the number of interferograms used in the estimation is small, the PS estimation result provides acceptable and sufficient accuracy to provide the overview subsidence pattern of Bangkok.
7 CONCLUSION AND FUTURE PERSPECTIVE
It was demonstrated that the successful application of the classical differential interferometry technique for subsidence detection in Bangkok is mainly limited by temporal decorrelation. Permanent scatterer analysis of a relatively small number of interferograms can provide displacement information that agrees with precise leveling information in the test area. The maximum difference between the two measurements was 8 mm/year. This difference could result from estimation error, inadequacy of linear model and interpolation error. However, the accuracy of the estimate is acceptable to provide an overview of subsidence extent and magnitude in the test area for planning purposes. Synergistic use of the PS analysis together with the precise leveling is recommended and can be beneficial to derive both regional subsidence information and detailed subsidence information at particular locations. Improvement of the estimates will be investigated by applying another PS selection criterion, the signal-to-clutter ratio. By this we hope to increase the PS density and improve the atmospheric phase correction.

8 REFERENCES [1] Ferretti A., Prati C., Rocca F. Permanent Scatterers in SAR Interferometry. IGARSS Proceeding 1999, Hamburg, Germany, 1528-1530.
linear id tterers
ology of the ower Central Plain, Thailand.
ironment Board, Bangkok, 1981. ] Nguyen A.D. Updating and Analysis of angkok Land Subsidence caused by Deep Well umping with Emphasis on Shallow Soil Settlement. Sc.Thesis, Bangkok, 1999. ] Giao H. P. Arteficial Recharge of Bangkok quifer System for Mitigation of Land Subsidence. PhD. issertation. December 1996. School of Civil ngineering, Asian Institute of Technology, Thailand. ] Kuehn F. Margane A., Tatong T., and Wever T. SAR-Based Land Subsidence Map for Bangkok,
hailand. Z. fuer Angewandte Geologie, January 2004, ermany. 0] Adam N., Kampes B., Eineder M., orawattanamateekul J., Kircher M. The Development
f a Scientific Permanent Scatterer System., ISPRS roceeding 2003, Hannover, Germany. 11] Hanssen R.F. Radar Interferometry: Data terpretation and Error Analysis. Kluwer Academic
ublishers, Dordrecht, 2001. 2] Kampes B., Adam N. Velocity Field Retrieval
3] CEOS. SAR Calibration Workshop, ESTEC,
[2] Ferretti A., Prati C., Rocca F. NonSubs ence Rate Estimation using Permanent Scain Differential Interferometry. IEEE TGARS, Vol. 38,No.5, September 2000, 2202-2212. [3] Ferretti A., Prati C., Rocca F. Permanent Scatterers in SAR Interferometry. IEEE TGARS, Vol.39, No.1, January 2001, 8-20. [4] Sinsakul S. Late Quaternary geL J. of Asian Earth Sciences 18 (2000), 415-426. [5] JICA. Study on Management of Groundwater and Land Subsidence in the Bangkok Metropolitan Area and its Vicinity. Unpublished report prepared for the Department of Mineral Resources and the Department of Public Works, 1995, 3 volumes, Bangkok, Thailand. [6] Nutalaya P. et al. Asian Institute of Technology. Investigation of Land Subsidence caused by Deep Well Pumping in the Bangkok Area, Office of the National Env[7BPM[8ADE[9InTG[1WoP [InP[1from long-term Coherent Points in Radar Interferometric Stacks. IGARSS Proceeding 2003, Toulouse, CDROM. [1Norordwijk, Netherlands, September 1993. [14] Adam N., Kampes B., Eineder M. The Development of a Scientific Persistent Scatterer System: Modifications for mixed ERS/Envisat Time Series. 6-10 September 2004, ENVISAT Symposium Proceeding, Salzburg, Austria.
9 ACKNOWLEDGEMENT The author would like to express her sincere thank to all supported organizations namely the Deutscher Akademischer AustauschDienst (DAAD), the German Aerospace Center (DLR) and the Ludwigs-Maximilians University of Munich (LMU). Sincere thank to the European Space Agency (ESA) for kindly support the ERS-SAR data under AOE.762.