radar - oxford brookes university · pdf filewas also used in aerospace applications where ......
TRANSCRIPT

WWW.BROOKES.AC.UK/GO/RADAR
RADAR Research Archive and Digital Asset Repository
Douglas, CE and Thite, A Effect of lubricant temperature and type on spur gear efficiency in racing engine gearbox across full engine load and speed range. Douglas, CE and Thite, A (2015) Effect of lubricant temperature and type on spur gear efficiency in racing engine gearbox across full engine load and speed range. Proceedings of the Institution of Mechanical Engineers, Part J: Journal of Engineering Tribology, 229 (9). pp. 1095-1113.
doi: 10.1177/1350650115574305
This version is available: https://radar.brookes.ac.uk/radar/items/52aeb62d-8d02-4d6e-938f-09b1806ca6ab/1/ Available on RADAR: March 2016 Copyright © and Moral Rights are retained by the author(s) and/ or other copyright owners. A copy can be downloaded for personal non-commercial research or study, without prior permission or charge. This item cannot be reproduced or quoted extensively from without first obtaining permission in writing from the copyright holder(s). The content must not be changed in any way or sold commercially in any format or medium without the formal permission of the copyright holders. This document is the post print version of the journal article. Some differences between the published version and this version may remain and you are advised to consult the published version if you wish to cite from it.

Effect of lubricant temperature and type on spur gear efficiency in racing engine gearbox across full engine load and speed range Calum Eric Douglas and Anand Thite
Abstract Energy losses are of great significance to the automotive and motorsports industries. Many of these losses are incurred during power transmission through the gearbox. There has been considerable research in this area, however, generally gear losses are not calculated at part load condition, nor are so called dry sump systems considered outside of motor racing. The method developed by Anderson & Loewenthal which considers efficiency over part-load conditions is used here to calculate geartrain losses with varying speed, load and temperature conditions in a spur gear type gearbox for motorsport application. Both oil bath (wet sump) and oil jet (dry sump) systems of lubrications are considered. The Changenet method is used to calculate the churning losses in the typical oil bath lubrication system. Seventeen different mineral and synthetic oils were evaluated. At 75kW engine output, 1200W were lost in the dry sump gearbox whereas 1320W were lost in the wet-sump gearbox – in 1st gear at 9000rpm engine speed. The oils studied showed a spread of total drive efficiency of 97.8 to 99% in the most extreme temperature case. Observation of how efficiency and film thickness relate to operating temperatures it is clear that tight temperature control is critical to obtain the potential benefits available from oil optimisation. The dry sump gearbox is predicted to be more efficient only above 5000rpm engine speed. Keywords: Gearbox tribology, spur gear efficiency, churning losses, Changenet, Anderson & Loewenthal, motorsport, CO2 emissions
Introduction
Gear drive efficiency is a subject whose importance is growing more and more every year as energy costs rise. A study conducted by the Danish Technological Institute (DTI) estimates that industrialised nations lose between 2 and 4% of GDP through mechanical friction.1 In the UK the Department for Transport published data showing that the average British driver travelled 12,000km per year, and that based on current trends even by 2035 - 76% of all freight will still be transported by road.2
A study based on New Eurpoean Driving Cycle, shows that for an increase in 1% of drivetrain efficiency, CO2 was reduced by over 0.8%. Hence in real whole vehicle transport conditons, the CO2 output reduction is almost directly proportional to drivetrain efficiency improvements. For comparison a 10% reduction in aerodynamic drag reduced C02 output by 3%3. A recent study conducted by Shell deomstrated that optimisation of engine oils alone gave 1.1% total fuel economy
savings, if both engine and gearbox oils were optimised together, the savings could be as much as 3%.4 Again, there are also benefits in terms of CO2 emissions - gear oil optimisation resulted in a saving of 0.25kg/h from a 20 ton truck.5 Virtually all modes of transport involve some power transmission by geartrain. In spite of all the research on cost savings, the energy loss associated with gearboxes has not been a priority to the automotive industry, as a result of (until recently) stable fuel prices, and the isolated focus on engine efficiency. The objective of the paper is to investigate and estimate the efficiency of a racing gear box containing spur gears. Although the subject is motorsport specific, the conclusions are equally valid to a mass production automotive gearboxes.
Department of Mechanical Engineering and Mathematical Sciences, Wheatley Campus, Oxford Brookes University, OX33 1HX, United Kingdom.
Corresponding authors: Calum Eric Douglas and Anand Thite Email: [email protected], [email protected],

Oxford Brookes University Formula Student Team designed a 4-speed sequential spur gearbox to mount their bespoke 600cc V-Twin petrol engine, which was in turn designed by students for the university’s Formula Student car.6 This paper concerns the analysis used to design the oil lubrication system of the gearbox. The suitability of both spray jet and oil bath type lubrication systems are explored. Although gear tribology continues to be an active field of research; Stavytsky states “While it is clear…that the rotational speed, gear geometrical parameters, degree of confinement, and density of the fluid surrounding the gear are important, the degree of effect and general solutions for reducing power loss are less clear”.7 The automotive gearbox is a special case as it deals with almost continually varying speed, load and temperature. Many standard calculations for gear efficiency may not always perform adequately under such conditions, as they are often developed to evaluate conditions typical of industrial power gearbox, in which case load and speed tend to be fixed. Other respects in which many gear efficiency calculation methods are unsuitable for the proposed application include are that they often do not include any terms for load independant losses such as windage and churning losses, which are speed dependant. 0nly the methods of Diab8 and Xu9 have been properly validated with experimental data10 But neither method includes a term for windage losses, which due to the high shaft speeds considered here was deemed a necessity. In 2005 a method was proposed by Höhn, which includes both load dependant and load independent factors, however no factor was available for judging influence of sprayjet lubrication.11 Also according to Johnson this method remains un-validated.10 Gear efficiency was investigated to a considerable depth by NASA at its Lewis Research Centre during the peak of the manned space program. At the time this research was also used in aerospace applications where gears were used, such as helicopter gearboxs and turbofan engines.12 In these applications mass is critically important and the gears cannot be designed with a large safety factor with respect to either mechanical loads or lubrication demands. This research was designed to push the boundaries of gear tribology systems design. Importantly, the Anderson & Loewenthal method (A&L) is specifically developed to predict losses at part load in addition to full load.13 This renders it well suited to study real conditions in automotive gearboxes. In addition to the factors discussed this method was chosen
as the most practical especially given the requirement for a relatively straightforward computer program to model this gearbox. The method used here, was compared by Anderson with those of Buckingham, Chiu, Merritt and Shipley – and gave good correlation to real test data.14 The proposed gearbox could have spray jet or oil bath lubrication. Since, the A&L method was developed for a spray jet type of lubrication, an alternative method is required to evaluate oil bath type lubrication. A method for calculating oil churning losses developed at University Lyon, by Changenet can be applied to analyse the design in order to compare the drive efficiency of dry sump vs. oil bath gear lubrication system.15 The Changenet method applies to the losses in oil bath churning only, and not to overall gear mesh gearbox efficiency as in A&L, since the A&L method was developed considering primarily only spray jet lubrication. By combining the Changenet and A&L methods, it becomes possible to compare dry and wet sump designs. Since the gearbox being considered is for motorsport application, spray jet lubrication is preferable over oil bath lubrication. A software tool was developed using MATLAB® 2008a. During the construction of this program several typographic errors were discovered in the original NASA publication of the A&L method, a request for correction was submitted, later accepted and the paper republished with errata on page three.16 Oil data was obtained from AGMA 925-A03 for fourteen different oils, of varying viscosity from SAE32 to SAE320. In addition three MIL-spec oils were added from SAE 12 to 23 grades. The AGMA oils were all mono-grades, of mineral and synthetic composition, including PAG and PAO oils. The calculations were performed across the whole speed range of the engine, and so allowed determination of the crossover point, at which either dry sump or wet sump lubrication becomes superior to the other - in terms of drive efficiency. This point is clearly shown in the results here and at typical shaft speeds in production gearboxes wet sump remains more practical and more efficient. Lambda ratio (Λ), which is the ratio of the minimum oil film thickness to the composite surface roughness of the two surfaces, will be shown for each oil, across its temperature and load ranges. The gear life deteriorates rapidly at Λ≤1 and friction increasing at high ratios, illustrating the passage from left to right across the Stribeck curve. Finally conclusions are drawn based on how lubricant type and temperature influence the efficiency.
The theoretical model

The A&L method accounts for sliding, rolling, windage and bearing losses. The sliding losses are dependent on the coefficient of friction, which is calculated at several points along the path of contact line, taking account of tooth load sharing. Rolling and windage losses are principally hydrodynamic, and independent of friction. These friction independent losses are significant at part loads, when insufficient tooth normal loads exist to generate high sliding losses. The details of the model given here consider only the spur gear pairs.
Anderson & Loewenthal Method applied to Automotive gearbox
Geartooth powerloss due to sliding and rolling Rolling losses are essentially hydraulic pumping losses, squeezing the oil as it is compressed in the Hertzian contact zone, sliding losses are in basic terms a function of sliding speed and the toothface friction coefficient. The trend for each is distinguished by sliding velocity tending towards zero at the pitch point, whereas rolling velocity remains relatively constant across one tooth-pair mesh cycle.
2
2
1
Where Ps(x) and Pr(x) are instantaneous power losses due sliding and rolling at contact point x along the gear line of action, 1… 4 represent points along the gear line of action and and are average power-losses due to sliding and rolling taken over gear line of action. Points between 2… 3represent when one geartooth takes full load, else load is shared between two pairs of teeth. The details of instantaneous sliding and rolling power losses are given in the Appendix.
Simplified Sliding and Rolling expressions for total rolling and sliding losses Equation 1, can be simplified into algebraic expressions due to the simple single/dual tooth contact phases which define the tooth loading across a single tooth-pair contact cycle – for both sliding (Eq. 2) and rolling losses (Eq. 3).
ʆ1 ʆ2 ʆ3ʆ4 ʆ52
ʆ6 2
ʆ1 ʆ2 ʆ3 ʆ5ʆ6
3
Where ʆ1… ʆ6 are lengths along the gear line of action, and Xp is the point of mesh on gear mesh pitchline radius (see Appendix 3). The six lengths are used to distinguish the various phases of contact along the line of action, into single and dual tooth contact regions – which in turn define instantaneous tooth loading for correct
calculation of total sliding and rolling losses ( and ) across one full tooth engagement cycle.
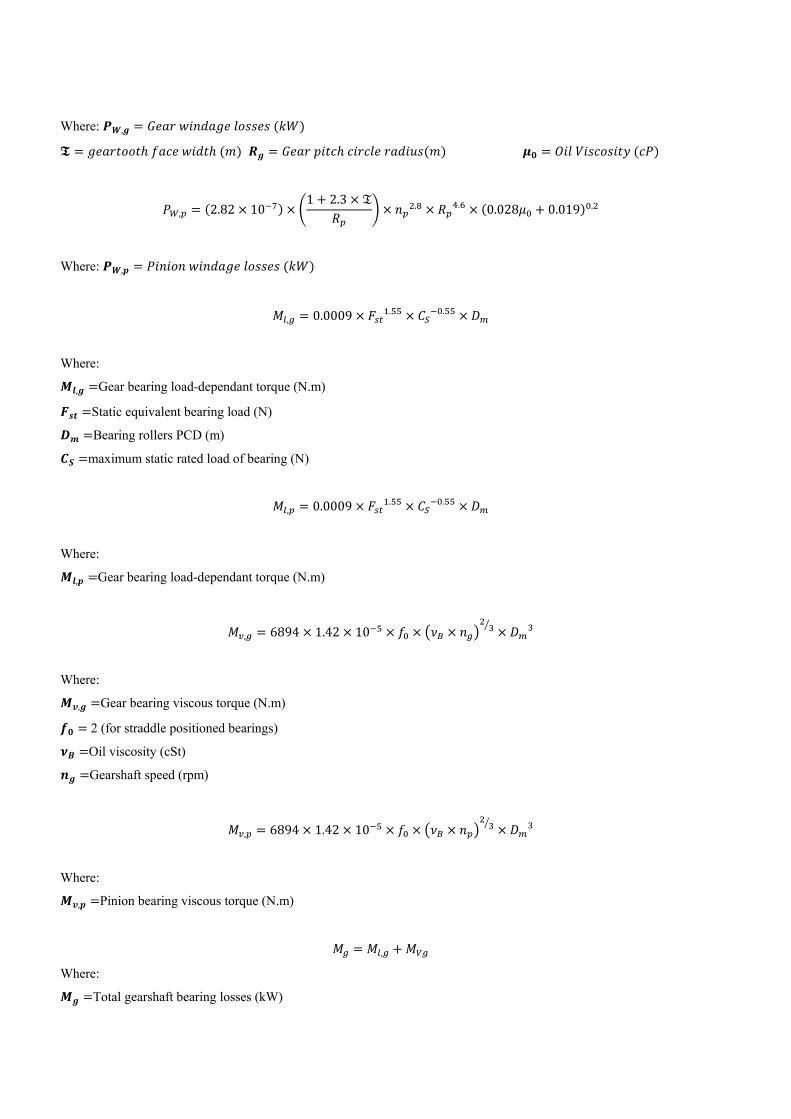
Windage Power losses
, 1.05 10 12.3Ƒ .
,
0.028 eq
0.019 . 4 Where: Ƒ is geartooth face width, Rp is Pinion pitch circle radius, np is pinion rotational speed and μeq is air/oil mist mixture absolute viscosity.
Ball Bearing Shaft Support Losses (for deep-groove ball bearings) Shaft support bearings create a significant proportion of total gearbox losses,13 here basic empirical formulae relating complex factors influencing the losses in bearings are given below for both load dependent and viscosity dependent losses.
0.009.
5
1.42 10
6894 6 Where: and are load and oil viscosity dependant losses, is static bearing load, is static bearing load capacity , is combined bearing radial and tangential
load, is ball bearing pitch diameter, is an oil lubrication method factor ( = 2 represents oil jet or partially flooded bath lubricated – not fully submerged),
is oil kinematic viscosity and is shaft rotational speed. Friction in rolling bearings is typically low as sliding speeds are also low, so losses are principally created by rolling and pumping, here jet lubrication is assumed. If the bearing races are fully or partially submerged in an oil-bath the losses will be increased – see influence of in Eq 6.
, , 7
, , 8
Where: Mg and Mp represent torque losses for gear and pinion respectively. Subscripts indicate gear or pinion for other terms.

2.05 10 9 Where: is total bearing power loss,
Churning loss calculation based on Changenet method A method was developed by Changenet at the University of Lyon specifically for calculating the losses incurred by gears churning in an oil bath. Using the two methods of A&L for oil jet losses and Changenet method for oilbath losses will enable an efficiency comparator between wet-sump and dry sump lubrication systems in terms of load-independent churning losses. The torque due to churning is given by
0.5 Cm (10)
Where: Cch=Churning Torque (N.m) ρ=Oil Density (kg/m3) Ω=Shaft Speed (Rads/sec) Rp=Gear Pitch Radius (m) Sm=Immersed Area of Pinion (m2) The torque can also be written in non-dimensional variables
0.373 . ..
. .
11
Where: Cm=Non-dimensional torque Vp=Volume displaced by submerged gears (m3) Vo=Volume of oil in sump (m3) hp=Immersion Depth of Pinion (m) b=tooth face width (m)
Re
(12) Where: Re= Reynolds Number v=Kinematic oil viscosity (Pa.s)
(13)
Where: Fr=Froude number g=acceleration due to gravity
(14) Where: PL=Dry Sump Pump, Pumping losses (W)
= Pump mass flow output (kg/s) h=Equivalent pressure head (m)
Lubricant Input Data In order to apply the A&L method, detailed oil test data is required, containing information not commonly available such as the pressure viscosity coefficient, and also viscosity and density at least with two different temperature points. The pressure viscosity coefficient is required to calculate film thickness, which is in turn required for rolling loss calculation. The Table 1 shows viscosity of 17 oils sourced from AGMA 925-A03 datasheets at reference temperature of 40 degrees C.
Oil Test Number
Lubricant type ISO Viscosity grade
1 Mineral oil 320 2 PAO 320 3 PAG 320 4 Mineral oil 220 5 PAO 220 6 PAG 220 7 Mineral oil 150 8 PAO 150 9 PAG 150
10 Mineral oil 100 11 PAG 100 12 Mineral oil 68 13 Mineral oil 46 14 Mineral oil 32 15 MIL-L-23699E 23 16 MIL-L-7808K
Grade 4 17
17 MIL-L-7808K Grade 3
12
Table 1. Raw oil data used in analysis.
Oils above ISO VG 320 were not considered here, as such high viscosity renders them well outside accepted boundaries for use in automotive gearboxes. The complete data from the AGMA 925-A03 datasheets provided the Kinematic viscosity and pressure viscosity coefficient at both 40 and 100 degrees Centigrade. In this case the data was interpolated between these two temperatures by logarithmic method according to ASTM D341. The analysis confined to the area between these two points, and hence, no extrapolation was carried out.
Design Procedure
The torque curve of the engine must be available to calculate system behaviour over the full range of speeds,

Figure 1. The engine generates maximum torque of 83Nm at about 9000rpm where as maximum power of 77 kW is generated at 12500rpm. The speed range is 5000 to 12500 rpm. Figure 2 is a flow chart
illustrating the procedure that was used to complete the analysis.
Figure 1. Software simulation of engine output of torque and power as a function of the engine speed.
Additionally the surface roughness and geometry data for the gears must be available. Table 2 shows geometrical details of gears of the 6 speed gearbox – with gear specifications of each gear, on both input and output shaft pair. The module varies between 2.33 to
2.87, in order to achieve specific gearing on a common shaft pair on a 56mm shaft-centre distance.
Gear Number of
teeth Ratio Addendum
Circular
Pitch Module Tooth
face width
Input shaft mm mm mm
1 13 2.31 2.60 8.18 2.60 13.55
2 14 1.79 2.87 9.03 2.87 15.9
3 16 1.50 2.80 8.80 2.80 9.9
4 19 1.32 2.55 8.00 2.55 9.9
5 22 1.18 2.33 7.33 2.33 10.6
6 19 1.11 2.80 8.80 2.80 10.6
Mainshaft
1 30 10.5
2 25 10.8
3 24 10.2
4 25 9.8
5 26 9.23
6 21 9.46
Table 2. Reverse engineered Spur gear geometry.
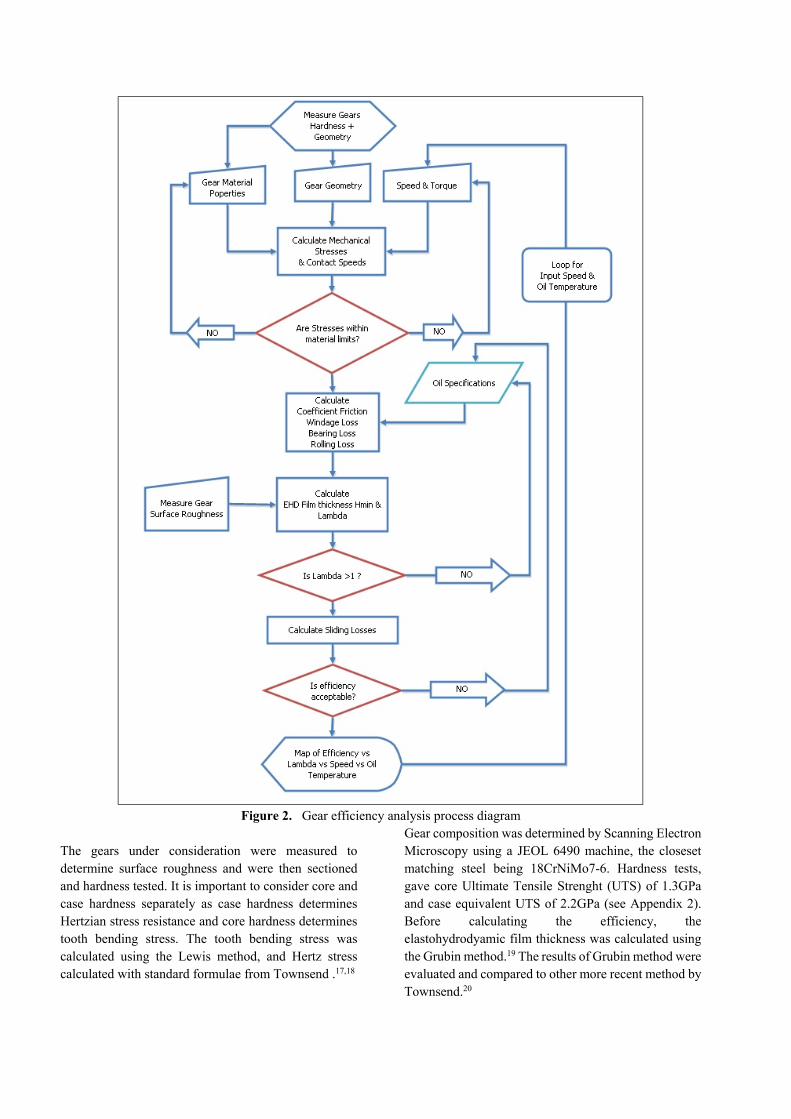
Figure 2. Gear efficiency analysis process diagram
The gears under consideration were measured to determine surface roughness and were then sectioned and hardness tested. It is important to consider core and case hardness separately as case hardness determines Hertzian stress resistance and core hardness determines tooth bending stress. The tooth bending stress was calculated using the Lewis method, and Hertz stress calculated with standard formulae from Townsend .17,18
Gear composition was determined by Scanning Electron Microscopy using a JEOL 6490 machine, the closeset matching steel being 18CrNiMo7-6. Hardness tests, gave core Ultimate Tensile Strenght (UTS) of 1.3GPa and case equivalent UTS of 2.2GPa (see Appendix 2). Before calculating the efficiency, the elastohydrodyamic film thickness was calculated using the Grubin method.19 The results of Grubin method were evaluated and compared to other more recent method by Townsend.20

Figure 3. Photograph of actual gear clusters.
Figure 4. Gearbox internals showing layout and dry sump pump.

Results
A map of geartooth bending stress across the engines operating range was calculated (Figure 5), showing results for all gears. (In the final gearbox design, ratios 1 and 6 were discarded, giving a 4-speed gearbox). Second gear shows very low bending stress which is due to increased tooth width, as expected the general pattern shows a close correlation to the torque curve of the engine.
Figure 5. Geartooth bending stresses calculated for
all six speeds.
Core UTS is around 1300MPa, with a peak bending stress of 360MPa, this gear set could proceed on to the next stage, Hertzian stress calculation.
Figure 6. Geartooth Hertzian stress
Figure 6 shows the Hertzian stress calculations, showing broadly the same pattern as bending stress (the trend follows the engine torque curve shape). The contact stresses peak at almost 1GPa, which is very high, but is by no means unusual in highly loaded gear contacts. The
gearteeth have a deep hardened case, with peak hardness of over 63HRc; this provides an acceptable level of safety for contact stress (63HRc corresponds to over 2GPa case strength).
Figure 7. Gearbox efficiency vs. oil type, vs. oil
temperature. (9000rpm 1st gear).
Figure 7 shows results at a fixed gear speed (in this case the speed at which maximum torque is produced). The drive efficiency of the seventeen chosen oils is compared to oil temperature. Obviously visible, is the lower drive efficiency of the more viscous oils. These results are all assuming oiljet-lubrication.
Figure 8. Oil Temperature vs. oil type, vs. Lambda
ratio (9000rpm 1st gear). Figure 8 shows the effect of oil temperature on Λ for each oil over the expected operating temperature range. As expected, as the oils get thinner to the right of the graph Λ decreases, indicating lower film thickness. The results tend to converge in terms of film thickness as temperature rises. Also, at lower temperatures wide

variation in film thickness among oils of the same viscosity can be seen – stressing the value of correct oil choice to minimize losses during warmup.
Figure 9. Gearbox efficiency vs. oil type, vs. engine
speed (1st gear at 40 Deg. C). Figure. 9 shows the results of drive efficiency at fixed temperature vs engine speed. We can see that in the thicker oils the torque curve of the engine is clearly reflected in the efficiency but, this trend diminishes as oils of lower viscosity are tested. For reference, the 1.2% efficiency difference here between oils 1 and 17 would represent a loss of 26.6kW in a V10 era Formula One (F1) gearbox, transmitting 740kW through three gear meshes in series. Such a thick oil would, of course, never be used in an F1 gearbox, but it serves as a good illustration of the kind of differences shown in drive efficiency.
RPM vs Oil Type vs Efficiency at 70 Deg C
Figure 10. Gearbox efficiency vs. oil type, vs. engine
speed. (70 Deg. C)
Shown in Figure. 10, are the same results but at 30 degrees C above those of the previous graph. The overall trends remain the same, but the efficiency begins to converge for all the oils. With the thinnest oil (#17), efficiency now begins to drop slightly across the whole speed range indicating that the oil film regime is now moving left down the Stribeck curve; towards a mixed lubrication region. The Stribeck curve being the classic representation in tribology literature of the variation of friction, as a function of viscosity, velocity and load – and their values through boundary, mixed hydrodynamic and finally elastohydrodynamic regimes.
Figure 11. Gearbox efficiency vs. oil type, vs. engine
speed (100 Deg. C). Figure. 11 shows that as the temperature reaches 100 degrees C, the efficiencies of all oils are within a narrow range of 98.7% to 98.8%. The thin oils now begin to show efficiency drops, especially at lower rotational speeds.
Figure 12. Lambda Ratio vs. oil type, vs. oil temp.

Two parameters were used to make the best oil choice, Λ and overall gearbox efficiency. These were related in turn to oil temperature, so that over the expected range of operation the oil would perform satisfactorily. For example, by first eliminating all oils giving conditions below Λ=1, Figure. 12 shows that oils 12 to 17 are not viable above 50degrees C.
Figure. 13 shows oils with efficiency of less than 98.75% being eliminated, which means that oils 1 to 8 are also unsatisfactory, below 50degrees C.
Figure 13. Gearbox efficiency vs. oil type, vs. oil temp.
Figure 14. Annotated version of Figure 10.
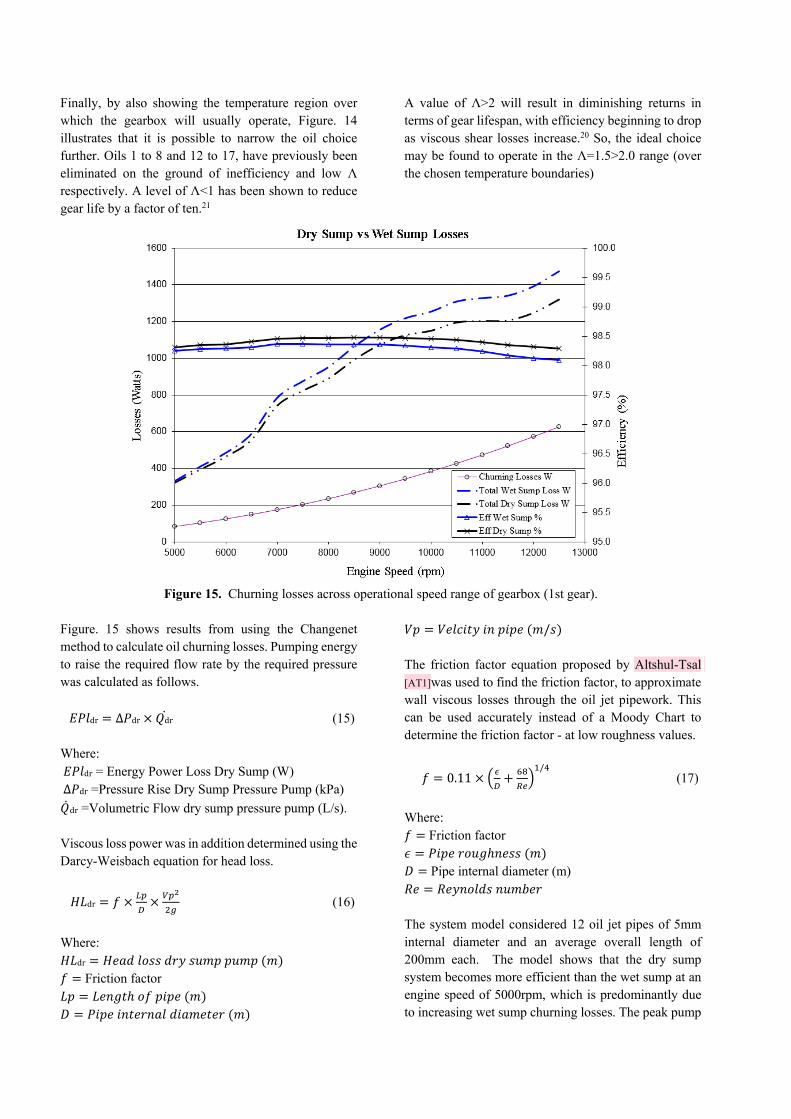
Finally, by also showing the temperature region over which the gearbox will usually operate, Figure. 14 illustrates that it is possible to narrow the oil choice further. Oils 1 to 8 and 12 to 17, have previously been eliminated on the ground of inefficiency and low Λ respectively. A level of Λ<1 has been shown to reduce gear life by a factor of ten.21
A value of Λ>2 will result in diminishing returns in terms of gear lifespan, with efficiency beginning to drop as viscous shear losses increase.20 So, the ideal choice may be found to operate in the Λ=1.5>2.0 range (over the chosen temperature boundaries)
Figure 15. Churning losses across operational speed range of gearbox (1st gear). Figure. 15 shows results from using the Changenet method to calculate oil churning losses. Pumping energy to raise the required flow rate by the required pressure was calculated as follows.
dr ∆ dr dr (15) Where: dr = Energy Power Loss Dry Sump (W) ∆ dr =Pressure Rise Dry Sump Pressure Pump (kPa)
dr =Volumetric Flow dry sump pressure pump (L/s). Viscous loss power was in addition determined using the Darcy-Weisbach equation for head loss.
dr (16)
Where:
dr Friction factor
/ The friction factor equation proposed by Altshul-Tsal [AT1]was used to find the friction factor, to approximate wall viscous losses through the oil jet pipework. This can be used accurately instead of a Moody Chart to determine the friction factor - at low roughness values.
0.11/
(17)
Where:
Friction factor
Pipe internal diameter (m)
The system model considered 12 oil jet pipes of 5mm internal diameter and an average overall length of 200mm each. The model shows that the dry sump system becomes more efficient than the wet sump at an engine speed of 5000rpm, which is predominantly due to increasing wet sump churning losses. The peak pump
losses are 470W to drive the dry sump pump, and 626W are lost to churning in a wet sump system - giving an advantage of 156W to the dry sump system at 12,500rpm engine speed.
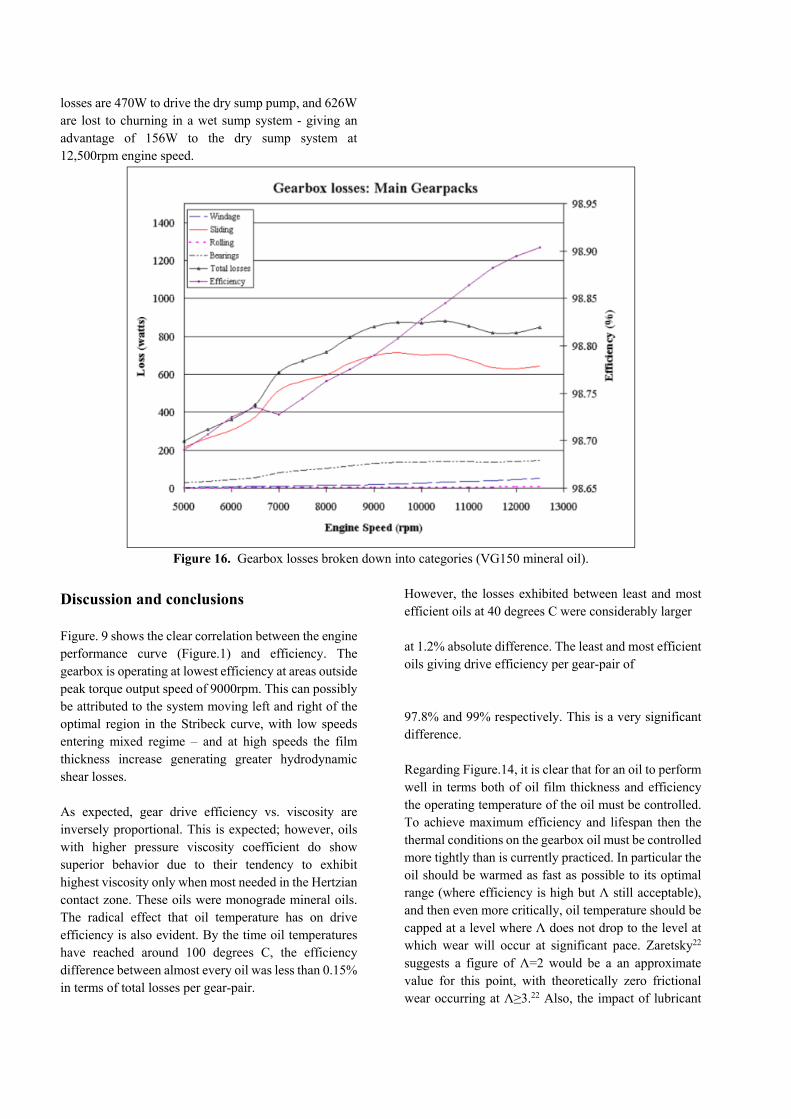
Figure 16. Gearbox losses broken down into categories (VG150 mineral oil).
Discussion and conclusions Figure. 9 shows the clear correlation between the engine performance curve (Figure.1) and efficiency. The gearbox is operating at lowest efficiency at areas outside peak torque output speed of 9000rpm. This can possibly be attributed to the system moving left and right of the optimal region in the Stribeck curve, with low speeds entering mixed regime – and at high speeds the film thickness increase generating greater hydrodynamic shear losses. As expected, gear drive efficiency vs. viscosity are inversely proportional. This is expected; however, oils with higher pressure viscosity coefficient do show superior behavior due to their tendency to exhibit highest viscosity only when most needed in the Hertzian contact zone. These oils were monograde mineral oils. The radical effect that oil temperature has on drive efficiency is also evident. By the time oil temperatures have reached around 100 degrees C, the efficiency difference between almost every oil was less than 0.15% in terms of total losses per gear-pair.
However, the losses exhibited between least and most efficient oils at 40 degrees C were considerably larger at 1.2% absolute difference. The least and most efficient oils giving drive efficiency per gear-pair of 97.8% and 99% respectively. This is a very significant difference. Regarding Figure.14, it is clear that for an oil to perform well in terms both of oil film thickness and efficiency the operating temperature of the oil must be controlled. To achieve maximum efficiency and lifespan then the thermal conditions on the gearbox oil must be controlled more tightly than is currently practiced. In particular the oil should be warmed as fast as possible to its optimal range (where efficiency is high but Λ still acceptable), and then even more critically, oil temperature should be capped at a level where Λ does not drop to the level at which wear will occur at significant pace. Zaretsky22 suggests a figure of Λ=2 would be a an approximate value for this point, with theoretically zero frictional wear occurring at Λ≥3.22 Also, the impact of lubricant

temperature on its lifespan is important; lubricant life is doubled for every drop in 10 degrees C oil temperature.23 However, great care must be taken with the additive packages, as some do not function at low temperatures as they operate by a chemical reaction method. So, a balance must be struck between gear life, oil life and drive efficiency – with temperature variation noted as a primary driver (Figure.14). Also, the effect that additives (in particular VII additives) have on efficiency and high shear behavior is not currently well understood.5 Since gearbox oil is not subject to many of the complications that main engine oil must cope with, such as fuel absorption, combustion by-product contamination, and exposure to extreme temperatures – the use of a properly selected monograde mineral oil seems possible (with suitable additive package). The poor high shear rate behavior of synthetics containing polymers suggests that for gearboxes where conditions can be controlled tightly a monograde oil may perform very well. HTHS values for some common oil grades are 10% to 15% above the values from their multigrade equivalents .24,25 They will also tend to have higher viscous friction loss in sliding contact, but if the oil film is unstable in HTHS conditions in the real gear contact, friction could be higher - even with lower PVC as the conditions enter mixed or boundary regimes. Regarding churning losses, Figure. 15 shows that the losses from driving the dry sump pump only become offset above engine speeds of 5000rpm (when churning losses exceed those of the pump). From this perspective, from the point of view of efficiency, a dry sump lubricated gearbox is not beneficial except in high speed engines typical of motorsport applications. Overall, it is clear that to increase efficiency gearbox oil temperatures must be closely controlled and that this should be matched to an oil satisfying minimum Λ requirement, and maximum efficiency within that temperature boundary – as shown in Figure. 14. Figure. 16 shows a breakdown of the various load dependent and load independent losses of VG150 mineral oil – which was chosen here as the overall best performing oil for this gearbox application- across the full speed range in 1st gear. Rolling losses are almost inconsequential but bearing losses are significant, forming nearly 25% of the total 800W loss at peak shaft speed – as expected gearface sliding forms most of the overall loss. The very low windage losses are attributable to the very small diameter and width of the gears themselves, although the losses are noticeable at around 40W. The dry sump
gearbox shows total losses of around 1200W at peak engine output power (10,500rpm). With the wet sump system, losses of around 420W can be expected from oil churning alone at the same speed. Since all 6 pairs of gears would be submerged at once, the churning losses predicted by the Changnet method are disproportionately high -with respect to the transmitted power- as gearface sliding losses responsible for most of the dry sump system losses, would only take place on the selected gear in question – one gear-pair at a time. The dry sump gearbox produces slightly lower power losses than a wet sump gearbox over the entire operating speed of this engine. However in a low speed engine, this is unlikely to be the case, below 5000rpm the wet sump is more efficient. Friction losses could also be reduced by using very high pressure angle gearing. In one study this reduced sliding speeds by over 60% in the case of an increase in the pressure angle from 20 to 35 degrees.26 As shown in Figure. 16 sliding losses comprise most of the gearbox losses in this analysis, which are directly proportional to sliding velocity. Typically, highest efficiencies are a result of lower pressure viscosity coefficients, which are however of negative influence to film thickness. As a result, in the machine itself friction can rise at a certain point as a mixed lubrication regime is entered.5 This suggests that in order to benefit fully from the potentials available from oil optimization, manufacturers will have to work to reduce component surface roughness and control temperatures more tightly, especially given the large percentage of car journeys made at short distances, not adequate to warm the oil by normal means.5
To enable more accurate modeling, friction heating in the gearmesh zone should be taken into account. Additionally, it is hoped that more data on HTHS behavior of oils will be published in order that the oils with greater tendency for Thixotropic behavior can be avoided in high shear rate applications.5 Currently this cannot be predicted without experimental data such as presented by R.I.Taylor of Shell.24 It is also known that the formula for gear friction coefficient (Benedict and Kelly), produces artificially high results near the pitch point where sliding speed nears zero.11 An example of an improved friction coefficient formula is proposed by Kahraman, which should be implemented.27 However in this study, the friction result from the pitch point Xp is negated to isolate this inaccuracy from the overall resut.
Funding

This research received no specific grant from any funding agency in the public, commercial, or not-for-profilt sectors. This research received no specific grant from any funding agency in the public, commercial, or not-for-profit sectors.
Acknowledgements The authors wish to acknowledge R.I. Taylor of Shell Global Solutions (UK), for stimulating discussions and for help with the refinement of initial implementation, Mini-Gears Ltd for manufacture of custom gearing for the gearboxes and SECO Tools for manufacture of the gearbox cases.
REFERENCES
1. Trelleborg. Reducing Friction Can Save
Energy,
http://www.trelleborg.com/en/Media/Products
-and-Solutions-News/Archive/Reducing-
friction-can-save-energy-/ (April 2010,
accessed January 2014).
2. UK Department for Transport. Road Transport
Forecasts 2011. 2011.
3. Fontaras G, Samaras Z. Reducing C02
Emissions from Road Transport – Overview of
the Main Initiatives and Technical Measures
Proposed to Date in Europe. Laboratory of
Applied Thermodyanmics, Aristotle University
Thessaloniki. Feb 2010.
4. Taylor R. I., Shelby K., Herrera R., Green D.A.
The Effect of Engine, Axle and Gearbox
Lubricant, and Operating Conditions on Heavy
Duty Diesel Fuel Economy: Part 2: Predictions.
s.l. : SAE, JSAE 20119236, 2011.
5. Taylor R. I. Tribology and energy efficiency:
from molecules to lubricated contacts to
complete machines. s.l. : Royal Society of
Chemistry 2012, Paper 156/21.
6. Douglas, CE. Tailor Made Twin. Race Engine
Technology, May 2011, p. 52.
7. Stavyskyy V., Nosko P., Pavel Fil, Karpov A.,
Velychko N. Load-independant Power Losses
of Gear Systems: A Review. TEKA Kom. Mot
i Energ. Roln 2010, pp. 205-213.
8. Diab, Y., Ville, F., Houjoh, H., Sainsot, P.,
Velex, P., 2005, Experimental and Numerical
Investigations on the Air-Pumping
Phenomenon in High-Speed Spur and Helical
Gears, Proceedings of the Institute of
Mechanical Engineers, 219, Part C, pp. 785-
800.
9. Xu, H., Kahraman, A., Anderson, N.E.,
Maddock, D.G., 2007, Prediction of
Mechanical Efficiency of Parallel-Axis Gear
Pairs, Journal of Mechanical Design, 129, pp.
58-68.
10. Petry-Johnson T.T., Kahraman A., Anderson,
D.R. Chase. Experimental Investigation of
Spur Gear Efficiency. J. Mech. Des. 2008,
130(6) 062601.
11. Höhn Bernd-Robert, Michaelis K., Wimmer A.
Low Loss Gears. AGMA, 2005.
12. Anderson, Neil E. Advanced Gearbox
Technology - Final Report. Allison Gas
Turbine Division - General Motors
Corporation, 1987.
13. Anderson, Neil E, Stuart H. Loewenthal. Spur
Gear-System Efficiency at Part and Full Load.
NASA Technical Paper 1622, 1980.
14. Anderson Neil E., Loewenthal Stuart H.
Comparison of Spur Gear Efficiency
Prediction Methods. Cleveland Army Research
and Technology Labs, 1983.
15. Changenet C., Velex P.. A Model for the
Prediction of Churning Losses in Geared
Gearboxs - Preliminary Results. . Journal of
Mechanical Design - 01/2007; 129(1). pp. 128-
133.

16. Neil E Anderson, Loewenthal Stuart H. Errata
pg3 A&L . Nasa Technical Report Server.
http://www.nasa.gov/sites/default/files/517745
main_19800009206_1980009206.pdf (2011,
accessed 2011)
17. Lewis, W. Investigation of the Strength of Gear
Teeth. 1893, p. 1623.
18. Townsend Dennis P., Oswald Fred B., Ping-
Hsun Lin, Hsiang Hsi Lin. Using Dynamic
Analysis for Compact Gear Design. NASA
Technical Memorandum 1998-207419, 1998.
19. Grubin, A.N. Fundamentals of the
Hydrodynamic Theory of Lubrication of
Heavily Loaded Cylindrical Surfaces, Book
No.30, 1949, pp.115-166, DSIR London
Translation No.337
20. Townsend, Dennis P. The Application of
Elastohydrodynamic Lubrication in Gear
Tooth Contacts. NASA Technical Report
19730029573, 1973.
21. Townsend, Dennis P. Surface Fatigue
Evaluation of Gear Materials and Lubricants.
NASA Technical Report 23-37029102, 1997.
22. Zaretsky, Erwin V. Design of Oil-Lubricated
Machine Components for Life and Reliability.
NASA Technical Memorandum, 2007-
214362, 2007.
23. Johnson, Mark Lee. Gearbox Efficiency and
Lubrication. Sumitomo Drive Technologies,
2009.
24. Taylor R. I. Lubrication, Tribology &
Motorsport. Shell Global Solutions (UK),
2002.
25. Spearot, James A. High Temperature High-
Shear Oil Viscosity. ASTM. 1989, pp 95-98.
26. Zakrejsek, Handshuh Robert F. and Andrew J.
High-Pressure Angle Gears: Comparison to
Typical Gear Designs. NASA Technical
Memorandum, 2012-216251/REV1, 2012.
27. Kahraman A., J. Lim, H. Ding. A Dynamic
Model of a Spur Gear Pair with Friction, 12th
IFToMM World Congress, Besançon (France),
June18-21 2007.

APPENDIX 1: Anderson & Loewenthal Equations Used
The complete list of equations used in the paper is given below. They are all taken from Anderson & Loewenthal (11) but
adapted to conform to SI unit system. Note that subscripts g andp refer to gear and pinion respectively.
0.0254
Where: =Gear PCD (m) =Diametral Pitch
Ng= No. teeth 0.0254
Where: =Pinion PCD (m) =Diametral Pitch
Np= No. teeth
, cos
Where: , =Pinion base circle diameter (m) =Diametral Pitch = Pressure angle (Deg.)
, cos
Where: , =Gear base circle diameter (m) =Diametral Pitch = Pressure angle (Deg.)
_ , _2 0.0254
Where: , =Pinion tip diameter (m) =Diametral Pitch
,2 0.0254
Where: , =Gear tip diameter (m) =Diametral Pitch
,
Where:
sin2
Where: …always denotes distance along path of contact line

0.5 , ,
0.5 , ,
0.02542
2cos
20.0254 sin
2
Where: =gear ratio=Ng/Np
2
Where: L…always equals lengths on path of contact line (m)
∆
Where∆ gear backlash (m)
2
cos
Where: = geartooth normal load (N) Pinion Torque (N.m)
, 2.82 101 2.3 .
. 0.028 0.019 .
Where: ,
, 2.82 101 2.3 . . 0.028 0.019 .
Where: ,
, 0.0009 . .
Where:
, Gear bearing load-dependant torque (N.m)
Static equivalent bearing load (N)
Bearing rollers PCD (m)
maximum static rated load of bearing (N)
, 0.0009 . .
Where:
, Gear bearing load-dependant torque (N.m)
, 6894 1.42 10
Where:
, Gear bearing viscous torque (N.m)
2 (for straddle positioned bearings)
Oil viscosity (cSt)
Gearshaft speed (rpm)
, 6894 1.42 10
Where:
, Pinion bearing viscous torque (N.m)
,
Where:
Total gearshaft bearing losses (kW)

,
Where:
Total pinion shaft bearing losses (kW)
2 1.05 10
Where:
Total bearing losses (kW)
0.1047 1
Where:
Sliding velocity at point X… (m/s)
0.1047 sin1
Where:
Rolling velocity at point X… (m/s)
0.0127 log29.66
| |
Where:
coefficient of friction at point X…
tooth normal load at point X… (N)
0.001
Where:
Sliding powerloss at point X…(kW)
w=wn/2 at points ..
w=wn at points &
6.8 10
Where:
Thermal loading factor at point X…
0.001 18.63
Where:
Rolling power loss (kW)

h=EHD film thickness (m)
Thermal reduction factor (where width of pinion ≠ with of gear 1)
2
Where: Total sliding power loss (kW)
Where: Total rolling power loss (kW)
, ,
Where: Total gearbox losses -per gear pair- (kW)
1000
Where: Total power into gearbox Pinion Torque (N.m) Shaft input speed (Rads/s)
100
Where: system efficiency (%)

APPENDIX 2: Notation
B Tooth face width (m)
Cch Churning Torque (N.m)
Cm Non-dimensional torque
Maxstatic rated load of bearing (N)
Pipeinternaldiameter m
, , Gear, Pinion base circle diameter (m)
Gear, Pinion PCD (m)
Bearing rollers PCD (m)
dr Energy Power Loss Dry Sump (W) Fr Froude number
Static equivalent bearing load (N)
Friction factor
oefficient of friction at point X…
Bearing arrangement factor
g Acceleration due to gravity (m/s2)
h EHD film thickness (m)
h Equivalent pressure head (m)
drHeadlossdrysumppump m hp Immersion Depth of Pinion (m)
L… Lengths on path of contact line (m)
Lengthofpipe m
∆ Gear backlash (m)
Pump mass flow output (kg/s)
Gear ratio = Ng/Np
Total gearshaft bearing losses (kW)
, , Gear, Pinion bearing load-dependant
torque (N.m)
Total pinion shaft bearing losses (kW)
, , Gear, pinion bearing viscous torque (N.m)
Ng Np Gear, Pinion No. teeth
Gearshaft speed (rpm)
Diametral Pitch
Basepitch m
Total bearing losses (kW)
Total power into gearbox
PL Dry Sump Pump, Pumping losses (W)
, Gearwindagelosses kW
Total rolling power loss (kW)
Rolling power loss (kW)
Total sliding power loss (kW)
Sliding powerloss at point X…(kW)
Total gearbox losses -per gear pair- (kW)
, Pinionwindagelosses kW
∆ dr Pressure Rise Dry Sump Pressure Pump (kPa) Thermal loading factor at point X…
dr Volumetric Flow dry sump pressure pump (L/s). Re Reynolds Number
Gearpitchcircleradius m
Rp Gear Pitch Radius (m)
Sm Immersed Area of Pinion (m2)
Pinion Torque (N.m)
Geartoothfacewidth m
Vp Volume displaced by submerged gears (m3)
Velcityinpipe m/s
Vo Volume of oil in sump (m3)
Sliding velocity at point X… (m/s)
Rolling velocity at point X… (m/s)
Geartooth normal load (N)
Tooth normal load at point X… (N)
w wn/2 at points ..
w wn at points &
wn Geartooth normal load (N)
… Distance along path of contact line (m)
ystem efficiency (%)
Pressure angle (Deg.)
Δ Oil Lambda Ratio
Piperoughness m
OilViscosity cP
μeq Air/oil mist mixture absolute viscosity (cP)
v Kinematic oil viscosity (Pa.s)
Oil viscosity (cSt)
ρ Oil Density (kg/m3)
Thermal reduction factor
Ω Shaft Speed (Rads/sec)
Shaft input speed (Rads/s)

APPENDIX 3: Gear materials testing
Table 3. Rotax gear composition, measured from Scanning Electron Microscope (SEM).
Figure 17. Hardness testing results carried out on sectioned Rotax geartooth.
Element Weight% Atomic% Si K 0.12 0.24 Cr K 1.90 2.04 Mn K 0.49 0.50 Fe K 95.60 95.57 Ni K 1.36 1.29 Cu L 0.18 0.16 Mo L 0.34 0.20 Totals 100.00

APPENDIX 4: Definition of Line of Action Nomenclature
Figure 18. Illustration of lengths along path of contact line.
Table 4. Definitions of points and lengths shown in Figure 18.