radford global sales survey - sales practices report
TRANSCRIPT

Proprietary and Confidential
Radford Global Sales Survey
May 2021
Technology
Sales Practices Report
Radford Global Sales Survey - May 2021
© 2021 Aon plc i
Proprietary and Confidential
TechnologyMay 2021
- Data is presented for all companies in the data sample. For certain elements, data is also broken out by the various countries in which the participating companies are headquartered (five or more companies are required in a given headquarters country for data to be presented).
- Data for geographic differentials is broken out by the countries in which the participating companies have sales personnel (five or more companies are required for a given country to be presented).
- Three or more companies are required in the data sample for results to be presented for a given data element.
Table of Contents
Section One: Metrics Revenue and Sales Employee Headcount Primary Industry Sales Channels Total Sales Compensation Payments - Last Sales Plan Year Quota Attainment Percentage
A-1
Section Two: Sales Incentive Plan B-1 Global Sales Plan and Organization of Sales Teams Quota Setting Sales Cycle Multi-Year Sales Multi Incumbent Sales, Special Performance Incentives for Field Force (SPIFFs), Leave of Absence (LOA) Sales Incentive Structure Incentive Payout Curve Incentive Payment Based on Percent Quota Achievement

ii
Radford Global Sales Survey - May 2021
© 2021 Aon plc
Proprietary and Confidential
Table of Contents (continued)
Participant List D-1
Section Three: Pay Practices Base Salary Increases Salary Structures Geographic Differentials Recognition/Award Program Draws
C-1
1
Proprietary and Confidential
Radford Global Sales Survey - May 2021
© 2021 Aon plc A -
Revenue % current fiscal year projected compared to last fiscal year actual
Last fiscal year actual revenue (USD)
Average Company Count
Sales employee headcount
Sales employee headcount as % of overall employee headcount
6,149,255,485 441
115.3% 178
Revenue and Sales Employee Headcount
Average Company Count
Global
1,354,883,598 214
114.7% 111
793 344
18.3% 344
366 335
18.3% 305
All CompaniesHeadquarters Country
Section One: Metrics Technology
- Revenue data for All Companies breakout expressed in USD; for specific country breakouts, revenue data reported in local currency. - Sales employee headcount = number of full-time sales employees included in the sales incentive plan for the current sales plan year.
2
Proprietary and Confidential
Radford Global Sales Survey - May 2021
© 2021 Aon plc A -
Revenue % current fiscal year projected compared to last fiscal year actual
Last fiscal year actual revenue (AUD)
Average Company Count
Sales employee headcount
Sales employee headcount as % of overall employee headcount
810,292,381 5
0
Revenue and Sales Employee Headcount
Average Company Count
Global
1
0
2
2
0
0
Companies Headquartered in AustraliaAustralia
Section One: Metrics (continued) Technology
- Revenue data for All Companies breakout expressed in USD; for specific country breakouts, revenue data reported in local currency. - Sales employee headcount = number of full-time sales employees included in the sales incentive plan for the current sales plan year.
3
Proprietary and Confidential
Radford Global Sales Survey - May 2021
© 2021 Aon plc A -
Revenue % current fiscal year projected compared to last fiscal year actual
Last fiscal year actual revenue (CND)
Average Company Count
Sales employee headcount
Sales employee headcount as % of overall employee headcount
3,426,672,360 21
110.0% 10
Revenue and Sales Employee Headcount
Average Company Count
Global
4,438,362,590 8
104.1% 5
135 18
12.6% 18
65 16
7.8% 14
Companies Headquartered in CanadaCanada
Section One: Metrics (continued) Technology
- Revenue data for All Companies breakout expressed in USD; for specific country breakouts, revenue data reported in local currency. - Sales employee headcount = number of full-time sales employees included in the sales incentive plan for the current sales plan year.
4
Proprietary and Confidential
Radford Global Sales Survey - May 2021
© 2021 Aon plc A -
Revenue % current fiscal year projected compared to last fiscal year actual
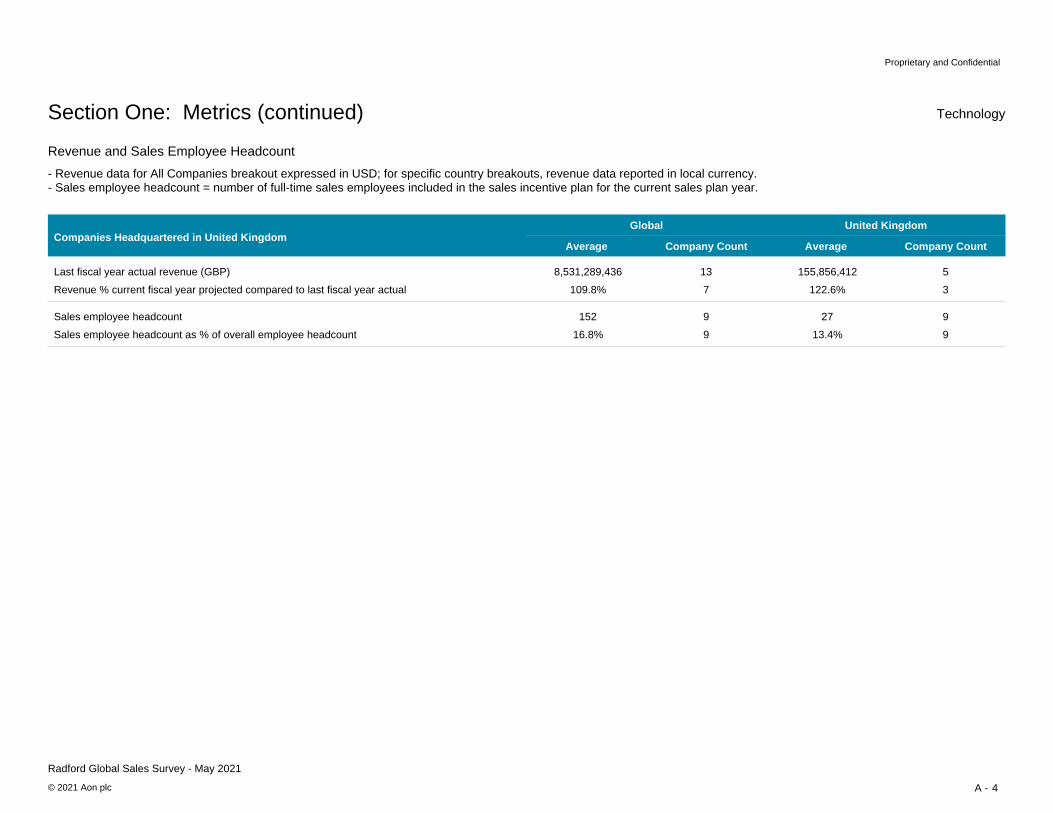
Last fiscal year actual revenue (GBP)
Average Company Count
Sales employee headcount
Sales employee headcount as % of overall employee headcount
8,531,289,436 13
109.8% 7
Revenue and Sales Employee Headcount
Average Company Count
Global
155,856,412 5
122.6% 3
152 9
16.8% 9
27 9
13.4% 9
Companies Headquartered in United KingdomUnited Kingdom
Section One: Metrics (continued) Technology
- Revenue data for All Companies breakout expressed in USD; for specific country breakouts, revenue data reported in local currency. - Sales employee headcount = number of full-time sales employees included in the sales incentive plan for the current sales plan year.

5
Proprietary and Confidential
Radford Global Sales Survey - May 2021
© 2021 Aon plc A -
Revenue % current fiscal year projected compared to last fiscal year actual
Last fiscal year actual revenue (USD)
Average Company Count
Sales employee headcount
Sales employee headcount as % of overall employee headcount
6,217,554,849 382
115.9% 157
Revenue and Sales Employee Headcount
Average Company Count
Global
1,321,895,273 196
114.8% 101
833 298
18.9% 298
396 297
19.3% 273
Companies Headquartered in United StatesUnited States
Section One: Metrics (continued) Technology
- Revenue data for All Companies breakout expressed in USD; for specific country breakouts, revenue data reported in local currency. - Sales employee headcount = number of full-time sales employees included in the sales incentive plan for the current sales plan year.

6
Proprietary and Confidential
Radford Global Sales Survey - May 2021
© 2021 Aon plc A -
Section One: Metrics (continued)
Primary Industry
Animal Health
Electronics/Electrical
0.0%
% Companies
0
0.0%
4.2%
0
28
Financial Technology
Medical Devices
Network Equipment/Products
Other Communications
Other Hardware
Other Life Sciences
5.4% 36
5.4%
10.4%
36
69
3.2% 21
0.5% 3
Company Count
Bio/Pharma-Commercial
Internet/Online Community
Tech Capital Equipment
Telecommunication Infrastructure
Telecommunication Services
Company Count
Semiconductor Components
Software Products/Services
0.6%
0.0%
4
0
7.2% 48
51.8%
2.9%
345
19
1.8% 12
2.9% 19
666
All Companies
Technology
Computer/Peripherals 2.9% 19
Bio/Pharma-Pre-Commercial 0.0% 0
0.0% 0Clinical Research Orgs/CMOs
Other Software Products and Services 1.1% 7
Other Industries 0.0% 0
7
Proprietary and Confidential
Radford Global Sales Survey - May 2021
© 2021 Aon plc A -
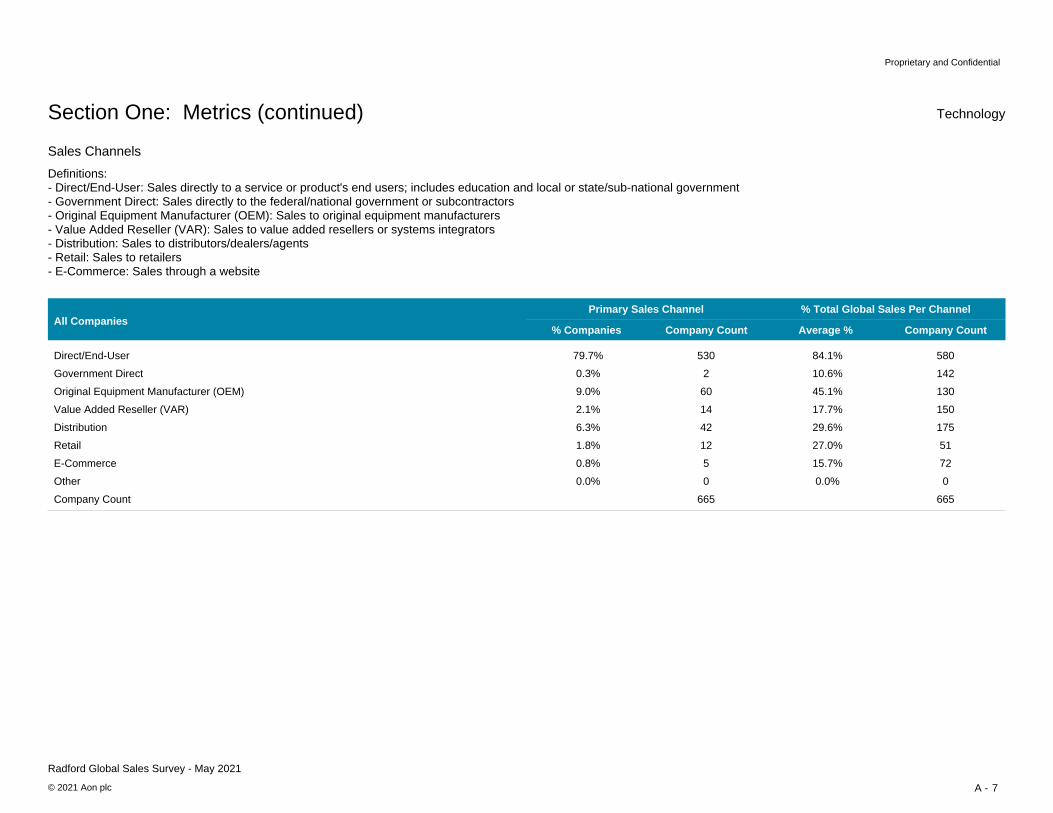
Sales Channels
Direct/End-User
Average % Company Count
Value Added Reseller (VAR)
79.7% 530
% Companies Company Count
Primary Sales Channel
84.1% 580
9.0% 60
2.1% 14
45.1% 130
17.7% 150
Distribution
Retail
E-Commerce
Other
Company Count
6.3% 42 29.6% 175
1.8% 12
0.8% 5
27.0% 51
15.7% 72
0.0% 0 0.0% 0
665 665
% Total Global Sales Per Channel
Government Direct
Original Equipment Manufacturer (OEM)
0.3% 2 10.6% 142
All Companies
Section One: Metrics (continued) Technology
Definitions:- Direct/End-User: Sales directly to a service or product's end users; includes education and local or state/sub-national government- Government Direct: Sales directly to the federal/national government or subcontractors- Original Equipment Manufacturer (OEM): Sales to original equipment manufacturers- Value Added Reseller (VAR): Sales to value added resellers or systems integrators- Distribution: Sales to distributors/dealers/agents- Retail: Sales to retailers- E-Commerce: Sales through a website

8
Proprietary and Confidential
Radford Global Sales Survey - May 2021
© 2021 Aon plc A -
Section One: Metrics (continued)
Total Sales Compensation Payments - Last Sales Plan Year
Revenue: Average per sales employee
Revenue: Total
Average Company Count
Base Payroll: Total
Base Payroll: Average per sales employee
2,338,077,004 115
3,152,198 113
Average Company Count
Global
989,930,176 90
3,433,473 88
78,232,647 267
102,690 256
47,569,297 261
110,392 249
All Companies (in USD)Headquarters Country
Base Payroll: Total as % revenue
On-Target Incentive/Commission: Total
On-Target Incentive/Commission: Average per sales employee
On-Target Incentive/Commission: Total as % revenue
Actual Incentive/Commission: Total
Actual Incentive/Commission: Average per sales employee
Actual Incentive/Commission: Total as % revenue
Actual Incentive/Commission as % On-Target Incentive/Commission
Base + On-Target Incentive/Commission: Total
Base + On-Target Incentive/Commission: Average per sales employee
Base + On-Target Incentive/Commission: Total as % revenue
Base + Actual Incentive/Commission: Total
Base + Actual Incentive/Commission: Average per sales employee
Base + Actual Incentive/Commission: Total as % revenue
6.5% 100 6.5% 81
45,605,795 231
60,457 216
27,390,654 224
65,914 207
4.3% 96 4.1% 74
50,298,167 227
56,177 218
28,583,365 223
62,798 210
4.1% 96 3.9% 76
130,166,048 207
162,336 198
77,866,298 201
177,456 191
10.4% 85 10.6% 68
126,809,764 206
158,943 201
71,835,412 203
173,168 196
10.8% 87 10.4% 70
96.7% 191 99.8% 190
Technology
- Data limited to full-time employees included in the sales incentive plan.- Base payroll includes base salaries and fixed guaranteed extra months pay (e.g., 13th month, 14th month, etc.); for employees in India, also includes fixed regularly paid allowances.- Revenue is limited to total amount generated by full-time employees included in the sales incentive plan last year (may be less than total company revenue).- Data for All Companies breakout expressed in USD; for specific country breakouts, data reported in local currency.

9
Proprietary and Confidential
Radford Global Sales Survey - May 2021
© 2021 Aon plc A -
Section One: Metrics (continued)
Total Sales Compensation Payments - Last Sales Plan Year
Revenue: Average per sales employee
Revenue: Total
Average Company Count
Base Payroll: Total
Base Payroll: Average per sales employee
112,030,648 4
1,147,100 4
Average Company Count
Global
20,101,145 12
124,510 11
7,531,695 10
95,574 9
Companies Headquartered in Canada (in CND)Canada
Base Payroll: Total as % revenue
On-Target Incentive/Commission: Total
On-Target Incentive/Commission: Average per sales employee
On-Target Incentive/Commission: Total as % revenue
Actual Incentive/Commission: Total
Actual Incentive/Commission: Average per sales employee
Actual Incentive/Commission: Total as % revenue
Actual Incentive/Commission as % On-Target Incentive/Commission
Base + On-Target Incentive/Commission: Total
Base + On-Target Incentive/Commission: Average per sales employee
Base + On-Target Incentive/Commission: Total as % revenue
Base + Actual Incentive/Commission: Total
Base + Actual Incentive/Commission: Average per sales employee
Base + Actual Incentive/Commission: Total as % revenue
8.2% 3
9,700,096 11
83,016 10
1,484,605 8
60,479 7
9.3% 4
6,176,580 8
63,870 8
1,269,176 6
62,276 6
7.7% 3
30,084,746 9
201,774 8
4,599,511 7
162,568 6
13.1% 3
20,924,120 6
176,672 6
3,361,423 5
156,977 5
75.8% 7 91.2% 5
Technology
- Data limited to full-time employees included in the sales incentive plan.- Base payroll includes base salaries and fixed guaranteed extra months pay (e.g., 13th month, 14th month, etc.); for employees in India, also includes fixed regularly paid allowances.- Revenue is limited to total amount generated by full-time employees included in the sales incentive plan last year (may be less than total company revenue).- Data for All Companies breakout expressed in USD; for specific country breakouts, data reported in local currency.

10
Proprietary and Confidential
Radford Global Sales Survey - May 2021
© 2021 Aon plc A -
Section One: Metrics (continued)
Total Sales Compensation Payments - Last Sales Plan Year
Revenue: Average per sales employee
Revenue: Total
Average Company Count
Base Payroll: Total
Base Payroll: Average per sales employee
1,981,006,767 3
Average Company Count
Global
2,307,284 4
58,646 4
1,086,223 7
63,548 7
Companies Headquartered in United Kingdom (in GBP)United Kingdom
Base Payroll: Total as % revenue
On-Target Incentive/Commission: Total
On-Target Incentive/Commission: Average per sales employee
On-Target Incentive/Commission: Total as % revenue
Actual Incentive/Commission: Total
Actual Incentive/Commission: Average per sales employee
Actual Incentive/Commission: Total as % revenue
Actual Incentive/Commission as % On-Target Incentive/Commission
Base + On-Target Incentive/Commission: Total
Base + On-Target Incentive/Commission: Average per sales employee
Base + On-Target Incentive/Commission: Total as % revenue
Base + Actual Incentive/Commission: Total
Base + Actual Incentive/Commission: Average per sales employee
Base + Actual Incentive/Commission: Total as % revenue
1,721,413 3
34,340 3
600,090 4
44,804 4
442,379 3
27,228 3
323,247 4
33,711 4
4,747,159 3
95,658 3
1,491,492 4
105,370 4
1,675,482 3
86,614 3
935,327 4
95,707 4
71.1% 3
Technology
- Data limited to full-time employees included in the sales incentive plan.- Base payroll includes base salaries and fixed guaranteed extra months pay (e.g., 13th month, 14th month, etc.); for employees in India, also includes fixed regularly paid allowances.- Revenue is limited to total amount generated by full-time employees included in the sales incentive plan last year (may be less than total company revenue).- Data for All Companies breakout expressed in USD; for specific country breakouts, data reported in local currency.

11
Proprietary and Confidential
Radford Global Sales Survey - May 2021
© 2021 Aon plc A -
Section One: Metrics (continued)
Total Sales Compensation Payments - Last Sales Plan Year
Revenue: Average per sales employee
Revenue: Total
Average Company Count
Base Payroll: Total
Base Payroll: Average per sales employee
2,454,832,802 106
3,102,329 105
Average Company Count
Global
1,011,961,711 87
3,484,956 86
81,196,604 238
103,830 228
51,789,405 235
113,539 225
Companies Headquartered in United States (in USD)United States
Base Payroll: Total as % revenue
On-Target Incentive/Commission: Total
On-Target Incentive/Commission: Average per sales employee
On-Target Incentive/Commission: Total as % revenue
Actual Incentive/Commission: Total
Actual Incentive/Commission: Average per sales employee
Actual Incentive/Commission: Total as % revenue
Actual Incentive/Commission as % On-Target Incentive/Commission
Base + On-Target Incentive/Commission: Total
Base + On-Target Incentive/Commission: Average per sales employee
Base + On-Target Incentive/Commission: Total as % revenue
Base + Actual Incentive/Commission: Total
Base + Actual Incentive/Commission: Average per sales employee
Base + Actual Incentive/Commission: Total as % revenue
6.5% 94 6.4% 79
49,512,729 207
61,121 193
29,679,420 205
67,091 190
4.2% 89 4.1% 72
51,992,715 205
57,440 196
30,777,462 204
64,309 192
4.0% 91 3.8% 75
140,273,349 186
163,836 178
84,302,453 184
181,081 176
10.5% 79 10.6% 66
128,365,568 187
161,394 182
76,997,796 186
177,427 180
10.8% 83 10.3% 69
97.9% 174 100.5% 175
Technology
- Data limited to full-time employees included in the sales incentive plan.- Base payroll includes base salaries and fixed guaranteed extra months pay (e.g., 13th month, 14th month, etc.); for employees in India, also includes fixed regularly paid allowances.- Revenue is limited to total amount generated by full-time employees included in the sales incentive plan last year (may be less than total company revenue).- Data for All Companies breakout expressed in USD; for specific country breakouts, data reported in local currency.
12
Proprietary and Confidential
Radford Global Sales Survey - May 2021
© 2021 Aon plc A -
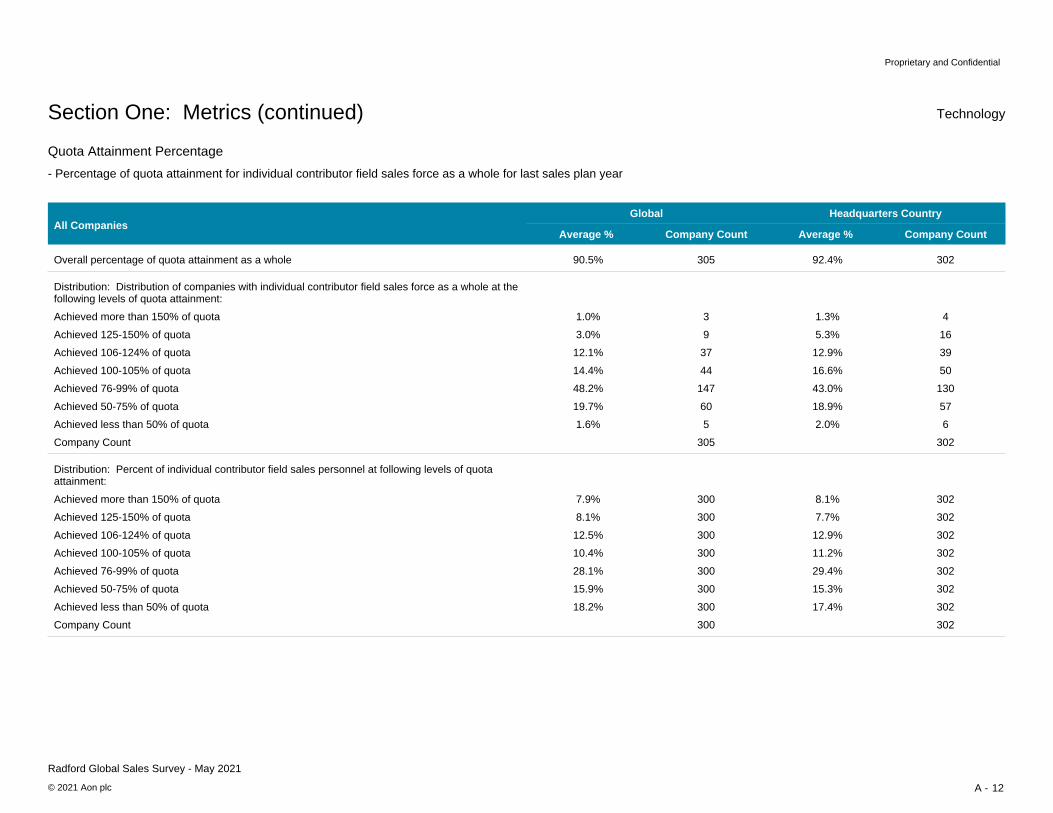
Quota Attainment Percentage
Distribution: Distribution of companies with individual contributor field sales force as a whole at the following levels of quota attainment:
Overall percentage of quota attainment as a whole
Average % Company Count
Achieved more than 150% of quota
90.5% 305
Average % Company Count
Global
92.4% 302
1.0% 3
3.0% 9
1.3% 4
5.3% 16
All CompaniesHeadquarters Country
Achieved 125-150% of quota
Achieved 106-124% of quota
Achieved 100-105% of quota
Achieved 76-99% of quota
Achieved 50-75% of quota
Achieved less than 50% of quota
12.1% 37 12.9% 39
14.4% 44
48.2% 147
16.6% 50
43.0% 130
19.7% 60 18.9% 57
1.6% 5 2.0% 6
Company Count 305 302
Section One: Metrics (continued) Technology
- Percentage of quota attainment for individual contributor field sales force as a whole for last sales plan year
Distribution: Percent of individual contributor field sales personnel at following levels of quota attainment:
Achieved more than 150% of quota 7.9% 300
8.1% 300
8.1% 302
7.7% 302Achieved 125-150% of quota
Achieved 106-124% of quota
Achieved 100-105% of quota
Achieved 76-99% of quota
Achieved 50-75% of quota
Achieved less than 50% of quota
12.5% 300 12.9% 302
10.4% 300
28.1% 300
11.2% 302
29.4% 302
15.9% 300 15.3% 302
18.2% 300 17.4% 302
Company Count 300 302
13
Proprietary and Confidential
Radford Global Sales Survey - May 2021
© 2021 Aon plc A -
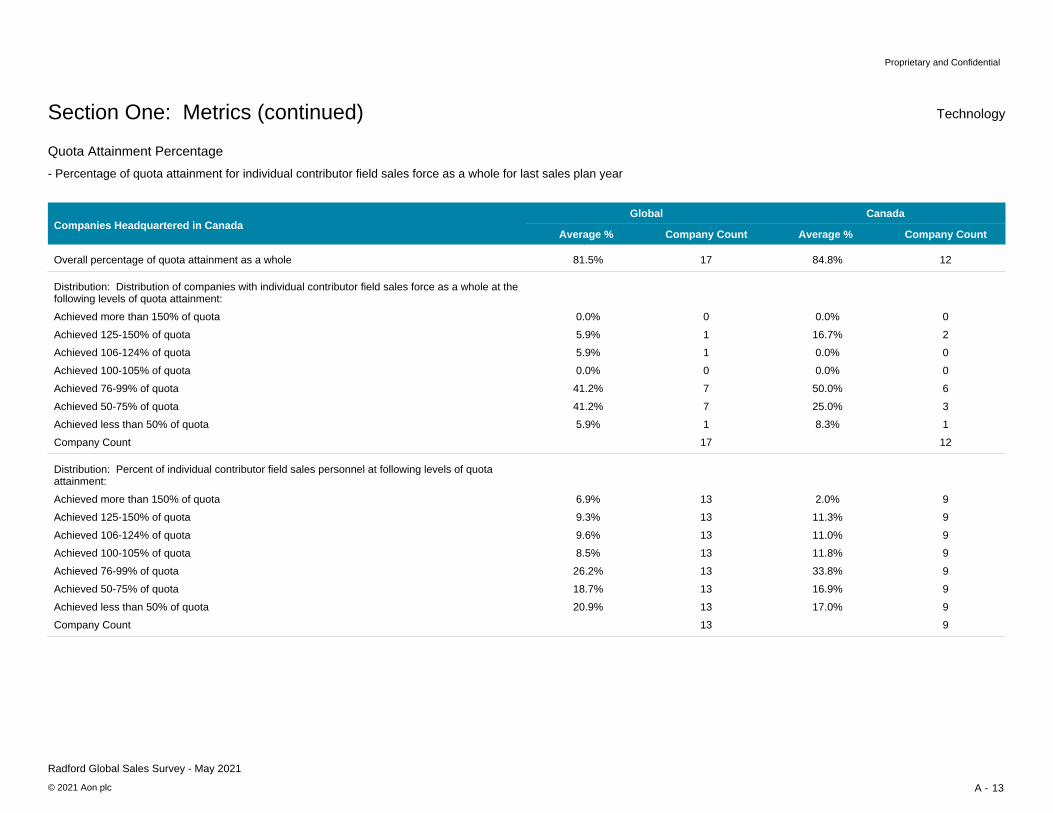
Quota Attainment Percentage
Distribution: Distribution of companies with individual contributor field sales force as a whole at the following levels of quota attainment:
Overall percentage of quota attainment as a whole
Average % Company Count
Achieved more than 150% of quota
81.5% 17
Average % Company Count
Global
84.8% 12
0.0% 0
5.9% 1
0.0% 0
16.7% 2
Companies Headquartered in CanadaCanada
Achieved 125-150% of quota
Achieved 106-124% of quota
Achieved 100-105% of quota
Achieved 76-99% of quota
Achieved 50-75% of quota
Achieved less than 50% of quota
5.9% 1 0.0% 0
0.0% 0
41.2% 7
0.0% 0
50.0% 6
41.2% 7 25.0% 3
5.9% 1 8.3% 1
Company Count 17 12
Section One: Metrics (continued) Technology
- Percentage of quota attainment for individual contributor field sales force as a whole for last sales plan year
Distribution: Percent of individual contributor field sales personnel at following levels of quota attainment:
Achieved more than 150% of quota 6.9% 13
9.3% 13
2.0% 9
11.3% 9Achieved 125-150% of quota
Achieved 106-124% of quota
Achieved 100-105% of quota
Achieved 76-99% of quota
Achieved 50-75% of quota
Achieved less than 50% of quota
9.6% 13 11.0% 9
8.5% 13
26.2% 13
11.8% 9
33.8% 9
18.7% 13 16.9% 9
20.9% 13 17.0% 9
Company Count 13 9
14
Proprietary and Confidential
Radford Global Sales Survey - May 2021
© 2021 Aon plc A -
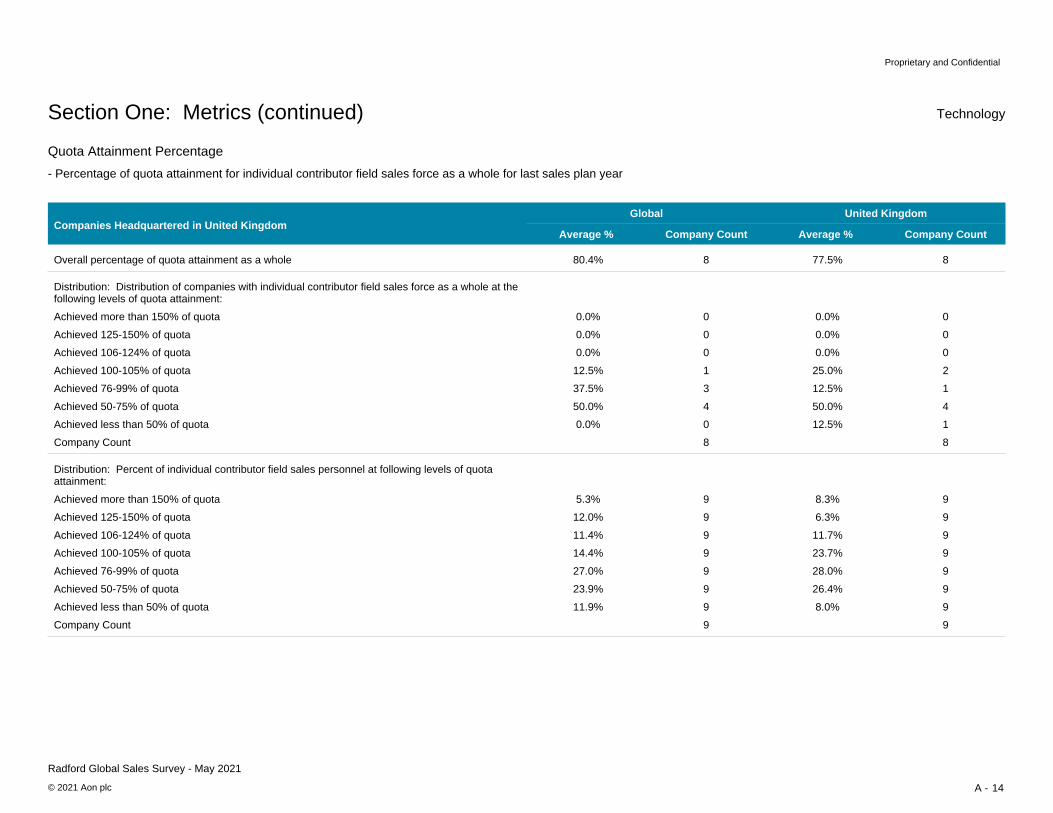
Quota Attainment Percentage
Distribution: Distribution of companies with individual contributor field sales force as a whole at the following levels of quota attainment:
Overall percentage of quota attainment as a whole
Average % Company Count
Achieved more than 150% of quota
80.4% 8
Average % Company Count
Global
77.5% 8
0.0% 0
0.0% 0
0.0% 0
0.0% 0
Companies Headquartered in United KingdomUnited Kingdom
Achieved 125-150% of quota
Achieved 106-124% of quota
Achieved 100-105% of quota
Achieved 76-99% of quota
Achieved 50-75% of quota
Achieved less than 50% of quota
0.0% 0 0.0% 0
12.5% 1
37.5% 3
25.0% 2
12.5% 1
50.0% 4 50.0% 4
0.0% 0 12.5% 1
Company Count 8 8
Section One: Metrics (continued) Technology
- Percentage of quota attainment for individual contributor field sales force as a whole for last sales plan year
Distribution: Percent of individual contributor field sales personnel at following levels of quota attainment:
Achieved more than 150% of quota 5.3% 9
12.0% 9
8.3% 9
6.3% 9Achieved 125-150% of quota
Achieved 106-124% of quota
Achieved 100-105% of quota
Achieved 76-99% of quota
Achieved 50-75% of quota
Achieved less than 50% of quota
11.4% 9 11.7% 9
14.4% 9
27.0% 9
23.7% 9
28.0% 9
23.9% 9 26.4% 9
11.9% 9 8.0% 9
Company Count 9 9
15
Proprietary and Confidential
Radford Global Sales Survey - May 2021
© 2021 Aon plc A -
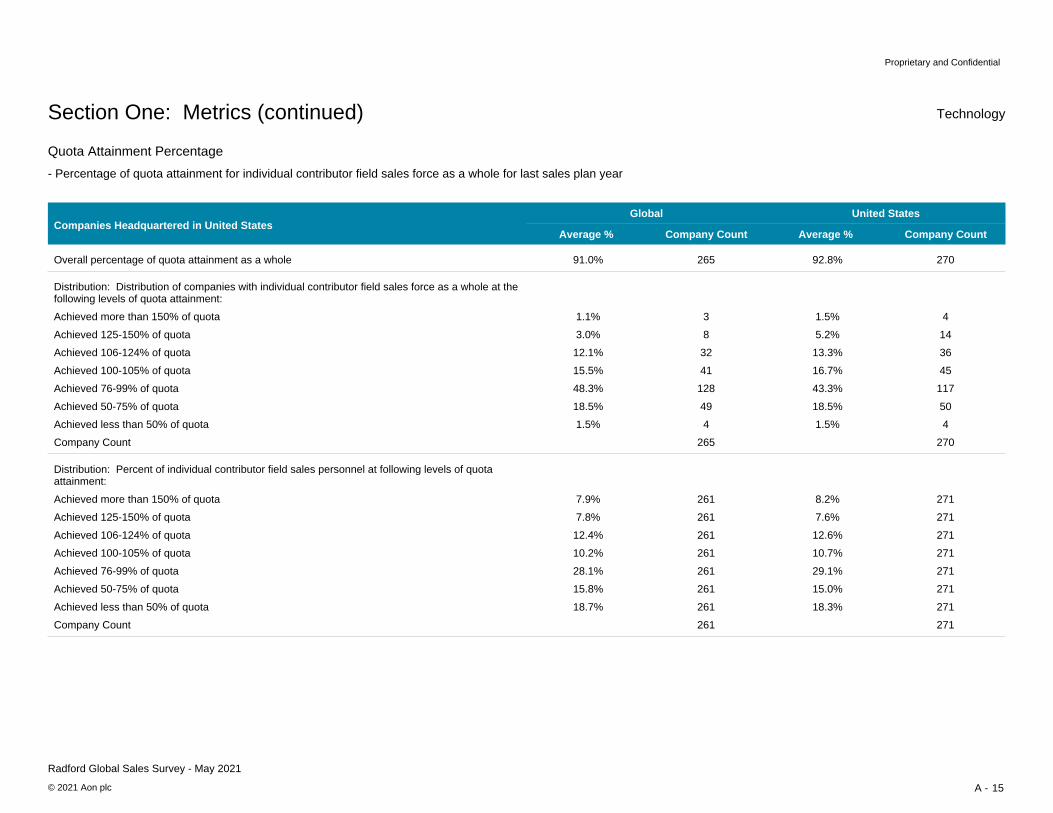
Quota Attainment Percentage
Distribution: Distribution of companies with individual contributor field sales force as a whole at the following levels of quota attainment:
Overall percentage of quota attainment as a whole
Average % Company Count
Achieved more than 150% of quota
91.0% 265
Average % Company Count
Global
92.8% 270
1.1% 3
3.0% 8
1.5% 4
5.2% 14
Companies Headquartered in United StatesUnited States
Achieved 125-150% of quota
Achieved 106-124% of quota
Achieved 100-105% of quota
Achieved 76-99% of quota
Achieved 50-75% of quota
Achieved less than 50% of quota
12.1% 32 13.3% 36
15.5% 41
48.3% 128
16.7% 45
43.3% 117
18.5% 49 18.5% 50
1.5% 4 1.5% 4
Company Count 265 270
Section One: Metrics (continued) Technology
- Percentage of quota attainment for individual contributor field sales force as a whole for last sales plan year
Distribution: Percent of individual contributor field sales personnel at following levels of quota attainment:
Achieved more than 150% of quota 7.9% 261
7.8% 261
8.2% 271
7.6% 271Achieved 125-150% of quota
Achieved 106-124% of quota
Achieved 100-105% of quota
Achieved 76-99% of quota
Achieved 50-75% of quota
Achieved less than 50% of quota
12.4% 261 12.6% 271
10.2% 261
28.1% 261
10.7% 271
29.1% 271
15.8% 261 15.0% 271
18.7% 261 18.3% 271
Company Count 261 271

1
Proprietary and Confidential
Radford Global Sales Survey - May 2021
© 2021 Aon plc B -
Global Sales Plan and Organization of Sales Teams
Global Sales Plan
No, basic plan provisions vary by country
% Companies
78.2%
12.5%
520
83
Company Count
Organization of Sales Teams
By geographic region
By account
By both geographic region and account
Company Count
9.3% 62
665
22.5% 148
10.2% 67
Company Count
Yes, we have a global sales incentive plan
No, basic plan provisions vary by region (e.g., EMEA, APAC, Americas)
67.3% 442
657
All Companies
Section Two: Sales Incentive Plan
For example, a global plan would have common provisions for whether incentives are paid on a first dollar basis vs. a threshold, whether maximum incentive caps are in place, shape of the incentive payout curve (constant, accelerates, decelerates, etc.), when incentives are earned and paid, sales incentive plan performance measures, etc. Even though quota levels, commission rates, incentive targets and base/incentive mix may vary from country to country, the plan could still be considered a global plan if the basic infrastructure provisions are common to all countries.

2
Proprietary and Confidential
Radford Global Sales Survey - May 2021
© 2021 Aon plc B -
Quota Setting
Quota measurement increment period
Quarterly
% Companies
74.5%
6.5%
461
40
Company Count
Quotas subject to change during the measurement increment period
Yes, due to external factors only (e.g., economic downturn/upturn)
Yes, due to individual over/under performance only
Yes, due to either external factors or individual performance
Company Count
15.8% 98
619
40.5% 250
1.9% 12
Company Count
Annual
Semi-annual
22.7% 140
618
All Companies
Other
0.6% 4
2.6% 16
Year-to-date (cumulative)
No 35.0% 216
Section Two: Sales Incentive Plan (continued)

3
Proprietary and Confidential
Radford Global Sales Survey - May 2021
© 2021 Aon plc B -
Sales Cycle: Timing of a typical sales cycle (period of time from first customer contact to order booking)
Distribution of companies by number of months in typical sales cycle:
19 - 23 months
0.2%
0.4%
1
2
12 months
7 - 11 months
6 months
4 - 5 months
3 months
Company Count
0.2% 1
17.4%
9.9%
99
56
19.2% 109
9.9% 56
Over 24 months
24 months
19.0% 108
568
13 - 17 months
4.4% 25
0.9% 5
18 months
Under 3 months 18.7% 106
Number of months in typical sales cycle
% Companies Company CountAll Companies
Section Two: Sales Incentive Plan (continued)
Average = 6.5 months

4
Proprietary and Confidential
Radford Global Sales Survey - May 2021
© 2021 Aon plc B -
Multi-Year Sales
Companies with multi-year sales deals
How revenue is received by the company for multi-year sales deals
% Companies
64.5%
35.5%
414
228
Company Count
Pay incentive the first year on the total estimated value of the contract
Pay incentive the first year on the first year estimated value of the contract
Pay incentive the first year on the first year revenue of the contract
Pay part of incentive at booking and part at another time
Company Count
27.1%
413
107
8.9% 35
14.2% 56
Company Count
Yes
No
14.2% 56
395
All Companies
Revenue paid over span of contract
9.9% 41
45.8% 189
Full amount of contract paid up-front
Stagger payout based on revenue flow throughout the contract length 15.7% 62
Portion of revenue paid up-front, remainder paid over span of contract 33.2% 137
How incentives are paid on multi-year sales
None - maintenance not included, or is sold separately
Compensate for first year at same rate
Compensate for first year at different rate
Compensate based on discounted value of contract
Company Count
40.7% 129
26.2% 83
14.5% 46
6.6% 21
317
Other 12.0% 38
How individual contributor field sales force is compensated for maintenance and support contracts exceeding one year
Section Two: Sales Incentive Plan (continued)
Other 11.1% 46
Pay up-front signing bonus then link remaining incentives to contract length 3.5% 14
Other 16.5% 65

5
Proprietary and Confidential
Radford Global Sales Survey - May 2021
© 2021 Aon plc B -
Multi Incumbent Sales, Special Performance Incentives for Field Force (SPIFFs), Leave of Absence (LOA)
How credit is distributed for purposes of commission calculation if more than one
Order credit is divided among involved incumbents, but total equals 100%
% Companies
20.4%
14.3%
124
87
Company Count
46.0% 279
Company Count
All incumbents involved get full credit for the sale - may result in double or triple counting
Order credit is divided among involved incumbents and may total more than 100%
607
All Companies
14.3% 87100% of order credit is given to "primary" incumbent
Other 4.9% 30
incumbent is involved in making a sale
Companies with SPIFFs or other cash incentives (other than a company bonus plan or
44.5% 290Yes
No 55.5% 362
cash profit sharing plan) that are outside sales incentive plan
Section Two: Sales Incentive Plan (continued)
Companies re-setting quotas for commissioned sales personnel out on an approved LOA
Companies re-setting MBO objectives or other non-sales performance objectives for
43.1%
56.9%
263
347
Not applicable - don't use MBOs or other non-sales performance objectives 39.8% 249
Yes
No
Yes 24.4% 153
No 35.8% 224
commissioned sales personnel out on an approved LOA

6
Proprietary and Confidential
Radford Global Sales Survey - May 2021
© 2021 Aon plc B -
Percent of total sales incentive budget spent on SPIFFs during the last fiscal year
6 - 10% of incentive budget
% Companies
26.7%
53.5%
46
92
Company Count
14.5% 25
Company Count
Under 2% of incentive budget
2 - 5% of incentive budget
172
All Companies
4.7% 811 - 20% of incentive budget
21 - 50% of incentive budget 0.6% 1
Section Two: Sales Incentive Plan (continued)
Over 51% of incentive budget 0.0% 0
Percent of field sales force who received a SPIFF during the last fiscal year
6 - 10% of incentive budget
2.2%
16.7%
4
30
Company Count
17.8% 32
Under 2% of incentive budget
2 - 5% of incentive budget
180
15.6% 2811 - 20% of incentive budget
21 - 50% of incentive budget 30.6% 55
Over 51% of incentive budget 17.2% 31
Special Performance Incentives for Field Force (SPIFFs)
7
Proprietary and Confidential
Radford Global Sales Survey - May 2021
© 2021 Aon plc B -
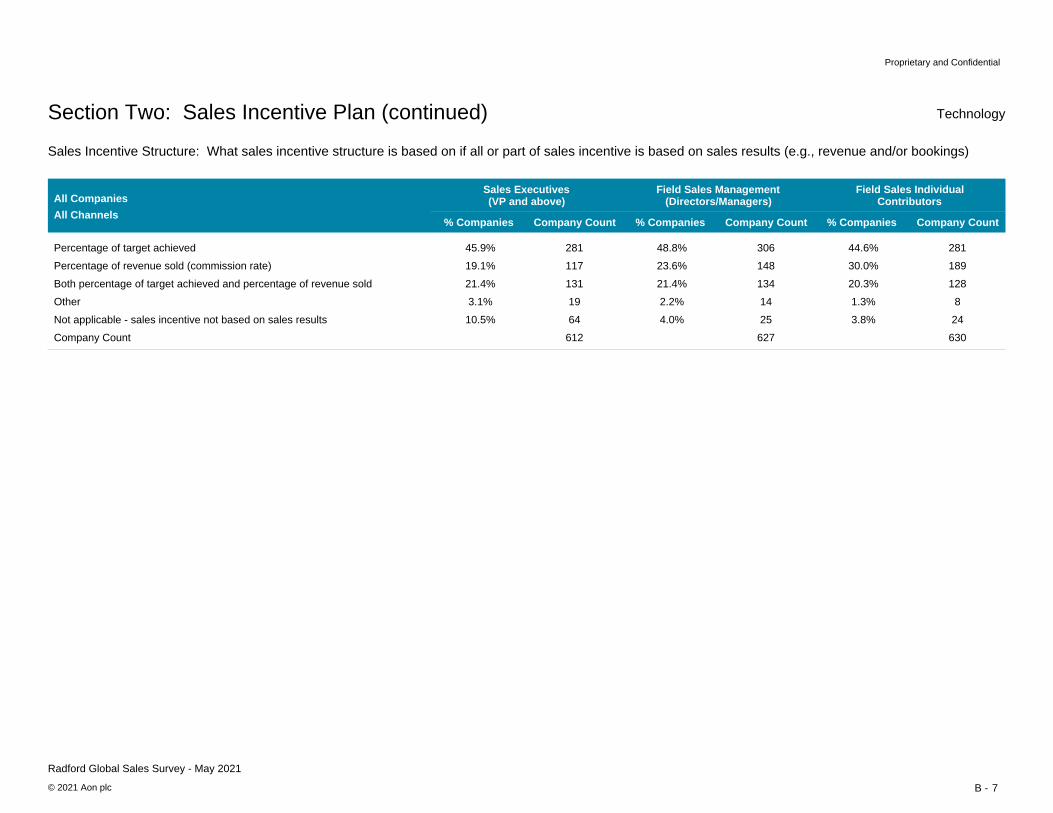
Sales Incentive Structure: What sales incentive structure is based on if all or part of sales incentive is based on sales results (e.g., revenue and/or bookings)
Percentage of revenue sold (commission rate)
Percentage of target achieved
% Companies Company Count
Both percentage of target achieved and percentage of revenue sold
Other
Field Sales IndividualContributors
44.6% 281
30.0% 189
20.3% 128
1.3% 8
All Channels% Companies Company Count
Field Sales Management(Directors/Managers)
48.8% 306
23.6% 148
21.4% 134
2.2% 14
% Companies Company Count
Sales Executives(VP and above)
45.9% 281
19.1% 117
21.4% 131
3.1% 19
All Companies
Company Count
Not applicable - sales incentive not based on sales results 3.8% 24
630
4.0% 25
627
10.5% 64
612
Section Two: Sales Incentive Plan (continued) Technology

8
Proprietary and Confidential
Radford Global Sales Survey - May 2021
© 2021 Aon plc B -
Sales Incentive Structure: What sales incentive structure is based on if all or part of sales incentive is based on sales results (e.g., revenue and/or bookings)
Percentage of revenue sold (commission rate)
Percentage of target achieved
% Companies Company Count
Both percentage of target achieved and percentage of revenue sold
Other
Field Sales IndividualContributors
41.3% 210
34.2% 174
21.2% 108
1.2% 6
Direct/End-User/Government Direct Channel% Companies Company Count
Field Sales Management(Directors/Managers)
46.5% 236
26.6% 135
21.9% 111
2.2% 11
% Companies Company Count
Sales Executives(VP and above)
45.3% 224
21.3% 105
22.7% 112
2.8% 14
All Companies
Company Count
Not applicable - sales incentive not based on sales results 2.2% 11
509
2.8% 14
507
7.9% 39
494
Section Two: Sales Incentive Plan (continued) Technology
9
Proprietary and Confidential
Radford Global Sales Survey - May 2021
© 2021 Aon plc B -
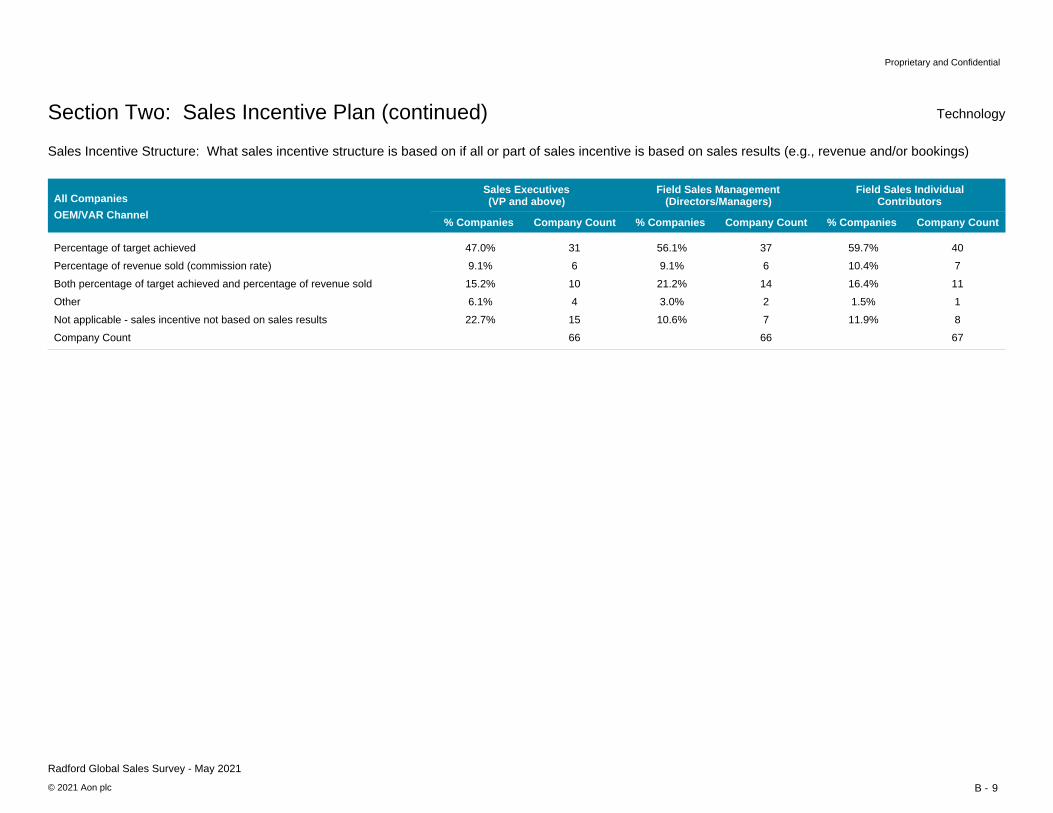
Sales Incentive Structure: What sales incentive structure is based on if all or part of sales incentive is based on sales results (e.g., revenue and/or bookings)
Percentage of revenue sold (commission rate)
Percentage of target achieved
% Companies Company Count
Both percentage of target achieved and percentage of revenue sold
Other
Field Sales IndividualContributors
59.7% 40
10.4% 7
16.4% 11
1.5% 1
OEM/VAR Channel% Companies Company Count
Field Sales Management(Directors/Managers)
56.1% 37
9.1% 6
21.2% 14
3.0% 2
% Companies Company Count
Sales Executives(VP and above)
47.0% 31
9.1% 6
15.2% 10
6.1% 4
All Companies
Company Count
Not applicable - sales incentive not based on sales results 11.9% 8
67
10.6% 7
66
22.7% 15
66
Section Two: Sales Incentive Plan (continued) Technology
10
Proprietary and Confidential
Radford Global Sales Survey - May 2021
© 2021 Aon plc B -
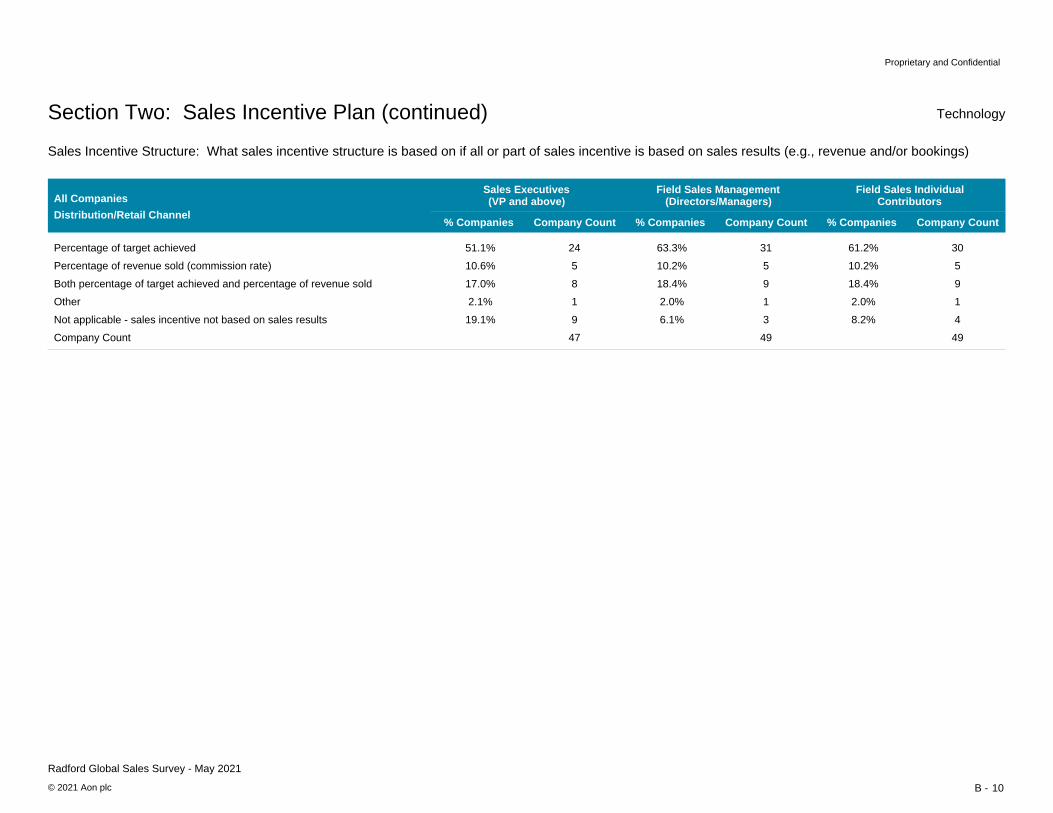
Sales Incentive Structure: What sales incentive structure is based on if all or part of sales incentive is based on sales results (e.g., revenue and/or bookings)
Percentage of revenue sold (commission rate)
Percentage of target achieved
% Companies Company Count
Both percentage of target achieved and percentage of revenue sold
Other
Field Sales IndividualContributors
61.2% 30
10.2% 5
18.4% 9
2.0% 1
Distribution/Retail Channel% Companies Company Count
Field Sales Management(Directors/Managers)
63.3% 31
10.2% 5
18.4% 9
2.0% 1
% Companies Company Count
Sales Executives(VP and above)
51.1% 24
10.6% 5
17.0% 8
2.1% 1
All Companies
Company Count
Not applicable - sales incentive not based on sales results 8.2% 4
49
6.1% 3
49
19.1% 9
47
Section Two: Sales Incentive Plan (continued) Technology

11
Proprietary and Confidential
Radford Global Sales Survey - May 2021
© 2021 Aon plc B -
Sales Incentive Structure: What sales incentive structure is based on if all or part of sales incentive is based on sales results (e.g., revenue and/or bookings)
Percentage of revenue sold (commission rate)
Percentage of target achieved
% Companies Company Count
Both percentage of target achieved and percentage of revenue sold
Other
Field Sales IndividualContributors
20.0% 1
60.0% 3
0.0% 0
0.0% 0
E-Commerce Channel% Companies Company Count
Field Sales Management(Directors/Managers)
40.0% 2
40.0% 2
0.0% 0
0.0% 0
% Companies Company Count
Sales Executives(VP and above)
40.0% 2
20.0% 1
20.0% 1
0.0% 0
All Companies
Company Count
Not applicable - sales incentive not based on sales results 20.0% 1
5
20.0% 1
5
20.0% 1
5
Section Two: Sales Incentive Plan (continued) Technology

12
Proprietary and Confidential
Radford Global Sales Survey - May 2021
© 2021 Aon plc B -
Incentive Payout Curve
Constant rate
How incentive payment curve is structured
% Companies Company Count
Rate accelerates
Rate decelerates
Field Sales IndividualContributors
35.3% 189
44.4% 238
0.4% 2
All Channels% Companies Company Count
Field Sales Management(Directors/Managers)
36.1% 190
41.1% 216
3.4% 18
% Companies Company Count
Sales Executives(VP and above)
32.0% 156
43.0% 210
10.0% 49
All Companies
Rate accelerates then decelerates
Rate decelerates then accelerates 2.8% 15
12.1% 65
3.0% 16
12.4% 65
2.7% 13
9.8% 48
Company Count
Rate accelerates then decelerates, then accelerates again (S-shaped curve) 5.0% 27
536
4.9% 26
526
4.1% 20
488
Number of times rate changes from the starting rate (if not constant)
1 time
2 times
16.1% 56
28.0% 97
17.4% 59
27.4% 93
18.3% 51
29.0% 81
4 times
3 times 26.8% 93
16.1% 56
27.7% 94
15.9% 54
30.1% 84
12.9% 36
Company Count
5 or more times 13.0% 45
347
11.5% 39
339
9.7% 27
279
Average % quota
Percent of quota at which rate first changes (if not constant)
Distribution of companies by % quota:
Under 80% of quota
90.7% 344
22.4% 77
92.0% 335
20.0% 67
92.5% 279
19.0% 53
80 - 90% of quota
91 - 98% of quota
99 - 101% of quota
6.7% 23
0.6% 2
56.1% 193
6.6% 22
0.6% 2
58.8% 197
5.4% 15
0.4% 1
63.1% 176
106 - 110% of quota
102 - 105% of quota 7.3% 25
3.2% 11
7.5% 25
3.0% 10
7.9% 22
1.1% 3
Company Count
Over 110% of quota 3.8% 13
344
3.6% 12
335
3.2% 9
279
Section Two: Sales Incentive Plan (continued) Technology
Avg Avg Avg

13
Proprietary and Confidential
Radford Global Sales Survey - May 2021
© 2021 Aon plc B -
Incentive Payout Curve
Constant rate
How incentive payment curve is structured
% Companies Company Count
Rate accelerates
Rate decelerates
Field Sales IndividualContributors
35.9% 159
44.5% 197
0.5% 2
Direct/End-User/Government Direct Channel% Companies Company Count
Field Sales Management(Directors/Managers)
36.9% 159
40.6% 175
3.5% 15
% Companies Company Count
Sales Executives(VP and above)
32.1% 131
44.1% 180
9.8% 40
All Companies
Rate accelerates then decelerates
Rate decelerates then accelerates 2.9% 13
11.5% 51
3.2% 14
12.1% 52
2.9% 12
9.6% 39
Company Count
Rate accelerates then decelerates, then accelerates again (S-shaped curve) 4.7% 21
443
4.6% 20
431
3.4% 14
408
Number of times rate changes from the starting rate (if not constant)
1 time
2 times
15.3% 44
26.0% 75
17.2% 48
25.1% 70
18.2% 42
26.8% 62
4 times
3 times 28.8% 83
16.3% 47
29.7% 83
16.1% 45
31.6% 73
13.4% 31
Company Count
5 or more times 13.5% 39
288
11.8% 33
279
10.0% 23
231
Average % quota
Percent of quota at which rate first changes (if not constant)
Distribution of companies by % quota:
Under 80% of quota
90.0% 288
23.6% 68
91.5% 277
20.9% 58
92.2% 232
19.8% 46
80 - 90% of quota
91 - 98% of quota
99 - 101% of quota
6.3% 18
0.3% 1
55.9% 161
6.1% 17
0.0% 0
59.2% 164
4.7% 11
0.0% 0
62.9% 146
106 - 110% of quota
102 - 105% of quota 6.9% 20
3.1% 9
7.2% 20
2.9% 8
7.8% 18
1.3% 3
Company Count
Over 110% of quota 3.8% 11
288
3.6% 10
277
3.4% 8
232
Section Two: Sales Incentive Plan (continued) Technology
Avg Avg Avg

14
Proprietary and Confidential
Radford Global Sales Survey - May 2021
© 2021 Aon plc B -
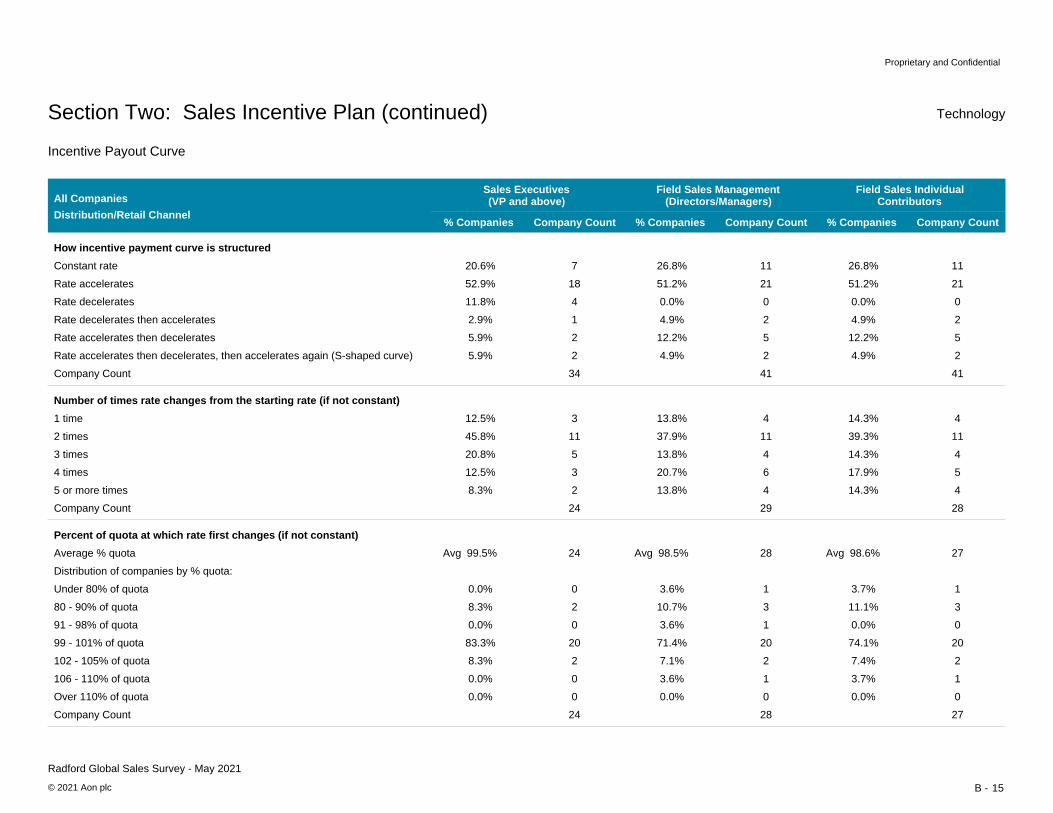
Incentive Payout Curve
Constant rate
How incentive payment curve is structured
% Companies Company Count
Rate accelerates
Rate decelerates
Field Sales IndividualContributors
36.7% 18
40.8% 20
0.0% 0
OEM/VAR Channel% Companies Company Count
Field Sales Management(Directors/Managers)
35.3% 18
39.2% 20
5.9% 3
% Companies Company Count
Sales Executives(VP and above)
37.2% 16
27.9% 12
11.6% 5
All Companies
Rate accelerates then decelerates
Rate decelerates then accelerates 0.0% 0
16.3% 8
0.0% 0
15.7% 8
0.0% 0
16.3% 7
Company Count
Rate accelerates then decelerates, then accelerates again (S-shaped curve) 6.1% 3
49
5.9% 3
51
7.0% 3
43
Number of times rate changes from the starting rate (if not constant)
1 time
2 times
26.7% 8
36.7% 11
23.3% 7
40.0% 12
26.1% 6
34.8% 8
4 times
3 times 16.7% 5
13.3% 4
20.0% 6
10.0% 3
21.7% 5
8.7% 2
Company Count
5 or more times 6.7% 2
30
6.7% 2
30
8.7% 2
23
Average % quota
Percent of quota at which rate first changes (if not constant)
Distribution of companies by % quota:
Under 80% of quota
91.9% 28
25.0% 7
91.6% 29
24.1% 7
90.1% 22
27.3% 6
80 - 90% of quota
91 - 98% of quota
99 - 101% of quota
7.1% 2
3.6% 1
42.9% 12
6.9% 2
3.4% 1
44.8% 13
9.1% 2
4.5% 1
45.5% 10
106 - 110% of quota
102 - 105% of quota 10.7% 3
3.6% 1
10.3% 3
3.4% 1
9.1% 2
0.0% 0
Company Count
Over 110% of quota 7.1% 2
28
6.9% 2
29
4.5% 1
22
Section Two: Sales Incentive Plan (continued) Technology
Avg Avg Avg
15
Proprietary and Confidential
Radford Global Sales Survey - May 2021
© 2021 Aon plc B -
Incentive Payout Curve
Constant rate
How incentive payment curve is structured
% Companies Company Count
Rate accelerates
Rate decelerates
Field Sales IndividualContributors
26.8% 11
51.2% 21
0.0% 0
Distribution/Retail Channel% Companies Company Count
Field Sales Management(Directors/Managers)
26.8% 11
51.2% 21
0.0% 0
% Companies Company Count
Sales Executives(VP and above)
20.6% 7
52.9% 18
11.8% 4
All Companies
Rate accelerates then decelerates
Rate decelerates then accelerates 4.9% 2
12.2% 5
4.9% 2
12.2% 5
2.9% 1
5.9% 2
Company Count
Rate accelerates then decelerates, then accelerates again (S-shaped curve) 4.9% 2
41
4.9% 2
41
5.9% 2
34
Number of times rate changes from the starting rate (if not constant)
1 time
2 times
14.3% 4
39.3% 11
13.8% 4
37.9% 11
12.5% 3
45.8% 11
4 times
3 times 14.3% 4
17.9% 5
13.8% 4
20.7% 6
20.8% 5
12.5% 3
Company Count
5 or more times 14.3% 4
28
13.8% 4
29
8.3% 2
24
Average % quota
Percent of quota at which rate first changes (if not constant)
Distribution of companies by % quota:
Under 80% of quota
98.6% 27
3.7% 1
98.5% 28
3.6% 1
99.5% 24
0.0% 0
80 - 90% of quota
91 - 98% of quota
99 - 101% of quota
11.1% 3
0.0% 0
74.1% 20
10.7% 3
3.6% 1
71.4% 20
8.3% 2
0.0% 0
83.3% 20
106 - 110% of quota
102 - 105% of quota 7.4% 2
3.7% 1
7.1% 2
3.6% 1
8.3% 2
0.0% 0
Company Count
Over 110% of quota 0.0% 0
27
0.0% 0
28
0.0% 0
24
Section Two: Sales Incentive Plan (continued) Technology
Avg Avg Avg
16
Proprietary and Confidential
Radford Global Sales Survey - May 2021
© 2021 Aon plc B -
Incentive Payout Curve
Constant rate
How incentive payment curve is structured
% Companies Company Count
Rate accelerates
Rate decelerates
Field Sales IndividualContributors
33.3% 1
0.0% 0
0.0% 0
E-Commerce Channel% Companies Company Count
Field Sales Management(Directors/Managers)
66.7% 2
0.0% 0
0.0% 0
% Companies Company Count
Sales Executives(VP and above)
66.7% 2
0.0% 0
0.0% 0
All Companies
Rate accelerates then decelerates
Rate decelerates then accelerates 0.0% 0
33.3% 1
0.0% 0
0.0% 0
0.0% 0
0.0% 0
Company Count
Rate accelerates then decelerates, then accelerates again (S-shaped curve) 33.3% 1
3
33.3% 1
3
33.3% 1
3
Number of times rate changes from the starting rate (if not constant)
1 time
2 times
4 times
3 times
Company Count
5 or more times
Average % quota
Percent of quota at which rate first changes (if not constant)
Distribution of companies by % quota:
Under 80% of quota
80 - 90% of quota
91 - 98% of quota
99 - 101% of quota
106 - 110% of quota
102 - 105% of quota
Company Count
Over 110% of quota
Section Two: Sales Incentive Plan (continued) Technology
Avg Avg Avg

17
Proprietary and Confidential
Radford Global Sales Survey - May 2021
© 2021 Aon plc B -
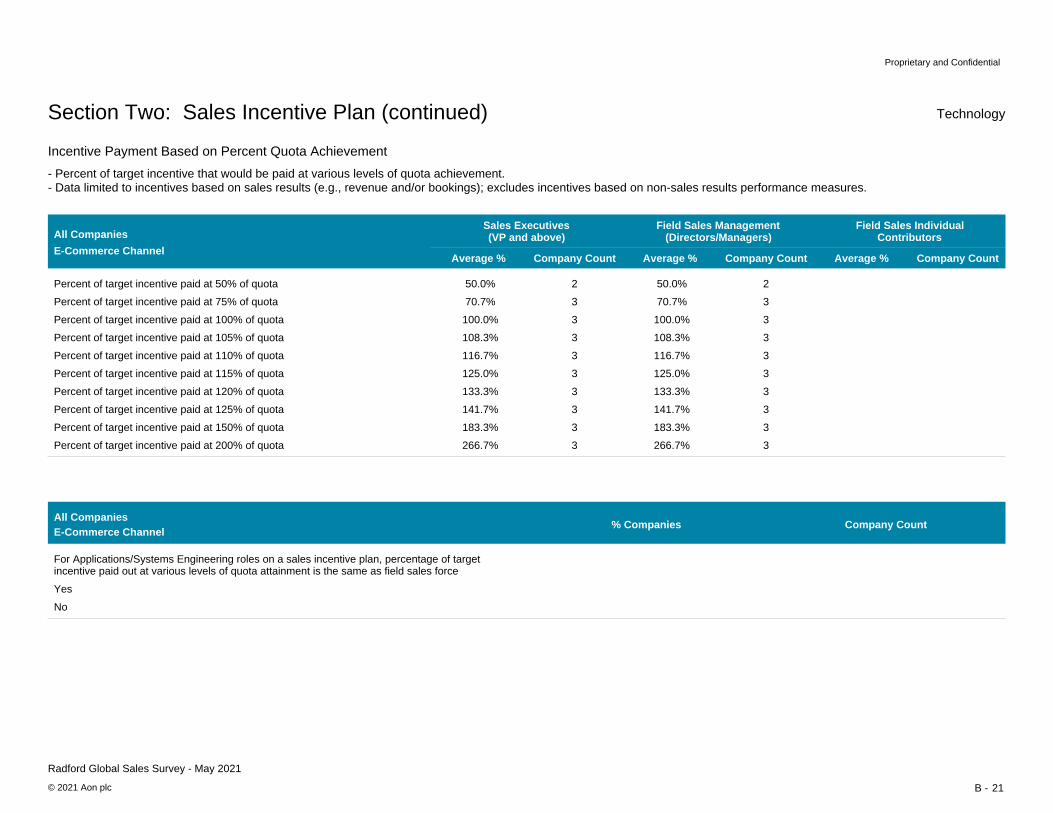
Incentive Payment Based on Percent Quota Achievement
Percent of target incentive paid at 75% of quota
Percent of target incentive paid at 50% of quota
Average % Company Count
Percent of target incentive paid at 100% of quota
Percent of target incentive paid at 105% of quota
Field Sales IndividualContributors
47.9% 320
71.0% 355
100.0% 380
110.1% 375
All ChannelsAverage % Company Count
Field Sales Management(Directors/Managers)
48.3% 319
71.2% 353
100.0% 381
110.6% 375
Average % Company Count
Sales Executives(VP and above)
48.6% 300
71.2% 333
100.1% 352
110.9% 346
All Companies
Percent of target incentive paid at 115% of quota
Percent of target incentive paid at 110% of quota 118.8% 375
127.2% 373
120.7% 374
130.0% 371
121.0% 345
130.3% 342
Percent of target incentive paid at 120% of quota
Percent of target incentive paid at 125% of quota
136.0% 372
144.0% 366
139.8% 369
148.4% 361
140.1% 340
149.7% 336
Percent of target incentive paid at 200% of quota
Percent of target incentive paid at 150% of quota 185.5% 358
259.4% 339
190.6% 352
266.8% 331
192.1% 327
270.7% 307
Section Two: Sales Incentive Plan (continued) Technology
- Percent of target incentive that would be paid at various levels of quota achievement.- Data limited to incentives based on sales results (e.g., revenue and/or bookings); excludes incentives based on non-sales results performance measures.
For Applications/Systems Engineering roles on a sales incentive plan, percentage of target incentive paid out at various levels of quota attainment is the same as field sales force
Yes
% Companies
50.8%
49.2%
182
176No
Company CountAll CompaniesAll Channels
18
Proprietary and Confidential
Radford Global Sales Survey - May 2021
© 2021 Aon plc B -
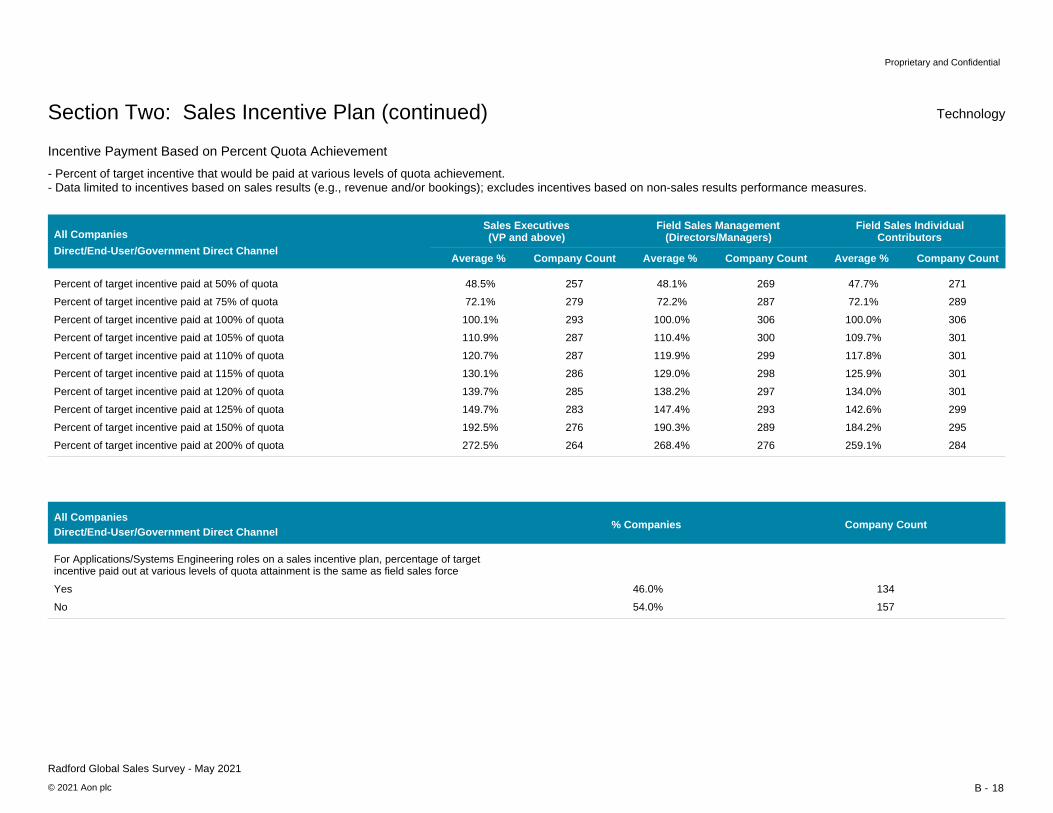
Incentive Payment Based on Percent Quota Achievement
Percent of target incentive paid at 75% of quota
Percent of target incentive paid at 50% of quota
Average % Company Count
Percent of target incentive paid at 100% of quota
Percent of target incentive paid at 105% of quota
Field Sales IndividualContributors
47.7% 271
72.1% 289
100.0% 306
109.7% 301
Direct/End-User/Government Direct ChannelAverage % Company Count
Field Sales Management(Directors/Managers)
48.1% 269
72.2% 287
100.0% 306
110.4% 300
Average % Company Count
Sales Executives(VP and above)
48.5% 257
72.1% 279
100.1% 293
110.9% 287
All Companies
Percent of target incentive paid at 115% of quota
Percent of target incentive paid at 110% of quota 117.8% 301
125.9% 301
119.9% 299
129.0% 298
120.7% 287
130.1% 286
Percent of target incentive paid at 120% of quota
Percent of target incentive paid at 125% of quota
134.0% 301
142.6% 299
138.2% 297
147.4% 293
139.7% 285
149.7% 283
Percent of target incentive paid at 200% of quota
Percent of target incentive paid at 150% of quota 184.2% 295
259.1% 284
190.3% 289
268.4% 276
192.5% 276
272.5% 264
Section Two: Sales Incentive Plan (continued) Technology
- Percent of target incentive that would be paid at various levels of quota achievement.- Data limited to incentives based on sales results (e.g., revenue and/or bookings); excludes incentives based on non-sales results performance measures.
For Applications/Systems Engineering roles on a sales incentive plan, percentage of target incentive paid out at various levels of quota attainment is the same as field sales force
Yes
% Companies
46.0%
54.0%
134
157No
Company CountAll CompaniesDirect/End-User/Government Direct Channel

19
Proprietary and Confidential
Radford Global Sales Survey - May 2021
© 2021 Aon plc B -
Incentive Payment Based on Percent Quota Achievement
Percent of target incentive paid at 75% of quota
Percent of target incentive paid at 50% of quota
Average % Company Count
Percent of target incentive paid at 100% of quota
Percent of target incentive paid at 105% of quota
Field Sales IndividualContributors
49.1% 29
65.4% 37
100.0% 41
110.9% 41
OEM/VAR ChannelAverage % Company Count
Field Sales Management(Directors/Managers)
49.1% 29
65.4% 37
100.0% 41
111.4% 41
Average % Company Count
Sales Executives(VP and above)
49.0% 26
65.7% 32
100.0% 33
109.6% 33
All Companies
Percent of target incentive paid at 115% of quota
Percent of target incentive paid at 110% of quota 122.7% 41
131.9% 40
123.6% 41
132.9% 40
120.0% 33
127.3% 32
Percent of target incentive paid at 120% of quota
Percent of target incentive paid at 125% of quota
142.6% 40
143.7% 37
144.8% 40
146.4% 37
136.7% 32
141.2% 31
Percent of target incentive paid at 200% of quota
Percent of target incentive paid at 150% of quota 180.2% 35
239.6% 31
183.1% 35
238.0% 31
179.8% 31
228.5% 26
Section Two: Sales Incentive Plan (continued) Technology
- Percent of target incentive that would be paid at various levels of quota achievement.- Data limited to incentives based on sales results (e.g., revenue and/or bookings); excludes incentives based on non-sales results performance measures.
For Applications/Systems Engineering roles on a sales incentive plan, percentage of target incentive paid out at various levels of quota attainment is the same as field sales force
Yes
% Companies
73.2%
26.8%
30
11No
Company CountAll CompaniesOEM/VAR Channel

20
Proprietary and Confidential
Radford Global Sales Survey - May 2021
© 2021 Aon plc B -
Incentive Payment Based on Percent Quota Achievement
Percent of target incentive paid at 75% of quota
Percent of target incentive paid at 50% of quota
Average % Company Count
Percent of target incentive paid at 100% of quota
Percent of target incentive paid at 105% of quota
Field Sales IndividualContributors
49.4% 19
66.2% 27
100.0% 31
112.1% 31
Distribution/Retail ChannelAverage % Company Count
Field Sales Management(Directors/Managers)
49.4% 19
68.1% 26
100.0% 31
112.4% 31
Average % Company Count
Sales Executives(VP and above)
49.2% 15
68.2% 19
100.0% 23
113.4% 23
All Companies
Percent of target incentive paid at 115% of quota
Percent of target incentive paid at 110% of quota 123.9% 31
134.5% 30
124.6% 31
136.1% 30
126.8% 22
138.7% 21
Percent of target incentive paid at 120% of quota
Percent of target incentive paid at 125% of quota
147.0% 29
159.6% 28
149.4% 29
162.5% 28
151.9% 20
164.7% 19
Percent of target incentive paid at 200% of quota
Percent of target incentive paid at 150% of quota 205.7% 26
287.6% 22
206.1% 25
289.2% 21
209.7% 17
316.9% 14
Section Two: Sales Incentive Plan (continued) Technology
- Percent of target incentive that would be paid at various levels of quota achievement.- Data limited to incentives based on sales results (e.g., revenue and/or bookings); excludes incentives based on non-sales results performance measures.
For Applications/Systems Engineering roles on a sales incentive plan, percentage of target incentive paid out at various levels of quota attainment is the same as field sales force
Yes
% Companies
69.2%
30.8%
18
8No
Company CountAll CompaniesDistribution/Retail Channel
21
Proprietary and Confidential
Radford Global Sales Survey - May 2021
© 2021 Aon plc B -
Incentive Payment Based on Percent Quota Achievement
Percent of target incentive paid at 75% of quota
Percent of target incentive paid at 50% of quota
Average % Company Count
Percent of target incentive paid at 100% of quota
Percent of target incentive paid at 105% of quota
Field Sales IndividualContributors
E-Commerce ChannelAverage % Company Count
Field Sales Management(Directors/Managers)
50.0% 2
70.7% 3
100.0% 3
108.3% 3
Average % Company Count
Sales Executives(VP and above)
50.0% 2
70.7% 3
100.0% 3
108.3% 3
All Companies
Percent of target incentive paid at 115% of quota
Percent of target incentive paid at 110% of quota 116.7% 3
125.0% 3
116.7% 3
125.0% 3
Percent of target incentive paid at 120% of quota
Percent of target incentive paid at 125% of quota
133.3% 3
141.7% 3
133.3% 3
141.7% 3
Percent of target incentive paid at 200% of quota
Percent of target incentive paid at 150% of quota 183.3% 3
266.7% 3
183.3% 3
266.7% 3
Section Two: Sales Incentive Plan (continued) Technology
- Percent of target incentive that would be paid at various levels of quota achievement.- Data limited to incentives based on sales results (e.g., revenue and/or bookings); excludes incentives based on non-sales results performance measures.
For Applications/Systems Engineering roles on a sales incentive plan, percentage of target incentive paid out at various levels of quota attainment is the same as field sales force
Yes
% Companies
No
Company CountAll CompaniesE-Commerce Channel
22
Proprietary and Confidential
Radford Global Sales Survey - May 2021
© 2021 Aon plc B -
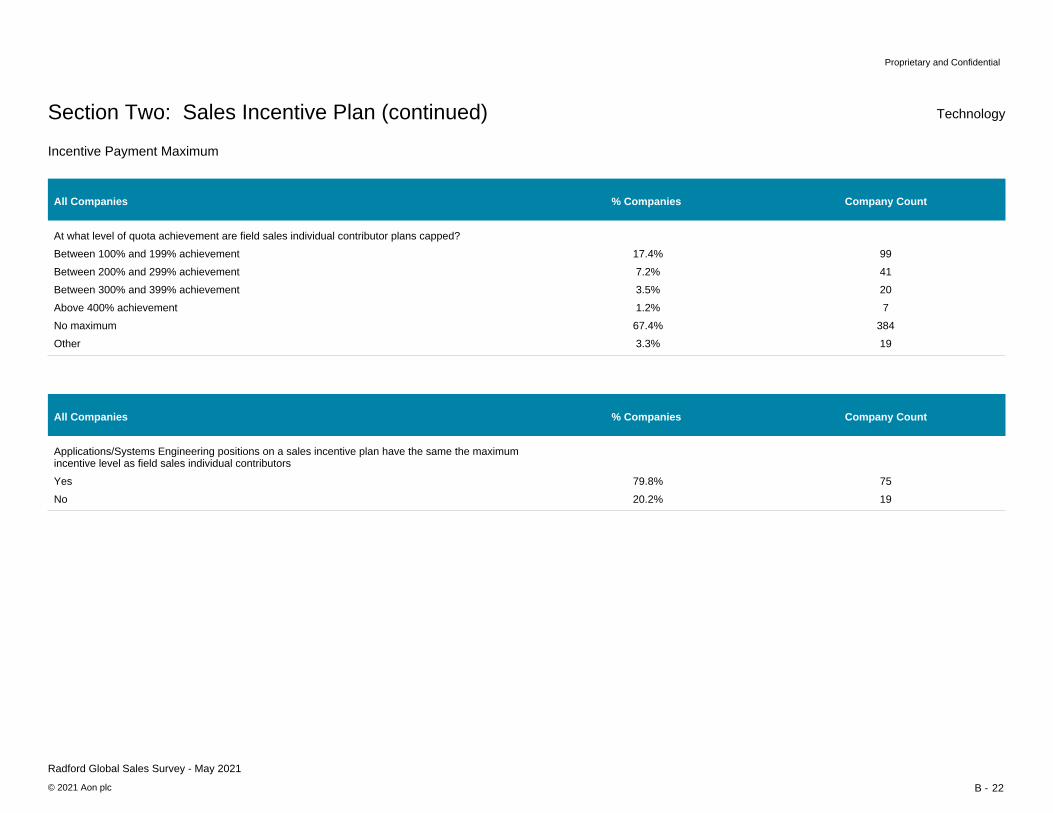
Incentive Payment Maximum
Section Two: Sales Incentive Plan (continued) Technology
Applications/Systems Engineering positions on a sales incentive plan have the same the maximum incentive level as field sales individual contributors
Yes
% Companies
79.8%
20.2%
75
19No
Company CountAll Companies
At what level of quota achievement are field sales individual contributor plans capped?
Between 100% and 199% achievement
% Companies
17.4%
7.2%
99
41Between 200% and 299% achievement
Company CountAll Companies
Between 300% and 399% achievement 3.5%
1.2%
20
7Above 400% achievement
No maximum 67.4%
3.3%
384
19Other
1
Proprietary and Confidential
Radford Global Sales Survey - May 2021
© 2021 Aon plc C -
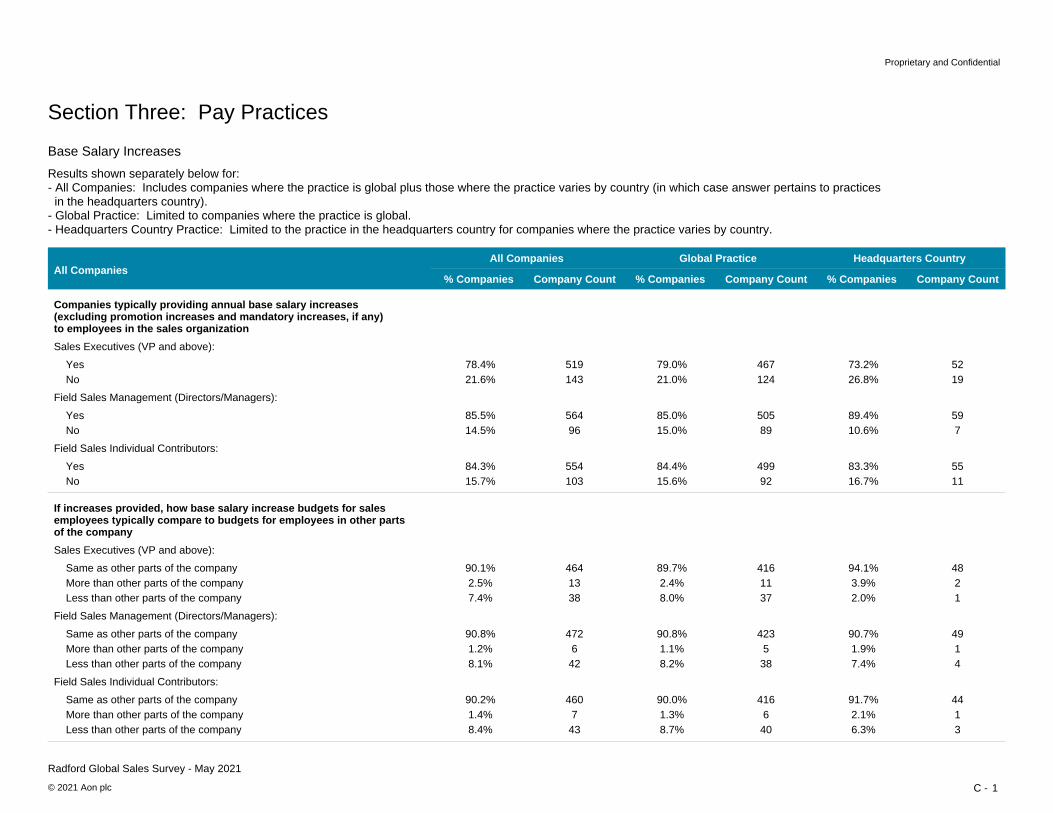
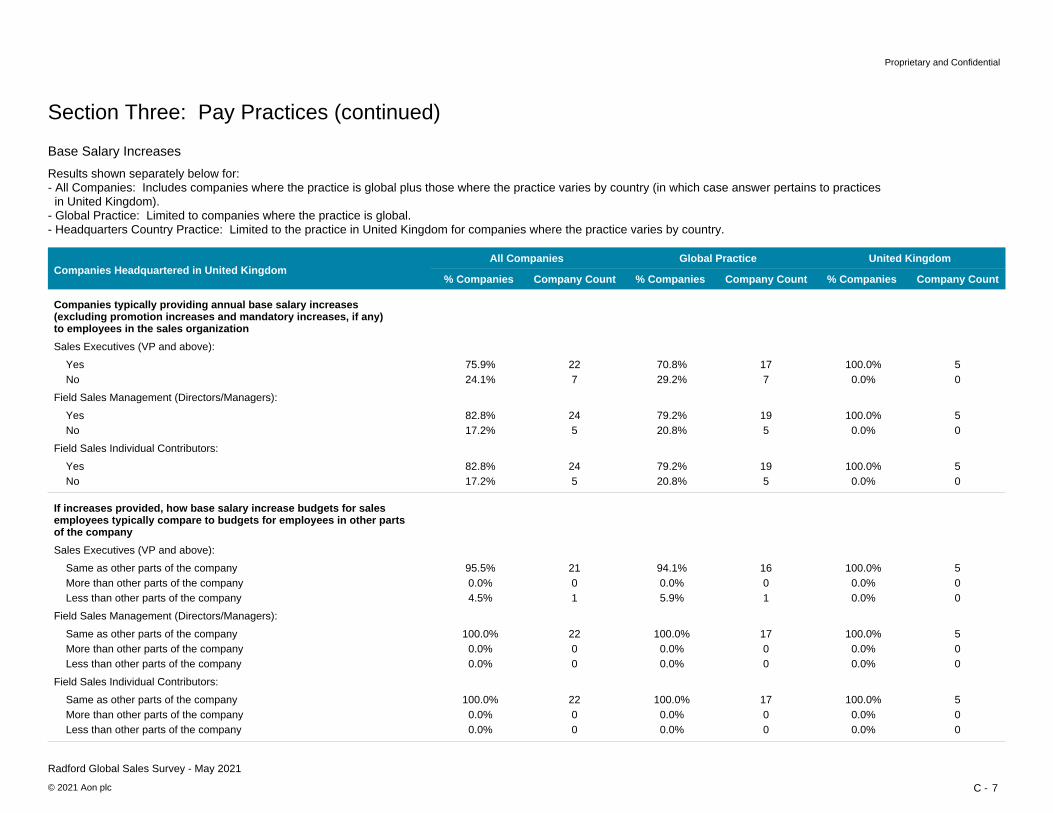
Base Salary Increases
Sales Executives (VP and above):
Companies typically providing annual base salary increases
% Companies Company Count
Yes No
73.2% 52 26.8% 19
All Companies% Companies Company Count
79.0% 467 21.0% 124
% Companies Company Count
All Companies
78.4% 519 21.6% 143
Global Practice Headquarters Country
(excluding promotion increases and mandatory increases, if any)to employees in the sales organization
Field Sales Management (Directors/Managers):
Yes No
89.4% 59 10.6% 7
85.0% 505 15.0% 89
85.5% 564 14.5% 96
Field Sales Individual Contributors:
Yes No
83.3% 55 16.7% 11
84.4% 499 15.6% 92
84.3% 554 15.7% 103
Sales Executives (VP and above):
If increases provided, how base salary increase budgets for sales
Same as other parts of the company More than other parts of the company
94.1% 48 3.9% 2
89.7% 416 2.4% 11
90.1% 464 2.5% 13
employees typically compare to budgets for employees in other parts
Less than other parts of the company 2.0% 1 8.0% 37 7.4% 38
Field Sales Management (Directors/Managers):
Same as other parts of the company More than other parts of the company
90.7% 49 1.9% 1
90.8% 423 1.1% 5
90.8% 472 1.2% 6
Less than other parts of the company 7.4% 4 8.2% 38 8.1% 42
Field Sales Individual Contributors:
Same as other parts of the company More than other parts of the company
91.7% 44 2.1% 1
90.0% 416 1.3% 6
90.2% 460 1.4% 7
Less than other parts of the company 6.3% 3 8.7% 40 8.4% 43
Section Three: Pay Practices
Results shown separately below for:- All Companies: Includes companies where the practice is global plus those where the practice varies by country (in which case answer pertains to practices in the headquarters country). - Global Practice: Limited to companies where the practice is global.- Headquarters Country Practice: Limited to the practice in the headquarters country for companies where the practice varies by country.
of the company

2
Proprietary and Confidential
Radford Global Sales Survey - May 2021
© 2021 Aon plc C -
Base Salary Increases
Sales Executives (VP and above):
Companies typically providing annual base salary increases
% Companies Company Count
Yes No
Companies Headquartered in Australia% Companies Company Count
85.7% 6 14.3% 1
% Companies Company Count
All Companies
77.8% 7 22.2% 2
Global Practice Australia
(excluding promotion increases and mandatory increases, if any)to employees in the sales organization
Field Sales Management (Directors/Managers):
Yes No
100.0% 7 0.0% 0
88.9% 8 11.1% 1
Field Sales Individual Contributors:
Yes No
100.0% 7 0.0% 0
88.9% 8 11.1% 1
Sales Executives (VP and above):
If increases provided, how base salary increase budgets for sales
Same as other parts of the company More than other parts of the company
100.0% 6 0.0% 0
100.0% 7 0.0% 0
employees typically compare to budgets for employees in other parts
Less than other parts of the company 0.0% 0 0.0% 0
Field Sales Management (Directors/Managers):
Same as other parts of the company More than other parts of the company
100.0% 6 0.0% 0
100.0% 7 0.0% 0
Less than other parts of the company 0.0% 0 0.0% 0
Field Sales Individual Contributors:
Same as other parts of the company More than other parts of the company
100.0% 6 0.0% 0
100.0% 7 0.0% 0
Less than other parts of the company 0.0% 0 0.0% 0
Section Three: Pay Practices (continued)
Results shown separately below for:- All Companies: Includes companies where the practice is global plus those where the practice varies by country (in which case answer pertains to practices in Australia). - Global Practice: Limited to companies where the practice is global.- Headquarters Country Practice: Limited to the practice in Australia for companies where the practice varies by country.
of the company

3
Proprietary and Confidential
Radford Global Sales Survey - May 2021
© 2021 Aon plc C -
Base Salary Increases
Sales Executives (VP and above):
Companies typically providing annual base salary increases
% Companies Company Count
Yes No
Companies Headquartered in Canada% Companies Company Count
85.2% 23 14.8% 4
% Companies Company Count
All Companies
85.7% 24 14.3% 4
Global Practice Canada
(excluding promotion increases and mandatory increases, if any)to employees in the sales organization
Field Sales Management (Directors/Managers):
Yes No
82.1% 23 17.9% 5
82.8% 24 17.2% 5
Field Sales Individual Contributors:
Yes No
82.1% 23 17.9% 5
82.8% 24 17.2% 5
Sales Executives (VP and above):
If increases provided, how base salary increase budgets for sales
Same as other parts of the company More than other parts of the company
95.5% 21 0.0% 0
95.7% 22 0.0% 0
employees typically compare to budgets for employees in other parts
Less than other parts of the company 4.5% 1 4.3% 1
Field Sales Management (Directors/Managers):
Same as other parts of the company More than other parts of the company
90.5% 19 0.0% 0
90.9% 20 0.0% 0
Less than other parts of the company 9.5% 2 9.1% 2
Field Sales Individual Contributors:
Same as other parts of the company More than other parts of the company
85.7% 18 0.0% 0
86.4% 19 0.0% 0
Less than other parts of the company 14.3% 3 13.6% 3
Section Three: Pay Practices (continued)
Results shown separately below for:- All Companies: Includes companies where the practice is global plus those where the practice varies by country (in which case answer pertains to practices in Canada). - Global Practice: Limited to companies where the practice is global.- Headquarters Country Practice: Limited to the practice in Canada for companies where the practice varies by country.
of the company

4
Proprietary and Confidential
Radford Global Sales Survey - May 2021
© 2021 Aon plc C -
Base Salary Increases
Sales Executives (VP and above):
Companies typically providing annual base salary increases
% Companies Company Count
Yes No
Companies Headquartered in Germany% Companies Company Count
100.0% 3 0.0% 0
% Companies Company Count
All Companies
100.0% 3 0.0% 0
Global Practice Germany
(excluding promotion increases and mandatory increases, if any)to employees in the sales organization
Field Sales Management (Directors/Managers):
Yes No
100.0% 5 0.0% 0
100.0% 5 0.0% 0
Field Sales Individual Contributors:
Yes No
100.0% 5 0.0% 0
100.0% 5 0.0% 0
Sales Executives (VP and above):
If increases provided, how base salary increase budgets for sales
Same as other parts of the company More than other parts of the company
100.0% 3 0.0% 0
100.0% 3 0.0% 0
employees typically compare to budgets for employees in other parts
Less than other parts of the company 0.0% 0 0.0% 0
Field Sales Management (Directors/Managers):
Same as other parts of the company More than other parts of the company
100.0% 5 0.0% 0
100.0% 5 0.0% 0
Less than other parts of the company 0.0% 0 0.0% 0
Field Sales Individual Contributors:
Same as other parts of the company More than other parts of the company
100.0% 5 0.0% 0
100.0% 5 0.0% 0
Less than other parts of the company 0.0% 0 0.0% 0
Section Three: Pay Practices (continued)
Results shown separately below for:- All Companies: Includes companies where the practice is global plus those where the practice varies by country (in which case answer pertains to practices in Germany). - Global Practice: Limited to companies where the practice is global.- Headquarters Country Practice: Limited to the practice in Germany for companies where the practice varies by country.
of the company
5
Proprietary and Confidential
Radford Global Sales Survey - May 2021
© 2021 Aon plc C -
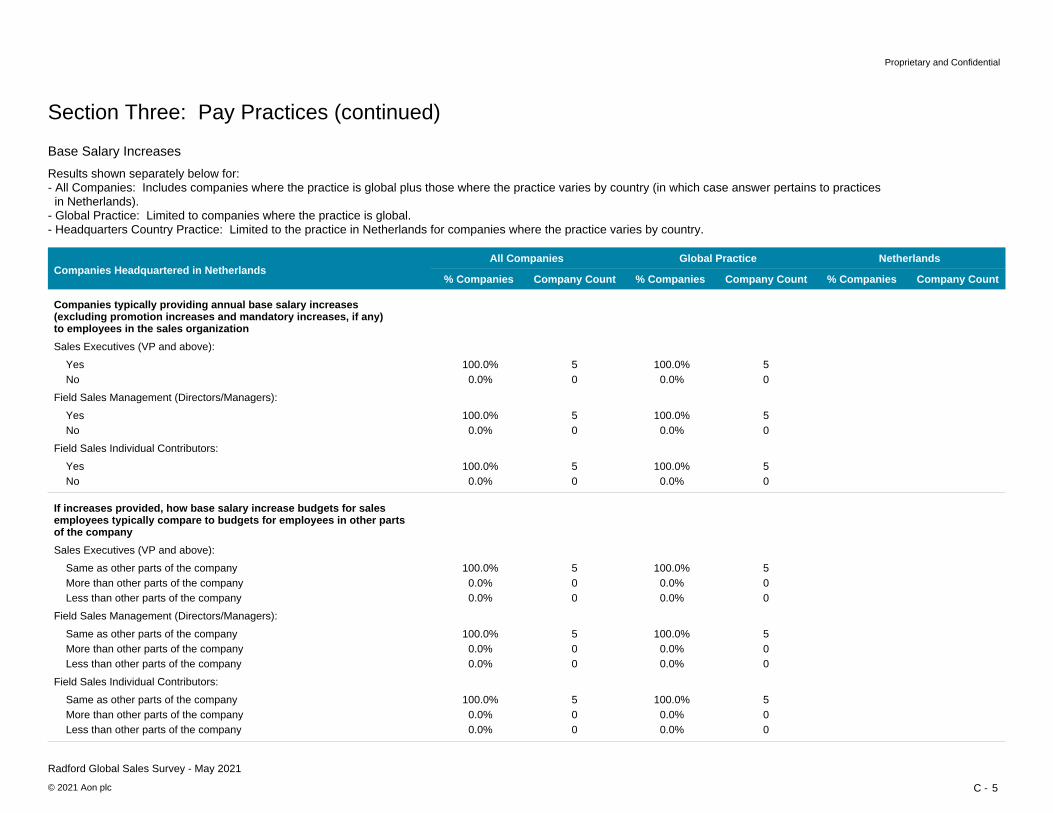
Base Salary Increases
Sales Executives (VP and above):
Companies typically providing annual base salary increases
% Companies Company Count
Yes No
Companies Headquartered in Netherlands% Companies Company Count
100.0% 5 0.0% 0
% Companies Company Count
All Companies
100.0% 5 0.0% 0
Global Practice Netherlands
(excluding promotion increases and mandatory increases, if any)to employees in the sales organization
Field Sales Management (Directors/Managers):
Yes No
100.0% 5 0.0% 0
100.0% 5 0.0% 0
Field Sales Individual Contributors:
Yes No
100.0% 5 0.0% 0
100.0% 5 0.0% 0
Sales Executives (VP and above):
If increases provided, how base salary increase budgets for sales
Same as other parts of the company More than other parts of the company
100.0% 5 0.0% 0
100.0% 5 0.0% 0
employees typically compare to budgets for employees in other parts
Less than other parts of the company 0.0% 0 0.0% 0
Field Sales Management (Directors/Managers):
Same as other parts of the company More than other parts of the company
100.0% 5 0.0% 0
100.0% 5 0.0% 0
Less than other parts of the company 0.0% 0 0.0% 0
Field Sales Individual Contributors:
Same as other parts of the company More than other parts of the company
100.0% 5 0.0% 0
100.0% 5 0.0% 0
Less than other parts of the company 0.0% 0 0.0% 0
Section Three: Pay Practices (continued)
Results shown separately below for:- All Companies: Includes companies where the practice is global plus those where the practice varies by country (in which case answer pertains to practices in Netherlands). - Global Practice: Limited to companies where the practice is global.- Headquarters Country Practice: Limited to the practice in Netherlands for companies where the practice varies by country.
of the company

6
Proprietary and Confidential
Radford Global Sales Survey - May 2021
© 2021 Aon plc C -
Base Salary Increases
Sales Executives (VP and above):
Companies typically providing annual base salary increases
% Companies Company Count
Yes No
Companies Headquartered in Switzerland% Companies Company Count
83.3% 5 16.7% 1
% Companies Company Count
All Companies
83.3% 5 16.7% 1
Global Practice Switzerland
(excluding promotion increases and mandatory increases, if any)to employees in the sales organization
Field Sales Management (Directors/Managers):
Yes No
83.3% 5 16.7% 1
83.3% 5 16.7% 1
Field Sales Individual Contributors:
Yes No
83.3% 5 16.7% 1
83.3% 5 16.7% 1
Sales Executives (VP and above):
If increases provided, how base salary increase budgets for sales
Same as other parts of the company More than other parts of the company
100.0% 5 0.0% 0
100.0% 5 0.0% 0
employees typically compare to budgets for employees in other parts
Less than other parts of the company 0.0% 0 0.0% 0
Field Sales Management (Directors/Managers):
Same as other parts of the company More than other parts of the company
100.0% 5 0.0% 0
100.0% 5 0.0% 0
Less than other parts of the company 0.0% 0 0.0% 0
Field Sales Individual Contributors:
Same as other parts of the company More than other parts of the company
100.0% 5 0.0% 0
100.0% 5 0.0% 0
Less than other parts of the company 0.0% 0 0.0% 0
Section Three: Pay Practices (continued)
Results shown separately below for:- All Companies: Includes companies where the practice is global plus those where the practice varies by country (in which case answer pertains to practices in Switzerland). - Global Practice: Limited to companies where the practice is global.- Headquarters Country Practice: Limited to the practice in Switzerland for companies where the practice varies by country.
of the company
7
Proprietary and Confidential
Radford Global Sales Survey - May 2021
© 2021 Aon plc C -
Base Salary Increases
Sales Executives (VP and above):
Companies typically providing annual base salary increases
% Companies Company Count
Yes No
100.0% 5 0.0% 0
Companies Headquartered in United Kingdom% Companies Company Count
70.8% 17 29.2% 7
% Companies Company Count
All Companies
75.9% 22 24.1% 7
Global Practice United Kingdom
(excluding promotion increases and mandatory increases, if any)to employees in the sales organization
Field Sales Management (Directors/Managers):
Yes No
100.0% 5 0.0% 0
79.2% 19 20.8% 5
82.8% 24 17.2% 5
Field Sales Individual Contributors:
Yes No
100.0% 5 0.0% 0
79.2% 19 20.8% 5
82.8% 24 17.2% 5
Sales Executives (VP and above):
If increases provided, how base salary increase budgets for sales
Same as other parts of the company More than other parts of the company
100.0% 5 0.0% 0
94.1% 16 0.0% 0
95.5% 21 0.0% 0
employees typically compare to budgets for employees in other parts
Less than other parts of the company 0.0% 0 5.9% 1 4.5% 1
Field Sales Management (Directors/Managers):
Same as other parts of the company More than other parts of the company
100.0% 5 0.0% 0
100.0% 17 0.0% 0
100.0% 22 0.0% 0
Less than other parts of the company 0.0% 0 0.0% 0 0.0% 0
Field Sales Individual Contributors:
Same as other parts of the company More than other parts of the company
100.0% 5 0.0% 0
100.0% 17 0.0% 0
100.0% 22 0.0% 0
Less than other parts of the company 0.0% 0 0.0% 0 0.0% 0
Section Three: Pay Practices (continued)
Results shown separately below for:- All Companies: Includes companies where the practice is global plus those where the practice varies by country (in which case answer pertains to practices in United Kingdom). - Global Practice: Limited to companies where the practice is global.- Headquarters Country Practice: Limited to the practice in United Kingdom for companies where the practice varies by country.
of the company

8
Proprietary and Confidential
Radford Global Sales Survey - May 2021
© 2021 Aon plc C -
Base Salary Increases
Sales Executives (VP and above):
Companies typically providing annual base salary increases
% Companies Company Count
Yes No
71.7% 43 28.3% 17
Companies Headquartered in United States% Companies Company Count
78.4% 391 21.6% 108
% Companies Company Count
All Companies
77.6% 434 22.4% 125
Global Practice United States
(excluding promotion increases and mandatory increases, if any)to employees in the sales organization
Field Sales Management (Directors/Managers):
Yes No
89.1% 49 10.9% 6
84.8% 424 15.2% 76
85.2% 473 14.8% 82
Field Sales Individual Contributors:
Yes No
81.8% 45 18.2% 10
84.1% 419 15.9% 79
83.9% 464 16.1% 89
Sales Executives (VP and above):
If increases provided, how base salary increase budgets for sales
Same as other parts of the company More than other parts of the company
92.9% 39 4.8% 2
88.4% 344 2.6% 10
88.9% 383 2.8% 12
employees typically compare to budgets for employees in other parts
Less than other parts of the company 2.4% 1 9.0% 35 8.4% 36
Field Sales Management (Directors/Managers):
Same as other parts of the company More than other parts of the company
88.6% 39 2.3% 1
89.7% 350 1.0% 4
89.6% 389 1.2% 5
Less than other parts of the company 9.1% 4 9.2% 36 9.2% 40
Field Sales Individual Contributors:
Same as other parts of the company More than other parts of the company
89.5% 34 2.6% 1
88.9% 344 1.6% 6
88.9% 378 1.6% 7
Less than other parts of the company 7.9% 3 9.6% 37 9.4% 40
Section Three: Pay Practices (continued)
Results shown separately below for:- All Companies: Includes companies where the practice is global plus those where the practice varies by country (in which case answer pertains to practices in United States). - Global Practice: Limited to companies where the practice is global.- Headquarters Country Practice: Limited to the practice in United States for companies where the practice varies by country.
of the company

9
Proprietary and Confidential
Radford Global Sales Survey - May 2021
© 2021 Aon plc C -
Salary Structures
Sales Executives (VP and above):
Companies with formal salary structures for sales personnel
% Companies Company Count
Yes No
72.0% 59 28.0% 23
All Companies% Companies Company Count
66.1% 367 33.9% 188
% Companies Company Count
All Companies
66.9% 426 33.1% 211
Global Practice Headquarters Country
Field Sales Management (Directors/Managers):
Yes No
84.7% 72 15.3% 13
78.8% 454 21.2% 122
79.6% 526 20.4% 135
Field Sales Individual Contributors:
Yes No
82.1% 69 17.9% 15
80.9% 467 19.1% 110
81.1% 536 18.9% 125
Sales Executives (VP and above):
Salary structures are for the following
Base salary only Total cash compensation only
43.1% 25 10.3% 6
24.5% 90 16.6% 61
27.1% 115 15.8% 67
Both 46.6% 27 58.9% 216 57.2% 243
Field Sales Management (Directors/Managers):
Base salary only Total cash compensation only
38.7% 24 11.3% 7
22.6% 93 18.7% 77
24.7% 117 17.7% 84
Both 50.0% 31 58.7% 242 57.6% 273
Field Sales Individual Contributors:
Base salary only Total cash compensation only
36.1% 22 11.5% 7
22.8% 98 18.6% 80
24.5% 120 18.4% 87
Both 52.5% 32 58.5% 251 59.7% 283
Section Three: Pay Practices (continued)
Results shown separately below for:- All Companies: Includes companies where the practice is global plus those where the practice varies by country (in which case answer pertains to practices in the headquarters country).- Global Practice: Limited to companies where the practice is global.- Headquarters Country Practice: Limited to the practice in the headquarters country for companies where the practice varies by country.

10
Proprietary and Confidential
Radford Global Sales Survey - May 2021
© 2021 Aon plc C -
Salary Structures
Sales Executives (VP and above):
Companies with formal salary structures for sales personnel
% Companies Company Count
Yes No
Companies Headquartered in Australia% Companies Company Count
85.7% 6 14.3% 1
% Companies Company Count
All Companies
77.8% 7 22.2% 2
Global Practice Australia
Field Sales Management (Directors/Managers):
Yes No
100.0% 7 0.0% 0
100.0% 9 0.0% 0
Field Sales Individual Contributors:
Yes No
100.0% 7 0.0% 0
100.0% 9 0.0% 0
Sales Executives (VP and above):
Salary structures are for the following
Base salary only Total cash compensation only
16.7% 1 0.0% 0
28.6% 2 0.0% 0
Both 83.3% 5 71.4% 5
Field Sales Management (Directors/Managers):
Base salary only Total cash compensation only
16.7% 1 0.0% 0
28.6% 2 0.0% 0
Both 83.3% 5 71.4% 5
Field Sales Individual Contributors:
Base salary only Total cash compensation only
16.7% 1 0.0% 0
28.6% 2 0.0% 0
Both 83.3% 5 71.4% 5
Section Three: Pay Practices (continued)
Results shown separately below for:- All Companies: Includes companies where the practice is global plus those where the practice varies by country (in which case answer pertains to practices in Australia).- Global Practice: Limited to companies where the practice is global.- Headquarters Country Practice: Limited to the practice in Australia for companies where the practice varies by country.
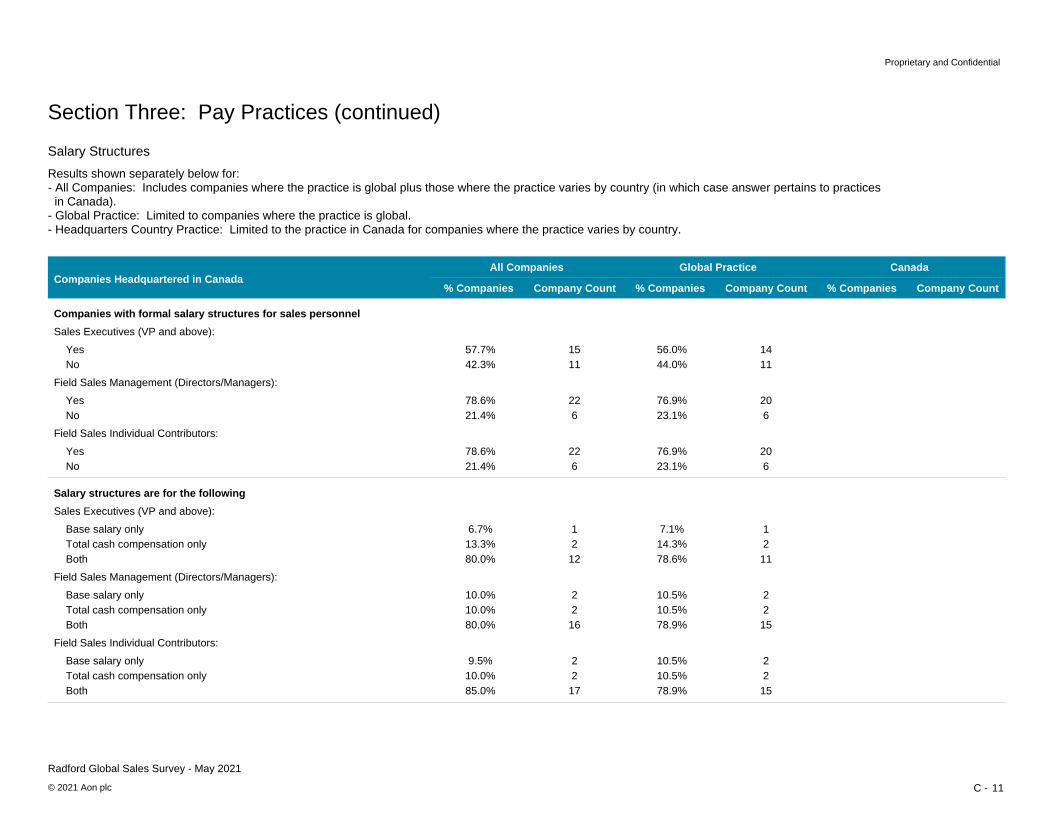
11
Proprietary and Confidential
Radford Global Sales Survey - May 2021
© 2021 Aon plc C -
Salary Structures
Sales Executives (VP and above):
Companies with formal salary structures for sales personnel
% Companies Company Count
Yes No
Companies Headquartered in Canada% Companies Company Count
56.0% 14 44.0% 11
% Companies Company Count
All Companies
57.7% 15 42.3% 11
Global Practice Canada
Field Sales Management (Directors/Managers):
Yes No
76.9% 20 23.1% 6
78.6% 22 21.4% 6
Field Sales Individual Contributors:
Yes No
76.9% 20 23.1% 6
78.6% 22 21.4% 6
Sales Executives (VP and above):
Salary structures are for the following
Base salary only Total cash compensation only
7.1% 1 14.3% 2
6.7% 1 13.3% 2
Both 78.6% 11 80.0% 12
Field Sales Management (Directors/Managers):
Base salary only Total cash compensation only
10.5% 2 10.5% 2
10.0% 2 10.0% 2
Both 78.9% 15 80.0% 16
Field Sales Individual Contributors:
Base salary only Total cash compensation only
10.5% 2 10.5% 2
9.5% 2 10.0% 2
Both 78.9% 15 85.0% 17
Section Three: Pay Practices (continued)
Results shown separately below for:- All Companies: Includes companies where the practice is global plus those where the practice varies by country (in which case answer pertains to practices in Canada).- Global Practice: Limited to companies where the practice is global.- Headquarters Country Practice: Limited to the practice in Canada for companies where the practice varies by country.
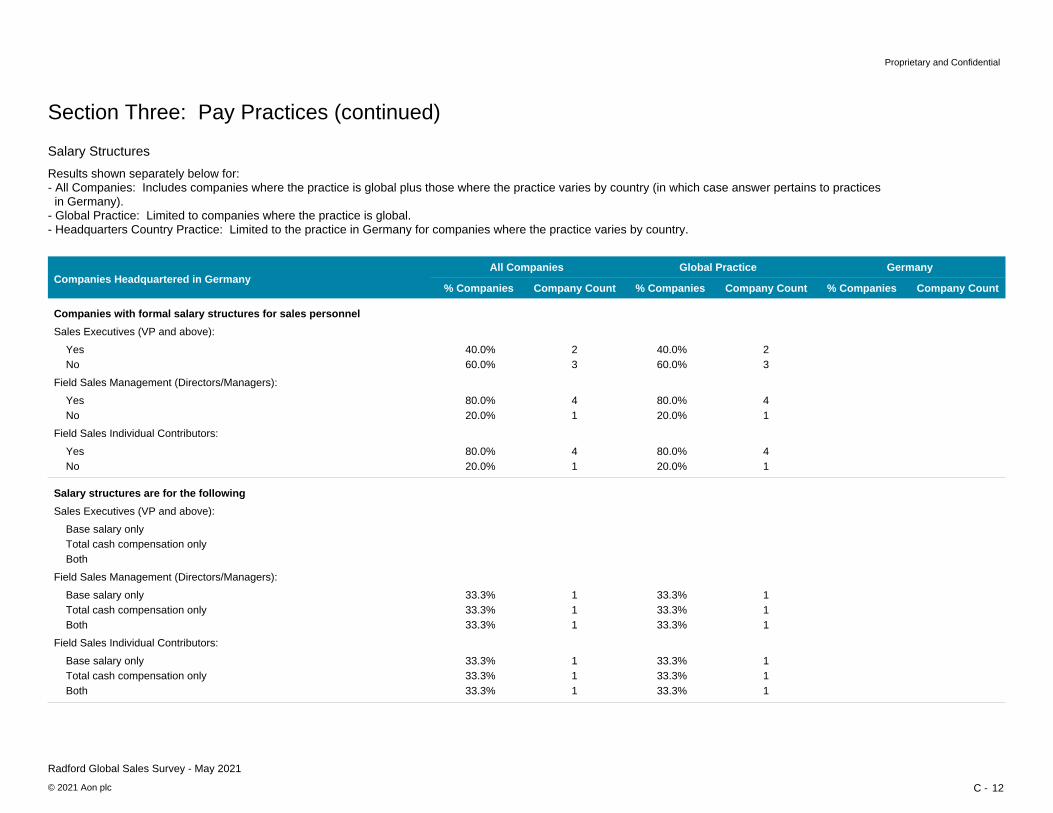
12
Proprietary and Confidential
Radford Global Sales Survey - May 2021
© 2021 Aon plc C -
Salary Structures
Sales Executives (VP and above):
Companies with formal salary structures for sales personnel
% Companies Company Count
Yes No
Companies Headquartered in Germany% Companies Company Count
40.0% 2 60.0% 3
% Companies Company Count
All Companies
40.0% 2 60.0% 3
Global Practice Germany
Field Sales Management (Directors/Managers):
Yes No
80.0% 4 20.0% 1
80.0% 4 20.0% 1
Field Sales Individual Contributors:
Yes No
80.0% 4 20.0% 1
80.0% 4 20.0% 1
Sales Executives (VP and above):
Salary structures are for the following
Base salary only Total cash compensation onlyBoth
Field Sales Management (Directors/Managers):
Base salary only Total cash compensation only
33.3% 1 33.3% 1
33.3% 1 33.3% 1
Both 33.3% 1 33.3% 1
Field Sales Individual Contributors:
Base salary only Total cash compensation only
33.3% 1 33.3% 1
33.3% 1 33.3% 1
Both 33.3% 1 33.3% 1
Section Three: Pay Practices (continued)
Results shown separately below for:- All Companies: Includes companies where the practice is global plus those where the practice varies by country (in which case answer pertains to practices in Germany).- Global Practice: Limited to companies where the practice is global.- Headquarters Country Practice: Limited to the practice in Germany for companies where the practice varies by country.

13
Proprietary and Confidential
Radford Global Sales Survey - May 2021
© 2021 Aon plc C -
Salary Structures
Sales Executives (VP and above):
Companies with formal salary structures for sales personnel
% Companies Company Count
Yes No
Companies Headquartered in Netherlands% Companies Company Count
75.0% 3 25.0% 1
% Companies Company Count
All Companies
60.0% 3 40.0% 2
Global Practice Netherlands
Field Sales Management (Directors/Managers):
Yes No
75.0% 3 25.0% 1
80.0% 4 20.0% 1
Field Sales Individual Contributors:
Yes No
75.0% 3 25.0% 1
80.0% 4 20.0% 1
Sales Executives (VP and above):
Salary structures are for the following
Base salary only Total cash compensation only
66.7% 2 0.0% 0
66.7% 2 0.0% 0
Both 33.3% 1 33.3% 1
Field Sales Management (Directors/Managers):
Base salary only Total cash compensation only
66.7% 2 0.0% 0
66.7% 2 0.0% 0
Both 33.3% 1 33.3% 1
Field Sales Individual Contributors:
Base salary only Total cash compensation only
66.7% 2 0.0% 0
66.7% 2 0.0% 0
Both 33.3% 1 33.3% 1
Section Three: Pay Practices (continued)
Results shown separately below for:- All Companies: Includes companies where the practice is global plus those where the practice varies by country (in which case answer pertains to practices in Netherlands).- Global Practice: Limited to companies where the practice is global.- Headquarters Country Practice: Limited to the practice in Netherlands for companies where the practice varies by country.
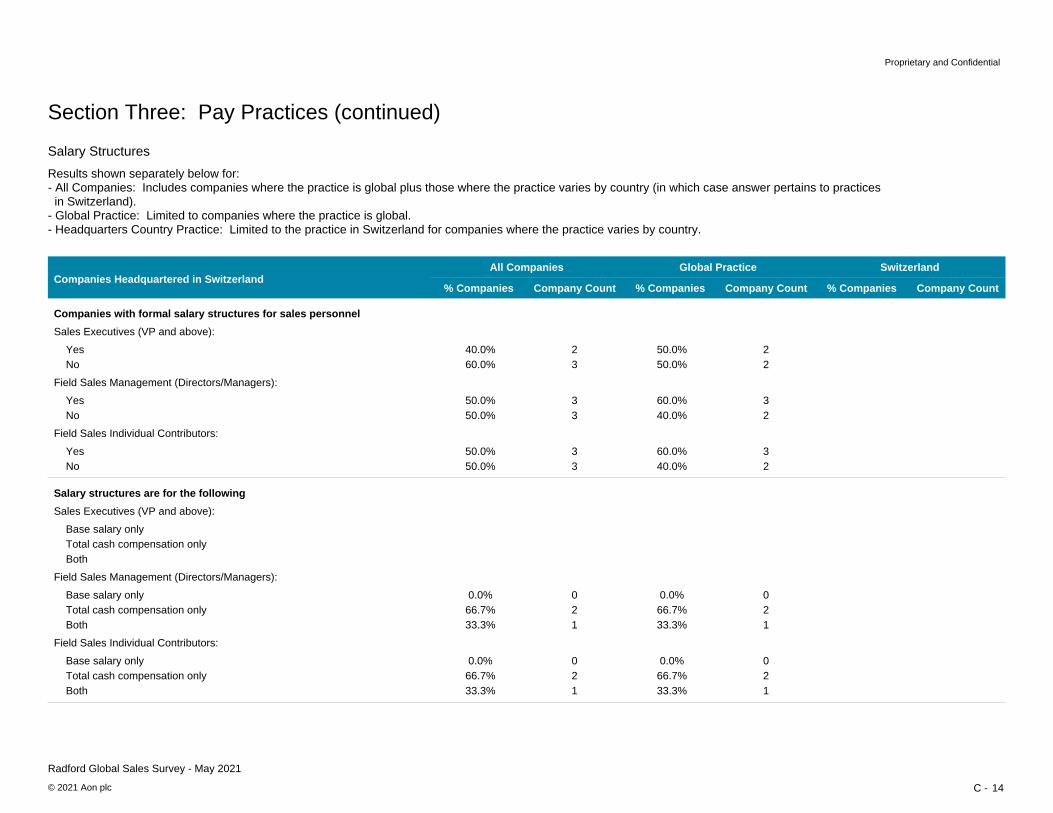
14
Proprietary and Confidential
Radford Global Sales Survey - May 2021
© 2021 Aon plc C -
Salary Structures
Sales Executives (VP and above):
Companies with formal salary structures for sales personnel
% Companies Company Count
Yes No
Companies Headquartered in Switzerland% Companies Company Count
50.0% 2 50.0% 2
% Companies Company Count
All Companies
40.0% 2 60.0% 3
Global Practice Switzerland
Field Sales Management (Directors/Managers):
Yes No
60.0% 3 40.0% 2
50.0% 3 50.0% 3
Field Sales Individual Contributors:
Yes No
60.0% 3 40.0% 2
50.0% 3 50.0% 3
Sales Executives (VP and above):
Salary structures are for the following
Base salary only Total cash compensation onlyBoth
Field Sales Management (Directors/Managers):
Base salary only Total cash compensation only
0.0% 0 66.7% 2
0.0% 0 66.7% 2
Both 33.3% 1 33.3% 1
Field Sales Individual Contributors:
Base salary only Total cash compensation only
0.0% 0 66.7% 2
0.0% 0 66.7% 2
Both 33.3% 1 33.3% 1
Section Three: Pay Practices (continued)
Results shown separately below for:- All Companies: Includes companies where the practice is global plus those where the practice varies by country (in which case answer pertains to practices in Switzerland).- Global Practice: Limited to companies where the practice is global.- Headquarters Country Practice: Limited to the practice in Switzerland for companies where the practice varies by country.

15
Proprietary and Confidential
Radford Global Sales Survey - May 2021
© 2021 Aon plc C -
Salary Structures
Sales Executives (VP and above):
Companies with formal salary structures for sales personnel
% Companies Company Count
Yes No
100.0% 6 0.0% 0
Companies Headquartered in United Kingdom% Companies Company Count
60.9% 14 39.1% 9
% Companies Company Count
All Companies
69.0% 20 31.0% 9
Global Practice United Kingdom
Field Sales Management (Directors/Managers):
Yes No
100.0% 6 0.0% 0
65.2% 15 34.8% 8
72.4% 21 27.6% 8
Field Sales Individual Contributors:
Yes No
100.0% 6 0.0% 0
69.6% 16 30.4% 7
75.9% 22 24.1% 7
Sales Executives (VP and above):
Salary structures are for the following
Base salary only Total cash compensation only
50.0% 3 16.7% 1
28.6% 4 7.1% 1
35.0% 7 10.0% 2
Both 33.3% 2 64.3% 9 55.0% 11
Field Sales Management (Directors/Managers):
Base salary only Total cash compensation only
50.0% 3 16.7% 1
28.6% 4 7.1% 1
35.0% 7 10.0% 2
Both 33.3% 2 64.3% 9 55.0% 11
Field Sales Individual Contributors:
Base salary only Total cash compensation only
50.0% 3 16.7% 1
33.3% 5 6.7% 1
38.1% 8 10.0% 2
Both 33.3% 2 60.0% 9 55.0% 11
Section Three: Pay Practices (continued)
Results shown separately below for:- All Companies: Includes companies where the practice is global plus those where the practice varies by country (in which case answer pertains to practices in United Kingdom).- Global Practice: Limited to companies where the practice is global.- Headquarters Country Practice: Limited to the practice in United Kingdom for companies where the practice varies by country.

16
Proprietary and Confidential
Radford Global Sales Survey - May 2021
© 2021 Aon plc C -
Salary Structures
Sales Executives (VP and above):
Companies with formal salary structures for sales personnel
% Companies Company Count
Yes No
70.6% 48 29.4% 20
Companies Headquartered in United States% Companies Company Count
66.8% 314 33.2% 156
% Companies Company Count
All Companies
67.3% 362 32.7% 176
Global Practice United States
Field Sales Management (Directors/Managers):
Yes No
82.9% 58 17.1% 12
79.5% 387 20.5% 100
79.9% 445 20.1% 112
Field Sales Individual Contributors:
Yes No
79.7% 55 20.3% 14
81.6% 398 18.4% 90
81.3% 453 18.7% 104
Sales Executives (VP and above):
Salary structures are for the following
Base salary only Total cash compensation only
40.4% 19 8.5% 4
24.8% 78 17.5% 55
26.9% 97 16.3% 59
Both 51.1% 24 57.6% 181 56.8% 205
Field Sales Management (Directors/Managers):
Base salary only Total cash compensation only
33.3% 17 11.8% 6
23.0% 81 19.3% 68
24.3% 98 18.4% 74
Both 54.9% 28 57.7% 203 57.3% 231
Field Sales Individual Contributors:
Base salary only Total cash compensation only
30.6% 15 12.2% 6
23.0% 84 19.5% 71
23.9% 99 19.1% 77
Both 57.1% 28 57.5% 210 59.1% 238
Section Three: Pay Practices (continued)
Results shown separately below for:- All Companies: Includes companies where the practice is global plus those where the practice varies by country (in which case answer pertains to practices in United States).- Global Practice: Limited to companies where the practice is global.- Headquarters Country Practice: Limited to the practice in United States for companies where the practice varies by country.
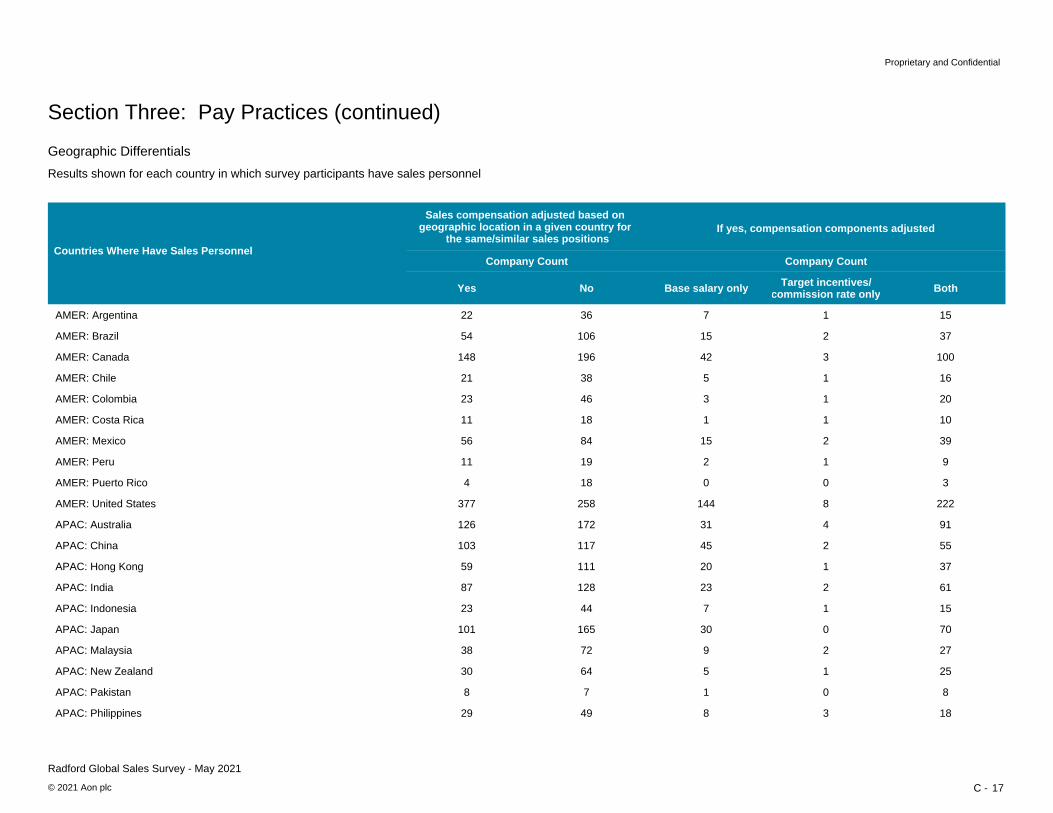
17
Proprietary and Confidential
Radford Global Sales Survey - May 2021
© 2021 Aon plc C -
Geographic Differentials
Sales compensation adjusted based on geographic location in a given country for
the same/similar sales positions
Company CountCountries Where Have Sales Personnel
AMER: Argentina
AMER: Brazil
AMER: Canada
AMER: Chile
AMER: Colombia
AMER: Costa Rica
AMER: Mexico
AMER: Peru
AMER: Puerto Rico
AMER: United States
APAC: Australia
APAC: China
APAC: Hong Kong
APAC: India
APAC: Indonesia
APAC: Japan
APAC: Malaysia
APAC: New Zealand
APAC: Pakistan
APAC: Philippines
If yes, compensation components adjusted
Company Count
Target incentives/commission rate onlyBase salary only BothYes No
22
54
148
21
23
11
56
11
4
377
126
103
59
87
23
101
38
30
8
29
36
106
196
38
46
18
84
19
18
258
172
117
111
128
44
165
72
64
7
49
7
15
42
5
3
1
15
2
0
144
31
45
20
23
7
30
9
5
1
8
1
2
3
1
1
1
2
1
0
8
4
2
1
2
1
0
2
1
0
3
15
37
100
16
20
10
39
9
3
222
91
55
37
61
15
70
27
25
8
18
Section Three: Pay Practices (continued)
Results shown for each country in which survey participants have sales personnel

18
Proprietary and Confidential
Radford Global Sales Survey - May 2021
© 2021 Aon plc C -
Geographic Differentials
Sales compensation adjusted based on geographic location in a given country for
the same/similar sales positions
Company CountCountries Where Have Sales Personnel
APAC: Singapore
APAC: South Korea
APAC: Taiwan
APAC: Thailand
APAC: Vietnam
EUR: Austria
EUR: Belgium
EUR: Bulgaria
EUR: Czech Republic
EUR: Denmark
EUR: Estonia
EUR: Finland
EUR: France
EUR: Germany
EUR: Greece
EUR: Hungary
EUR: Ireland
EUR: Italy
EUR: Luxembourg
EUR: Netherlands
If yes, compensation components adjusted
Company Count
Target incentives/commission rate onlyBase salary only BothYes No
105
72
51
26
16
36
46
9
28
52
4
44
117
142
13
11
47
77
7
97
172
117
101
59
30
81
106
12
49
84
6
71
182
206
18
29
104
130
11
162
28
29
21
4
4
7
10
2
8
11
0
9
29
40
2
3
11
20
0
22
3
1
1
1
1
2
2
0
1
1
0
3
4
2
1
1
1
2
0
4
73
41
28
20
12
27
34
8
19
40
4
31
84
99
11
7
36
53
8
70
Section Three: Pay Practices (continued)
Results shown for each country in which survey participants have sales personnel

19
Proprietary and Confidential
Radford Global Sales Survey - May 2021
© 2021 Aon plc C -
Geographic Differentials
Sales compensation adjusted based on geographic location in a given country for
the same/similar sales positions
Company CountCountries Where Have Sales Personnel
EUR: Norway
EUR: Poland
EUR: Portugal
EUR: Romania
EUR: Russia
EUR: Slovakia
EUR: Spain
EUR: Sweden
EUR: Switzerland
EUR: Turkey
EUR: Ukraine
EUR: United Kingdom
MEA: Algeria
MEA: Bahrain
MEA: Egypt
MEA: Israel
MEA: Kuwait
MEA: Morocco
MEA: Oman
MEA: Qatar
If yes, compensation components adjusted
Company Count
Target incentives/commission rate onlyBase salary only BothYes No
28
42
16
17
40
10
83
73
63
26
5
192
2
6
10
41
5
7
4
8
53
72
37
26
62
14
124
111
109
47
9
251
4
4
16
69
5
10
4
10
6
12
1
4
15
2
18
19
10
8
0
50
0
1
1
9
0
0
0
0
1
2
1
1
2
1
2
3
2
1
0
7
1
0
0
0
0
1
0
0
22
28
15
13
23
8
63
50
50
17
6
134
1
5
10
32
5
7
4
8
Section Three: Pay Practices (continued)
Results shown for each country in which survey participants have sales personnel

20
Proprietary and Confidential
Radford Global Sales Survey - May 2021
© 2021 Aon plc C -
Geographic Differentials
Sales compensation adjusted based on geographic location in a given country for
the same/similar sales positions
Company CountCountries Where Have Sales Personnel
MEA: Saudi Arabia
MEA: South Africa
MEA: UAE
If yes, compensation components adjusted
Company Count
Target incentives/commission rate onlyBase salary only BothYes No
19
34
58
36
57
94
2
5
14
1
2
3
16
27
41
Section Three: Pay Practices (continued)
Results shown for each country in which survey participants have sales personnel

21
Proprietary and Confidential
Radford Global Sales Survey - May 2021
© 2021 Aon plc C -
Recognition/Award Program
Companies with recognition or award program for sales positions
No
% Companies
43.4%
6.5%
288
43
Trips
Special clubs (e.g., President's club)
Plaques/trophies
Merchandise (e.g., jewelry, gift certificates, jackets, etc.)
Dinners
Sports/theatre/special event tickets
50.1% 332
47.3%
70.3%
156
232
51.8% 171
37.9% 125
Company Count
Yes, global program
Yes, but program varies by country
29.1%
10.6%
96
35
All Companies
Recognition/award program provides for the following non-cash incentives to
First-class air travel or travel clubs 5.2% 17
individual contributor sales personnel
Other 1.8% 6
Percentage of quota a sales representative needs to achieve to qualify
110.7%
Percentage of individual contributor field sales force that qualified for trips or clubs last fiscal year
For companies providing trips or clubs:
Section Three: Pay Practices (continued)
Company Count 330
Average % =
16.5%Average % =
171
157
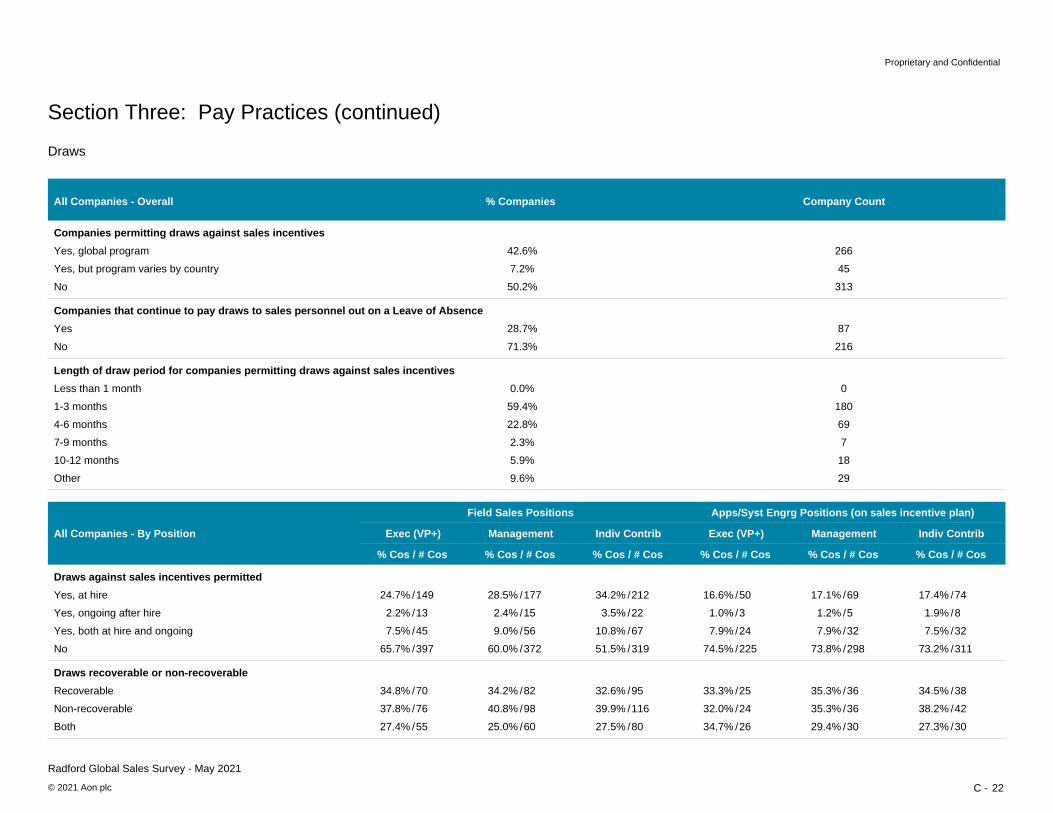
22
Proprietary and Confidential
Radford Global Sales Survey - May 2021
© 2021 Aon plc C -
Draws
Companies permitting draws against sales incentives
% Companies
42.6% 266
Company Count
Yes, global program
All Companies - Overall
Draws against sales incentives permitted
Field Sales Positions
24.7% 149
% Cos / # Cos % Cos / # Cos % Cos / # Cos % Cos / # Cos % Cos / # Cos % Cos / # Cos
All Companies - By Position
Yes, at hire
Yes, ongoing after hire
Yes, both at hire and ongoing
No
Draws recoverable or non-recoverable
Recoverable
Non-recoverable
Both
/
2.2% 13/
7.5% 45/
28.5% 177/
2.4% 15/
9.0% 56/
34.2% 212/
3.5% 22/
10.8% 67/
16.6% 50/
1.0% 3/
7.9% 24/
17.1% 69/
1.2% 5/
7.9% 32/
17.4% 74/
1.9% 8/
7.5% 32/
65.7% 397/ 60.0% 372/ 51.5% 319/ 74.5% 225/ 73.8% 298/ 73.2% 311/
34.8% 70/
37.8% 76/
27.4% 55/
34.2% 82/
40.8% 98/
25.0% 60/
32.6% 95/
39.9% 116/
27.5% 80/
33.3% 25/
32.0% 24/
34.7% 26/
35.3% 36/
35.3% 36/
29.4% 30/
34.5% 38/
38.2% 42/
27.3% 30/
Apps/Syst Engrg Positions (on sales incentive plan)
Exec (VP+) Management Indiv Contrib Exec (VP+) Management Indiv Contrib
Yes, but program varies by country 7.2%
50.2%
45
313No
Companies that continue to pay draws to sales personnel out on a Leave of Absence
Yes 28.7%
71.3%
87
216No
Section Three: Pay Practices (continued)
Length of draw period for companies permitting draws against sales incentives
Less than 1 month 0.0%
59.4%
0
1801-3 months
4-6 months 22.8%
2.3%
69
77-9 months
10-12 months 5.9%
9.6%
18
29Other
1
Proprietary and Confidential
Radford Global Sales Survey - May 2021
© 2021 Aon plc D -
Participant List
10X GENOMICS
8X8
A PLACE FOR MOM
A10 NETWORKS
ABSOLUTE SOFTWARE
ACACIA COMMUNICATIONS
ACCELA
ACCURAY
ACI WORLDWIDE
ACTIAN
ACUTUS MEDICAL
ADAPTIVE BIOTECHNOLOGIES
ADDEPAR
ADMINISTRATIVE SERVICES
ADOBE SYSTEMS
ADVANCED ENERGY INDUSTRIES
ADVANCED MICRO DEVICES
ADVANTEST AMERICA
AFFIRM
AFTERPAY TOUCH
AGILEBITS
AGORA LAB
AKAMAI TECHNOLOGIES
ALARM.COM
ALGOLIA
ALIGN TECHNOLOGY
ALKAMI TECHNOLOGY
ALLEGRO MICROSYSTEMS
ALLIED TELESIS
ALLSCRIPTS
ALTERYX
AMBARELLA
AMBRY GENETICS
AMDOCS
AMPLIENCE
AMPLITUDE
ANALOG DEVICES
ANAPLAN
ANIKA THERAPEUTICS
ANRITSU
APP ANNIE
APPDIRECT
APPEN BUTLER HILL PTY LTD
APPFOLIO
APPIAN
APPLE
APPLIED MATERIALS
APTEAN
APTTUS
ARCTIC WOLF NETWORKS
ARISTA NETWORKS
ARMOR
ARTICULATE GLOBAL
ASCEND LEARNING
ASM INTERNATIONAL
ASML
ASPEN TECHNOLOGY
AT&T
ATHENAHEALTH
ATLASSIAN INC
AUTODESK
AUTOMATTIC
AVAILITY
AVALARA
AVAST SOFTWARE S.R.O.
AVETTA
2
Proprietary and Confidential
Radford Global Sales Survey - May 2021
© 2021 Aon plc D -
Participant List
AVIAT NETWORKS
AVID TECHNOLOGY
AVIDXCHANGE
AXCELIS TECHNOLOGIES
AXWAY
BACKBLAZE
BAI COMMUNICATIONS
BECTON DICKINSON
BEHAVOX
BELKIN INTERNATIONAL
BELL CANADA
BIGCOMMERCE
BILL.COM
BIO-RAD LABORATORIES
BIO-TECHNE
BIOCARE MEDICAL
BIOFIRE DIAGNOSTICS
BLACKBAUD
BLACKBERRY LIMITED
BLACKBOARD
BLACKHAWK NETWORK
BLACKLINE
BLEND LABS
BLOOMREACH
BLUE JEANS NETWORK
BMC SOFTWARE
BOX
BRANCH
BRAVURA SOLUTIONS
BROADCOM
BROOKS AUTOMATION - SEMICONDUCTOR AUTOMATION
BRUKER
C3.AI
CADENCE DESIGN SYSTEMS
CALIX
CALYPSO TECHNOLOGY
CANDELA
CANON CANADA
CANON MEDICAL SYSTEMS USA INC
CANON USA
CAPSULETECH
CARBON
CARDINAL HEALTH
CARDIVA MEDICAL
CARDLYTICS
CARTA
CASTLIGHT HEALTH
CELESTICA INTERNATIONAL LP
CENTURYLINK
CERENCE
CERIDIAN HCM
CERNER
CHANGE HEALTHCARE
CHANNELADVISOR
CHARTBOOST
CHECK POINT SOFTWARE TECHNOLOGIES
CHECKR
CIENA
CIKLUM
CIRRUS LOGIC
CISCO SYSTEMS
CITRIX SYSTEMS
CLASSY
CLEVER DEVICES
CLOUDCALL
CLOUDERA
3
Proprietary and Confidential
Radford Global Sales Survey - May 2021
© 2021 Aon plc D -
Participant List
CLOUDFLARE
CLOUDINARY
CLOUDREACH EUROPE LTD
COLLECTIVE HEALTH
COLLIBRA
COMET TECHNOLOGIES
COMMSCOPE
CONFLUENT
COOPERSURGICAL
COOPERVISION
COPPERLEAF TECHNOLOGIES
CORELOGIC
COSTAR GROUP
COUCHBASE
COUPA SOFTWARE
COURSERA
CREE
CRITEO
CROWDSTRIKE
CS DISCO
CSG SYSTEMS
CURRICULUM ASSOCIATES
CURVATURE
CYBERARK
D-WAVE SYSTEMS
DASSAULT SYSTEMES
DAT SOLUTIONS
DATABRICKS
DATAIKU
DATAMINR
DATASTAX
DEALERSOCKET
DEEM
DELTA ELECTRONICS AMERICAS
DELTEK
DEPUTY
DEXCOM
DHI GROUP
DIALOG SEMICONDUCTOR
DIEBOLD NIXDORF INC.
DIGI INTERNATIONAL
DIGICERT
DIGITAL GUARDIAN
DILIGENT
DIODES
DISPATCH IT
DNANEXUS
DOCEBO INC
DOCUSIGN
DOLBY LABORATORIES
DOMAINTOOLS
DOMINO DATA LAB
DOTDASH
DRAEGER MEDICAL
DRIFT
DRUVA
DUCK CREEK TECHNOLOGIES
DUDA
DXC TECHNOLOGY
DYSON LTD
EARLY WARNING SERVICES LLC
ECOBEE
EDWARDS LIFESCIENCES
EGAIN
EGGPLANT
EGNYTE

4
Proprietary and Confidential
Radford Global Sales Survey - May 2021
© 2021 Aon plc D -
Participant List
ELASTICSEARCH
ELEMENT AI
ENDACE MEASUREMENT SYSTEMS
ENDURANCE INTERNATIONAL GROUP
ENTRUST DATACARD
ENVESTNET
ENVOY
EPICOR SOFTWARE
EPSON AMERICA
EQUINIX
ERICSSON NORTH AMERICA
ESET NORTH AMERICA
ESRI
ESSILOR OF AMERICA
EVENTBRITE
EVERBRIDGE
EVO PAYMENTS
EXABEAM
EXACT SCIENCES
EXPANSE
EXPERIAN NORTH AMERICA
EXTREME NETWORKS
F5 NETWORKS
FIDELITY NATIONAL INFORMATION SERVICES
FIIX
FINANCIALFORCE.COM
FITBIT
FLIPP CORPORATION
FORCEPOINT
FORGEROCK
FORMAGRID DBA AIRTABLE
FORMFACTOR
FOUNDATION MEDICINE
FRAME.IO
FREEAGENT
FRESHBOOKS
FUJITSU EMEA
FUJITSU NETWORK COMMUNICATIONS
FULLSCREEN
GATAN
GENESYS TELECOM LABS
GHOST MANAGEMENT GROUP, LLC DBA WEEDMAPS
GIGAMON
GITHUB
GITLAB INC
GLOBAL HEALTHCARE EXCHANGE
GOCARDLESS
GODADDY.COM
GONG
GOPRO
GRAMMARLY
GRAPHCORE
GREEN DOT
GUARDANT HEALTH
GUIDEWIRE SOFTWARE
GUILD EDUCATION
GUSTO
HARMAN CONNECTED SERVICES
HARMONIC
HASHICORP
HEALTH CATALYST
HEALTH SCHOLARS
HEAP
HERE
HEWLETT-PACKARD ENTERPRISE
HEXAGON PPM
5
Proprietary and Confidential
Radford Global Sales Survey - May 2021
© 2021 Aon plc D -
Participant List
HIGHER LOGIC
HIGHSPOT
HILL-ROM HOLDINGS
HITACHI VANTARA
HOLLISTER
HOOTSUITE
HOUZZ
HP INC
HUBSPOT
ICERTIS
ICIMS
IFS NORTH AMERICA
IGEL TECHNOLOGY GMBH
II-VI INCORPORATED
IMAGINATION TECHNOLOGIES LTD
IMPERVA
IMPINJ
INDEED.COM
INFINEON TECHNOLOGIES AG
INFINERA
INFOBLOX
INFORMATICA
INKLING SYSTEMS
INPHI
INSPIRE MEDICAL SYSTEMS INC.
INSULET
INTAPP
INTEL
INTELEPEER
INTERACTIONS
INTERCOM
INTERCONTINENTAL EXCHANGE
INTERMEDIA.NET
INTERSECT ENT
INTERSYSTEMS
INTERVIEWSTREET INCORPORATION DBA HACKERRANK
INTUIT
INTUITIVE SURGICAL
INVISIONAPP
INVOCA
IPC SYSTEMS
IRHYTHM TECHNOLOGIES
IRIDEX
IROBOT
IVALUA
JAMA SOFTWARE
JAMF
JELLYVISION
JENZABAR
JOBVITE
JOHNSON & JOHNSON
JUNIPER NETWORKS
K2
KARL STORZ ENDOSCOPY-AMERICA
KASPERSKY LAB ZAO
KEEPTRUCKIN
KERRIDGE COMMERCIAL SYSTEMS
KEYSIGHT TECHNOLOGIES
KHOROS LLC
KINAXIS
KIOXIA AMERICA INC.
KIRA
KLA CORPORATION
KNOWLES
KOKUSAI ELECTRIC CORP
KONICA MINOLTA BUSINESS SOLUTIONS, U.S.A., INC
6
Proprietary and Confidential
Radford Global Sales Survey - May 2021
© 2021 Aon plc D -
Participant List
KYRIBA
LACEWORK
LAIRD CONNECTIVITY
LAIRD PERFORMANCE MATERIALS
LAM RESEARCH
LATTICE SEMICONDUCTOR
LENOVO
LEVER
LIFENET HEALTH
LIMINEX DBA GO GUARDIAN
LITTELFUSE
LIVEPERSON
LIVEVOX
LOB.COM
LOGITECH
LOGMEIN
LOOKOUT
LUCID HOLDINGS
LUCID SOFTWARE
LUCIDWORKS
LUMENTUM
LUTRON ELECTRONICS
LYFT
M1 LIMITED
MAGNITE
MALWAREBYTES
MANHATTAN ASSOCIATES
MAPBOX
MARKFORGED
MARQETA
MARVELL SEMICONDUCTOR
MASERGY COMMUNICATIONS
MASIMO
MATHWORKS
MATTSON TECHNOLOGY
MAXIM INTEGRATED PRODUCTS
MAXLINEAR
MAXON COMPUTER GMBH
MCAFEE
MEDALLIA
MEDIAMATH
MEDIATEK
MERCURY SYSTEMS
MESSAGEBIRD
METAPACK
METRICSTREAM
MICRO FOCUS SOFTWARE
MICROCHIP TECHNOLOGY
MICRON TECHNOLOGY
MICROSOFT
MICROVENTION
MIMECAST
MITCHELL INTERNATIONAL
MITEK USA INC.
MITEL NETWORKS CORPORATION
MIXPANEL
MKS INSTRUMENTS
MOBILEIRON
MOLEX
MONSTER WORLDWIDE
MOODYS
MOTOROLA SOLUTIONS
NAGRA USA, LLC
NANOSTRING TECHNOLOGIES
NATERA
7
Proprietary and Confidential
Radford Global Sales Survey - May 2021
© 2021 Aon plc D -
Participant List
NAVEX GLOBAL
NCR
NEC CORP OF AMERICA
NEOTRACT
NETAPP
NETCRACKER TECHNOLOGY CORP
NETGEAR
NETSCOUT SYSTEMS
NEUROPACE
NEW RELIC
NEXPERIA
NEXTDOOR
NEXTGEN HEALTHCARE
NEXTHINK SA
NOKIA TECHNOLOGIES OY
NOVOCURE
NTT GLOBAL DATA CENTERS AMERICAS
NUANCE COMMUNICATIONS
NUTANIX
NUVASIVE
NVIDIA
NXP SEMICONDUCTORS
OANDA
OFS FITEL
OKTA
OLYMPUS CORPORATION OF THE AMERICAS
OMADA HEALTH
OMNICELL
OMNIVISION TECHNOLOGIES
ON SEMICONDUCTOR
ONESPAN
ONESTREAM SOFTWARE
ONTO INNOVATION INC.
OPEN SYSTEMS AG
OPEN TEXT
OPTIMIZELY
ORACLE
ORIGAMI RISK
OSISOFT
OUTSYSTEMS
PACIFIC BIOSCIENCES
PAGERDUTY
PALO ALTO NETWORKS
PANASONIC CORPORATION NORTH AMERICA
PANTHEON
PAR TECHNOLOGY CORP
PATREON
PATSNAP PTE LTD
PAX LABS
PAYCOR
PAYLOCITY
PAYPAL
PEGASYSTEMS, INC.
PELOTON INTERACTIVE
PERMUTIVE
PFU AMERICA
PHILIPS HEALTHCARE
PHOCAS SOFTWARE
PHREESIA
PING IDENTITY
PLEO TECHNOLOGIES A/S
PLEX SYSTEMS
PLURALSIGHT
PODIUM
POLY
8
Proprietary and Confidential
Radford Global Sales Survey - May 2021
© 2021 Aon plc D -
Participant List
POWER INTEGRATIONS
PROCEPT BIOROBOTICS
PROCORE
PROGENITY
PROGRESS
PRONTOFORMS
PROOFPOINT
PROS
PSEMI CORPORATION
PUBMATIC
PURE STORAGE
Q2
QAD
QLIK TECHNOLOGIES
QORVO US INC
QUADIENT
QUALCOMM
QUALYS
QUANTUM
QUEST SOFTWARE
QUIDEL
QUMULO
RACKSPACE US INC
RAPID7
REALPAGE
RECEIPT BANK
RECSOLU DBA YELLO
RED HAT
REFINITIV
RENAISSANCE LEARNING
RESIDEO
RESMED
RIBBON COMMUNICATIONS
RICOH USA
RINGCENTRAL
RIPPLE LABS
RISK MANAGEMENT SOLUTIONS
RIVERBED TECHNOLOGY
ROCHE DIAGNOSTICS
ROCHESTER ELECTRONICS
ROCKLEY PHOTONICS
ROHM SEMICONDUCTOR USA
ROKU
ROSETTA STONE
SABRE CORPORATION
SAGE GROUP
SAILPOINT TECHNOLOGIES
SALESFORCE.COM
SALESLOFT
SALSIFY
SAMSARA NETWORKS
SAMSUNG ELECTRONICS CANADA
SAMSUNG SEMICONDUCTOR INC
SCANDIT AG
SEAGATE TECHNOLOGY
SEEK LIMITED
SEKISUI DIAGNOSTICS GROUP
SEMTECH
SENSATA TECHNOLOGIES
SENSEONICS
SENTINELONE
SERVICEMAX
SERVICENOW
SERVICETITAN
SHARETHROUGH

9
Proprietary and Confidential
Radford Global Sales Survey - May 2021
© 2021 Aon plc D -
Participant List
SHARP ELECTRONICS CORPORATION
SHENTEL MANAGEMENT COMPANY
SHOPIFY
SHURE
SI-BONE
SIEMENS AG
SIERRA WIRELESS
SILICON LABORATORIES
SILK ROAD MEDICAL
SIMILAR WEB
SINGAPORE TELECOMMUNICATIONS
SIRTEX MEDICAL HOLDINGS
SKYWORKS SOLUTIONS
SLACK TECHNOLOGIES
SMARTSHEET
SMITHS GROUP PLC
SNAP
SNOW SOFTWARE
SNOWFLAKE COMPUTING
SNYK
SOFTWARE AG
SOLARWINDS
SOLID GEAR
SOMALOGIC
SONENDO
SONICWALL
SONOS
SONOVA US CORPORATE SERVICES LLC
SONY CORPORATION OF AMERICA
SOPHOS
SPARTA SYSTEMS
SPIRENT COMMUNICATIONS
SPLUNK
SPOK
SPORTRADAR AG
SPREEDLY
SPRINKLR
SPS COMMERCE
SQUARE
STAAR SURGICAL COMPANY
STARTECH.COM
STMICROELECTRONICS INTERNATIONAL NV
STRATUS TECHNOLOGIES
SUGARCRM
SURMODICS
SURVEY MONKEY
SYNAPTICS
SYNIVERSE TECHNOLOGIES
SYNOPSYS
T-MOBILE
TAIWAN SEMICONDUCTOR MANUFACTURING
TALEND
TANDEM DIABETES CARE
TATA COMMUNICATIONS AMERICA INC
TDK INVENSENSE
TE CONNECTIVITY
TELESIGN
TELUS
TENABLE
TERADATA
TERADICI
TEXAS INSTRUMENTS
THE KNOT WORLDWIDE
THE TRADE DESK
THEMIS SOLUTIONS INC DBA CLIO
THOUGHTSPOT

10
Proprietary and Confidential
Radford Global Sales Survey - May 2021
© 2021 Aon plc D -
Participant List
TIBCO SOFTWARE INC
TIVO CORPORATION
TOAST
TOKYO ELECTRON EUROPE LIMITED
TOKYO ELECTRON US HOLDINGS
TOP VICTORY ELECTRONICS - TAIWAN LTD
TOPCON POSITIONING SYSTEMS
TOSHIBA GLOBAL COMMERCE SOLUTIONS
TRACELINK
TRADESHIFT
TRADIFYHQ
TRANSACTION NETWORK SERVICES
TRANSUNION LLC
TRELLISWARE TECHNOLOGIES
TREND MICRO
TRIMBLE
TRINTECH
TRIPWIRE
TRUECAR
TRUELAYER
TSYS
TWILIO
TYK TECHNOLOGIES
TYLER TECHNOLOGIES
UBER TECHNOLOGIES
UIPATH
UMC
UNITY TECHNOLOGIES
US-504`1
USERTESTING
VEECO INSTRUMENTS
VERACYTE
VERIZON BUSINESS
VERIZON COMMUNICATIONS
VERTAFORE
VERTEX
VIASAT
VIAVI SOLUTIONS
VIEWPOINT
VISIER
VMWARE
VOCERA COMMUNICATIONS
VONAGE HOLDINGS CORP
VUNGLE
WANDISCO
WATERS
WESTERN DIGITAL
WEX
WIDEORBIT LLC
WINDSTREAM COMMUNICATIONS
WISETECH GLOBAL
WIX.COM
WORKDAY
WORKIVA
WP ENGINE
WRIKE, INC.
XACTLY
XILINX
XPERI
YARDI SYSTEMS
YELP
YEXT
ZEBRA TECHNOLOGIES
ZERTO
ZIPWHIP
11
Proprietary and Confidential
Radford Global Sales Survey - May 2021
© 2021 Aon plc D -
Participant List
ZIX CORPORATION
ZOCDOC
ZOOMINFO
ZOVIO
ZUORA
[24]7.AI