radioactivity in foods grown on mined phosphate lands
TRANSCRIPT

Publication No. 05-028-088
RADIOACTIVITY IN FOODS GROWNON MINED PHOSPHATE LANDS
Florida Institute ofPhosphate Research
Prepared By
Post, Buckley, Schuh, & Jernigan, Inc.Under a Grant Sponsored by the
Florida Institute of Phosphate ResearchBartow, Florida
OCTOBER 1990

The Florida Institute of Phosphate Research was created in 1978 bythe Florida Legislature (Chapter 378.101, Florida Statutes) andempowered to conduct research supportive to the responsibledevelopment of the state's phosphate resources. The Institute hastargeted areas of research responsibility. These are: reclamationalternatives in mining and processing, including wetlandsreclamation, phosphogypsum storage areas and phosphatic claycontainment areas; methods for more efficient, economical andenvironmentally balanced phosphate recovery and processing;disposal and utilization of phosphatic clay; and environmentaleffects involving the health and welfare of the people, includingthose effects related to radiation and water consumption.
FIPR is located in Polk County, in the heart of the central Floridaphosphate district. The Institute seeks to serve as an informationcenter on phosphate-related topics and welcomes informationrequests made in person, by mail, or by telephone.
Research Staff
Executive DirectorRichard F. McFarlin
Research Directors
G. Michael Lloyd Jr.Gordon D. NifongSteven G. RichardsonHassan El-ShallRobert S. Akins
-Chemical Processing-Environmental Services-Reclamation-Beneficiation-Mining
Florida Institute of Phosphate Research1855 West Main StreetBartow, Florida 33830
(863) 534-7160

RADIOACTIVITY IN FOODS GROWN ON MINED PHOSPHATE LANDS
FINAL REPORT
Jerome J. Guidry, P.E., Principal InvestigatorCharles E. Roessler, Ph.D. - University of FloridaW. Emmett Bolch, Ph.D. - University of Florida
James T. McClave, Ph.D. - Info-Tech, Inc.Cindy C. Hewitt - Info-Tech, Inc.
Thomas E. Abel - Zellars-Williams, Inc.
POST, BUCKLEY, SCHUH & JERNIGAN, INC.6635 East Colonial DriveOrlando, Florida 32807
Prepared for
FLORIDA INSTITUTE OF PHOSPHATE RESEARCH1855 West Main StreetBartow, Florida 33830
Contract Manager: Gordon Nifong, Ph.D.
September 1990

DISCLAIMER
The contents of this report are reproduced herein as receivedfrom the contractor.
The opinions, findings and conclusions expressed herein are notnecessarily those of the Florida Institute of Phosphate Researchnor does mention of company names or products constitute endorse-ment by the Florida Institute of Phosphate Research.
ii

PERSPECTIVE
Gordon D. Nifong, Ph.D.
Florida Institute of Phosphate Research
It has long been known that elevated levels of uranium occurnaturally associated with the sedimentary phosphate depositsfound in central Florida. Mainly because of its low solubility,uranium is not generally considered to be a major environmentalhazard, but many of the members within the uranium decay seriesare more of a cause for concern. These would include radium-226,a radioactive element chemically similar to calcium; radon-222, agas that is chemically inert but radioactive; several "short-lived" daughter products of radon; and finally two longer-liveddecay products--lead-210 and polonium-210. All of the above arenaturally occurring radioactive materials that are ubiquitous inthe environment but tend to be elevated in phosphate-relatedmaterials. In general, lands containing waste clays or sand-phosphate "debris" tend to have the highest levels of radiation,followed by lands reclaimed generally with overburden and sand,next followed by mineralized unmined lands, and finally non-mineralized lands.
Since its inception, the Florida Institute of Phosphate Researchhas been interested in the environmental aspects of the phosphateindustry. It is believed that all phases of ore mining, mineralsprocessing, and land reclamation can be accomplished in anenvironmentally acceptable manner. Because of the array ofradionuclides found in phosphate ores, much of that concern forthe environment has been focused on the issue of radiation. Wellover a dozen projects have been conducted or sponsored thatdirectly address the topic of radiation, and numerous otherprojects have had radiological components as secondary issues.Strong interest exists not only in characterizing naturalradionuclides as to their nature,, extent, and magnitude, but alsoin determining their effects on the population that lives andworks in the phosphate region. The Institute has addressed bothconcerns.
Because inhalation of radon daughters likely accounts for half ormore of human exposure to natural radiation, considerable efforthas gone into this area. In 1987 the Institute completed astate-wide study of levels of indoor radon in Florida. Conductedby Geomet Technologies, the study confirmed that while radon wasrelated to the prevalence of phosphate in the ground, levels weregenerally lower than those found in most other parts of thecountry. Also, it was determined that radon was not a problemsolely on reclaimed lands; homes with elevated radon were foundfrom north Florida to southeast Florida. Other work at about thesame time, done by American Atcon Corporation, demonstrated thatwith little extra effort homes could be built so as to preventthe entry of most radon from the soil into the structure, even ifthe land were elevated in soil radium content.
iii

Assessing the quality of water has been a goal of severalInstitute-sponsored studies. In 1981 the Institute sponsored astudy by the state Department of Health and RehabilitativeServices to study radiochemical contamination in shallow drinkingwater wells in the phosphate region. Later this study wasexpanded to be state-wide in scope. Further water qualitystudies, done mainly at the University of South Florida and atFlorida State University, have looked in detail at theradiological components of groundwater. An important finding hasbeen that much radiation in many well waters in central Floridais due to polonium-210, a finding that helps explain thediscrepancy that exists in many waters of high alpha radiationlevels but low radium-226 levels.
In order to ensure that its radiation research program iscomprehensive, the Institute has devoted much attention to thehuman food chain. In 1986 a study was completed by Post,Buckley, Schuh & Jernigan entitled "Radioactivity in Foods Grownon Florida Phosphate Lands." Its purpose was to characterize andquantify levels of radionuclides in foods grown on these lands,and to project radiation doses to consumers of these foods.Results found were that radionuclide content of some foods,especially leafy vegetables, were higher if the crop had beengrown on reclaimed land versus control or non-mineralized land,but that total quantities of radionuclides were small even underworst case conditions. A typical individual eating foods grownon reclaimed lands would experience at most an increase of a fewpercent in his total yearly radiation dose from all environmentalsources combined, and also total increased intake ofradionuclides from these foods would still be only a few percentof the limits suggested by several scientific and regulatoryauthorities. One anomaly found in this earlier study was thatradioactivity in foods did not always correlate withradioactivity in the soils on which the foods were grown. Foodsgrown on clays produced by phosphate beneficiation had lowerlevels of radionuclides than did similar foods grown on "debris"lands, even though soil radionuclides were higher in clays thanin "debris." Part of the purpose of this current study was toinvestigate this discrepancy.
From a more general standpoint, however, as phosphate miningmoves south within central Florida, reclaimed mined land becomesincreasingly available. Agricultural production, either forforage or food production, undoubtedly will become a significantuse for reclaimed land. Invariably the question arises as to theradionuclide content of crops grown on such lands, not only infoods grown for direct human consumption, but even in beef whencattle have grazed on forage from these lands. Work is currentlyin progress by Bromwell and Carrier, Inc., investigatingvegetable production on sand/clay mixtures in the phosphateregion. An even larger study, entitled "Polk County Mined LandsAgricultural Demonstration Project," and conducted by aconsortium of interests under county direction, is nowinvestigating the potential for agriculture on reclaimed clay
iv

settling areas. The growing of vegetables, grains, forage, andeven ornamentals is under study in this multi-year project.Cattle are included as one component of this work. In both theselatter studies, while the prime goal is to determine thefeasibility of crop production on the restored land,environmental safety as to radiation is the major adjunct issue.
Another important consideration of the radiological safety ofagricultural products is related to the use of phosphogypsum asan agricultural amendment. Phosphogypsum is an excellent sourceof calcium and sulfur to the soil, but the material contains alevel of radium-226 some 20 to 30 times the value of most soils.Studies of this aspect of radionuclide uptake by crops have beendone at several universities, the most recent being a currentstudy underway in central Florida and conducted by the Universityof Florida. Early work has shown that radionuclide uptake byfoods grown on lands to which phosphogypsum has been added isminimal, well within established dietary tolerances.
A central theme that runs through all the studies mentioned aboveis an evaluation of human exposure to radiation dose ascontributed by some phase of the natural environment. As far asthat dose contributed by foods ingestion is concerned, it seemsnot to be very cost-effective to re-study radiation every timesome new crop is planted on some type of reclaimed land. Thiscurrent study by Post, Buckley, Schuh & Jernigan represents anattempt to delve more deeply into the mechanisms of radionuclideuptake by crops and use the findings to better assess thecontribution of foods to total radiation dose. It complementstheir earlier study of 1986 by adding significantly to the totaldatabase. It is now known that while radium content of soil isimportant in determining uptake by crops, the greatest variableis the nature of the crop itself. Moreover, a number of othersoil parameters affect uptake,capacity.
notably pH and cation exchangePerhaps even more important, this work further
confirms the belief that ingestion of foods grown on reclaimedlands contributes only a small fraction of total human radiationdose. It is only with the type of information contained in thisreport that the public can make an informed decision on theimpact of radionuclides in foods as compared to otherradiological impacts common to our society. This work is mostconsistent with the societal goal ofto "as low as reasonably achievable."
keeping radiation exposures

vii

viii

ACKNOWLEDGEMENTS
This study was conducted by a team of professional scientists from fourorganizations:
0 Post, Buckley, Schuh & Jernigan, Inc.0 Zellars-Williams Company0 Info-Tech, Inc.0 University of Florida Department of Environmental
Engineering Sciences
The author wishes to express his appreciation to the following persons whocontributed to the success of this study: Christopher Amstutz and CherylBledsoe for their analytical laboratory support; Kate Fontaine for herassistance in preparing this report; Tom Abel and Jim Moon for their assistancein the land characterization and field sampling tasks; Dr. Jim McClave and CindyHewitt for the statistical analysis tasks; Drs. Charles Roessler and EmmettBolch for the data evaluation and dose assessment tasks; Brian Birky for hisassistance in the development of the diet and dose models; and Dr. Gerald Kidderfor his assistance in the evaluation of the soil chemistry data. Theorganization and coordination of this study which involved several organizationsand numerous participants was made that much easier because of the commitmentand professionalism of these project participants. Their assistance isthoroughly appreciated.
Jerome J. Guidry, P.E.
ix

xi

xii

xiii

xiv

LIST OF FIGURES
Title Page
12
26
Figure
1
2
3
Food Sampling Locations
Land Type Comparisons, Radium-226 in Soil (pCi/g)
Land/Food Type Comparisons, Radium-226 inFoods (pCi/kg) 29
Specific Food Comparisons, Radium-226 inFoods (pCi/kg), Food Type = Caul/Broc
431
32Specific Food Comparisons, Radium-226 in Foods,(pCi/kg), Food Type = Leafy
5
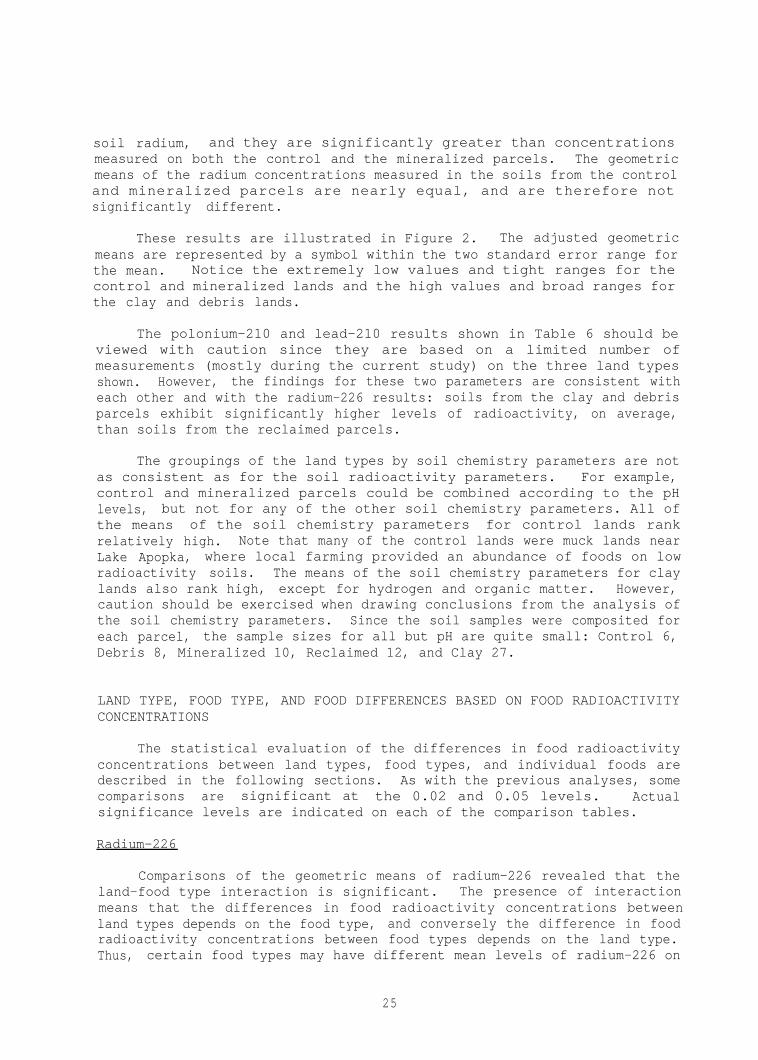
6 Specific Food Comparisons, Radium-226 in Foods,(pCi/kg), Food Type = Seeds/Grains 33
7 Specific Food Comparisons, Radium-226 in Foods,(pCi/kg), Food Type = Roots/Tubers 34
8 Specific Food Comparisons, Radium-226 in Foods,(pCi/kg), Food Type = General 35
Soil Parameter Model, Food Radium-226 (pCi/kg),vs. Soil Radium-226 (pCi/g), Adjusted for pH
Food Type and Soil Parameter Model, Food Radium-226(pCi/kg) vs. Soil Radium-226 (pCi/g), AdjustedRegression Lines
958
10
62
11 Soil Parameter Model, Food Lead-210 (pCi/kg) vs.Soil Lead-210 (pCi/g), Log Domain 77
10912
13
Observed Radium-226 Concentrations
Estimated Radium-226 Concentrations, Food Type/LandType Model 110
113
114
14
15
Observed Lead-210 Concentrations
Estimated Lead-210 Concentrations, Food Type/LandType Model
xv

SUMMARY
Post, Buckley, Schuh & Jernigan, Inc. (PBS&J) was retained by theFlorida Institute of Phosphate Research to study the radioactivity infoods grown on mined phosphate lands in the central Florida phosphatedistrict. This study was a follow-up to a previous study ofradioactivity in foods in which over one hundred food samples werecollected from sixty two land parcels. While the initial study surveyedradioactivity in foods on a variety of land types including unmined landsand mined lands, this current study concentrated on lands which werereclaimed after phosphate mining. Since lands reclaimed from claysettling areas will constitute the majority of lands to be reclaimed,this current study concentrated mostly on foods grown on reclaimed claylands.
Approximately seventy individual food samples were collected fromfive land parcels in the central Florida phosphate district and subjectedto radioassay for radium-226, lead-210 and polonium-210. Correspondingsoil samples were collected and analyzed for these radionuclides and alsofor a variety of soil chemistry parameters, The results of theradioactivity and soil chemistry analyses of these samples wereintegrated into the data base which had been created from the initialstudy and a variety of statistical analyses were conducted on thisintegrated data set. The results of these analyses indicated, as in theinitial study, that concentrations of radium-226 and lead-210 observed infoods grown on mined phosphate lands were statistically higher thanconcentrations of these radionuclides exhibited in foods grown on unminedphosphate lands. Concentrations of polonium-210 observed in these foodswere found to be extremely low; in fact, a substantial number of themeasurements for polonium-210 were below the limit of detection of theanalytical methodology.
Although the radioactivity concentrations measured in foods grown onmined phosphate lands were found to be statistically higher than in foodsgrown on other lands, the radiation dose to the consumers of these foodswas found to be only a small fraction of the dose received by an averageindividual from other environmental sources of radioactivity. The studyevaluated the dose to a hypothetical person who obtains all of the foodssampled in this study from reclaimed clay lands and the remainder of hisdiet from the general food pool. This person is estimated to receive19.1 mrem per year in committed effective dose equivalent from theingestion of the radionuclides reported in this study, This is only 2.7mrem per year more than the estimated radiation dose to a similarindividual who obtains all of his foods from lands unaffected byphosphate deposits or phosphate mining. Both of these dose levels arequite low and are not considered to be a health hazard.

INTRODUCTION
In 1986, a research team headed by Post, Buckley, Schuh & Jernigan,Inc. (PBS&J) under the sponsorship of the Florida Institute of PhosphateResearch (FIPR) completed a study entitled "Radioactivity in Foods Grownon Florida Phosphate Lands." In this study, radioactivity concentrationsmeasured in foods grown on mined phosphate lands were found to be higherthan radioactivity concentrations measured in similar foods grown onunmined lands (Guidry, et. al., 1986). The radiation doses from theseenhanced radioactivity levels were, however, estimated to be small. Inthis study, it was observed that on one of the land types studied, debrisland, radioactivity concentrations were measured which suggest substantialuptake of radioactivity in foods. (Debris lands are those upon which the-14 mesh phosphate ore fraction has been disposed.) This study is afollow-up to the previous study of radioactivity in foods.
The single highest radium-226 concentration measured in the initialstudy was for spinach sampled on a parcel of debris land. Other foodsamples collected from this debris parcel also exhibited relatively highconcentrations of radium-226 and other radionuclides. The foods from thisparcel appeared to concentrate radioactivity significantly more than foodsgrown on the clay settling area sampled, despite the significantly highersoil radioactivity observed on the clay settling area. This suggests thepossibility that other factors not measured in the debris land soil couldcontribute to the uptake observed.
The initial study also found no significant difference between foodsgrown on the clay settling area sampled and other mined parcels, despitethe substantial difference in soil radium concentrations between theseland types. Other studies of plant uptake on clay settling areas(Roessler, et. al., 1986) also indicate that radium uptake is not inproportion to the elevated soil radium on these lands. Since claysettling areas will account for substantial acreages in future reclaimedlands, and since sand-clay mixes are gaining acceptance as a reclamationtechnique, radioactivity uptake mechanisms on these lands is a source ofpublic concern.
The observations noted suggest that relatively smaller quantities ofradium are taken up from these higher radioactivity clays, even thoughmore radium is present in the soil. The chemistry of the clays may, infact, inhibit plant uptake. If this hypothesis can be substantiated, andif the same effect can be demonstrated for other radionuclides, thepotential for agricultural use of these lands would be substantiallyenhanced.
It should be noted that few debris parcels exist, and no new debrislands are going to be created. The purpose of this study is not to studyfoods grown on debris lands per se, but to study the mechanisms by whichradioactivity is taken up into the foods being grown on all lands. Thedebris lands and the clay settling areas are of particular interest inthis current study, since: (1) both of these land types contain elevated
2

radioactivity concentrations; (2) the foods to be collected on these landsare likely to contain more detectable levels of natural radioactivity thanfoods grown on low radioactivity soils; and (3) the higher concentrationsthat are expected will allow for more meaningful and more powerfulstatistical analyses of the data.
The initial study concentrated on evaluating radium-226 and isotopesof uranium and thorium as potential radiation dose contributors. To alesser extent, lead-210 and polonium-210 were also studied. The studyconfirmed that radium-226 contributes a substantial fraction of theradiation dose received via consumption of the foods studied. This isconsistent with previous findings from other studies. It was furtherdetermined that the uranium and thorium isotopes also contributed, but toa lesser degree.
While the lead and polonium results in the initial study wereinconclusive, the limited data and the literature (Eisenbud, 1973; Hill,1962; Napier, 1980; Pennington, 1983; UNSCEAR, 1977) suggest that theseradionuclides can contribute substantially to the radiation dose from foodconsumption. Therefore, this study includes lead and polonium analyses.
The current study was conducted as a follow-up to augment the initialstudy's data and analysis. Since the radiation dose estimated from theconsumption of foods grown on the lands evaluated in the initial study waslow, this study did not duplicate any of the evaluations conducted in thefirst study. This second study did, however, use the same sampling,analysis, and evaluation methodologies, so that the data generated and theevaluations conducted could be integrated with the initial study, therebyproducing a more sound basis for the conclusions reached.
OBJECTIVES
The objectives of the current study were to:
1. Identify debris parcels and reclaimed claysettling areas in the central Florida phosphatedistrict on which goods were being grown, or onwhich food crops could be planted.
2. Obtain foods from these lands and submit them forradioassay for radium-226, lead-210, and polonium-210.
3. Evaluate the food:soil radioactivity ratios andthe relationship of some soil chemical propertiesto these ratios.
4. Evaluate the radionuclide uptake by plants grownon phosphatic clays as it relates to soilconcentrations.
3

5. Estimate the radiation dose to the affectedpopulation from the consumption of these foods.
6. Integrate these data with the data base developedin the initial study and determine the effect (ifany) on the conclusions reached by the initialstudy.
DISCUSSION
Foods targeted for the current study included leafy vegetables, rootcrops, and legumes (peas and beans), since these foods exhibited thehighest concentrations in the initial study. Of particular interest arethe leafy vegetables, since these foods have been shown to be keyindicators of radioactivity uptake.
The selection of radionuclides is based on the findings of theinitial study. Radium-226 was shown to be a key contributor to theradiation dose, both from the concentrations measured and the doseconversion factors for radium-226. The uranium and thorium isotopes werefound to contribute substantially less to the overall dose and, therefore,are not included here, Lead-210 and polonium-210 were considered in theinitial study; but the cost for these analyses prohibited analysis of allsamples. Some samples were assayed, but without definitive conclusions.These two radionuclides have been added to the current study.
In addition to the foods targeted for study, soil samples werecollected from each of the sampled parcels and analyzed for theradionuclides discussed above, as well as for pH, cation exchange capacityand several other soil chemistry parameters. These additional parametersare reported to be factors in radioactivity uptake (Kangas, 1979).Samples of irrigation water, fertilizer, soil amendments, and otherpotential contributors to soil radioactivity were also sampled, assayed,and integrated into the study's data base. In addition, selected soilsamples from the initial study were assayed for cation-exchange capacityand lead-210, since these samples were available without sampling cost.
At the time of this study, two other studies which relate to foodproduction on phosphate lands were being conducted:
0 Polk County Mined Land Agricultural ResearchProject
0 Vegetable Production Potential of SelectedMixtures of Waste Phosphatic Clay and TailingsSand.
Many of the samples which were collected for this study were obtainedfrom those two on-going FIPR-sponsored projects, and the authors wish toacknowledge their cooperation.
4

LITERATURE REVIEW
Prior to commencement of the initial study of radioactivity in foodsin 1983, most of the studies which addressed human exposure to phosphate-related radioactivity focused on exposures to industry personnel and topeople residing in homes built on reclaimed phosphate lands (Bolch, et.al., 1977; Guimond, et. al., 1979; Kaufman, et. al., 1977; Kirchmann, et.al., 1980; Lindeken, et. al., 1977; Menzel, 1968; Roessler, et. al., 1980;USEPA, Reconnaissance, 1973). At that point, very little information hadbeen developed to evaluate the impact of phosphate related radioactivityon human exposures through the food chain (Kangas, 1979; Witherspoon,1982). Since 1983, a number of studies have been completed and severalare currently underway which address the potential of radiation exposureto natural members of the uranium and thorium radioactivity series throughthe food chain. Because of the nature of reclaimed soil materials and thelocation of most of the reclaimed phosphate lands, agriculture is likelyto be a major use for reclaimed phosphate lands.
TRANSFER OF RADIUM FROM SOIL TO PLANTS
Radioactivity uptake from soil is influenced by plant species; bysoil factors such as type, pH, content of other alkaline earth elements,clay content, and exchangeable calcium and potassium; and by the chemicalform of the radium (McDowell-Boyer, et al., 1979; Watson, et al., 1983).The transfer of a radionuclide from soil to a plant tissue of interest maybe described in terms of the "concentration ratio" (CR), the unitlessratio of the activity concentration in the dry plant matter to theactivity concentration in dry soil. Alternatively, this is called the"soil-to-plant transfer factor" when the concentration in the plant isexpressed on a fresh weight basis (Till and Meyer, 1983). Theradioactivity concentration on a dry weight basis is the most reproduciblequantity; the concentration on a fresh weight basis enters directly intodiet models; the two are interrelated by the moisture content.
It is often assumed that there is a linear relationship betweenradionuclide concentration of a given part of a specific plant type andthe concentration of that radionuclide in the soil. Report 77 of theNational Council on Radiation Protection and Measurements (NCRP) (NCRP,1984b) quotes a study of 11 types of root and leafy vegetables grown onsoil contaminated with uranium tailings in which a linear relationship wasobserved between radium-226 concentrations in vegetation and soil.
On the other hand, there is evidence that soil factors maysignificantly affect the transfer factor. Lindekin and Coles (1978)reported a garden experiment involving soils with radium-226concentrations on the order of 0.5 picocuries per gram (pCi/g). Theconcentration factors for broccoli and turnips were on the order of 0.056for a garden with a soil calcium level of 3,100 parts per million (ppm)and only about 0.025 for a garden with a soil calcium level of 5,200 ppm.In other words, the concentration factors were a factor of 2 lower for thesoil with the higher calcium level.
5

The preliminary results of another study (Roessler et al., 1986),involving forages and grains, indicate a significant difference betweentwo land types. The increase in radium-226 concentrations in crops grownon a former phosphate clay settling area with 20 pCi/g soil radium-226 wasless than would be predicted by a direct proportion to the soil radium.Concentration ratios were an order of magnitude lower for forage cropsgrown on the clay settling area as compared to control areas with soilradium concentrations on the order of 0.3 pCi/g. Possible explanationsinclude (1) an effect of the higher calcium level in the test area, (2)a difference in radium availability between the settled phosphatic claysand the natural soil of the control area, and/or (3) some regulatorymechanism limiting the uptake from the higher radium soils.
Soil-to-plant transfer factors for radium fall in the range of0.00011 to 0.2 (fresh plant/dry soil) for the edible portion of food cropsand in the range of 0.0011 to 1.4 (dry plant/dry soil) for pasture plants(NCRP, 1984a). In summarizing the literature, Watson, et al. (1984),report average transfer factors on the order of 0.01 for vegetables, 0.003for fruit, and 0.6 for grain (all fresh plant/dry soil) and concentrationratios of about 0.1 for forages and hay (dry plant/dry soil).
As indicated above, Watson, et al. (1984) reported transfer factorson the order of 0.6 for grain. They state that grain tends to concentrateradium more than vegetables and fruit. On the other hand, the ratio ofthe typical radium-226 concentration in whole grain products, 2.3 pCi/kg(McDowell-Boyer, et al., 1989), to the typical value in U.S. soils, 0.6pCi/g (NCRP, 1984b), suggests a transfer factor on the order of only0.004.
The Florida study referenced above (Roessler, et al. 1986) determinedradium-226 concentrations and plant:soil concentration ratios in foragesand grains (corn, sunflower, and sorghum) grown on a former phosphate claysettling area (20 pCi/g soil radium-226) and in forage from control plots(0.3 pCi/g soil radium). The study indicated that:
1. The concentration ratios for forages were aboutan order of magnitude lower for the phosphate claysettling area (with elevated soil radium) than forthe control area; and
2. The concentration ratios for the grain on the claysettling area were about an order of magnitudelower than for the forages and averaged about0.001.
Unfortunately, to date this study has not determined radium-226 in grainsfrom control areas. However, interpolation from the available datasuggests that the concentration ratio for grains would not be greater than0.01 for the control areas.
6
TRANSFER OF LEAD AND POLONIUM FROM SOIL TO PLANTS
Most soil radioactivity is concentrated in the upper 15 cm (humuslayer) with intermediate values in the middle layer. It is possible thatthe acidity as well as the saturation condition at sites tend to enhancethe solubility and availability of radionuclides for plant uptake.
The definition of the plant: soil concentration ratio (CR) as aconstant value assumes that the concentration in the plant increases withincreasing soil concentrations. This assumption is not substantiated bydata for many plant types and elements. The Ibrahim and Whicker (1987)study of the uptake of lead-210 and polonium-210 vs. soil activityprovides evidence of non-linearity of uptake.
These studies indicate a wide variation in concentration ratios forthe radionuclides of interest in this study. They also suggest that thesevariations may be a function of food type and soil chemistry. The currentstudy of radioactivity in foods on mined phosphate lands investigatesthese potential relationships.
7

PARCEL RECONNAISSANCE AND SELECTION
A major source of information used in the identification of debrisparcels and reclaimed clay settling areas in the central Florida phosphatedistrict were Florida Department of Natural Resources (FDNR) records,particularly, the Old Lands Reclamation Program. As part of the old landsprogram, a detailed survey of the central and northern Florida phosphatedistricts identified pre-1975 mined and disturbed areas and provideddescriptions for each site. A total of 213 records were used to constructa master reference list (MRL) containing 24 known and 47 potential debrisparcels.
The MRL was used as the basis for field reconnaissance of the oldmined lands. All of the parcels were plotted on maps of Polk andHillsborough counties. Then, these work maps were used to establish themost efficient routes for visiting the 71 parcels. During reconnaissance,each site was assessed to determine present land use and potentialavailability for gardening. Scintillometer surveys were conducted onaccessible parcels to determine relative radiation levels.
The Polk County Cooperative Extension Service has existing gardensat two locations in Polk County: (1) IMC Fertilizer, Inc. (IMCF)Phosphoria Mine, and (2) Agrico Chemical Company's Ft. Green Mine. Aconcurrent FIPR study conducted by Bromwell and Carrier has experimentalgardens on a reclaimed settling area at C.F. Industries' North Pasturemine in Hardee County. Each of these gardens contained targeted vegetablecrops.
Field reconnaissance eliminated all but two potential locations fora garden on debris: Mulberry High School, at Mulberry, Florida, andNoranda's Hopewell Mine near Keysville, Florida. Many of the parcels wereeliminated because they did not contain debris. Some were eliminatedbecause heavy industry at the site would interfere with gardening.Several existing gardens were observed on potential debris parcels, butthey were small backyard plots which did not have the targeted leafy androot vegetables. The Williamson lease on debris land at the HopewellMine, which had provided samples for the initial study, also providedcollard green samples for the current study. However, the lease wasterminated after June 1987 and no further planting occurred.
Initially, the Mulberry High School site was thought to be the bestlocation because of the availability of students enrolled in the school'sagriculture curriculum. Soil samples were obtained from this and otherlocations and subjected to grain size and chemical analyses to determinesoil constituents. Compared results (Tables 1 and 2) show that the highschool garden is predominantly clay and not debris. At the Hopewell sitethe soil is primarily +150 mesh (approximately 0.1 millimeter averagediameter) and has a relatively high phosphate content. Hopewellmanagement granted permission to garden on the Section-4 debris pile.
8

TABLE 1
SCREEN ANALYSIS RESULTS
Samples % Moisture % +150 Mesh % -150 Mesh
IMCF #l 25.0 5.8 94.2IMCF #2 22.8 2.7 97.0Mulberry High School 30.4 10.7 89.3Hopewell-Williamson Lease 14.2 86.2 13.8Hopewell-Section 4 Debris Pile 9.8 95.0 5.0Hopewell-Big Debris Pile 7.6 96.6 3.4
9

TABLE 2
10

FIELD SAMPLING
Sampling for this current study was conducted at six locations (seeFigure 1). External gamma radiation, as measured with an EDA Model GRS-500 Spectrometer/Scintillometer, and associated land types are presentedin Table 3. Table 4 summarizes the vegetables sampled and theirrespective locations.
Table 3Sampling Location Descriptions
When available, two replicates of at least five kilograms each werecollected to represent each vegetable sample. However, when this quantitywas not available, smaller samples were obtained. If foods were grown inlarge quantities, the samples were collected (by hand picking) fromdifferent sections of the field. At smaller plots, where there was onlyone or two rows and quantities were limited, all of the plants were taken.Under these circumstances approximately half of the plants would beselected at random along the entire length of the row as the firstreplicate. The remaining plants comprised the second replicate.
For nearly all vegetable samples, at least one surface soil samplewas collected. This was accomplished by cornpositing grab samples from theupper six inches of soil adjacent to each plant sampled. Grab sampleswere taken with a hand trowel which was washed with deionized waterbetween replicate samples and between different parcels.
11


13

Irrigation water and fertilizer samples were acquired for the gardensat Ft. Green, Phosphoria, and Hopewell Section 4. Irrigation water wasplaced in one-quart vessels containing 2.5 milliliters of 16 N nitricacid.
FT. GREEN AND PHOSPHORIA
At Ft. Green and Phosphoria, Polk County's Cooperative ExtensionService is maintaining large gardens to determine yields of various cropson reclaimed clay settling areas. In addition, they prepared a smaller,separate plot at Phosphoria to grow targeted foods for this study. Withthe exception of okra, all of the vegetable samples from Phosphoria werecollected from this smaller garden. Preparation of these garden plotsentailed clearing existing growth with a grader and planting crops intothe tilled, moist clay. Wells at each site provide water for irrigation.
MULBERRY HIGH SCHOOL
Gardening at Mulberry High School is conducted as part of theagriculture curriculum. The plot has been cleared and tilled byconventional methods. Over the years, soil amendments such as sand andpeat have been placed in the garden area. Records are not availableconcerning the quantities and exact locations of these amendments.Irrigation water is provided by the local water supply system.
CFI NORTH PASTURE
A vegetable production study conducted by Bromwell and Carrier forFIPR was designed to determine how different sand:clay ratios affectgrowth and nutrient uptake. The parcel was divided into four areas ofvarying sand:clay ratios: 2, 4, 6, and 8:1. Within each of these areas,three separate rows were developed: one with no peat added as a soilamendment, one with peat added at a rate of 45 tons per acre, and one withpeat added at a rate of 90 tons per acre. Phosphogypsum was added to someof the individual plots as an additional soil amendment. The study designprovided a variety of different soil mixes for vegetable sampling.
Sampling for this study took place at the same time that Bromwell andCarrier was sampling for the vegetable production study. Bromwellpersonnel would harvest and weigh the vegetables and collect enough samplefor their analytical needs. The remainder of the harvested sample fromselected plots was collected, bagged, and labeled as the Bromwell projectteam completed their sampling.
HOPEWELL SECTION-4 DEBRIS GARDEN
In April 1987, management of the Hopewell Mine granted permission toplant a garden on the Section-4 debris pile. A winter garden was plannedbecause it would be able to yield the greatest number of targeted foodsduring a single season. Preparation over the ensuing months consisted ofpreparing a garden plot plan, establishing a planting schedule, anddetermining the most cost-effective alternative for garden irrigation.
14

An individual with appropriate experience was retained to manage thegardening effort.
Site clearing and irrigation system installation began during thelast week of August. The garden site is on grassy pastureland, so acommercially available product was used to clear existing vegetation. Bymid-September, irrigation was installed and planting completed. Cabbageand broccoli were planted as transplants and the other vegetable plantswere nurtured from seed. The debris is a well-drained medium and requireddaily watering. Fertilizer and insecticide were applied weekly.
The first crops to mature, mustard and turnips, were sampled at theend of October. Because of the mild winter that year, the garden did notproduce anticipated yields of the remaining vegetables. A large animalintrusion and an unexpected freeze in late February also contributed toreducing the yield. Despite these problems, the most important foodswhich had been targeted for production on the debris garden werecollected.
15

SAMPLE PREPARATION AND RADIOASSAY
SAMPLE PREPARATION
All foods were prepared as for normal human consumption, except thatno foods were cooked. Drying was accomplished at 100°C for approximately24 hours. Individual food types were prepared as follows:
1. Leafy Vegetables - All leaves were washed with cold tap waterto remove dirt and foreign matter, patted dry with papertowels, then dried. In the case of collard and mustardgreens, the excess stems were removed.
2. Root Foods - Root foods were washed of dirt and foreign matterusing cold tap water and a vegetable brush. Skins were notremoved before slicing and drying. In the case of radish andturnips, the tops and roots were removed.
3. Garden Fruits - Garden fruits were washed of visible foreignmatter using cold tap water, patted dry, then sliced and dicedbefore drying. No peels were removed.
4. Legumes - Legumes were rinsed with cold tap water, patted dry,then either shelled or diced, depending on the normal methodof human consumption.
5. Rice - Husks were removed but no drying was done.
RADIUM-226 IN SOILS
Radium-226 was determined in the dried sample by high resolutiongamma-ray spectrometry, according to the procedure published by Bolch, etal. (1977). In this method, a portion of the sample is weighed into a0.5-liter Marinelli beaker which is then capped and sealed with a bead ofcement. The sealed sample is stored at least two weeks to allow ingrowthof gaseous radon-222 (and its short-lived decay products) to radioactiveequilibrium with the long-lived parent radium-226 in the sample. Thesample is then counted on a high resolution gamma-ray spectrometer. Theradium-226 content of the sample is calculated from the counts associatedwith the 295.2, 352.0 and 609.4 keV peaks of the lead-214 and bismuth-214radon daughters. Results are reported as picocuries of radium-226 pergram of dry soil (pCi/g).
RADIUM-226 IN FOODS
A portion of dried food sample was weighed into a 250 ml containerwhich was then capped and sealed. The sealed sample was stored for aminimum of two weeks to allow ingrowth of gaseous radon-222 and itsdaughter products to equilibrium with the parent radium-226 in the sample.The sample was then counted on a high resolution gamma-ray spectrometerin the same manner as the soil sample. Results are reported as picocuriesof radium-226 per kilogram of fresh food (pCi/kg).
16

LEAD-210/POLONIUM-210 IN FOODS AND SOILS
Bismuth-207 and polonium-209 tracers and lanthanum carrier were addedto an appropriate aliquot of dried sample. The sample was thensolubilized with a combination of nitric acid, hydrochloric acid andhydrogen peroxide. The analytes of interest were then coprecipitated withammonium hydroxide. The precipitate was redissolved in acid and thebismuth and polonium spontaneously deposited on a nickel disc.
The disc was beta counted for bismuth-210, gamma assayed for bismuth-207 and assayed by alpha spectroscopy for polonium-209 and polonium-210.The lead-210 is determined from the bismuth-210 ingrowth and bismuth-207fractional recovery. Results are reported as picocuries of lead-210 orpolonium-210 per gram of dry soil or per kilogram of fresh food.
SOIL CHEMISTRY ANALYSIS
Selected soil samples were composited and submitted to A & L SouthernAgricultural Laboratories in Pompano Beach, Florida for basic test S1A.This analysis provided the following results which were used in thisstudy:
0 Organic matter (OM) expressed as a percent
0 Potassium (K) in parts per million (ppm)
0 Magnesium (Mg) in ppm
0 Calcium (Ca) in ppm
0 pH
0 Hydrogen (H) in milliequivalents per one hundredgrams (meq/100g)
0 Cation exchange capacity (CEC) in meq/100g
17
STATISTICAL ANALYSIS
EXPERIMENTAL DESIGN
The objectives of the statistical analysis were as follows:
0 Analyze food radioactivity concentrations toidentify differences between foods and lands.
0 Determine the relationship, if any, between theconcentration level in the food and: (1) theconcentration in the soil, (2) the soil type, (3)the chemistry of the soil, and (4) the food type.Of special interest is the relationship forradium-226.
0 Test and augment the conclusions of the initialstudy.
The experimental design utilized to accomplish these objectives isa two-way factorial, with the factors being land types and food types.The factorial is 6x5, using 6 land types and 29 foods grouped into 5 foodtypes. Replication within the factor level combinations (that is,combinations of land and food types) occurred on two levels:
1. Some of the land-food type combinations were sampled more thanonce. These samples are referred to as parcels.
2. Samples selected within parcels were almost always replicatedeither two or three times.
Three within-parcel replicates were selected for most of the parcelsin the initial study, but the number of replicates was reduced to two inthe current study. The initial study revealed that the parcel-to-parcelvariability exceeded that among replicates. Therefore, the within-parcelreplication for food samples was reduced, and more resources were devotedto increasing the number of parcels for each land-food type combination,especially those on which mean food radium levels were found to berelatively high in the initial study.
To improve the power of the statistical analysis and to facilitatereference to the food evaluations, foods were combined into severalcategories as shown in Table 5. The category names listed under "FoodType" will be used throughout the text to refer to the listed foods.Since few of the foods sampled in the initial study were analyzed forpolonium-210 and lead-210 and since concentrations for these radionuclideswere desirable as controls for the current study, several food sampleswere collected from three grocery stores in the Orlando area and analyzedfor radioactivity. It was theorized that these results could be used inthe dose evaluation of the control. It was presumed that, if theradioactivity concentrations in these samples were similar to thoseexhibited by control and mineralized parcels in the initial study, then
18

TABLE 5LANDS/FOOD MATRIX

the polonium and lead results could be used for the control evaluation.This, however, was not the case and, since the origin of these foods couldnot be determined, most of the analyses do not include the grocery storesamples.
Because the emphasis for this current study was on certain land-foodtype combinations, not all land-food type combinations were sampled withequal frequency. The number of samples for each land-food typecombination is shown in Table 5. Notice that the samples collected fromlocal grocery stores are treated as a land type for comparison purposes.
The analysis of unbalanced factorial designs requires special care.Analyses of the food measurements discussed in the following sectionscarefully partition the variability attributable to parcel-to-parceldifferences and that attributable to within-parcel replication. Then theappropriate statistical tests are conducted to determine which land-foodtype differences are statistically significant. Replicates of the within-parcel soil concentration (radium-226, polonium-210, lead-210) andchemistry (pH, hydrogen, cation exchange capacity, organic matter,potassium, magnesium, calcium) measurements were composited prior toanalysis, resulting in one measurement per parcel. Therefore, when soilparameters were analyzed, only parcel-to-parcel variability was estimated.When regression analyses were performed to relate food and soilparameters, the geometric means of the within-sample replicates of thefood parameters were computed for each parcel, generating one measurementper parcel for both food and soil parameters.
ANALYSIS
The first step in the statistical analysis was to compare land typesaccording to each soil concentration and soil chemistry parameter. Then,the land types, food types, and foods were compared utilizing the measuredradium, lead and polonium concentrations. The second major component ofthe statistical analysis was to relate radioactivity concentrationsmeasured in foods to the concentration measured in the soil, the soilchemistries, and the corresponding soil and food type designations. Ofspecial interest is the relationship of radium-226 in the food with theradium-226 in the soil, the soil chemistry, the land type, and the foodtype. It should be emphasized that the objective of evaluating thisrelationship was to determine the probable nature and strength of therelationships, and not to establish a precise predictive mechanism,although mechanisms to estimate food concentrations were developed.
Analysis of variance (ANOVA) was utilized to determine statisticallysignificant differences between land types, food types, and individualfoods within food types. Two types of ANOVA were conducted. The firstwas performed on the logarithmic transform of the parameters, except forhydrogen and pH. This transform has the effect of comparing the geometricmeans of the parameters, and the arithmetic means of hydrogen and pH. Theprimary reason for the transformation is to account for the rightwardskewness in the frequency distributions of most of the parameters. That
20
is, standard ANOVA on untransformed values requires that the distributionof the parameter be approximately normal. However, most biological andchemical measurements possess distributions that are rightward skewed.The pH values are already logarithmic transforms, so no furthertransformation is necessary. The hydrogen values are calculatedpercentages of the binding sites in the soil which are taken up byhydrogen ions (Griffith, 1989); since these values are not calculatedwhen the pH is greater than 7.0, they are reported as zero and thelogarithmic transform does not apply.
The use of logarithmic transformed ANOVA requires the assumption thatthe parameter's frequency distribution is lognormal. This means that,while the distribution of the values themselves may be rightwardly skewed,the logarithms of the values are assumed to possess a normal distribution.Of course, the fact that the distribution associated with a parameter isrightwardly skewed does not guarantee that the distribution is lognormal.For this reason, a second ANOVA that requires no distributionalassumptions about the parameters was performed. This nonparametricanalysis of variance is performed on the ranks of the measurements, ratherthan on the measurements themselves. That is, the measurements are rankedfrom largest to smallest, and the ANOVA is conducted utilizing the ranksof the measurements. Of course, the greatest disadvantage to thenonparametric ANOVA is that magnitudes of the differences betweenmeasurements play little role in the analysis; only the rank ordermatters. Nevertheless, when distributional assumptions are in doubt, thenonparametric ANOVA provides an alternative analysis that requires no suchassumptions.
Analysis of residuals was used to test the lognormality assumption(and normality in the case of pH and hydrogen) necessary for the validityof the parametric ANOVA. The distributions of the residuals of thetransformedvariables appeared to be approximately normal for nearly everyparameter. In addition, both parametric and nonparametric ANOVAs wereperformed for several of the parameters in order to determine therobustness of the results. In almost every case the nonparametric andparametric analyses were in agreement. Therefore, the lognormalassumption appears to be reasonable, and the following results are allbased on parametric ANOVAs.
If the ANOVA indicates a difference among the means for the variousfactor combinations (land type and food type, for example), a multiplecomparison procedure is applied to determine which pairs of means aresignificantly different from a statistical standpoint. The least squaresmultiple comparison procedure was used to compare pairs of means fromgroups determined by the ANOVA to contain pairs of means that differ.Pairwise comparisons were made only if the ANOVA revealed a significanteffect at the 0.05 level. The multiple comparisons were declaredsignificant at several levels: less than 0.01, 0.01 to 0.02, and 0.02 to0.05. The (less than) 0.01 level of significance provides maximumprotection against concluding that differences are significant, when infact they are not (Type I error). However, the 0.01 to 0.02 and 0.02 to0.05 levels of significance provide useful information, since the error
21
of not declaring real differences statistically significant (Type IIerror) is also of concern in this study.
For the purpose of the statistical analysis, food concentrationvalues for the current study that were measured at less than the detectionlimit or at zero were estimated at one-half the detection limit. Thisprovides a more reasonable result for the statistical analysis for thoseresults which were below detection limits and also provided a result whichcould be logarithmically transformed for those results which were reportedas zero. Food concentration values that were measured at less than thedetection limit or at zero for the initial study were estimated by themethodology utilized in that study, which was at one-half the lowest valuereported for the corresponding food. No estimation was necessary for thesoil concentrations and chemistry parameters since none of the reportedresults were reported below the detection limits of the analyticalprocedure.
LAND TYPE DIFFERENCES BASED ON SOIL PARAMETERS
The soil concentration and chemistry parameters were analyzed todetermine if the land types differed according to each measured soilcharacteristic. The first step was to determine if the Bromwell parcelshould be treated as a separate land type, or if it could be combined withthe reclaimed or clay parcels. While most of the foods from the Bromwellparcel were collected from 8:1 sand:clay plots, some 2:1 sand:clay sampleswere included in the study to supplement the design matrix. Soilscollected from the Bromwell parcel exhibited radiological and chemicalcharacteristics which, for almost all parameters, were statisticallysimilar to samples collected from the clay settling areas. Therefore, theBromwell soils were grouped with the clay soils, providing a more balancedand complete experimental design.
Once the Bromwell data had been classified as clay, the next step wasto determine whether land types could be grouped according to the soilcharacteristics. Table 6 presents the results of the multiple comparisontests, and Table 7 gives the adjusted geometric means on which thesecomparisons are based. (These results are computer generated and includeseveral decimal places. Results should be considered accurate to twosignificant figures.) All multiple comparisons follow an ANOVA whichindicates a significant difference between land types at the 0.05 level.Each difference shown in Table 6 is significant at the 0.01 level ofsignificance unless otherwise noted. If the significance of the multiplecomparisons is low, at the 0.02 or 0.05 level, the difference isfootnoted. The differences listed in Table 6 are ordered by the magnitudeof the geometric means, providing a ranking for comparison purposes.
The soil radium-226 results suggest grouping the mineralized andcontrol land types. The ranking of the geometric means agrees with theresults for food radium from the initial study. Clay and debris parcelsexhibit higher average concentrations of radium-226 than the other landtypes, and their concentrations are not significantly different from eachother. The reclaimed parcels exhibit the next highest concentrations of
22

TABLE 6
MULTIPLE COMPARISON ANALYSIS SOIL RADIOACTIVITY AND CHEMISTRY
Soil Radium-226: DEBRIS > RECLAIMED, CONTROL, MINERALIZED CLAY > RECLAIMED, CONTROL, MINERALIZED RECLAIMED > CONTROL, MINERALIZED
Soil Polonium-210: (CLAY, DEBRIS, RECLAIMED) DEBRIS > RECLAIMED CLAY > RECLAIMED
Soil Lead-210: (CLAY, DEBRIS, RECLAIMED) DEBRIS > RECLAIMED CLAY > RECLAIMED
pH: CLAY > CONTROL, MINERALIZED, DEBRIS, RECLAIMED CONTROL > RECLAIMED' MINERALIZED > RECLAIMED2
Hydrogen: CONTROL > RECLAIMED, DEBRIS, MINERALIZED, CLAY
Cation Exchange Capacity: CLAY > RECLAIMED, DEBRIS, MINERALIZED CONTROL > RECLAIMED, DEBRIS, MINERALIZED
Organic Matter: CONTROL > MINERALIZED, RECLAIMED, DEBRIS, CLAY MINERALIZED > DEBRIS, CLAY RECLAIMED > CLAY2
Potassium: CLAY > CONTROL2, DEBRIS, MINERALIZED, RECLAIMED CONTROL > MINERALIZED, RECLAIMED DEBRIS > MINERALIZED2, RECLAIMED1
Magnesium: CLAY > CONTROLl, DEBRIS, RECLAIMED, MINERALIZED CONTROL > DEBRIS, RECLAIMED, MINERALIZED
Calcium: CLAY > RECLAIMED, DEBRIS, MINERALIZED CONTROL > RECLAIMED, DEBRIS, MINERALIZED
'Significant at 0.02 level 2Significant at 0.05 level
23

soil radium, and they are significantly greater than concentrationsmeasured on both the control and the mineralized parcels. The geometricmeans of the radium concentrations measured in the soils from the controland mineralized parcels are nearly equal, and are therefore notsignificantly different.
These results are illustrated in Figure 2. The adjusted geometricmeans are represented by a symbol within the two standard error range forthe mean. Notice the extremely low values and tight ranges for thecontrol and mineralized lands and the high values and broad ranges forthe clay and debris lands.
The polonium-210 and lead-210 results shown in Table 6 should beviewed with caution since they are based on a limited number ofmeasurements (mostly during the current study) on the three land typesshown. However, the findings for these two parameters are consistent witheach other and with the radium-226 results: soils from the clay and debrisparcels exhibit significantly higher levels of radioactivity, on average,than soils from the reclaimed parcels.
The groupings of the land types by soil chemistry parameters are notas consistent as for the soil radioactivity parameters. For example,control and mineralized parcels could be combined according to the pHlevels, but not for any of the other soil chemistry parameters. All ofthe means of the soil chemistry parameters for control lands rankrelatively high. Note that many of the control lands were muck lands nearLake Apopka, where local farming provided an abundance of foods on lowradioactivity soils. The means of the soil chemistry parameters for claylands also rank high, except for hydrogen and organic matter. However,caution should be exercised when drawing conclusions from the analysis ofthe soil chemistry parameters. Since the soil samples were composited foreach parcel, the sample sizes for all but pH are quite small: Control 6,Debris 8, Mineralized 10, Reclaimed 12, and Clay 27.
LAND TYPE, FOOD TYPE, AND FOOD DIFFERENCES BASED ON FOOD RADIOACTIVITYCONCENTRATIONS
The statistical evaluation of the differences in food radioactivityconcentrations between land types, food types, and individual foods aredescribed in the following sections. As with the previous analyses, somecomparisons are significant at the 0.02 and 0.05 levels. Actualsignificance levels are indicated on each of the comparison tables.
Radium-226
Comparisons of the geometric means of radium-226 revealed that theland-food type interaction is significant. The presence of interactionmeans that the differences in food radioactivity concentrations betweenland types depends on the food type, and conversely the difference in foodradioactivity concentrations between food types depends on the land type.Thus, certain food types may have different mean levels of radium-226 on
25

Figure 2LAND
Radium-226 In Soil

the clay land type, while not differing significantly on control ormineralized lands. To determine how the interaction is manifested interms of differences among the adjusted geometric means, land types werecompared by food type, and food types were compared by land type. Thesignificant differences are shown in Tables 8 and 9. Figure 3 graphicallydisplays these differences, and Table 10 lists the adjusted geometricmeans being compared.
Table 8 shows that the control and mineralized land types cluster inthe lowest group for all food types. The clay, debris, and reclaimedlands cluster at the high end, with the only exception being theroots/tubers food type. The roots/tubers foods grown on reclaimed landyield, on the average, lower concentrations of radium than the debris andclay land types. For this food type the reclaimed land type groups withthe control and mineralized lands. The limited number of grocery storesamples exhibited radioactivity concentrations which were found to be notsignificantly different from the other land types. The grocery resultsfor radium-226 are drawn from a very small sample size consisting of asample of potatoes and a sample of green beans.
Figure 3 graphically displays these differences by plotting theadjusted geometric mean along with the two standard error range for themean. Notice for leafy foods that concentrations observed on reclaimed,clay, and debris lands are significantly higher than those observed oncontrol and mineralized lands.
Table 9 shows that food type differences are dependent upon the landtype. The roots/tubers foods have higher mean levels of radium-226 thanthe general foods when grown on clay and debris lands. The leafy foodsexhibit radium-226 levels which are greater than those for general foodson all land types but the control. The mean levels for leafy foods arealso greater than for seeds/grains foods grown on clay, mineralized, andreclaimed lands. The leafy and roots/tubers food types cluster on all butthe reclaimed land type, where the leafy mean level exceeds that forroots/tubers. No significant differences are found on control lands andwith the grocery samples.
Adjusted geometric means by land type and food type are listed inTable 10. Similar data by land type and specific food are shown in Table11 and in Figures 4 through 8. The only food sampled on all land typeswas turnip roots; turnip greens were sampled on all except the grocerystore land type. (Note that the grocery store samples were treated as aseparate land type.) Of the two, only turnip greens showed significantdifferences among land types. Table 11 and Figure 5 illustrate that themean level of radium-226 in turnip greens is significantly greater forclay and reclaimed lands than for mineralized and control lands. Thisfinding is in agreement with the initial study.
27

MULTIPLE COMPARISON ANALYSIS FOOD RADIUM-226
COMPARE LAND TYPES WITHIN FOOD TYPES
CAUL/BROC DEBRIS > MINERALIZED2 CLAY > MINERALIZED2
GENERAL CLAY > MINERALIZED, CONTROL'
LEAFY RECLAIMED > MINERALIZED, CONTROL DEBRIS > MINERALIZED, CONTROL CLAY > MINERALIZED, CONTROL
ROOTS/TUBERS DEBRIS > RECLAIMED, MINERALIZED, CONTROL CLAY > RECLAIMED, MINERALIZED, CONTROL
SEEDS/GRAINS RECLAIMED > MINERALIZED
'Significant at 0.02 level 2Significant at 0.05 level
TABLE 9
MULTIPLE COMPARISON ANALYSIS FOOD RADIUM-226
COMPARE FOOD TYPES WITHIN LAND TYPES
DEBRIS LEAFY > GENERAL ROOTS/TUBERS> GENERAL
CLAY LEAFY > GENERAL, SEEDS/GRAINS ROOTS/TUBERS> GENERALl, SEEDS/GRAINS1
RECLAIMED LEAFY > SEEDS/GRAINS2, ROOTS/TUBERS, GENERAL SEEDS/GRAINS> GENERAL
GROCERY NO SIGNIFICANT DIFFERENCES
MINERALIZED LEAFY > GENERALI, SEEDS/GRAINS1
CONTROL NO SIGNIFICANT DIFFERENCES
'Significant at 0.02 level 2Significant at 0.05 level
TABLE 8
28

Figure 3LAND/FOOD TYPE COMPARISONS
Radium-226 In Foods(pCi/kg)

TABLE 10
RADIUM-226 IN FOOD (pCi/kg)ADJUSTED GEOMETRIC MEANS
BY LAND TYPE AND FOOD TYPE
FOOD CONTROLTYPE LAND
GROCERYSAMPLES
MINERALIZED UNMINED RECLAIMED CLAY DEBRISLAND LAND LAND LAND LAND
CAUL/BROC 6.02535 3.00330 4.25393 22.5845 34.6747
LEAFY 4.15986 8.02255 6.23171 90.8566 42.7642 79.9758
SEEDS/GRAINS 5.35992 1.87165 3.77439 11.5933 6.75768
ROOTS/TUBERS 4.50359 9.85000 5.23945 4.80538 5.03671 22.6096 39.9200
GENERAL 2.66626 9.12300 3.03256 2.97154 5.50152 9.83585 7.09830
30

31

Figure 5SPECIFIC FOOD COMPARISONS
Radium-226 In Foods(pCi/kg)
Food Type = Leafy
Figure 6SPECIFIC FOOD COMPARISONS
Radium-226 In Foods
Food Type = Seeds/Grains(pCi/kg)

Figure 7SPECIFIC FOODCOMPARISONS
Radium-226 In Foods(pCi/kg)
Food Type = Roots/Tubers

Figure 8
SPECIFIC FOOD COMPARISONSRadium-226 In Foods
(pCi/kg)Food Type = General

Wcn
TABLE 11
RADIUM-226 IN FOOD (pCi/kg)ADJUSTED GEOMETRIC MEANS
BY LAND TYPE AND SPECIFIC FOOD
FOODTYPE FOOD
CONTROL GROCERY MINERALIZED UNMINED RECLAIMED CLAY DEBRISLAND SAMPLES LAND LAND LAND LAND LAND
CAUL/BROC BROCCOLICAULIFLOWER
LEAFY CABBAGECOLLARD GREENSLETTUCEMUSTARD GREENSPARSLEYSPINACHSWISS CHARDTURNIP GREENS
SEEDS/GRAINS LIMA BEANSPEASRICEYELLOW CORN
ROOTS/TUBERS CARROTSRADISHPOTATOESTURNIP ROOT
GENERAL CUCUMBEREGGPLANTGREEN BEANSGREEN PEPPEROKRAONIONSSTRAWBERRIESTOMATOWATERMELONYELLOW SQUASHZUCCHINI
3.003306.02535
2.93444
1.34406
4.82499
8.09052
4.852287.100004.89456
8.523763.37745
4.23085
3.21597
2.10426
2.80088
2.09618.1726
1.5326
56.4802
13.1625
1.87165
4.877169.85000
5.43057
4.052979.12300 5.15674
1.65500
3.215974.052975.156741.86616
3.12174 3.121742.80825 2.808253.08403 2.939051.24477 1.244774.11339 4.113394.30550 4.30550
3.003306.02535
2.09616.3263
1.4352
16.5081
10.3195
2.571177.100004.89456
8.523763.81752
4.99696
90.8566
65.71007.9148
8.6326
4.339827.87361
5.5975
3.6824
1.868811.21595.5740
22.5845 34.6747
10.533946.068340.408469.6092
20.8126
89.5455
32.19586.23445.41264.225
540.260
55.473
3.964614.69695.2962
113.07114.898
13.849
113.829
23.641
9.788891.256
30.0979.908
120.7972.822
6.076 5.14725
36

Other foods showed significant differences between land types; thesedifferences are listed in Table 12. The majority of the foods listed aremainly from the leafy food type with the concentrations in foods collectedfrom clay and debris lands being significantly greater than thosecollected from control and mineralized lands.
Comparing the foods within a land type produced the significantdifferences listed in Table 13. Among foods grown on debris land, spinachproduced the highest mean level, significantly higher than the levels froma number of other foods. Levels in collard greens and carrots exceedthose in green beans and yellow squash. Mustard and turnip greens havesignificantly higher levels than yellow squash.
Mean levels of radium-226 found on clay lands are highest forstrawberries. Several other foods grown on clay land exhibit significantlyhigher levels of radium-226; in particular, carrots, turnip greens,mustard greens, and collard greens, as in the debris land. All of thefoods listed in Table 13 for the clay lands had a significantly higherlevel than green peppers. Strawberries, turnip greens, mustard greens,collard greens, and lettuce all have significantly higher levels thanyellow squash. Strawberries, carrots, turnip greens, collard greens, andlettuce all have significantly higher levels than peas, tomatoes, andcabbage.
Among foods grown on reclaimed land, only turnip greens, lima beans,and yellow squash have significantly higher levels of radium-226 thanother foods grown on that land. Turnip greens and lima beans both exhibithigher levels than zucchini, potatoes, greens beans, and watermelon at the0.01 significance level.
When comparing foods grown on mineralized land, spinach, turnipgreens, collard greens, turnip roots, and peas show higher levels ofradium-226. The only difference between foods grown on control land wasfor turnip greens; however, that difference is at the 0.05 significancelevel.
In summary, the land types grouped as in the initial study. Thefoods grown on clay, reclaimed, and debris lands generally have highermean radium-226 levels than those grown on control and mineralized lands.The leafy food type again exhibited higher radium content, and the generalfood type (which includes garden fruit) had a low average, as in theinitial study. A number of foods were found to be significantly differentwithin land type, especially among the leafy and roots/tubers food types.
Lead-210
The measurements of lead-210 in the food were limited to grocery,clay, debris, and some reclaimed and control lands (no mineralizedobservations). There were some values at the detection limit, but not tothe extent of limiting the statistical analysis. The adjusted geometricmeans are presented in Tables 14 and 15. The ANOVA and multiplecomparison results are listed in Tables 16 through 19.
37

TABLE 12
MULTIPLE COMPARISON ANALYSIS FOOD RADIUM-226
COMPARE LAND TYPES WITHIN FOODS
BROCCOLI
STRAWBERRIES
CABBAGE
COLLARD GREENS
MUSTARD GREENS
SPINACH
TURNIP GREENS
CARROTS
PEAS
ALL OTHERS
DEBRIS > CLAY >
CLAY >
DEBRIS > CLAY >
DEBRIS > CLAY >
CLAY > DEBRIS >
DEBRIS > MINERALIZED >
RECLAIMED > CLAY >
DEBRIS > CLAY >
RECLAIMED >
MINERALIZED2 MINERALIZED2
MINERALIZED
MINERALIZED' MINERALIZED2
MINERALIZED, CONTROL MINERALIZEDl, CONTROL
MINERALIZED, CONTROL MINERALIZED, CONTROL
MINERALIZED2, CLAY, CONTROL CONTROL1
MINERALIZED2, CONTROL MINERALIZED, CONTROL
CONTROL2 CONTROL
MINERALIZED2
NO SIGNIFICANT DIFFERENCES
'Significant at 0.02 level 2Significant at 0.05 level
38

TABLE 13
MULTIPLE COMPARISON ANALYSIS FOOD RADIUM-226
COMPARE FOODS WITHIN LAND TYPES
DEBRIS
CLAY
SPINACH
CARROTS COLLARD GREENS MUSTARD GREENS TURNIP GREENS
STRAWBERRIES
CARROTS
TURNIP GREENS
MUSTARD GREENS
COLLARD GREENS
LETTUCE
OKRA BROCCOLI SPINACH RADISH RICE TURNIP ROOT CABBAGE ONIONS
RECLAIMED TURNIP GREENS
LIMA BEANS
YELLOW SQUASH
>
> > > >
>
>
>
>
>
>
> > > > > > > >
>
>
>
TURNIP GREENS2, LETTUCE2, BROCCOLI1, CABBAGEI, TURNIP ROOT, GREEN BEANS, YELLOW SQUASH
GREEN BEANS2, YELLOW SQUASH GREEN BEANS2, YELLOW SQUASH YELLOW SQUASH2 YELLOW SQUASH2
CABBAGE, TURNIP RODTl, ONIONS2, YELLOW SQUASH, YELLOW CORNI, PEAS, TOMATO, GREEN PEPPER
BROCCOLI1, RADISH', RICE2, TURNIP ROOT, CABBAGE, ONIONS, YELLOW SQUASH, YELLOW CORN, PEAS, TOMATO, GREEN PEPPER
BROCCOLI1, RICE2, TURNIP ROOT, CABBAGE, ONIONS, YELLOW SQUASH, YELLOW CORN, PEAS, TOMATO, GREEN PEPPER
TURNIP ROOT, CABBAGE, ONIONl, YELLOW SQUASH, YELLOW CORN, PEAS, GREEN PEPPER
CABBAGE2, YELLOW SQUASH2, YELLOW CORN2, PEAS, TOMATO, GREEN PEPPER
CABBAGE2, YELLOW SQUASH2, YELLOW CORN2, PEAS, TOMATO, GREEN PEPPER
TOMAT02, GREEN PEPPER PEAS2, TOMATOI, GREEN PEPPER GREEN PEPPER' MUSTARD GREENS2, GREEN PEPPER' GREEN PEPPER2 TOMAT02, GREEN PEPPER1 GREEN PEPPER GREEN PEPPER2
YELLOW SQUASH2, YELLOW CORNl, PEASl, TURNIP ROOT', CUCUMBER, ZUCCHINI, POTATOES, GREEN BEANS, WATERMELON
YELLOW CORN2, PEAS2, TURNIP ROOT2, CUCUMBERl, ZUCCHINI, POTATOES, GREEN BEANS, WATERMELON
WATERMELON2
GROCERY NO SIGNIFICANT DIFFERENCES
39

TABLE 13 (CONTINUED)
MINERALIZED SPINACH > TURNIP ROOT, GREEN BEANSl,RADISHl, EGGPLANT, ONIONS, TOMATO, BROCCOLI, STRAWBERRIES, PEAS, GREEN PEPPER, WATERMELON
TURNIP GREENS > ONIONS2, STRAWBERRIES2, CABBAGE2, GREEN PEPPERl, MUSTARD GREENSl, WATERMELON
COLLARD GREENS > MUSTARD GREENS2, ZUCCHINI, YELLOW SQUASH, CABBAGE, PEAS2, MUSTARD GREENS, WATERMELON
TURNIP ROOT > WATERMELON2 PEAS > MUSTARD GREENS
CONTROL TURNIP GREENS > MUSTARD GREENS2
'Significant at 0.02 level 2Significant at 0.05 level
40

TABLE 14
LEAD-210 IN FOOD (pCi/kg)ADJUSTED GEOMETRIC MEANSBY LAND TYPE AND FOOD TYPE
FOODTYPE
CAUL/BROC
LEAFY
SEEDS/GRAINS
ROOTS/TUBERS
GENERAL
CONTROLLAND
61.5650
GROCERY MINERALIZED UNMINED RECLAIMED CLAY DEBRISSAMPLES LAND LAND LAND LAND LAND
9.25800 16.0733 60.0933
14.8828 29.6366 32.0319
117.124 61.5650 0.500000 30.3901
8.25542 2.0000 2.45161 7.81005
6.59115 0.707107 5.63994

TABLE 15
LEAD-210 IN FOOD (pCi/kg)ADJUSTED GEOMETRIC MEANS
BY LAND TYPE AND SPECIFIC FOOD
FOODTYPE FOOD
CONTROL GROCERY MINERALIZED UNMINED RECLAIMED CLAY DEBRISLAND SAMPLES LAND LAND LAND LAND LAND
CAUL/BROC BROCCOLICAULIFLOWER
LEAFY CABBAGECOLLARD GREENSLETTUCEMUSTARD GREENSPARSLEYSPINACHSWISS CHARDTURNIP GREENS
SEEDS/GRAINS LIMA BEANSPEASRICEYELLOW CORN
ROOTS/TUBERS CARROTSRADISHPOTATOESTURNIP ROOT
GENERAL CUCUMBEREGGPLANTGREEN BEANSGREEN PEPPEROKRAONIONSSTRAWBERRIESTOMATOWATERMELONYELLOW SQUASHZUCCHINI
9.25800 16.0733 60.0933
9.129024.2630
61.5650 61.5650117.124 0.500000
0.5000
35.8530 2.000031.3850
0.5000
12.6550
45.943015.7320
2.7200 1.000000.50000
5.50242.67517.62335.84251.80471.135118.32070.728
122.60933.29375.5610.500
166.490
40.475
51.122818.0654
2.08571 5.9657
2.55270 10.2245
27.8435
49.0408
0.8608

TABLE 16
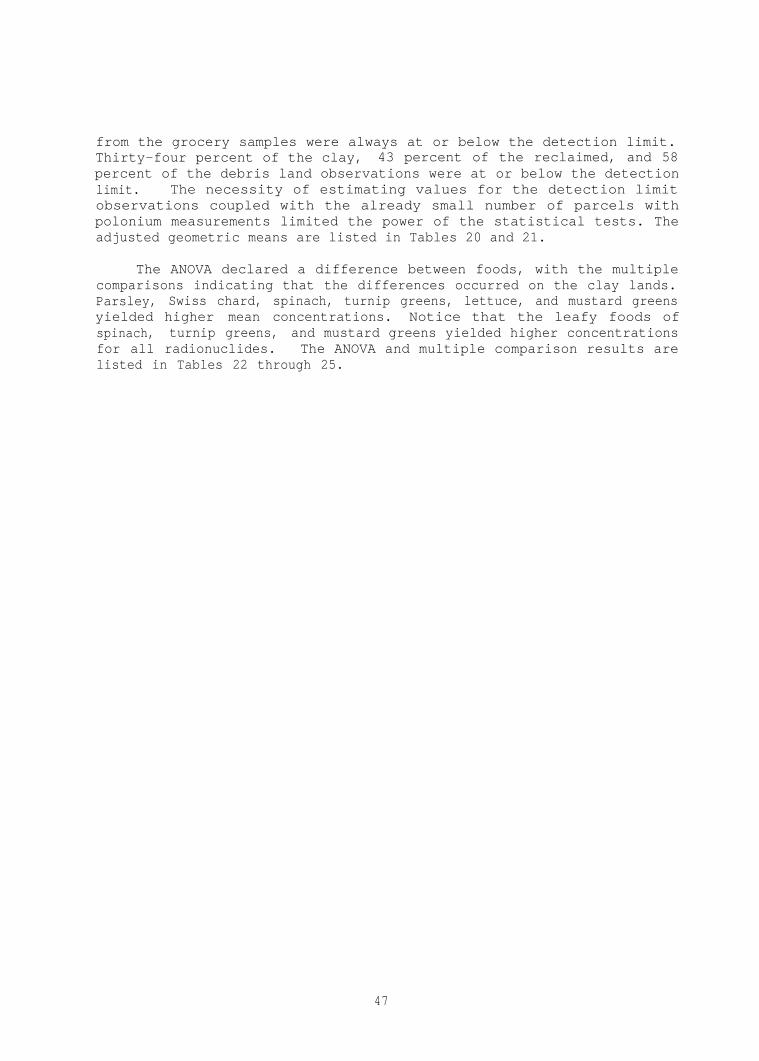
MULTIPLE COMPARISON ANALYSIS FOOD LEAD-210
COMPARE LAND TYPES WITHIN FOOD TYPES
CAUL/BROC NO SIGNIFICANT DIFFERENCES
GENERAL CLAY > RECLAIMED GROCERY > RECLAIMED2
LEAFY NO SIGNIFICANT DIFFERENCES
ROOTS/TUBERS NO SIGNIFICANT DIFFERENCES
SEEDS/GRAINS GROCERY > RECLAIMED CONTROL > RECLAIMED1 CLAY > RECLAIMED
'Significant at 0.02 level 2Significant at 0.05 level
TABLE 17
MULTIPLE COMPARISON ANALYSIS FOOD LEAD-210
COMPARE FOOD TYPES WITHIN LAND TYPES
DEBRIS NO SIGNIFICANT DIFFERENCES
CLAY LEAFY > ROOTS/TUBERS SEEDS/GRAINS > ROOTS/TUBERS CAUL/BROC > ROOTS/TUBERS GENERAL > ROOTS/TUBERS2
RECLAIMED NO SIGNIFICANT DIFFERENCES
GROCERY NO SIGNIFICANT DIFFERENCES
CONTROL NO SIGNIFICANT DIFFERENCES
'Significant at 0.02 level 2Significant at 0.05 level
43

TABLE 18
MULTIPLE COMPARISON ANALYSIS FOOD LEAD-210
COMPARE LAND TYPES WITHIN FOODS
CABBAGE DEBRIS > CLAY
MUSTARD GREENS CLAY > DEBRIS
YELLOW CORN GROCERY > RECLAIMED CLAY > RECLAIMED1
ALL OTHERS NO SIGNIFICANT DIFFERENCES
'Significant at 0.02 level
44

TABLE 19
MULTIPLE COMPARISON ANALYSIS FOOD LEAD-210
COMPARE FOODS WITHIN LAND TYPES
CLAY
DEBRIS SPINACH CABBAGE LETTUCE BROCCOLI TURNIP GREENS COLLARD GREENS TURNIP ROOT
SWISS CHARD
SPINACH
TURNIP GREENS
PARSLEY
RICE STRAWBERRIES COLLARD GREENS MUSTARD GREENS
OKRA
YELLOW CORN LETTUCE BROCCOLI
> > > > > > >
>
>
>
>
> > > >
>
> > >
MUSTARD GREENS CARROTS2, MUSTARD GREENS MUSTARD GREENS MUSTARD GREENS MUSTARD GREENS MUSTARD GREENS MUSTARD GREENS2
CABBAGE, TURNIP ROOT, CARROTS, YELLOW SQUASH
CABBAGE2, TURNIP ROOT, CARROTS, YELLOW SQUASH
CABBAGE, TURNIP ROOT, CARROTS, YELLOW SQUASH
CABBAGE2, TURNIP ROOT, CARROTSl, YELLOW SQUASH
TURNIP ROOT, CARROT+, YELLOW SQUASH TURNIP ROOTI, CARROTSl, YELLOW SQUASH1 TURNIP ROOTl, CARROT+, YELLOW SQUASH CABBAGE, TURNIP ROOT, CARROTS, YELLOW SQUASH TURNIP ROOT2, CARROTS2,
YELLOW SQUASH2 YELLOW SQUASH2 TURNIP ROOT, CARROTS2, YELLOW SQUASH' TURNIP GREENS2, TURNIP ROOTl,
CARROTS2, YELLOW SQUASH1
RECLAIMED
GROCERY
CONTROL
NO SIGNIFICANT DIFFERENCES
YELLOW CORN > CUCUMBERl, CARROTS1 STRAWBERRIES > CUCUMBER2, CARROTS2, POTATOES > CUCUMBER2, CARROTS2
NO SIGNIFICANT DIFFERENCES
'Significant at 0.02 level 2Significant at 0.05 level
45

Table 16 shows that the seeds/grains foods grown on control and clayland and from the grocery store samples have a significantly higher levelof lead content than seeds/grains foods grown on reclaimed land. However,the validity of this result is questionable, since the number of reclaimedand control observations was small, and most were at or below thedetection limit. The significant difference between grocery store andreclaimed lands for the general food type is at the 0.05 significancelevel, and is therefore even more questionable than the seeds and grainsresult.
Table 17 shows that food types grown on clay lands yield significantdifferences, with the roots/tubers food type ranking significantly lowerthan all others. Table 18 gives the significant comparisons between landsfor a given food. Cabbage, mustard greens, and yellow corn yieldsignificantly different levels of lead when grown on the various landtypes. The significant comparisons are few and reveal no overall pattern.
Table 19 lists the significant comparisons between foods for a givenland. The food differences of significance were found mainly on thedebris and clay lands. Remember that for lead-210, only a limited numberof food samples were available from reclaimed lands and that nomeasurements were available from mineralized lands.
Examination of Table 19 reveals that among foods grown on debrisland, spinach, cabbage, lettuce, broccoli, turnip greens, collard greens,and turnip roots exhibit higher levels of lead than mustard greens. Thisfinding is of limited value, however, since it is based on only onemustard green sample.
Many foods grown on clay lands yielded significant differences.Notice that spinach, turnip greens, collard greens, lettuce, and broccoliagain exhibit higher levels of lead-210. Interestingly, turnip roots,carrots, and yellow squash exhibit significantly lower levels and mustardgreens significantly higher levels. The significant differences betweenfoods from the grocery store samples are all at the 0.02 and 0.05significance levels, and therefore are not discussed in any furtherdetail.
Any summary of the lead results should be made with care since thenumber of samples was limited, producing a design that was extremelyunbalanced. However, some patterns did emerge from the lands and foodssampled in this study. The clay lands exhibited significantly lowerconcentrations of lead for the roots/tubers foods versus all other foodtypes. This result is supported by the specific food comparisons ofturnip roots and carrots.
Polonium-210
The measurements of polonium-210 in foods were limited to grocerystore, clay, debris and some reclaimed and control lands (no mineralizedobservations). The polonium-210 levels in food grown on control lands and
46
from the grocery samples were always at or below the detection limit.Thirty-four percent of the clay, 43 percent of the reclaimed, and 58percent of the debris land observations were at or below the detectionlimit. The necessity of estimating values for the detection limitobservations coupled with the already small number of parcels withpolonium measurements limited the power of the statistical tests. Theadjusted geometric means are listed in Tables 20 and 21.
The ANOVA declared a difference between foods, with the multiplecomparisons indicating that the differences occurred on the clay lands.Parsley, Swiss chard, spinach, turnip greens, lettuce, and mustard greensyielded higher mean concentrations. Notice that the leafy foods ofspinach, turnip greens, and mustard greens yielded higher concentrationsfor all radionuclides. The ANOVA and multiple comparison results arelisted in Tables 22 through 25.
47

TABLE 20
POLONIUM-210 IN FOODS (pCi/kg)ADJUSTED GEOMETRIC MEANSBY LAND TYPE AND FOOD TYPE
FOOD CONTROLTYPE LAND
GROCERYSAMPLES
MINERALIZED UNMINED RECLAIMED CLAY DEBRISLAND LAND LAND LAND LAND
CAUL/BROC 0.500000 3.35703 0.500000
LEAFY 0.500000 5.07806 2.59916
SEEDS/GRAINS 0.500000 0.500000 0.500000 1.62122 1.72190
ROOTS/TUBERS 0.500000 2.05100 1.32041 1.07983
GENERAL 0.500000 0.606995 0.962892

TABLE 21
POLONIUM-210 IN FOODS (pCi/kg)ADJUSTED GEOMETRIC MEANS
BY LAND TYPE AND SPECIFIC FOOD
FOODTYPE FOOD
CONTROL GROCERY MINERALIZED UNMINED RECLAIMED CLAY DEBRISLAND SAMPLES LAND LAND LAND LAND LAND
CAUL/BROC BROCCOLI 0.500000 3.35703 0.500000CAULIFLOWER
LEAFY CABBAGECOLLARD GREENSLETTUCEMUSTARD GREENSPARSLEYSPINACHSWISS CHARDTURNIP GREENS
0.5000000.500000
SEEDS/GRAINS LIMA BEANSPEASRICEYELLOW CORN
0.5000000.500000
0.500000 0.500001.62122 5.92986
ROOTS/TUBERS CARROTSRADISHPOTATOESTURNIP ROOT
0.500000 1.76106 2.33206
0.500000 2.051000.500000 1.21612 0.50000
0.7368 1.33450.5000 0.72577.5659 5.99635.3938 13.4870
34.156019.5702 28.197022.400418.8863 0.5000
GENERAL CUCUMBER 0.500000EGGPLANTGREEN BEANS 0.500000GREEN PEPPEROKRA 1.07238ONIONSSTRAWBERRIES 0.500000TOMATO 0.500000WATERMELONYELLOW SQUASH 0.500000 0.736885 0.91241ZUCCHINI 0.500000
49
TABLE 22
MULTIPLE COMPARISON ANALYSIS FOOD POLONIUM-210
COMPARE LAND TYPES WITHIN FOOD TYPES
LEAFY CLAY > GROCERY2
ALL OTHERS NO SIGNIFICANT DIFFERENCES
'Significant at 0.02 level 2Significant at 0.05 level
TABLE 23
MULTIPLE COMPARISON ANALYSIS FOOD POLONIUM-210
COMPARE FOOD TYPES WITHIN LAND TYPES
DEBRIS NO SIGNIFICANT DIFFERENCES
CLAY LEAFY > ROOTS/TUBER@, GENERAL2
RECLAIMED NO SIGNIFICANT DIFFERENCES
GROCERY NO SIGNIFICANT DIFFERENCES
CONTROL NO SIGNIFICANT DIFFERENCES
'Significant at 0.02 level 2Significant at 0.05 level
50

TABLE 24
MULTIPLE COMPARISON ANALYSIS FOOD POLONIUM-210
COMPARE LAND TYPES WITHIN FOODS
TURNIP GREENS CLAY > DEBRIS'
ALL OTHERS NO SIGNIFICANT DIFFERENCES
'Significant at 0.02 level
TABLE 25
MULTIPLE COMPARISON ANALYSIS FOOD POLONIUM-210
COMPARE FOODS WITHIN LAND,TYPES
DEBRIS NO SIGNIFICANT DIFFERENCES
CLAY PARSLEY > CARROTS2, TURNIP ROOTI, YELLOW SQUASH2, CABBAGE, COLLARD GREENSI, RICE'
SWISS CHARD > TURNIP ROOT2, CABBAGEl, COLLARD GREENS2, RICE2
SPINACH > TURNIP ROOT2, CABBAGEl, COLLARD GREENS2, RICE2
TURNIP GREENS > CARROTS1, TURNIP ROOT, OKRA2, YELLOW SQUASH2, CABBAGE, COLLARD GREEN+, RICE'
LETTUCE > CABBAGE2 MUSTARD GREENS > TURNIP ROOT2, CABBAGE
RECLAIMED NO SIGNIFICANT DIFFERENCES
GROCERY NO SIGNIFICANT DIFFERENCES
CONTROL NO SIGNIFICANT DIFFERENCES
bignificant at 0.02 level 2Significant at 0.05 level
51

REGRESSION ANALYSIS INTRODUCTION
The intent of the regression analysis is to determine whether thefood concentration content can be modeled as a function of the soilparameters, the land type, and the food type. Ideally, the value of theconcentration in food could be projected by knowing only the soilcharacteristics and the food type.
A multiplicative model is postulated, which means that changes in thelevel of food concentration occur as multiples of changes in soilparameters. For example, a multiplicative model relating food radium tosoil radium has the form:
Food Radium = a x (Soil Radium)b
where a and b are constants to be estimated using available data. This isto be contrasted with the more common additive model, which has the form:
Food Radium = a + b x (Soil Radium)
The multiplicative model is generally more useful in biological andecological modeling. The reasons are several: changes in biologicalparameters are often measured in terms of orders of magnitude, which ismore consistent with multiplicative models. Also, the statistical supportfor multiplicative models is the lognormal distribution, which often moreadequately fits biological parameters than the normal distribution, whichis the support for additive models.
For each of the food radioactivity parameters (radium-226, polonium-210, and lead-210), the regression analysis followed approximately thesame procedure. As an example, using food radium-226 as the dependentvariable, the purpose of the regression analysis was to determine whatother variables (independent variables) were related to food radium-226and what model might best describe that relationship. First, an analysiswas conducted which allowed only soil parameters (such as soil radium-226,pH, cation exchange capacity, etc.) as independent variables if they werestatistically significant. Then the analysis allowed food type and soilparameters to enter the model. A third evaluation allowed only food typeand soil radium-226 as independent variables. Then, a relationship wasinvestigated which involved only food type and land type as theindependent variables. Finally, food type, land type, and soil parameterswere allowed to enter the model.
This procedure was repeated for polonium-210 and lead-210. Eachanalysis generated a family of equations which can be used to estimatefood radioactivity concentrations for a variety of food types, land types,and soil parameters. It must be noted that the models which are presentedare only a few of those which can be generated from the data. Also, themodels are based on the specific data collected in this study, mostly from
52

clay lands. Care must be exercised if they are used for foods, lands, orother parameters which are different from those specifically sampled inthis study.
Radium-226 Results
A total of 88 observations were available for this analysis. Eachobservation includes measurements on the following parameters: food andsoil radium (radium-226), food and soil polonium (polonium-210), food andsoil lead (lead-210), cation exchange capacity (CEC), organic matter (OM),potassium (K), magnesium (Mg), calcium (Ca), pH, and hydrogen (H).
The radium measurements were made on 29 foods planted on 5 types ofland. The matrix in Table 26 shows the number of measurements for eachfood and land type. Notice that the majority of the measurements weremade on the clay lands and leafy foods.
Simple Correlations
The simple correlation matrix for the logarithmic transforms(consistent with the multiplicative model assumption) of food radium andsoil parameters is shown in Table 27. The letter "L" preceding aparameter refers to the logarithm of the parameter. That is, L CEC refersto the logarithm of cation exchange capacity. Note that the simplecorrelation of food and soil radium is at 0.54, which is higher than anyother soil parameter's correlation with food radium. The value isespecially remarkable in light of the fact that this simple correlationdoes not take either the food or land type explicitly into account. Otherstatistically significant positive simple correlations with food radiuminclude: potassium (0.32), pH (0.46), magnesium (0.31), calcium (0.25)and CEC (0.24). Two parameters are significantly negatively correlatedwith food radium: hydrogen (-0.34) and organic matter (-0.34).
Many of the soil parameters are significantly intercorrelated,indicating a kind of statistical "redundancy" in the parameters. Thismeans that one must be cautious in the interpretation of the regressionresults: the fact that one soil parameter is excluded from a model doesnot necessarily imply that it is uncorrelated with the food radium. Theintercorrelations may indicate that another parameter with which theexcluded parameter is highly correlated is acting as its proxy in themodel. For example, because soil radium content is so closely correlatedwith land type, the land type might replace soil radium in the model.
Stepwise Regression
A number of stepwise regression procedures were utilized to ascertainthe models with the most power in this sample of 88 observations. Anymodel determined using stepwise regression may be significantly alteredif a different sample is used; stepwise regression is most useful as ascreening device to determine those factors most highly correlated withthe dependent variable, food radium. One also learns about theintercorrelations among the parameters as the model becomes more complex.
53
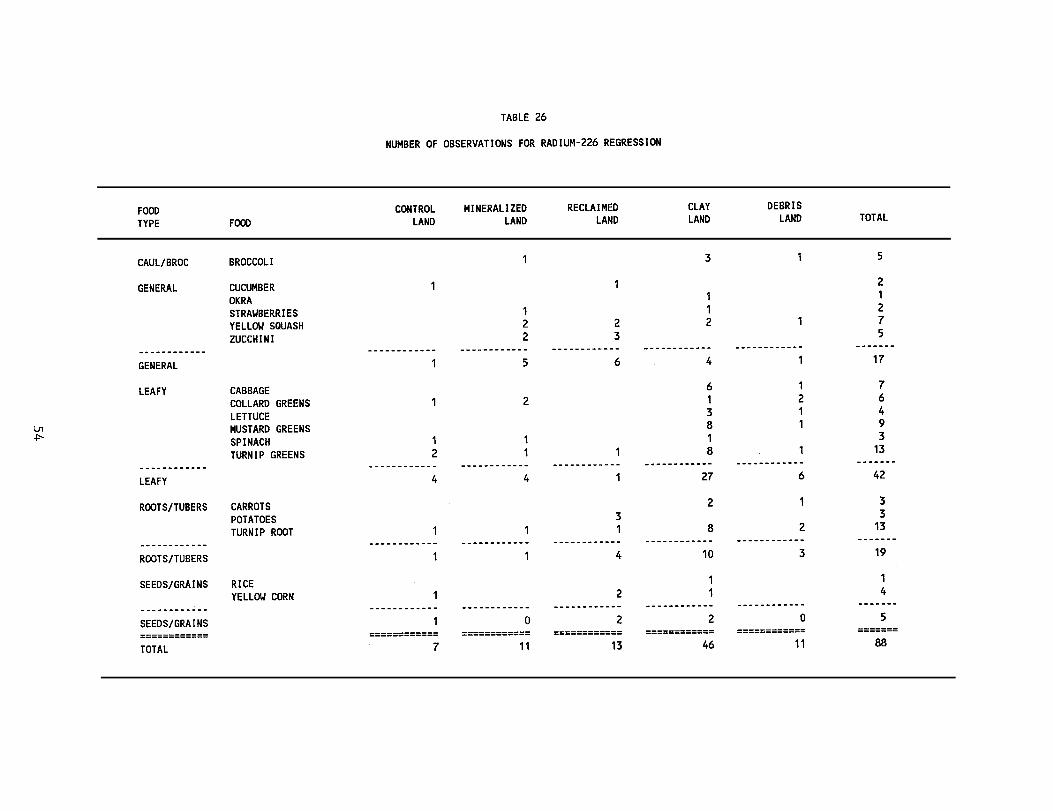
54


Any parameter that was statistically significant at the 0.15 levelwas admitted to the model. As soon as no new parameter can be added tothe model at that level of significance, the variable selection stops.Note that a parameter may enter the model at an early step, and later beeliminated because its significance has dropped below the 0.15 level.This happens because different combinations of the intercorrelatedparameters may result in dramatic changes in the pairwise relationshipsbetween food radium and any one parameter in the model.
Since pH is a function of hydrogen, hydrogen was not allowed to enterthe stepwise regressions models. It was determined that of the two, pHwas not only a better indicator of soil chemistry but also a more commonlymeasured parameter.
Soil Parameter Model
The first stepwise regression relates the food radium to the soilparameters, without regard to the food or land type. Table 28 shows thattwo parameters were significant: soil radium and pH. The estimated modelis
ln(FRa) = 0.37 + 0.39 x ln(SRa) + 0.29 x pH + error
where FRa is the level of radium-226 in the food, and SRa is the level ofradium-226 in the soil. Converting this logarithmic equation to thecorresponding multiplicative model, the estimated model for calculatingthe radium-226 level in food becomes:
FRa = 1.45 x SRa0.39 e 0.29 x pH x error
where e = 2.71828..., the so called "natural number." The error term onthe end of the model is included as a reminder that this equation is anestimate based on 88 sample points, and that the use of the model forestimating levels of food radium must be accompanied by a recognition ofthe potential error associated with such estimates.
The implication of this model is that food radium increases inproportion to roughly the square root of soil radium, and increases byadditional pH in the soil, all other things held constant. This lastphrase is an important constraint, since we have seen from the simplecorrelation matrix that the soil parameters are highly intercorrelated,implying that most of them vary together (either directly or inversely),so that "all other things held constant" is not a realistic condition toimpose. Nevertheless, these data indicate that this relationship bestdescribes the overall variation of food radium across all land types.
Figure 9 presents the food to soil radium regression equation,adjusting for the pH parameter in the model. Notice that the food radiumincreases more slowly than the soil radium (approximately as the squareroot), as implied by the regression coefficient between zero and one. Thepresence of the adjusted (to a common pH value) data values allows avisual assessment of the model's fit. The standard error of the model is
56

TABLE 28
STEPWISE REGRESSIONSOIL PARAMETER MODEL
RADIUM-226
R SQUARE = 0.31923572
DF SUM OF SQUARES MEAN SQUARE F PROB>F
REGRESSION 2 45.08815841 22.54407920 19.93 0.0001ERROR 85 96.14966440 1.13117252TOTAL 87 141.23782281
B VALUE STD ERROR TYPE II SS F PROB>F
INTERCEPT 0.36986332LSRA 0.38935500 0.10707405 14.95725481 13.22 0.0005PH 0.29007117 0.14524722 4.51151425 3.99 0.0490

58
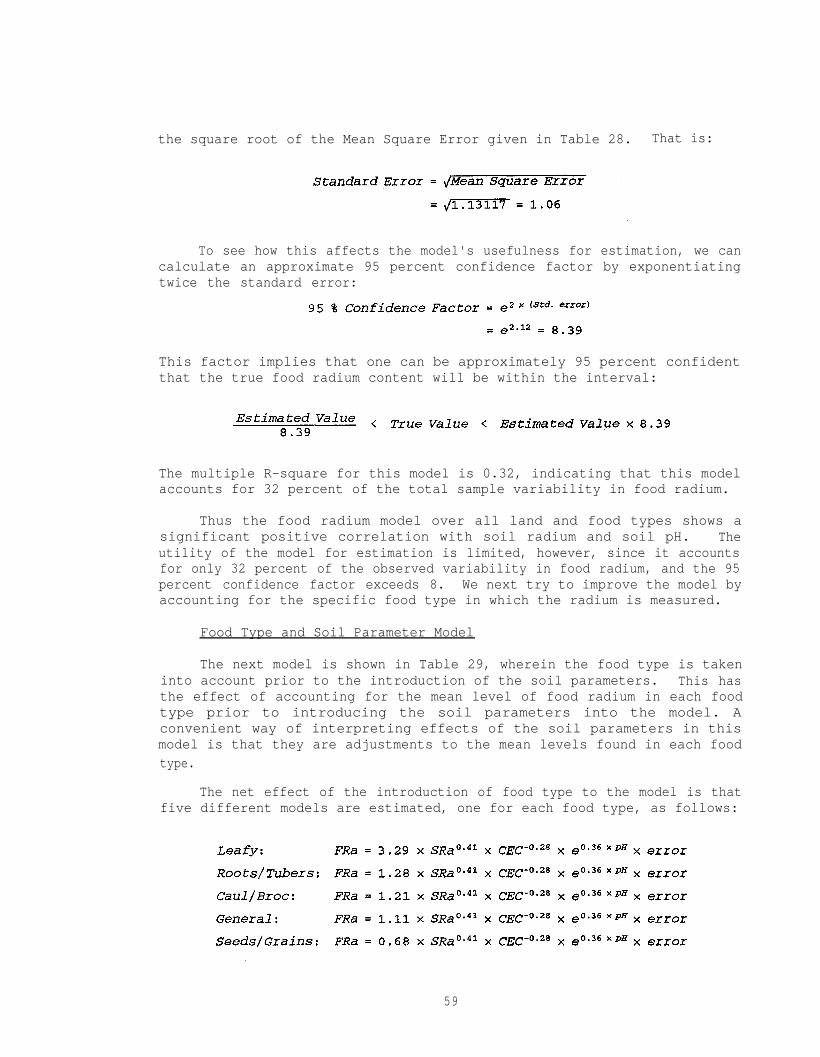
the square root of the Mean Square Error given in Table 28. That is:
To see how this affects the model's usefulness for estimation, we cancalculate an approximate 95 percent confidence factor by exponentiatingtwice the standard error:
This factor implies that one can be approximately 95 percent confidentthat the true food radium content will be within the interval:
The multiple R-square for this model is 0.32, indicating that this modelaccounts for 32 percent of the total sample variability in food radium.
Thus the food radium model over all land and food types shows asignificant positive correlation with soil radium and soil pH. Theutility of the model for estimation is limited, however, since it accountsfor only 32 percent of the observed variability in food radium, and the 95percent confidence factor exceeds 8. We next try to improve the model byaccounting for the specific food type in which the radium is measured.
Food Type and Soil Parameter Model
The next model is shown in Table 29, wherein the food type is takeninto account prior to the introduction of the soil parameters. This hasthe effect of accounting for the mean level of food radium in each foodtype prior to introducing the soil parameters into the model. Aconvenient way of interpreting effects of the soil parameters in thismodel is that they are adjustments to the mean levels found in each foodtype.
The net effect of the introduction of food type to the model is thatfive different models are estimated, one for each food type, as follows:
59

TABLE 29
STEPWISE REGRESSIONFOOD TYPE AND SOIL PARAMETER MODEL
RADIUM-226
R SQUARE = 0.51190945
DF SUM OF SQUARES MEAN SQUARE F PROB>F
REGRESSION 7 72.30097680 10.32871097 11.99 0.0001ERROR 80 68.93684601 0.86171058TOTAL 87 141.23782281
B VALUE STD ERROR TYPE II SS F PROB>F
INTERCEPT 1.19116934CABR -1.00195069GNRL -1.08756680RTTB -0.94196158SDGR -1.59108891LEFY 0.00000000LSRA 0.40466817LCEC -0.28115977PH 0.35672280
0.44881018 4.29465940 4.98 0.02840.28574106 12.48325998 14.49 0.00030.25823193 11.46589373 13.31 0.00050.44018972 11.25824096 13.06 0.00050.00000000 0.00000000 0.00 1.00000.09809378 14.66481511 17.02 0.00010.12532320 4.33715415 5.03 0.02760.14107654 5.50951784 6.39 0.0134

These models imply that food radium still varies roughly as thesquare root of soil radium. Additionally, food radium appears to decreaseby additional CEC in the soil. Finally, the addition of pH to the soilincreases the amount of radium in the food.
Note that the only difference among the models is that the leadingconstant differs; the exponents of the soil parameters in the model arethe same for all models. This is an assumption associated with this nointeraction model; we will examine interaction models, allowing varyingparameter coefficients and exponents, in a later section. These leadingconstants imply that the leafy vegetables are associated with the highestgeometric mean level of food radium, with all cauliflower/broccoli, rootsand tubers, and general food types significantly less on the average.Seeds and grains exhibit the lowest mean levels.
Figure 10 shows the regression equation for each food type adjustedfor the CEC and pH parameters in the model. Notice how the estimate offood radium depends roughly on the square root of the soil radium, and howthe level of soil radium varies among food types. This model accounts forsignificantly more variability than the previous one, with a model R-square of 51 percent. However, the 95 percent confidence factor is stillrelatively high, at 6.40.
Food Type and Soil Radium
A regression allowing only food type and soil radium in the model isgiven in Table 30. The estimated models are similar to the above, withthe leafy vegetables again associated with the highest geometric meanlevel of food radium and the coefficient for soil radium approximately thesame.
This model is clearly an improvement over the traditional plant:soilratios. The model accounts for 46 percent of the total sample variabilityin food radium, with a 95 percent confidence factor of 6.8.
Food Type and Land Type Model
The stepwise regression relating food radium as a function of onlyfood type and land type is given in Table 31. Since no soil parametersare considered in this model, the estimated models are constants differingby the food and land type times the error term. The constants andtherefore the estimated values are given in Table 32.
61


Table 32
Food-Type/Land-Type ModelRadium-226
Food Type Land Type
Debris Clay Reclaimed Mineralized Control
Leafy 61.58 50.85 20.02 15.62 7.28Caul/Broc 24.26 20.03 7.89 6.15 2.87Roots/Tubers 24.41 20.15 7.94 6.19 2.89General 22.88 18.89 7.44 5.80 2.70Seeds/Grains 19.34 15.97 6.29 4.91 2.29
These results are in general agreement with the ANOVA resultspreviously discussed. The debris lands are associated with the highestgeometric mean levels of food radium, followed closely by the clay lands.The leafy vegetables are again associated with the highest geometric meanlevel of food radium, even when grown on the control lands. The modelaccounts for 50 percent of the total sample variability in food radium,with a 95 percent confidence factor of 6.6. This model accounts for onlyone percent less variability than the food type and soil parameter model.The following food type, land type, and soil parameter model investigatesthe possible correlation between the land type and soil radium content.
Food Type Land Type and Soil Parameter Models
The next regression model takes the mean levels of both food type andland type into account prior to testing the soil parameters for theircontribution to the model. An example of the estimated models is givenbelow for the food type caul/broc, and for all land types. These resultsare derived from the regression analysis given in Table 33 and can beproduced for all food type and land type combinations.
65


The model coefficients reveal about the same results for the foodtype effects. The soil type coefficients reveal that the control sampleshave the lowest average levels of food radium,followed by the mineralizedsamples. The reclaimed samples are next, and the clay and debris samplesare significantly higher than all others. These results are generallyconsistent with the ANOVA results described in previous sections. Threesoil parameters are significant after the food and land type have beentaken into account: organic matter, magnesium, and pH. Interestingly, thesoil radium does not contribute significantly once the soil type has beenintroduced, probably because the land type is a proxy for the soil radiumlevel. That is, because soil radium content is so closely correlated withland type, the land type replaces soil radium in the model. Organicmatter and pH are positively correlated, while the magnesium parameter isnegatively correlated after food and land type are in the model. The R-square value for this model is at 56 percent, with the 95 percentconfidence factor still high at 6.12.
Interaction Models
The previous models have postulated relationships between the amountof food radium found in foods and the various soil parameters found to besignificantly correlated with food radium. Because the soil parameterswere introduced independently of the food type and land type, the abovemodels all tacitly assume that the relationships found between food radiumand the soil parameters are the same for each food and land type. Thatis, although the introduction of food and land type adjusts the level ofthe food radium geometric mean, the slopes of the relationships with thesoil parameters are assumed to be constant across both food and land type.
To determine whether the assumption of constant slopes (in the log-log domain) is reasonable, we must introduce interaction into the models.Interaction terms permit the slopes of the relationships between foodradium and soil parameters to differ for different food and land types.For example, the relationship between food radium and soil radium mightbe stronger (i.e., a greater slope) for leafy vegetables than for otherfood types. This can only be examined by interacting soil radium withfood type.
The first interaction model, shown in Table 34, forces food type intothe model, and then enables stepwise selection from any soil parameter andany of the pairwise interactions between the soil parameters and the foodtypes. Examination of the selected variables reveals that soil radium andpH again appear in the model, with food radium still varying approximatelyas the square root of each. Soil radium and pH do not appear in the modelwith an interaction term indicating the same positive relationship for allfood types.
Cation exchange capacity, organic matter, and magnesium appear in themodel with interaction terms. The CEC soil parameter is presentinteracting with the caul/broc food type (LCECCABR). CEC has a negativecorrelation with food radium for caul/broc.
67


The roots/tubers food type is present in an interaction term withorganic matter (LORGRTTB). Organic matter has a positive correlation withfood radium for roots/tubers.
Two magnesium interactions are present in this model. The first withthe leafy food type reveals a negative relationship between food radiumand magnesium (LMGLEFY), and the second also shows a negative relationshipbetween these parameters for the seeds/grains food type (LMGSDGR). Thus,the relationship between radium in the food and magnesium in the soildepends on the food type. This model has an overall R-square of 58percent, with a 95 percent confidence factor of 5.8.
A second interaction model is presented in Table 35. In this modelboth food type and land type are forced into the model prior to theintroduction of the interaction between the soil parameters and the foodtypes. As in the similar non-interaction model (Table 33), no soil radiumterms are found significant. Again, the land types apparently act as asufficient proxy for this parameter.
Magnesium and pH now appear with interaction effects while organicmatter is introduced having the same positive correlation over all foodand land types. Magnesium is significantly positively correlated withfood radium for the general food type and negatively correlated for theleafy food type, as in the previous interaction model. The leafy foodtype also interacts with pH, being significantly positively correlatedwith food radium. The model's R-square is 60 percent, with a 95 percentconfidence factor of 5.7.
Great care must be exercised in the interpretation of theseinteraction models. The introduction of interaction terms creates evenmore intercorrelation among the parameters, and thus increases thepossibility of redundancy and substitutability of variables. It is oftentempting to over-interpret these somewhat complex models, assuming thatterms not included are unimportant. Therefore, these interaction modelsare not necessarily used for the estimation of radium in food, but for theinvestigation of the relationship between food radium and the soilparameters dependent upon the food type.
Calcium Models
Soil calcium is generally considered to have a significant, negativeinfluence on the uptake of radium-226 by plants. Surprisingly, in theanalysis of the data from this study, soil calcium was not found to bestatistically significant in the stepwise regression analyses. It ispossible that the calcium effect is proxied by some other parameter.Because it is generally accepted that calcium does indeed affect radiumuptake, an analysis was conducted which forced it into a food type model.This analysis suggests that soil calcium has a negative influencecomparable in magnitude to soil magnesium. The model is shown in Table36. The regression equations are as follows:
69


Both calcium and magnesium appear in the model at relatively highsignificance levels of 0.14 and 0.15, respectively. The coefficients areboth negative with food radium appearing to decrease by additional calciumand magnesium in the soil. Soil radium and pH are highly significant atthe 0.01 level, with organic matter significant at 0.08. This modelaccounts for approximately the same amount of variability as thepreviously discussed models. The R-square is 53 percent, generating a 95percent confidence factor of 6.3.
Discussion
We should examine all the models discussed, and try to see whethercertain patterns repeat often enough to warrant further investigation.First, none of the models has great estimating power. Even the mostcomplex model has a standard error of 0.87, which means that if the modelwere to be used to estimate the level of food radium in some futuresample, the range of potential error would be a factor of 6. That is, anestimation of 8 pCi/kg would have a 95 percent confidence interval ofapproximately 1 to 48. Note also that the model could only be used forsamples drawn from locations similar to those utilized in this study, forfoods grown in this study, and for methods of analysis identical to thoseused in this study.
Despite the failure of the model to provide precise estimations,several interesting patterns emerged from the analysis. The correlationof food radium-226 and soil radium-226 is quite strong, and strongest forleafy foods. The models show that food radium increases in proportion toroughly the square root of soil radium. However, when land type isintroduced into the model first, the soil radium level becomes redundantand is dropped from the model.
The soil parameter pH is always found in the model, with thecorrelation consistently being positive with food radium. The modelsimply that with the addition of pH, the food radium concentrationincreases. Organic matter, magnesium,and cation exchange capacity alsoappear in several models,with organic matter always positively correlatedwith food radium. Both of the stepwise interaction models show asignificant negative correlation between magnesium and food radium for theleafy food type.
72

Lead-210 Results
A total of 62 observations were available for the lead-210 analysis.The matrix in Table 37 shows the number of measurements for each food andland type. Notice that there are no measurements for the control andmineralized lands and that the majority of the measurements were of leafyfoods on clay lands. This limits the usefulness of the lead-210 modelssince they are based on a narrow range of lead results.
Simple Correlations
The simple correlation matrix for the logarithmic transforms of foodlead and soil parameters is shown in Table 38. The simple correlation offood and soil lead is at 0.29, the only statistically significantcorrelation between food lead and the soil parameters. The other soilparameter with a correlation exceeding 0.1 (in absolute value) is organicmatter at -0.13.
Stepwise Regression
The regression methodology used for the analysis of lead was the sameas that used for the radium analysis. That is, the same models have beenanalyzed and are discussed in the following sections.
Soil Parameter Model
The first stepwise regression relates food lead to the soilparameters, without regard to the food or land type. Table 39 shows thatonly soil lead was significant at the 0.15 level. The estimated model is
The model shows a significant positive relationship between food leadand soil lead. The slope is positive, as was indicated by the simplecorrelation. This model also indicates that as soil lead increases, sodoes lead in the food, roughly a one-to-one correspondence. The R-squarefor this model is 0.08, indicating that only 8 percent of the total samplevariability of the lead measurements is accounted for by this simplemodel. The use of this model is extremely limited since the modelaccounts for only 8 percent of the observed variability in food lead, andthe 95 percent confidence factor is 30.
Figure 11 gives the regression equation in the log domain. Noticethe clustering of the soil lead values between 2.5 and 4.0. Thisillustrates the fact that the soil lead samples are primarily from theclay lands. Therefore the regression models will be limited since thevariability in the soil lead reflects samples from clay lands only and theresults are limited in range.
73


Figure 11
SOIL PARAMETER MODELFood Lead-210 (pCi/kg) vs Soil Lead-210 (pCi/g)
Log Domain

Food Type and Soil Parameter Model
The next model is shown in Table 40, wherein the food type is takeninto account prior to the introduction of the soil parameters.Examination of Table 40 reveals that after food type has been taken intoaccount, no soil parameters are statistically correlated with food lead.The model coefficients imply that the leafy vegetables are associated withthe highest geometric mean level of food lead. This finding is inagreement with the food type and soil parameter model for radium. Thecaul/broc food type has the next highest geometric mean level of foodlead, with the seeds and grains next, and the general and roots/tubersfood types having the lowest mean levels of food lead. The model's R-square is 38 percent with a 95 percent confidence factor of 18.
Food Type and Soil Lead
A regression allowing only food type and soil lead in the model isgiven in Table 41. We know from the previous regression that the soillead effect will not be significant at the 0.15 level. Investigation ofTable 41 shows that soil lead is significant at the 0.29 level. Theestimated models are:
These models imply that food lead varies roughly as the square rootof soil lead. The leading constants imply that leafy vegetables areindeed associated with the highest geometric mean level of food lead.This model accounts for 39 percent of the variability, only one percentmore than the previous model. The 95 percent confidence factor is stillhigh at 17.
Food Type and Land Type Model
The stepwise regression relating food lead as a function of only foodtype and land type is given in Table 42. Since no soil parameters areconsidered in this model, the estimated models are constants differing bythe land and food type times the error term. The constants and thereforethe estimated values are given in Table 43.
78


Table 43
Food-Type/Land-Type ModelLead-210
Food Type Land Type
Debris Clay Reclaimed Mineralized Control
Leafy 41.04 27.92 3.82 - -Caul/Broc 29.84 20.30 2.78 - -Seeds/Grains 22.05 15.00 2.05 - -General 8.05 5.48 0.75 - -Roots/Tubers 4.66 3.17 0.43 - -
These results are in general agreement with the ANOVA resultspreviously discussed. The leafy food type again exhibits the highestgeometric mean level of food lead. The land type coefficients reveal thatdebris has the highest average level of food lead, followed by clay, andthen reclaimed. Remember that there are no measurements on control andmineralized lands. The R-square for this model is 45 percent, with a 95percent confidence factor of 16.
Food Type, Land Type, and Soil Parameter Model
The next regression model takes the mean levels of both food type andland type into account prior to testing the soil parameters for theircontribution to the model (Table 44). No soil parameters were significantafter taking the food and land type into account. Notice that this modelis identical to the previously discussed food type and land type model.
Interaction Models
The first interaction model, shown in Table 45, forces food type intothe model, and then enables stepwise selection from any soil parameter andany of the pairwise interactions between the soil parameters and the foodtypes. Examination of Table 45 reveals that several interaction terms aresignificantly correlated with food lead. Two terms in the model areinteractions with the soil parameter organic matter: leafy (positive) androots/tubers (negative). Potassium is found to have a negativecorrelation with food lead for the caul/broc food type. This interactionas well as the organic matter interactions have significance levelsexceeding 0.10, suggesting the results may be an anomaly of the data.Magnesium enters the model, having a positive correlation with food leadfor the general and seeds/grains food types. The soil parameter pH isalso found to have a negative correlation for the general food type. Theother significant parameter in the model is the interaction of cation
82


exchange capacity (CEC) with the roots/tubers. CEC has a negativerelationship with food lead for this food type. The model's R-square is62 percent, with a 95 percent confidence factor of 11.
A second interaction model is presented in Table 46. Both food typeand land type are forced into the model prior to the introduction of theinteraction terms. CEC, organic matter, potassium, and magnesium againenter the interaction model. CEC has a positive correlation with theseeds/grains food type and potassium has a negative correlation with thecaul/broc foods. However, both of these effects are significant at the0.12 and 0.14 levels, respectively. Organic matter and magnesium appearas in the previous regression model, this time with both being positivelycorrelated with the general food type. The only other significant term inthe model indicates a negative relationship between calcium and food leadfor the roots/tubers. The model's R-square is 59 percent, with a 95percent confidence factor of 12.
Calcium Models
As discussed above, calcium is generally considered to have an effecton the uptake of radioactivity by foods. While this effect is believed tobe strongest for radium uptake, a regression analysis was also conductedfor food lead with soil calcium being forced as an independent variable.Since the majority of the samples were drawn from clay lands, thisrelationship of food to soil lead was investigated for this land typeonly. The relationship between food lead and the soil parameters of lead,pH, organic matter, and calcium gave the following estimated models:
The regression coefficient suggests that food lead varies roughly asthe square root of soil lead (see Table 47). However, this relationshipis not statistically significant at the 0.15 level. pH, organic matter,and calcium are significant at the 0.05, 0.06, and 0.17 levels,respectively. Notice that pH and calcium were not significant at the 0.15level in the food type and soil lead model previously discussed. Thiscould be due to either the fact that this model is based solely on clayland values or due to the possible multicollinearity of the independentvariables. The possibility of multicollinearity is emphasized by theeffect of adding magnesium to this model. Once magnesium is added, thesignificance of organic matter and calcium is much less. This furtherillustrates the caution needed in the interpretation of these exploratorymodels.
85


Discussion
The complex regression models for lead account for a significantamount of variability. However, interpretation of these results shouldbe made with extreme caution, since it is tempting to infer too much fromthese complex models, especially when there are several significantinteraction terms. It is also easy to forget that the sample isconcentrated on the clay lands, with some debris samples, and very fewfrom reclaimed lands.
Food and soil lead contents are positively correlated, although thestrength of the correlation does not approach that for radium levels. Theestimated values based on even the best interaction model would have 95percent confidence intervals indicating potential variability by a factorof 11.
Polonium-210 Results
A total of 51 observations were available for the polonium-210analysis. The matrix in Table 48 shows the number of measurements foreach food and land type. The design matrix is almost identical to thematrix for lead-210. There are no measurements for control andmineralized lands and the majority of the measurements were made of leafyfoods on clay lands.
Simple Correlations
The simple correlation matrix for the logarithmic transforms of foodpolonium and soil parameters is shown in Table 49. Note that the simplecorrelation of food and soil polonium is not statistically significantwith a correlation coefficient of 0.02. No soil parameters show anystatistically significant correlation with polonium in the food; however,the two highest are: pH (0.15) and calcium (0.08).
Stepwise Regression
The regression methodology used for the analysis of polonium was asin the above discussion for radium and lead. The same models werepostulated, and the results are discussed in the following sections.
Soil Parameter Model
The first stepwise regression relates food polonium to the soilparameters, without regard to the food or land type. There were no soilparameters significant at the 0.15 level to allow admittance to the model.Thus, these data reveal no ability to estimate the polonium concentrationin the food based on the soil radioactivity concentration and soilchemistry.
88

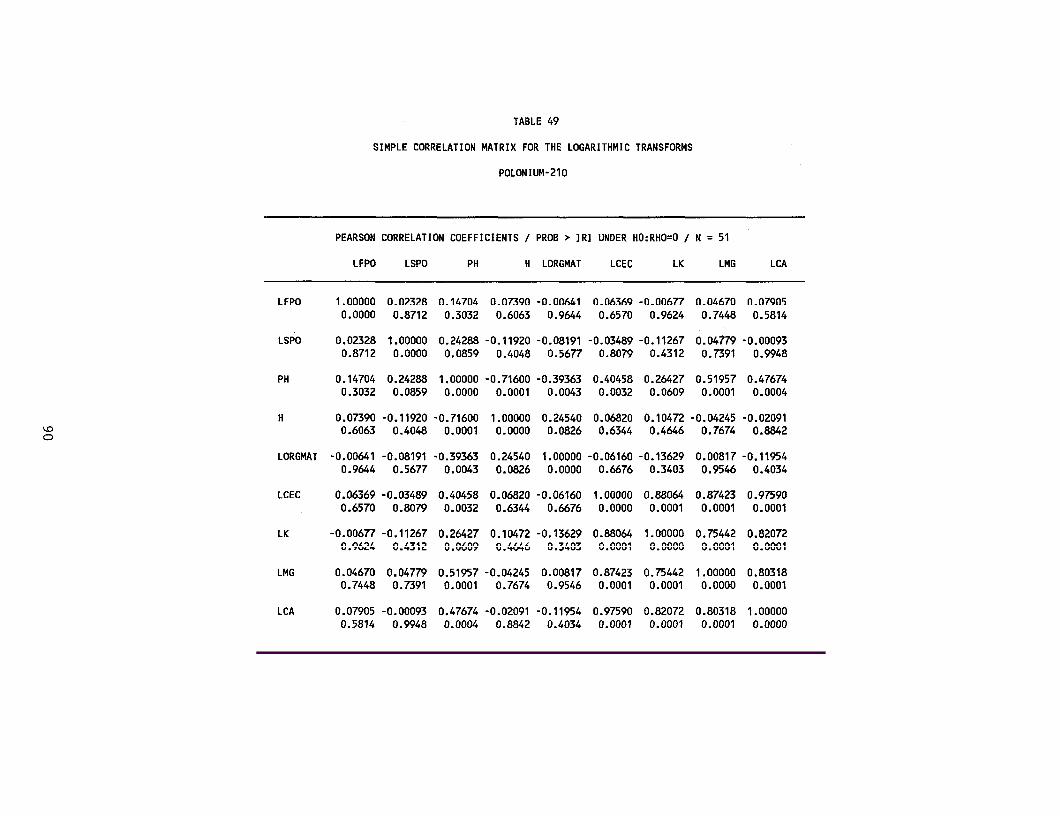

Food Type and Soil Parameter Model
Examination of the model in Table 50 reveals that after food type hasbeen taken into account, no soil parameters are statistically correlatedwith food polonium. The model coefficients infer that the leafyvegetables are associated with the highest geometric mean level of foodpolonium (as in food radium), with all other food types significantly lesson the average. The general and roots/tubers food types exhibit thelowest mean levels. The model's R-square is 0.15, indicating that only15 percent of the polonium variability is accounted for by food type. The95 percent confidence factor is 20. The model is not statisticallysignificant at the 0.1 level, thus providing insufficient evidence toinfer that the differences among the geometric means for the six foodtypes are real.
Food Type Land Type and Soil Parameter Model
The next regression model takes the mean levels of both food type andland type into account prior to testing the soil parameters for theircontribution to the model (Table 51). The leafy food type again exhibitsthe highest geometric mean level of food polonium. The soil typecoefficients reveal that clay has the highest average level of foodpolonium, followed by reclaimed, and then debris. Remember that there areno measurements on control and mineralized lands. It is interesting thatpotassium is significant after the food and land type effect have beentaken into account. Potassium is negatively correlated with foodpolonium. The R-square for this model is only 22 percent, and the modelas a whole is not statistically significant. The 95 percent confidencefactor drops slightly to 19.5.
Interaction Models
The first interaction model, shown in Table 52, forces food type intothe model, and then enables stepwise selection from any soil parameter andany of the pairwise interactions between the soil parameters and the foodtypes. Examination of Table 52 reveals that several interaction terms aresignificantly correlated with food polonium. Two terms in the model areinteractions with the leafy food type: organic matter (positive) and pH(positive). Organic matter is also significantly positively correlatedwith food polonium for the caul/broc food type. This model accounts forslightly more variability than the previous one, with a model R-square of29 percent, and the model is statistically significant. The 95 percentconfidence factor is 17. Clearly, variable interactions play an importantrole in the determination of food polonium.
A second interaction model is presented in Table 53. Both food typeand land type are forced into the model prior to the introduction of theinteraction terms. No interactions entered the model at the requiredsignificance level. Therefore, the model is identical to the food type,land type, and soil parameter model in Table 51.
91


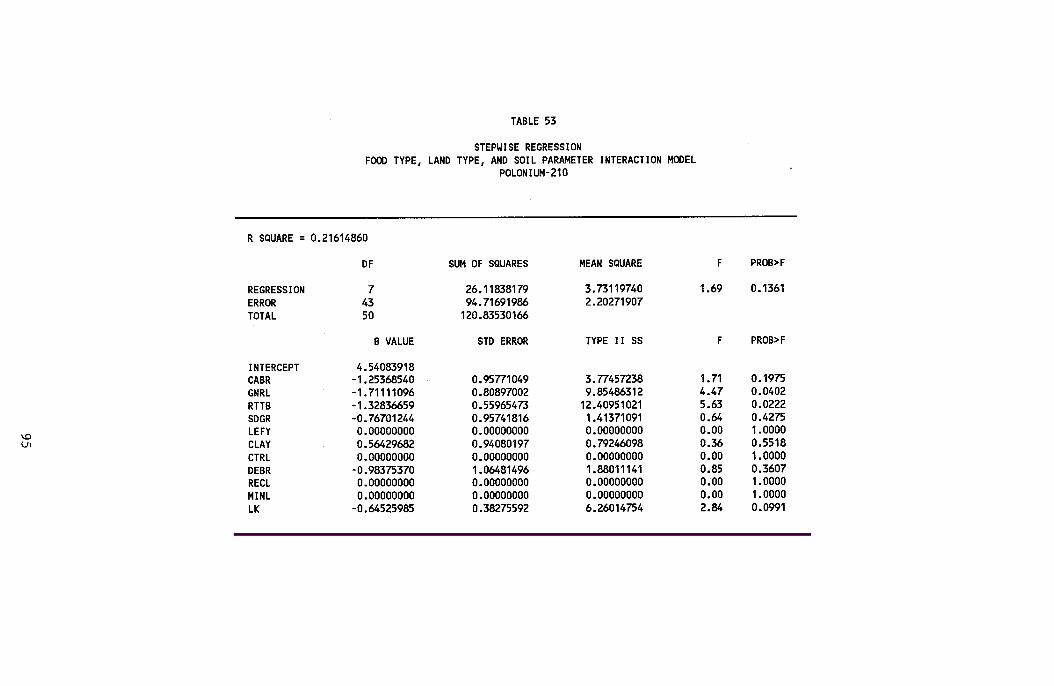
Discussion
The results of the polonium regression analysis should be viewed withcaution. The modeling process was limited by the small number ofobservations, with the majority of these observations being leafy foodson clay lands.
The correlation of food and soil polonium is very weak. Organicmatter and pH are significantly correlated with food polonium for theleafy foods in the interaction model when adjusted for only food.Potassium was negatively correlated with food polonium after taking intoaccount the food and land type.
96

DATA EVALUATION
CHARACTERISTICS OF THE LAND PARCELS
Radionuclide Characteristics
Measurements of soil radioactivity and soil chemistry are summarizedfor the various land classes in Table 54. The five land classes presentthree major radioactivity concentration categories:
(1) Low (<1 to 2 pCi/g):- Control- Mineralized
(2) Intermediate/Variable (average 5 pCi/g, range 1 to 50 pCi/g):- Reclaimed
(3) Elevated (>10 pCi/g):- Clays- Debris.
Radium-226 analyses were performed on soil samples associated withmost food samples; lead-210 and polonium-210 analyses were performed ona sub-set of soil samples (those collected in the current study). Wherethe data were available, the lead-210/radium-226 and the polonium-210/radium-226 ratios were examined to determine the extent to which theseradionuclides were in radioactive equilibrium, the degree of uniformitywithin a land type, and whether there were differences between land types.If the ratios are relatively constant within land types, then conclusionscan be drawn about the lead-210 and the polonium-210 source presented tothe food, even when only radium-226 data are available.
For the reclaimed lands, the ratio for both radionuclides was on theorder of 80 percent; individual ratios were as low as approximately 50percent and all ratios were less than 100 percent except for one lead-210/radium-226 value of 1.40 for the lowest activity soil (3 pCi/g radium-226) and a single polonium-210/radium-226 value of 1.03 for a soil withmoderately elevated radioactivity (9 pCi/g radium-226).
By contrast, ratios tended to be higher for clay lands and debrislands. Lead-210/radium-226 ratios were on the order of 140 to 150 percentwith only one value less than 90 percent and maximum values approaching300 percent. Polonium-210/radium-226 ratios were on the order of 116percent; four clays and no debris samples had values less than 90 percentand maximum values ranged to nearly 200 percent. Lead-210 and polonium-210 analyses were not performed for control and mineralized lands; ratiosfor these lands types should be comparable to what is generally reportedfor U.S. soils.
From these observations it can be concluded that phosphate mining-related lands that have elevated radium-226 are likely to have elevatedlead-210 and polonium-210 and hence consideration should be given to thesedaughter radionuclides as well as to radium-226. For reclaimed lands, thedaughter nuclides are likely to be present in the soil at levels on the
97
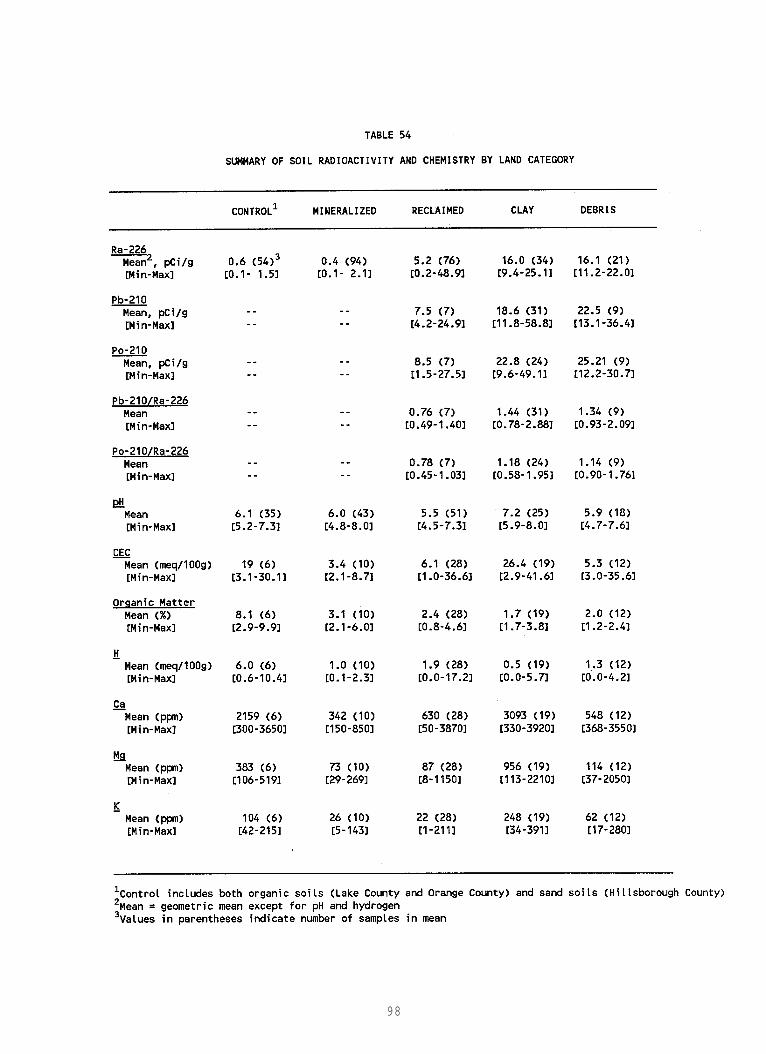
98

order of 80 percent of the radium-226 concentration; while for clay anddebris lands, the daughter radionuclide concentrations are likely toexceed the radium-226 concentration.
Chemical Characteristics
Soil chemistry measurements are also summarized in Table 54. Thevarious land classes present a range of values for the chemicalcharacteristics, thus offering the opportunity to examine the effect ofvarious soil characteristics on the transfer of the several radionuclidesto the plant types studied.
Summary of Radionuclide and Chemical Characteristics
Table 55 presents a descriptive summary of the lands in this study.The values of the chemical characteristics are described as low, medium,and high in the context of the overall range of values observed; this doesnot necessarily represent adequacy or deficiency for plant requirements.
1. Low radioactivity lands (Control and Mineralized) In these lands, soilconcentrations of radium-226 averaged about 0.5 pCi/g and individualsamples ranged from 0.1 to 2.0 pCi/g. All samples from these lands werecollected during the initial study and they were not analyzed for lead-210 and polonium-210; however, concentrations of these radionuclides wouldbe expected to be similar to radium-226 (i.e., in approximate radioactiveequilibrium). These lands exhibited a wide range of organic mattercontent. All five samples from Orange and Lake Counties (presumably mucklands) had organic matter concentrations of 9.9 percent. All the othersamples had much lower concentrations, ranging from 2.1 to 6.0 percent.The values of pH were generally in the slightly acid to neutral range(average 6.0, ranging from 4.8 to 8.0). The two land classes generallyexhibited two levels of cation concentration and CEC:
Control lands:cation concentrations: a wide range of values;
generally medium to high.CEC: generally high.
Mineralized Lands:cation concentrations: generally low.CEC: generally low.
2. Intermediate/variable radioactivity lands (Reclaimed) The average soilradium-226 concentrationwas intermediate (5 pCi/g) but individual samplesresults were highly variable, ranging from low (<1 pCi/g) to elevated (49pCi/g). Lead-210 and polonium-210 were present at comparable levels butat slightly less than equilibrium with the radium-226. Organic matterconcentrations were generally low and pH was in the slightly acid range.
99

TABLE 55
SUMMARY OF LAND CHARACTERISTICS
LOW RADIOACTIVITY LANDS
Ra-226: Low; 0.5 (0.1 to 2.0) pCi/g Pb-210 and PO-210 not measured but expected to be in approximate radioactive
equilibrium with Ra-226. pH: Slightly acid to neutral; 6.0 (4.8 to 8.0).
Control Lands
Organic Matter: Three sites high (9.9%); one low (2.9%) Cations: Wide range; generally medium to high levels.
Ca: 2200 (300 - 3600) ppm High (Low to High) Mg: 380 (110 - 520) ppm Medium K: 100 ( 42 - 210) ppm Medium (Medium to High)
CEC: 19 (3 - 30) meq/lOO g High (Low to High)
Mineralized Lands
Organic Matter: Generally low (2-6%) Cations: Generally low to medium levels.
Ca: 340 (150 - 850) ppm Low (Low to Medium) Mg: 73 ( 29 - 270) ppm Low (Low to Medium) K: 26 ( 5 - 140) ppm Low (Low to Medium)
CEC: 3 (2 - 9) meq/lOO g Low (Low to Medium)
INTERMEDIATE/VARIABLE RADIOACTIVITY LANDS - RECLAIMED LANDS
Ra-226: Intermediate with a wide range; 5 (<l - 49) pCi/g. Pb-210 and PO-210: Generally less than radioactive equilibrium with Ra-226:
Pb-210/Ra-226: 0.8 (0.5 - 1.4) Po-210/Ra-226: 0.8 (0.4 - 1.0)
Organic Matter: Generally low; 1.4 (0.8-4.6)% pH: Generally acid; 5.5 (4.5 - 7.3) Cations: Variable; generally low to medium levels.
Ca: 630 ( 50 - 3900) ppm Medium (Low to High) Mg: 87( 8- 1200) ppm Low (Low to High) K: 22 ( 1 - 210) ppm Low (Low to High)
CEC: 6 (1 - 37) meq/lOO g Medium (Low to High)
100

TABLE 55 (CONTINUED)
SUMMARY OF LAND CHARACTERISTICS
ELEVATED RADIOACTIVITY LANDS
Ra-226: Elevated; 16 (9 - 22) pCi/g Pb-210 and PO-210 generally in excess of radioactive equilibrium with Ra-226:
Pb-210/Ra-226: 1.4 (0.8 - 2.9) Po-210/Ra-226: 1.2 (0.6 - 2.0)
Organic Matter: Low concentrations; (1.7 - 3.8%)
Clav Lands
pH: Acid to neutral: 7.2 (5.9 - 8.0) Cations: Wide range; generally high levels.
Ca: 3100 (330 - 3900) ppm High (Low to High) Mg: 960 (110 - 2200) ppm High (Medium to High) K: 250 ( 34 - 390) ppm High (Low to High)
CEC: 26 (3 - 42) meq/lOO g High (Low to High)
Debris Lands
pH: Generally acidic; 5.9 (4.7 - 7.6) Cations: Wide range: generally medium levels.
Ca: 550 (370 - 3500) ppm Medium (Low to High) Mg: 110 ( 37 - 2000) ppm Medium (Low to High) K: 62 ( 17 - 280) ppm Medium (Low to High)
CEC: 5 (3 - 36) meq/lOO g Medium (Low to High)
CRITERIA FOR OUALITATIVE RANKING OF SOIL CHARACTERISTICS
& Medium High
Radioactivity (pCi/g) <2 2- 10 >lO Organic Matter (percent) <5 5- 10 >lO Calcium (ppm) <500 500 - 1000 >lOOO Magnesium (ppm) <lOO 100 - 500 >500 Potassium (ppm) <50 50 - 150 >150 CEC (meq/lOOg) <5 5- 10 >lO
101

Cation concentrations were highly variable but on the average tended to be lowto medium. CEC also was variable but was at a medium level on the average.
3. Elevated Radioactivity Lands (Clay and Debris) Radium-226 concentrationswere on the order of 10 to 20 pCi/g and lead-210 and polonium-210 concentrationswere of comparable magnitude but generally in excess of radioactive equilibriumwith the radium-226. Organic matter concentrations were low. The two classesshowed slight differences in pH and noticeable differences in cationconcentration and CEC.
Clay lands:pH: generally neutral.cation concentrations: wide range, high on the average.CEC: wide range, high on the average.
Debris lands:pH: generally acidic.cation concentrations: wide range, medium on the average.CEC: generally low to medium.
102

FACTORS AFFECTING RADIONUCLIDE TRANSFER
While 29 different foods were examined in this study, neither theplanting practices at the land parcels available for study or theresources allocated to this study permitted a study of all foods on allland types. As mentioned previously, for the purpose of examiningradionuclide transfer from soil to food and for developing models, thedata were examined on the basis of the five food categories that had beendesignated on the combined basis of plant type and portion of plantharvested for consumption:
1. Leafy,2. Cauliflower and broccoli (i.e. flowering Brassica),3. Seeds and grains,4. General (largely garden fruit), and5. Roots and tubers
Radium-226
Soil Radium-226
Radium-226 in the foods was indeed strongly correlated to the soilradium-226 concentration. As indicated in the statistical analysis, plantradium-226 concentration varied as approximately the square root of thesoil radium concentration, with the exact coefficient depending upon themodel employed. This is contrary to the statement in NCRP Report 77 thatcites a linear effect with soil concentration. On the other hand, thisis consistent with findings in the initial study (Guidry, et al. 1986),University of Florida studies of radionuclides in forages raised on areclaimed settling area (Roessler et.al. 1986), and a report by Simon andIbrahim (1987) in which the increased radium-226 in foods was not linearlyproportional to the increased radium-226 in soil.
Food Category
The most influential factor affecting the relationship between plantradium-226 and soil radium-226 was the food category. The statisticalrelationship depended upon the model used. In general, other factorsbeing equal, leafy foods exhibited the highest concentrations of radium-226. Foods in the roots/tubers and caul/broc categories exhibitedsubstantially lower radium-226 levels. The lowest observed concentrationswere found in the seeds/grains and the general categories.
103

Soil Chemistry
As discussed in the statistical analysis, a number of the regressionmodels identified various soil parameters as having a potential influenceon food radium-226. In approximate order of influence, these included:
- pH: positive; all models,- CEC: negative; selected models,- Organic matter: positive, selected models, and- Magnesium: negative; some models.
The most influential soil chemistry factor was pH which wassignificant each time it appeared in a model. Several of the modelssuggest that the radium-226 concentration in the foods increases roughly40 percent per unit increase in pH.
Several of the statistical models suggest that CEC has a negativeeffect on food radium-226; that is, radium-226 concentration in the fooddecreases as CEC increases. The interaction model indicated that thiseffect is largely observed within the caul/broc category. The lowerradioactivity mineralized lands had generally low values of CEC while theclay lands had generally medium to high CEC levels. Thus high CEC appearsto limit the uptake of radium-226 from the clay lands.
The factor that appeared next most often in the regression models wasOrganic Matter (OM) which had a positive effect on food radium-226content. The interaction model indicated that this effect was manifestin the roots/tubers category. Except for some of the control parcels,levels of OM were generally low. Thus low OM also appears to limit theuptake of radium-226 from the clay and debris lands.
In some models, soil magnesium had a significant influence on foodradium-226. The overall effect was a negative influence. Interactionmodels indicated that this effect was manifest in the leafy and theseeds/grains categories with a possible positive influence in the generalcategory. Control and mineralized lands had generally low to medium levelsof magnesium while the levels in debris and clay lands were medium tohigh. Here again, magnesium appears to limit the radium-226 uptake fromthe elevated radioactivity lands.
Soil calcium is generally considered to have a significant, negativeinfluence on the uptake of radium-226 by plants. Surprisingly, in theanalysis of the data from this study, soil calcium did not enter as asignificant factor in the stepwise regression analyses. However, whenforced into the model, soil calcium had a negative influence comparablein magnitude to soil magnesium. CEC, which is calculated from theconcentrations of various exchangeable cations, pre-empts calcium in thestatistical model. This suggests that, in a simplified model, CEC is abetter factor in the estimation of potential radium-226 uptake than theconcentration of any individual cation.
104

Lead-210
Lead-210 analyses were limited to food-soil sample pairs from thereclaimed, clay, and debris land categories. Furthermore, the majorityof the measurements were of leafy foods on clay lands. Thus the levelsof radioactivity were observed over a limited range, levels of soilchemistry were somewhat limited in range, and the data for the categoriesother than leafy are limited. Consequently, the data present only limitedopportunity to define the factors influencing lead-210 uptake by foods.
Soil Lead-210
Food lead-210 is correlated positively with soil lead-210 but thiscorrelation is not as strong as was the case for radium-226. Again thefood radioactivity varies roughly with the square root of the soilradioactivity.
Food Category
When food type was introduced as a factor in the model, it was thestrongest factor influencing food lead-210 (even to the exclusion of soillead-210). As with radium-226, the ranking depended on the model. But,in general, the leafy foods exhibited the highest lead-210 concentrations.Foods from the caul/broc category contained intermediate concentrationsfollowed by foods from the seeds/grains and general categories. Theroots/tubers foods contained the lowest concentrations of lead-210.
This ranking was similar to that observed for radium-226 except thatthe roots/tubers category had the lowest concentrations of lead-210 ascontrasted with intermediate concentrations of radium-226.
Soil Chemistry
The soil chemistry data did not present a clear picture of thefactors which may influence lead-210 uptake in foods. Some of thestatistical evaluations suggested an effect from pH, OM, and calcium, butthe relationships were not strong and the models often suggestedcontradictory effects. No clear-cut relationships were found.
Potential Effect of Atmospheric Deposition
It has been reported that a major source of lead-210 in plants isdeposition from the atmosphere (lead-210 resulting from the decay ofairborne radon-222). In this study, the highest concentrations wereobserved in the above-ground plant parts with the greatest surface area.This suggests that deposition from the atmosphere may be the major sourceof lead-210 in the foods in this study, possibly even overshadowing theeffect of soil lead-210 and soil chemistry factors.
105

Polonium-210
Polonium-210 analyses were limited to food-soil sample pairs fromthe reclaimed, clay, and debris land categories. Furthermore, as was thecase for lead-210, the majority of the measurements were of leafy foodson clay lands. Thus the levels of radioactivity were observed over alimited range, levels of soil chemistry were somewhat limited in range,and the data for the categories other than leafy are limited. Sincealmost 40 percent of the food measurements were below the limit ofdetection for the analytical method, the data present an even more limitedopportunity to define the factors influencing polonium-210 uptake byfoods. There was no significant correlation of food polonium-210 withany soil factors including soil polonium-210.
Again, the food category was the major factor correlated with foodradioactivity. The highest concentrations were observed in the leafycategory and the lowest in the roots/tubers category. These observationsagain suggest that deposition from the atmosphere may be more significantthan soil polonium-210 and other soil parameters.
ESTIMATION OF FOOD RADIOACTIVITY
The statistical analysis considered a variety of models which attemptto relate food radioactivity to various parameters such as food type, land type,and soil parameters. As mentioned in those analyses, numerous othermodels can be constructed from the regression parameters which are listedin the various model tables. It may be beneficial, however, to providea family of models for a variety of situations. When soil radioactivitydata are not available and a simple screening model would be useful forscreening lands for potential food production, a simple Land-Type/Food-Type Model might suffice. If more detailed information is available onthe soil chemistry, a Soil Parameter Model might be useful. For thisreason, the authors have compiled a summary of suggested models forestimating food radioactivity concentrations. As mentioned previously,caution must be exercised in using these models since the sampling designwas not balanced. Also, most of the lead-210 and polonium-210 resultswere obtained from clay lands. Note also that the model could only beused for samples drawn from locations similar to those utilized in thisstudy and for foods grown in this study.
Since food type can always be selected as an independent variable,all of the models which are discussed here include food type. Theremaining parameters vary with degree of model complexity. Three levelsof complexity are discussed here. The successive levels requireincreasing amounts of information about the land. The choice of levelwill depend on the amount of available information and the desired degreeof sophistication. The types of estimators, in order of increasingcomplexity, are those based on (1) land type, (2) soil radioactivity, and(3) multiple soil parameters.
These estimators are only discussed for radium-226 and lead-210because of the limited amount of food polonium-210 data above the limitof detection of the analytical procedure. Fortunately, this is not a
106

serious omission since, as described below in the dose assessment,polonium-210 is not a significant dose contributor relative to radium-226and lead-210 for any of the land categories or any of the foods.
Food-Type/Land Type Model
This is the simplest type of estimator, requiring only land type asinput information. It might be employed for preliminary, scoping estimatesfor specific land types.
Radium-226
The observed geometric mean values serve as one form of estimator.These results are summarized in Table 56 and presented in Figure 12. Notethat no data were reported for several food-type/land-type categories andsome means are based on only one observation. If the assumption is madethat there is a simple systematic effect of land type and food typewithout interaction, then a simple food-type/land-type model can be fitto the data and estimated values obtained to provide values for themissing cells and to smooth out the response in a systematic fashion.The results of using this simplified modeling technique are summarized asthe second set of entries in each cell in Table 56 and plotted in Figure13. Note that the estimated concentrations in foods reflect the generallevels of soil radioactivity in the various land classes:
a) generally low for control and mineralized lands,b) somewhat increased for reclaimed lands, andc) highest for clay lands and debris lands.
However, levels were generally higher for debris lands than for claylands, possibly due to the fact that cation concentrations were generallylower in debris soil than in clay soil.
Superimposed on the land-type effect is a food-type effect. Therewas a general trend for increasing concentrations from the general(largely garden fruit) to the seeds/grains to the roots/tubers to theflowering Brassica (cauliflower/broccoli) to the leafy categories. Whenthe food and land categories are arranged as in Figure 13, it results ina response surface with the steepest rise along the diagonal from"general-on-control" to "leafy-on-debris".
It should be noted that the estimated geometric means shown in Table56 are based on a larger data set than those listed in Table 32. This isdue to the difference between the methodology used for the statisticalanalysis and that used in determining the proposed models for estimatingradioactivity concentrations. In the statistical analysis, various modelswere developed to demonstrate the types of models which can be availableto the analyst in the use of these data. To permit direct comparison ofall the models, the data set for the statistical analysis was restrictedto the subset of samples for which soil chemistry data were available.In the case of radium-226, this required the exclusion of some radium-226observations from the initial study since soil chemistry information forthose observations were not available. For the purpose of suggesting a
107

108

109

11
0

preferred radium-226 model which does not use the soil chemistryparameters, the entire radium-226 data set was used. Thus, the estimatedgeometric means are different, but similar in value.
Lead-210
For this radionuclide, samples were collected from reclaimed, clayand debris lands. The observed geometric mean concentrations arepresented in Table 57; the three sampled land categories are presented inFigure 14. Data are missing for even more food-type/land-type cells thanfor radium-226. Again, assuming a systematic effect, a simple food-type/land-type model was fitted to the data and estimated values wereobtained for each of the food-type/land-type cells; these results are alsopresented in Table 57 and are depicted in Figure 15. There was not asclose a correspondence between observed and estimated values as forradium-226; the lead-210 estimates were based on fewer data and a lesscomplete design than for radium-226.
Again the estimated concentrations in foods reflect the general levelof soil radioactivity in the various land classes with the highestconcentrations in foods from debris lands. The superimposed food effectis similar to that for radium-226 with a slightly different order offoods. In this case the steepest increase is along the diagonal from the"roots/tubers-on-reclaimed" cell to the "leafy-on-debris" cell.
Soil Radioactivity Model
This type of estimator represents the next degree of complexity andmight be used when soil radioactivity levels are known but no additionalsoil data are available. Estimation of food radioactivity from soilradioactivity is commonly used in radiological assessment.Conventionally, a simple plant:soil ratio is applied for various foodtypes. However, the multiplicative model introduced for this study allowsthe investigation of relationships other than the simple linear ratio.
Radium-226
Table 58 lists the models which are suggested for the five foodcategories. Note that food radium-226 is approximately a square rootfunction of soil radium-226.
Lead-210
Table 58 lists the models which are suggested for the five foodcategories. Again food radioactivity is approximately a square rootfunction of soil radioactivity.
111

112

Figure 14
BSERVED

Figure 15
ESTIMATED LEAD-210 CONCENTRATIONSECONCENTRATIONSFood Type/Land Type Model

TABLE 58
SUGGESTED MODELS FOR ESTIMATING FOOD RADIOACTIVITY CONCENTRATIONS1
RADIUM-226l
FOOD-TYPE/LAND-TYPE MODEL
Food Type Concentration in pCi/kg for Indicated Land Type
Debris Clay Reclaimed Mineralized Control
Leafy 65.6 39.9 20.9 9.2 9.1 Caul/Broc 34.4 20.9 11.0 4.8 4.8 Roots/Tubers 33.3 20.3 10.6 4.7 4.6 General 18.6 18.6 5.9 2.6 2.6 Seeds/Grains 25.6 15.5 8.1 3.6 3.5
SOIL RADIOACTIVITY MODEL'
Leafy: FRa = 16.42 x SRa0*42
Caul/Broc: FRa = 7.25 x SRa0'42
Roots/Tubers: FRa = 5.78 x SRa0-42
General: FRa = 4.46 x SRa0.42
Seeds/Grains: FRa = 4.12 x SRa0*42
SOIL PARAMETER MODEL3
Leafy: FRa = 3.29 x SRa"*41 x CEC-"*2a x e"*36 'm
Roots/Tubers: FRa = 1.28 x SRaoa41 x CEC-"*2a x e"*36xpH
Caul/Broc: FRa = 1.21 x SRaoe41 x CEC-om2a x e"*36xPH
General: FRa = 1.11 x SRa0.41 x CEC-0.28 x eo.36 XPH
Seeds/Grains: FRa = 0.68 x SRa"*41 x CEC-"-2a x e"*36 xpH
l95 percent co nfidence interval is multiplicative using a factor ranging from 6 to 8
2FRa = food radium-226 concentration in pCi/kg SRa = soil radium-226 concentration in pCi/g
3CEC = cation exchange capacity in meq/lOOg pH is expressed in pH units
115

TABLE 58 (continued)
LEAD-2101
FOOD-TYPE/LAND-TYPE MODEL
Food Type Concentration in pCi/kg for Indicated Land Type
Debris Clay Reclaimed
Leafy 41.0 27.9 3.8 Caul/Broc 29.8 20.3 2.8 Seeds/Grains 22.1 15.0 2.1 General 8.1 5.5 0.8 Roots/Tubers 4.7 3.2 0.4
SOIL RADIOACTIVITY MODEL2
Leafy: FPb = 6.87 x SPb0.47
Caul/Broc: FPb = 5.03 x SPb".47
Roots/Tubers: FPb = 0.71 x sPb".4'
General: FPb = 0.87 x SPb"-47
Seeds/Grains: FPb = 1.67 x SPb".47
l95 percent confidence interval is multiplicative using a factor ranging from 16 to 17.
2FPb = food lead-210 concentration in pCi/kg
SPb = soil lead-210 concentration in pCi/g
116

Multiple Parameter Model
This represents the third level of complexity and could be used whendetailed soil radioactivity and chemistry data are available. While many modelsare possible, this set was selected as the best representation based on theavailable data in this study.
Radium-226
Table 58 lists the multiple parameter models which are suggested.
Lead-210
As discussed above, no soil parameters correlatedwith food lead at the 0.15level. Therefore, no models are suggested for estimating food lead with amultiple parameter model.
117

DOSE EVALUATION
INTRODUCTION
The biological effects which may occur from exposure to radioactivityare assumed to be linearly proportional to the radiation dose received bythe exposed individual. In this context, the radiation dose absorbed byan individual is expressed in thousandths of a rem (mrem). The evaluationof potential radiation doses to humans from radioactivity in foodsrequires the following:
1. scenarios describing the individuals or populations for whichthe dose is to be estimated,
2. a diet model describing the average intake of various fooditems, and
3. a dosimetry model to convert radionuclide intake to dose.
The dose calculation scenario describes the individual for which thedose is being calculated and specifies the source of that individual'sfood. For the purpose of this study, foods are separated into "sampled"foods and "non-sampled" foods. "Sampled" foods are those potentiallyaffected by the several land types under study. The radioactivityconcentrations in these foods are available from laboratory measurements."Non-sampled" foods are those not sampled in this study, and are assumedto be derived from a general food pool available to the population.Radionuclide concentrations for "non-sampled" foods and drinking water aretaken from the literature.
INTAKE SCENARIOS
The "sampled" foods consumed by a typical individual are likely tobe a combination of those grown on mined lands and those originatingelsewhere. Since debris lands are no longer being created, these landswere not considered in the definition of the intake scenarios. Reclaimedand clay lands will continue to be created by phosphate reclamationprocedures. Since, of these two, the average food concentrations observedon clay lands were higher than on reclaimed lands, the intake scenarioswere defined for foods obtained from clay lands to be conservative. Forthe purpose of the dose assessment, three individuals were defined:
1. Control individual - a reference individual who consumes"sampled" foods that do not originate on mining-related lands.
2. Local individual - an individual in the phosphate miningregion whose "sampled" foods are a mixture of foods from bothclay and unmined lands. This individual can be considered anaverage for the region. For the local individual's diet, itis assumed that ninety percent of the "sampled" foods wereobtained from unmined lands. Although the authors believethat only a few percent of the local individual's diet would
118

come from clay lands, ten percent was assumed to beconservative.
3. Maximum individual - obtains one hundred percent of his dietof "sampled" foods from clay lands. The authors do not expectthat any individual reflects this worst-case scenario.
The "local" and "maximum" individuals can be compared to the"control" individual to determine incremental doses.
DIET MODEL
The "total diet" model used for this study considers the consumptionof all food items, including such specific items as meats, milk and milkproducts, condiments, and beverages. The diet model used for thisassessment is shown in Table 59. It is based on the revised FDA diet withregrouping from the 201 items in that diet (Pennington, 1983). Allsampled items are retained as unique items. Groupings were developed ona general plant-type basis with considerations made for diet substitution.
Food intake quantities were derived from the FDA values for a youngadult male. Values are available for other age groups and for females inthe same groups. However, the dose conversion factors selected for thedose analysis are for adult males, and other sex or age group calculationswould involve additional assumptions and corrections in the calculations.
DOSE COMPUTATION
Radiation doses were calculated in terms of committed effective doseequivalent (CEDE). The CEDE is a dose quantity that expresses the long-term dose received from an annual intake of radioactivity and provides forsumming the effects of ingestion of various radionuclides that havedifferent distributions in the body and different biological turnoverrates. CEDES were calculated from the estimated annual radionuclideintakes using dose conversion factors (DCFs) expressed as CEDE per unitintake (mrem/pCi) from Federal Guidance Report No. 11 (USEPA, 1988). Thisis the latest compilation of ingestion DCFs and is based on the dosimetrymethodology of ICRP Publication Number 30 (ICRP, 1977).
Doses were calculated with the aid of a computerized Lotus 1-2-3R
spreadsheet. A worksheet was prepared for each mining-related landcategory and radionuclide combination. Table 60 shows an exampleworksheet for one such combination. The table includes all the essentialelements necessary to make a wide variety of calculations and to drawnumerous conclusions. The heading of the worksheet displays the landcategory of interest, radionuclide, and dose conversion factor. Each
119

TABLE 59
TOTAL DIET MODEL
INTAKE
(g/day)
SAMPLED
DAIRY Milk Cheese
MEAT Beef Pork Other
FISH EGGS CEREAL FOOD
Corn Grain Grain Cereals/Bread
CAULIFLOWER/BROCCOLI Cauliflower Broccoli
LEAFY/COLE VEGETABLES Cabbage Collard Greens Lettuce Mustard Greens Spinach Turnip Greens Other Celery
LEGUMES Green Peas Other Beans Nuts Other
SEEDS/GRAINS Blackeyed Peas Rice Yellow Corn
TUBERS/ROOTS Carrot Onion Radish Turnip Potatoes
280.99 NO 22.41 NO
129.27 NO 39.54 NO 69.00 NO 20.06 NO 30.95 NO
5.18 NO 4.55 NO
174.70 NO
0.71 YES 2.80 YES
7.04 YES 0.45 YES
23.38 YES 0.45 YES 3.28 YES 0.45 YES 0.76 NO 0.62 NO
7.29 NO 25.71 NO
4.94 NO 11.28 NO
5.61 YES 22.94 YES 14.41 YES
2.92 YES 4.19 YES 0.32 YES 0.42 YES
85.22 NO
120

TABLE 59 (CONTINUED)
INTAKE
(g/day)
SAMPLED
GARDEN FRUIT Cucumber Green Beans Green Pepper Strawberries Tomato Watermelon Yellow Squash/Zucchini Other
TREE FRUIT Citrus
Orange Grapefruit Lemon Other
SOUPS CONDIMENTS DESSERTS BEVERAGE WATER
2.62 YES 8.80 YES 1.99 YES 1.23 YES
25.18 YES 3.44 YES 1.26 YES 6.55 NO
85.26 NO 7.78 NO
10.71 NO 60.36 NO 36.82 NO 54.12 NO 78.30 NO
1172.44 NO 512.00 NO
TOTAL: 3071.80
'Developed from 201-category revised FDA diet (Pennington, 1983).
121

122

worksheet is designed to calculate the dose for the "maximum" individual.The first column contains the diet items selected for this study followedby their respective intake quantities (g/day from Table 59) in the secondcolumn. The third column indicates the geometric mean concentrations inpCi/kg for the specific food item from the mining-related land category ofinterest. Only clay lands are discussed here. Worksheets for other landtypes are included in the appendix. The radioactivity concentration forunmined land is given in the fourth column. The unmined category includesfood from both control and mineralized lands since these foods exhibitedradioactivity concentrations which were not statistically different.Columns five and six show calculated intakes in pCi/yr for the mining-related and unmined lands, respectively. These values are the products ofthe dietary intake (second column),the respective concentrations, and aconversion factor of (365.25 days/year)/(1000 g/kg) = 0.36525 to reconcileunits. The final column displays the contribution of each food item tothe total intake for the mined land category. Since dose is directlyproportional to intake for a particular radionuclide, these percentagescan easily be used to determine specific food items and general foodcategories that are major contributors to the dose from sampled foods.
Gaps in the database for unmined lands were filled with values takendirectly or derived from literature sources and are correspondingly coded.Missing data for the mining-related lands were estimated (E) byconsidering trends in the overall data set. In most cases, a simple food-type/land-type model was adequate for these estimations. However, somefoods exhibited much higher concentrations than others in their categoryon other lands where measurements were available. In such situations, theratio of the concentration in that food to the geometric mean of theconcentrations of the other measured foods was applied as a multiplier tothe modeled value for the deficient land-type. Data for specific foodsfrom Tracy et al (1983) were used where available, and geometric means foranalagous categories in the Tracy data set were used otherwise (T). Whereanalagous categories were not available,values were estimated by takingthe ratio of the modeled values for the category of interest and the leafycategory on reclaimed land. This ratio was multiplied by the Tracy valuefor the leafy category on unmined land to yield the estimate (RT).
Intake totals for non-sampled foods (from Table 61) and for sampledfoods from mining-related and unmined lands are listed at the bottom ofeach worksheet. Concluding the worksheets are the dose totals for thethree intake scenarios. For the local individual, the dose from sampledfoods is calculated as follows:
Dose = 0.9 x (dose from control) + 0.1 x (dose from clay)
This reflects the definition of the local individual as obtaining tenpercent of his diet of sampled foods from mining-related lands and theremainder from unmined lands.
Radionuclide intake from non-sampled foods was calculated fromconcentrations derived from the literature. Table 61 lists the foodintakes, radioactivity concentrations, calculated radioactivity intakes,
123

and doses for foods not sampled in this study. These values are compiledfrom the food intakes from Table 59 and the radionuclide concentrationsas derived from the literature.
Table 62 lists foods sampled in this study that were eitherinsignificant in the diet or for which insufficient quantities weresampled for dose calculations. Where appropriate, they were used toestimate values in other foods. Cauliflower and eggplant were sampledonly once and only from unmined land. Other foods sampled on only oneland type with no corresponding control samples were also omitted fromconsideration. The decision to omit potatoes was augmented by theunlikely use of clay lands for its production.
RESULTS
Radionuclide intakes and doses for radium-226 and lead-210 aresummarized in Tables 63 and 64 from the calculational worksheets A-1through A-6 in Appendix A. Results are presented for the controlindividual (sampled foods from unmined land) and for both the localindividual and the maximum individual. In Table 64, the dosecontributions for these two radionuclides and contributions from uraniumand thorium radionuclides estimated in the initial study are summed.Tables A-7 and A-8 list the intakes and doses for all of the land typesstudied.
Table A-9 shows the analysis for the grocery store samples collectedin the Orlando area. The worksheet displays lead-210 concentrations withvalues for other radionuclides and foods noted at the bottom. These dataare insufficient to allow further analysis. Information concerning thelocations of origin for the sampled foods was not available. Initially,these samples were intended to provide lead-210 results to augment theradium-226 results on control lands, assuming that the grocery storesamples would exhibit radionuclide levels similar to those on controllands. This assumption appears to have been unfounded. The geometricmeans of the grocery store samples for the general food category rangedfrom two to two hundred times higher than the literature values.Moreover, the grocery measurements were generally higher than measurementsof samples from reclaimed lands, casting further doubt on theirreliability as controls.
Control values for radium-226 in the non-sampled diet were derivedfrom the literature as noted in Table 61. The total intake of lead-210for that portion of the diet was assigned the same total as radium-226assuming a 1:1 ratio according to Holtzman (1980). That estimated intakefor a Florida resident is much higher than the well-documented intake forthe U.S. citizen accepted in NCRP Report No. 94 (NCRP, 1987) from acompilation of extensivedata from the same publication by Holtzman.Those data show a normal value of about 1.4 pCi/day with littlevariability (+/- 0.3 pCi/day).
124

125

TABLE 62
OTHER SAMPLED FOODS
RADIOACTIVITY CONCENTRATION (pCi/kg)
NO. OF SAMPLES
RADIO- NUCLIDE UNMINED RECLAIMED CLAY
CAULIFLOWER' 1 Ra-226 Pb-210 PO-210
6.02
PARSLEY112 1
SWISS CHARD1J2 1
LIMA BEANS' 1
POTATOES314 3
EGGPLANT1 1
Ra-226 Pb-210 PO-210
Ra-226 Pb-210 PO-210
Ra-226 Pb-210 PO-210
Ra-226 4.34 Pb-210 2.00 PO-210 2.05
Ra-226 Pb-210 PO-210
4.05
65.71
51.80 34.16
118.32 22.40
OKRA3 2 Ra-226 30.10 Pb-210 27.84 PO-210 1.07
'Insufficient sampling 21tem is an insignificant contributor to the diet 31tem sampled on only one land type 41tem is not likely to be grown on mining-related lands
126

Results for polonium-210 are displayed in Table A-10. The data wereinsufficient for dose assessment. Generally low food concentrationscoupled with a small DCF indicate that the doses from this radionuclidewould not be significant in this study. The polonium-210 to lead-210activity ratio in the average total diet for the U.S. citizen is about 1.3according to NCRP Report Number 94; however, foods measured for bothradionuclides in this study indicate that polonium-210 levels are muchlower.
DISCUSSION
As shown in Table 64,the majority of the dose is due to lead-210.Attributable doses from the uranium and thorium series were 0.3 mrem peryear for the local individual and 2.7 mrem per year for the maximumindividual.
The NCRP established in Report Number 91 (NCRP, 1987) a "negligibleindividual risk level" (NIRL) considered to be a trivial risk that can bedismissed from consideration. According to the NCRP, "the utilization ofthe NIRL is especially important in regard to environmental issuesinvolving exposure of populations". The NIRL corresponds to an annualeffective dose equivalent of 1 mrem which represents an annual risk forfatal health effects of one in ten million. Certainly many of the specificfood items considered independently (as would be appropriate for parcelsof land used to grow a specific food item for distribution in the generalfood pool) would fall below the NIRL. As an upper limit, the NCRPsuggests that continuous exposure to sources in addition to naturalbackground should not exceed 100 mrem/yr. The EPA uses a limit of 25mrem/yr for individual pathways. These reference levels can be used tointerpret the dose assessment results listed in Table 64.
The total attributable dose due to clay lands for the localindividual is below the NIRL. For the maximum individual, that dose is2.7 mrem/yr, which is much less than the 25 mrem/yr upper reference level.It represents a sixteen percent increase over the control dose. Based onNCRP 91, this dose would represent an annual risk of less than one in amillion.
To further put these doses in perspective, Table 65 lists a compositeof information presented in NCRP Report Number 93 (NCRP, 1987b). Totalannual average effective dose equivalents to a member of the U.S.population are shown by source for comparison to the 39 mrem attributableto radionuclides in the body. Of that amount, the lead-210 - polonium-210 pair and potassium-40 contribute most of the annual dose with radium-226 and all other radionuclides contributing much less. The doses shownon Table 64 which are attributable to foods grown on clay lands representa small fraction of the annual average dose received by a member of theU.S. population, even in the case of the hypothetical maximum individual.
127

Table 63
RADIONUCLIDE INTAKE FROM FOOD CONSUMPTION (pCi/yr)
Control Local Individual Individual
Maximum Individual
Ra-226 1915 1987 (72)l 2586 (671)
Pb-210 2315 2348 (33) 2646 (331)
'Values in parentheses are the intakes attributable to foods grown on clay lands and is equal to the difference between the intake beside it and the intake of the control individual. (Rounding may cause discrepancies.)
128
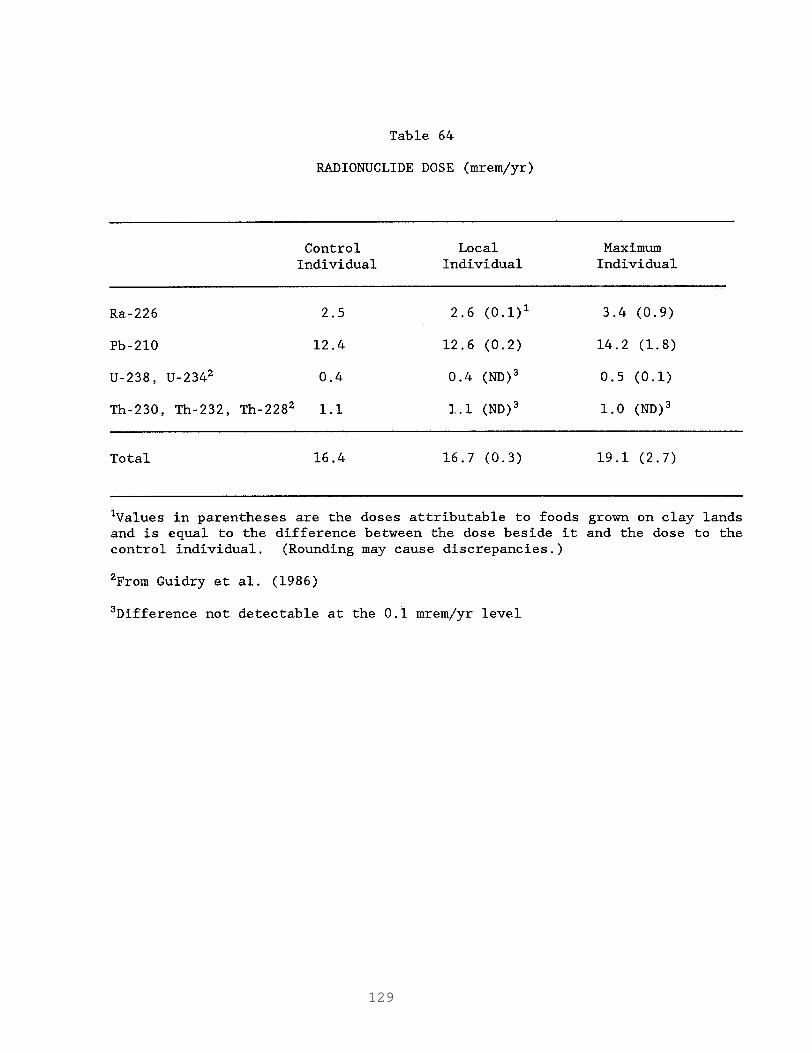
Table 64
RADIONUCLIDE DOSE (mrem/yr)
Control Local Individual Individual
Maximum
Individual
Ra-226 2.5 2.6 (O.l)l 3.4 (0.9)
Pb-210 12.4 12.6 (0.2) 14.2 (1.8)
U-238, U-2342 0.4 0.4 (ND)3 0.5 (0.1)
Th-230, Th-232, Th-22a2 1.1 1.1 (ND)3 1.0 (ND)3
Total 16.4 16.7 (0.3) 19.1 (2.7)
'Values in parentheses are the doses attributable to foods grown on clay lands and is equal to the difference between the dose beside it and the dose to the control individual. (Rounding may cause discrepancies.)
2From Guidry et al. (1986)
3Difference not detectable at the 0.1 mrem/yr level
129

Table 65
ANNUAL AVERAGE TOTAL EFFECTIVE DOSE EQUIVALENT (mrem/yr >
Man-Made Diagnostic X-Rays Nuclear Medicine Other
Subtotal 60
Natural Inhaled Radon Cosmic Radiation Cosmogenic Terrestrial Radiation In the Body
Pb-210, PO-210 K-40 Ra-226 All Others
Subtotal
39 14
7
200 27
1 28
15 19
1 4
295
Rounded Total 360
130

CONCLUSIONS/RECOMMENDATIONS
CONCLUSIONS
Based on the results described in the previous sections, it can beconcluded that foods grown on mined phosphate lands (including reclaimed,debris and clay lands) exhibit higher concentrations of radium-226 thanfoods grown on unmined lands (including phosphate mineralized andunmineralized lands). This is consistent with the findings of the initialstudy. Since this study did not investigate levels of lead-210 andpolonium-210 in foods grown on unmined lands, conclusions regardingrelative concentrations of these radionuclides in foods grown on mined andunmined lands cannot be drawn. The higher concentrations exhibited bythose foods grown on mined phosphate lands result in higher rates ofingestion for radium-226 and higher radiation doses to those individualsingesting these foods. The doses however are quite low, even for thehypothetical maximum individual who consumes all study foods from claylands. The estimated doses, even to the maximum individual, would be asmall fraction of natural exposure to environmental radioactivity andwould not be considered to be a health hazard.
The statistical analyses which were conducted on the data generatedfrom this and the previous study indicate that radium-226 and lead-210 infoods vary approximately as the square root of radium-226 and lead-210 insoil. The results for polonium-210 were inconclusive due to the largenumber of measurements which were below the limit of detection of theanalytical methodology. The effects of soil chemistry on the uptake ofradium-226 and lead-210 by foods depended on the statistical modelemployed. However, in the case of radium-226, food concentrations werepositively correlated with pH in all of the models employed and negativelycorrelated with cation exchange capacity for selected models. For lead-210, the soil chemistry data did not present a clear picture of thosefactors which might affect lead-210 uptake in foods.
It is important to note that the models which were developed from thestatistical data base generated for this and the previous study can onlybe used for samples drawn from locations similar to those utilized inthese studies and for foods grown in these studies. These modelsrepresent only a few of the models which are available from the analysisof these data. The integrated data base which was used in this study hasbeen provided to the Florida Institute of Phosphate Research in a formsuitable for analysis on the Statistical Analysis System.
RECOMMENDATIONS
Based on the low radiation doses which have been estimated from thedata collected in this and the previous study, a recommendation to limitfood production on mined phosphate lands does not appear to be warranted.Although the foods collected from mined lands did exhibit statisticallyhigher levels of radium-226 than similar foods collected on unmined lands,the resulting radiation doses from the consumption of these foods are low.The authors do however recommend that, all other things being equal, if
131
clay lands are to be used for commercial food production, preference begiven to those foods (such as garden fruits and those in the generalcategory) which exhibited the lowest concentrations of radioactivity.
132

BIBLIOGRAPHY
Baker, D.A.. 1976. User Guide for Computer Program Food. Richland, Washington: Batelle Pacific Northwest Labs.
Baker, D.A. et al. 1976. Food: An Interactive Code to Calculate Internal Radiation Doses from Contaminated Food Products. Richland, Washington: Batelle Pacific Northwest Labs.
Bernard, S.R. and W.S. Snyder. 1975. Metabolic Models for Estimation of Internal Radiation Exposure Received by Human Subjects from the Inhalation of Noble Gases. Health Physics Division Annual Progress Report for Period Ending June 30, 1975. ORNL5046: 197-204.
BEIR, Committee on Biological Effects of Ionizing Radiations. 1980. The Effects on Populations of Exposure to Low Levels of Ionizing Radiation: 1980. Washington, D.C.: National Academy Press.
Blanchard, R.L. and J.B. Moore. Lead-210 and Polonium-210 in Tissues of Some Alaskan Residents as Related to Consumption of Caribou or Reindeer Meat. Health Physics. 18: 127-134.
Bogen, D.C., Welford, G.A., and Morse, R.S. 1976. General Population Exposure of Stable Lead and Pb-210 to Residents of New York City. Health Physics 30, 359.
Bolch W.E. et al. 1977. Uranium and Radium Concentration in Florida Phosphate Fractions by GeLi Spectrometry, in Proceedings of the Health Physics Society 1OthMidyear Topical Symposium, Natural Radioactivity in Man's Environment, October, 1976. Rensselaer Polytechnic Institute, eds. pp. 400-414.
Cowart, J.B. 1980. Variation of Uranium Isotopes in Some Carbonate Aquifers, inNatural Radiation Environment III, Vol. I. W. Lowder and T. Gesell, eds. p. 711.
Cullen, T.L. 1978. Low Level Radiation. Biological Interactions, Risks and Benefits. T. Cullen and P. Franca, eds. p. 423.
deBartoli, M., and Gaglione, P. 1972. Ra-226 in Environmental Materials and Foods. Health Physics 22, 43-48.
Drury, J.S. et al. 1983. Radioactivity in Foods. Oak Ridge National Laboratory. ORNL Report #5963.
Dunning, D.E. Jr., et al. 1981. Estimates of Internal Dose Equivalent to 22 Target Organs for Radionuclides Occurring in Routine Releases from Nuclear Fuel-Cycle Facilities. Oak Ridge National Laboratory. NUREG/CR 0150 Vol. 3, ORNL/NUREG/TM-19O/V3.
133

Eckerman, K.F., Wolbarst, A.B., and Richardson, A.C.B. 1988. Limiting Values of Radionuclide Intake and Air Concentration and Dose Conversion Factors for Inhalation, Submersion, and Ingestion. Federal Guidance Report No. 11.
Eisenbud, M. 1973. Environmental Radioactivity. 2nd ed. New York: Academic Press.
Eisenbud, M. et al. 1964. Naturally Occurring Radionuclides in Foods and Waters from the Brazilian Areas of High Radioactivity, in The Natural Radiation Environment, Proceedings from the First International Symposium on the Natural Radiation Environment (April 10-13, 1963), pp. 837-854.
Florida Statutes, Chapter 378. 1978. Tallahassee, Florida.
Garten, C.T. Jr. et al. 1981. Comparative Uptake of Uranium, Thorium, and Plutonium by Biota Inhabiting a Contaminated Tennessee Foodplain. Journ. Environ. Quality. Vol. 10, No. 2, pp. 207-210.
Gesell, T.F. and H.M. Prichard. 1975. The Technologically Enhanced Natural Radiation Environment. Health Physics. 28: 361-366.
Griffith, Lynn. Telephone Conversation Between Jerome J. Guidry, Post, Buckley, Schuh & Jernigan, Inc. and Lynn Griffith, A & L Southern Agricultural Laboratories, December 18, 1989.
Guidry, J.J. et al. 1986. Radioactivity in Foods Grown on Florida Phosphate Lands. Florida Institute of Phosphate Research. Publication No. 05-015- 038.
Guimond, R.J. et al. 1979. Indoor Radiation Exposure Due to Radium-226 in Florida Phosphate Lands. U.S. Environmental ProtectionAgency. EPA-520/4- 78-013.
Hamilton, E.I. 1972. The Concentration of Uranium in Man and His Diet. Health Physics. 22: 149-153.
Harley, J.H. (ed.). 1972. Health and Safety Laboratory Procedures Manual. U.S. Energy Research and Development Administration. HASL-300.
-* 1987. Naturally Occurring Sources of Radioactive Contamination, Prepared for Radionuclides in the Food Chain. A Symposium Sponsored by the International Life Sciences Institute.
Hawkins, William. 1983. Agricultural Uses of Reclaimed Phosphate Lands, in Proceedings of the Symposium on Reclamation and the Phosphate Industry, Florida Institute of Phosphate Research Publication No. 03-036-010.
Healy, J.W. and J.C. Rodgers. A Preliminary Study of Radium - Contaminated Soils. Los Alamos Scientific Laboratory. LA-7391-MS.
Hill, C.R. 1962. Identification of Alpha-Emitters in Normal Biological Materials. Health Physics. 8: 17-25.
134

Holtzman, R.B. et al. 1979. Contamination of the Human Food Chain by Uranium Mill Tailings Piles. Argonne National Laboratory. NUREG/CR-0758, ANL/ES- 69.
Holtzman, R.B. 1980. Normal Dietary Levels of Radium-226, Radium-228, Lead- 210, and Polonium-210 for Man, in Natural Radiation Environment III, Vol. I. W. Lowder and T. Gessell, eds. p. 755.
ICRP. 1959. Recommendations of the International Commission on Radiological Protection, Report of Committee II on Permissible Dose for Internal Radiation. ICRP Publication No. 2. Oxford: Pergamon Press.
. 1969. The Assessment of Internal Contamination Resulting from Recurrent or Prolonged Uptakes. ICRP Publication No. 10A. Oxford: Pergamon Press.
-23. 1975. Report of the Task Group on Reference Man. ICRP Publication No.
Oxford: Pergamon Press.
-* 1977-82. Limits for Intakes of Radionuclides by Workers. ICRP Publication No. 30 and Supplements. Oxford: Pergamon Press.
Ibrahim, S.A. and Whicker, F.W. 1987. Plant Accumulation and Plant/Soil Concentration Ratios of 210Pb and "'PO at Various Sites Within a Uranium Mining and Milling Operation. Environmental and Experimental Botany. Vol. 27, No. 2, pp. 203-213.
Kangas, P. 1979. The Biochemistry of Radium, for the Center for Wetlands. Unpublished paper.
Kanipe, L.G. 1977. Handbook for Analytical Quality Control in Radioanalytical Laboratories. Tennessee Valley Authority. EPA-600/7-77-008.
Kaufmann, R.F. and J.D. Bliss. 1977. Effects of Phosphate Mineralization and the Phosphate Industry on Radium-226 in Ground Water of Central Florida. U.S. Environmental Protection Agency. EPA/520-6-77-010.
Kirchmann, R. et al. 1980. Accumulation of Radium-226 from Phosphate Fertilizers in Cultivated Soils and Transfer to Crops, in Natural Radiation Environment III, Proceedings of a Symposium Held at Houston, Texas, April 23-28, 1978, Vol. 2. CONF-780422. U.S. Department of Energy Symposium Series 51. pp. 1667-1672.
Klement, A.W. 1965. Natural Radionuclides in Foods and Food Source Materials, in Radioactive Fallout, Soils, Plants, Food, Man. E. Fowler, ed.
Lalit, B.Y. and T.V. Ramachandran. 1980. Natural Radioactivity in Indian Foodstuffs, inNatural Radiation Environment III, Proceedings of a Symposium Held at Houston, Texas, April 23-28, 1978, Vol. 2 CONF-790422, U.S. Department of Energy Symposium Series 51, pp. 800-809.
135

Lindeken, C.L. and D.G. Coles. 1977. The Radium-226 Content of Agricultural Gypsums, in Paper prepared for Symposium on Public Health Aspects of Radioactivity in Consumer Products. U.S. Nuclear Regulatory Commission Report NUREG/CP-0001, 369-375.
Lotus l-2-3 User's Manual, 1983. Cambridge, Massachusetts: Lotus Development Corporation.
Manatee County. 1980 and 1984. Unpublished studies of groundwater samples collected in Manatee County, Florida. Manatee County Public Health Unit, Bradenton, Florida.
Marshall, J.H. et al. 1973. Alkaline Earth Metabolism in Adult Man. Health Physics. 24: 125-132.
McDowell-Boyer, L.M. et al. 1979. Review and Recommendations of Dose Conversion Factors and Environmental Transport Parameters for Lead-210 and Radium-226, Final Report. Oak Ridge National Laboratory, ORNL/NUREG-56.
Menzel, R.G. 1965. Soil-Plant Relationships of Radioactive Elements. Health Physics. 11: 1325-1332.
. 1968. Uranium, Radium, and Thorium Content in Phosphate Rocks and Their Possible Radiation Hazard. Journ. Agr. Food Chem. Vol. 16, No. 2: 231- 234.
Methods Used and Adoptedby the Association of Florida Phosphate Chemists. 1980. Sixth Edition, Section IX.
Miller, M.L. et al. 1980. Lognormal Analysis of Naturally Occurring Radionuclides in Soil and Vegetation of the Hanford Area, in National Radiation Environment III, Proceedings of a Symposium Held at Houston, Texas, April 23-28, 1978. Vol. 2 CONF-780422. U.S. Department of Energy Symposium Series 51. pp. 826-831.
Mistry, K.B. et al. 1970. Radioactivity in the Diet of Population of the Kerala Coast Including Monazite Bearing High Radiation Areas. Health Physics. 19: 535-542.
Mordberg, Y.L. and I.L. Shalayev. 1973. Method of Evaluating the Content of Natural Radioactive Isotopes of the Uranium and Thorium Family in Drinking Water and Food. Gig. Sanit. 8: 52-55.
Morse, R.S. and G.A. Welford. 1971. Dietary Intake of Lead-210. Health Physics. 21: 53-55.
Napier, B.A. 1980. Assessment of Effectiveness of Geologic Isolation Systems, ARRRG and Food--Computer Programs for Calculating Radiation Dose to Man From Radionuclides in the Environment. PNL-3180, UC-70. Richland, Washington: Battelle Pacific Northwest Laboratory.
136

NCRP. 1975. Natural Background Radiation in the United States. Rpt. No. 45. Washington, D.C.: National Council on Radiation Protection and Measurements.
-* 1984a. Radiological Assessment: Predicting the Transport, Bioaccumulation, and Uptake by Man of Radionuclides Released to the Environment, Report 76 (National Council on Radiation Protection and Measurements, Bethesda, Maryland).
. 1984b. Exposures from the Uranium Series with Emphasis on Radon and Its Daughters. Report 77 (National Council on Radiation Protection and Measurements, Bethesda, Maryland).
-* 1987a. Recommendations on Limits for Exposure to Ionizing Radiation. National Council on Radiation Protection and Measurements Report No. 91 (NCRP, Bethesda, MD).
-* 198713. Ionizing Radiation Exposure of the Population of the United States. National Council on Radiation Protection and Measurements Report No. 93 (NCRP, Bethesda, MD).
-- 1987c. Exposure of the Population in the United States and Canada from Natural Background Radiation. National Council on Radiation Protection and Measurements Report No. 94 (NCRP, Bethesda, MD),
Oakes, T.W. and K.C. Shank. 1979. Concentrations of Radionuclides and Selected Stable Elements in Fruits and Vegetables. Oak Ridge National Laboratory.
Osburn, W.S. 1965. Primordial Radionuclides: Their Distribution, Movement, and Possible Effect Within Terrestrial Ecosystems. Health Physics. 11: 1275-1295.
Parzyck, D.C. et al. 1979. An Integrated Assessment of the Impacts Associated with Uranium Mining and Milling. Oak Ridge National Laboratory. Ol?NL/TM- 6677.
Pennington, Jean A.T. 1983. Revision of the Total Diet Study, Food List and Diets. Journal of the American Dietetic Association. Vol. 82, No. 2.
Percival, D.R. and D.B. Martin. 1974. Sequential Determination of Radium-226, Radium-228, Actinium-227, and Thorium Isotopes in Environmental and Process Waste Samples. Analytical Chemistry. Vol. 46, No. 12: 1742-1749.
Persson, B.R. 1976. Lead-210, Polonium-210, and Stable Lead in the Foodchain: Lichen, Reindeer and Man, in Natural Radiation Environment II, Proceedings of the Second International Symposium on the Natural Radiation Environment Held in Houston, Texas, August 7-11, 1972. CONF-720805-P-1. U.S. Department of Energy. pp. 347-367.
Public Health Service. 1970. Radiological Health Handbook. U.S. Department of Health, Education and Welfare.
137

Roessler, C.E. et al. 1980. The Effect of Mining and Land Reclamation on the Radiological Characteristics of the Terrestrial Environment of Florida's Phosphate Regions, in Proceedings of the Symposium: The Natural Radiation Environment III, Held in Houston, Texas, April 23-28, 1978. CONF-780422. U.S. Department of Energy Symposium Series 51.
Roessler, C.E., Wood, J.G., and Shavers, M. 1986. Radionuclide Uptake by Forages, Phase I - Radium-226 Data Collection, final report to International Minerals and Chemical Corp. University of Florida, Gainesville, Florida.
Rupp, Elizabeth M. 1980. Age Dependent Values of Dietary Intake for Assessing Human Exposures to Environmental Pollutants. Health Physics. Vol. 39, No. 2: 151-163.
Russell, R.S. and K.A. Smith. 1966. Naturally Occurring Radioactive Substances: The Uranium and Thorium Series, in Radioactivity and Human Diet. Chapter 17. Pergamon Press, Oxford.
Ryan, M.T. and S.J. Cotter. 1980. An Integrated Assessment of the Phosphate Industry. Oak Ridge National Laboratory. ORNL-5583, ORNL/EV/OTl-2001.
SAS Institute. 1982. SAS User's Guide: Statistics, 1982 Edition. Carey, North Carolina.
Sill, C.W. n.d. An Analytical Standard for the Uranium Milling Industry. Unpublished paper prepared for Health Services Laboratory. U.S. Energy Research and Development Administration.
-- 1974. Simultaneous Determination of Alpha-Emitting Nuclides of Radium through California in Soil. Analytical Chemistry. Vol. 46, No. 12: 1725- 1737.
. 1977a. Determination of Thorium and Uranium Isotopes in Ores and Mill Tailings by Alpha Spectrometry. Analytical Chemistry. 49: 618.
1977b. . Simultaneous Determination of Uranium-238, Uranium-234, Thorium- 230, Radium-226, and Lead 210 in Uranium Ores, Dusts, and Mill Tailings. Health Physics. 33: 393-404,
Sill, C.W. and C.P. Willis. 1977. Radiochemical Determination of Lead-210 in Uranium Ores and Air Dusts. Analytical Chemistry. Vol. 49, No. 2: 302- 306.
Simon, S.L. and S.A. Ibrahim. 1987. The Plant/Soil Concentration Ratio for Calcium, Radium, Lead, and Polonium: Evidence for Non-linearity with Reference to Substrate Concentration. J. Environ. Radioactivity 5, pp. 123- 142.
Stroube, William B. Jr., et al. 1985. Survey of Radionuclides in Foods, 1978- 1982. Vol. 49, No. 5.
138

Till, J.E. and Meyer, H.R. 1983. Radiological Assessment, NUREG/CR-3332 ORNL- 5968, U.S. Nuclear Regulatory Commission, Washington, D.C.
Tracy, B.L., Prantl, F.A., andQuinn J.M. 1983. Transfer of Ra-226, Pb-210 and Uranium from Soil to Garden Produce - Assessment of Risk. Health Physics 44, 469-477.
Turner, R.C. et al. 1958. The Naturally Occurring Alpha-Ray Activity of Foods. Health Physics. 1: 268-275.
UNSCEAR. 1972. Ionizing Radiation: Levels and Effects. Official Records of the General Assembly. Twenty-seventh Session. Vol. 1, Supplement No. 25 (A18725). United Nations Scientific Committee on the Effects of Atomic Radiation.
-- 1977. Sources and Effects of Ionizing Radiation. Official Records of the General Assembly, Thirty-second Session. Supplement No. 40 (A/32/40). United Nations Scientific Committee on the Effects of Atomic Radiation.
-* 1982. Ionizing Radiation: Sources and Biological Effects. Report to the General Assembly.
USDA. 1968. Food Consumption of Households in the South, Spring 1965. Household Food Consumption Survey, 1965-1966. U.S. Government Printing Office.
U.S. Department of the Interior, Bureau of Mines. 1978. Evaluation of the Phosphate Deposits of Florida Using the Minerals Availability System. Contract No. 50377000.
USEPA. 1973a. Environmental Analysis of the Uranium Fuel Cycle Part I - Fuel
SUPPlY. U.S. Environmental Protection Agency.
-* 1973b. Reconnaissance Study of Radiochemical Pollution from Phosphate Rock Mining and Milling. National Field Investigations Center.
-* 1975. Preliminary Findings Radon Daughter Levels in Structures Constructed on Reclaimed Florida Phosphate Land. U.S. Environmental Protection Agency. ORP/CDS-75-4.
-* 1976. National Interim Primary Drinking Water Regulations. U.S. Environmental Protection Agency.
-* 1979. Radiological Environmental Resource Document. Draft Environmental Impact Statement, Swift Agricultural Chemicals Corporation, Duette Mine.
. 1988. Limiting Values of Radionuclide Intake and Air Concentration and Dose Conversion Factors for Inhalation, Submersion, and Ingestion. U.S. Environmental Protection Agency. EPA-520/l-88-020.
139

USGS Open File Report No. 80-1223. 1981. Data on Groundwater Quality with Emphasis on Radionuclides, Sarasota County, Florida. Tallahassee, Florida.
USNRC. 1977a. Calculation of Annual Doses to Man From Routine Releases of Reactor Effluents for the Purpose of Evaluating Compliance with 10 CFR, Part 50, Appendix I. U.S. Nuclear Regulatory Commission, Office of Nuclear Regulatory Research. Regulatory Guide 1.109.
-- 1977b. Measuring, Evaluating, and Reporting Radioactivity in Releases of Radioactive Materials in Liquid and Airborne Effluents from Uranium Mills. U.S. Nuclear Regulatory Commission. Regulatory Guide 4.14.
-- 1982. Calculation Models for Estimating Radiation Doses to Man from Airborne Radioactive Materials Resulting from Uranium Milling Operation. U.S. Nuclear Regulatory Commission, Office of Nuclear Regulatory Research. Regulatory Guide 3.51.
-* 1983. Radiological Assessment, A Textbook on Environmental Dose Analysis. U.S. Nuclear Regulator Commission, Office of Nuclear Regulatory Research.
Watson, A.P. et al. 1984. Radium-226 In Drinking Water and Terrestrial Food Chains: Transfer Parameters in Normal Exposure and Dose. Nuclear Safety. Vol. 25, No. 6.
Welford, G.A. and R. Baird. 1967. Uranium Levels in Human Diet and Biological Materials. Health Physics. 13: 1321-1324.
White, G.C. et al. 1981. Factors Affecting Radionuclide Availability to Vegetables Grown at Los Alamos. Journ. Environ. Quality. Vol. 10, No. 3: 294-299.
Williams, E.G. et al. 1965. Background Radiation in Florida. Florida State Board of Health.
Windham, S.T. et al. 1976. Radiation Dose Estimates to Phosphate Industry Personnel. U.S. Environmental Protection Agency. EPA-520/5-76-014.
Witherspoon, John. Telephone Conversation Between Jerome J. Guidry, Post, Buckley, Schuh & Jernigan, Inc. and John Witherspoon, Ph.D., Oakridge National Laboratory, November 16, 1982.
Zellars-Williams, Inc. 1980. Evaluation of Pre-July 1, 1975 Disturbed Phosphate Lands. Lakeland, Florida.
Zimmer. 1978. Marinelli Beaker Calibration. Systems Application Studies. EG&G Ortec, PSD No. 8.
-* 1979. Data Reduction of Low Activity Gamma Spectra. System Application Studies. EG&G Ortec. PSD No. 11.
140

1980. -I LLD versus MDA. Systems Application Studies. EG&G Ortec. PSD No. 14.
141

APPENDIX A
DOSE WORKSHEETS

TABLE A-l
RECLAIMED LAND Ra-226 DCF: 1.3E-03 (mrem/pCi) =======================-=5=======================================================
DIET ITEM
INTAKE CCN OF ITEM REC
(g/day) (pCi/kg)
BROCCOLI
LEAFY Cabbage Collard Grns. Lettuce Mustard Grns. Spinach Turnip Grns. --mm->
SEEDS/GRAINS BLackeyed Pea Rice Yellow Corn ----->
ROOTS Carrot Onion Radish Turnip ----->
GENERAL Cucumber Green Beans Green Pepper Strawberries Tomato Watermelon Squash / Zucc ----->
3.51
7.04 0.45
23.38 0.45 3.28 0.45
35.05
5.61 22.94 14.41 42.96
2.92 4.19 0.32 0.42 7.85
2.62 8.80 1.99 1.23
25.18 3.44 1.26
44.53
9.23 E 3.00
20.90 E 2.10 20.90 E 6.33 20.90 E 5.04 E 20.90 E 1.44 20.90 E 16.51 90.86 10.32
7.91 2.57 26.00 E 7.10
8.63 4.90
94.42 E 8.52 10.60 E 3.12 10.60 E 3.82
7.87 5.00
5.60 3.22 3.68 5.16 5.90 E 1.87
255.90 E 2.81 5.90 E 2.94 1.87 1.24 7.90 4.11
TOTALS: 133.90 TOTAL DIET: 3071.81
INTAKE: NON-SAMPLED FOODS 1.68E+03 pCi/yr UNMINED, SAMPLED FOODS 2.33E+02
TOTAL 1.92E+03 MINED, SAMPLED FOODS 8.86E+02
TOTAL 2.57E+O3
CCN INTAKE INTAKE % OF TOTAL UNMN REC UNMN INTAKE
@X/kg) (pCi/yr) (pCi/yr) REC
l.l8E+Ol 3.85E+OO 1.33
5.38E+Ol 5.40E+OO 6.07 3.43E+00 l.O4E+OO 0.39 1.78E+02 4.30E+Ol 20.13 3.43E+OO 2.37E-01 0.39 2.50E+Ol 1.98E+Ol 2.82 1.49E+Ol 1.69E+OO 1.68 2.79E+02 7.12E+Ol 31.48
1.62E+Ol 5.27E+OO 1.83 2.18E+02 5.95E+Dl 24.58 4.54E+Ol 2.58E+Ol 5.12 2.80E+02 9.06E+Ol 31.53
l.O1E+02 9.08E+OO 11.35 1.62E+Ol 4.78E+OO 1.83 1.23E+OO 4.42E-01 0.14 1.21E+OO 7.71E-01 0.14 l.l9E+02 1.51E+Ol 13.46
5.36E+OO 3.08E+OO 0.61 l.l8E+Ol 1.66E+Ol 1.33 4.29E+OO 1.36E+OO 0.48 l.l5E+02 1.26E+OO 12.97 5.43E+Ol 2.70E+Ol 6.12 2.35E+OO 1.56E+OO 0.27 3.64E+OO 1.89E+OO 0.41 1.97E+02 5.28E+Ol 22.19
DOSE: NON-SAMPLED FOODS 2.22E+OO mrem/yr CONTROL INDIV, SAMPLED FOODS 3.08E-01
TOTAL 2.53E+OO MAX INDIV, SAMPLED FOODS l.l7E+OO
TOTAL 3.39E+OO LOCAL INDIV, SAMPLED FOODS 3.94E-01
TOTAL 2.61E+OO
8.86E+02 2.33E+02 100.00

TABLE A-2
CLAY LANDS Ra-226 DCF: 1.3E-03 (mrem/pCi) ====================~===r-I-======================================================
DIET ITEM
INTAKE CCN CCN INTAKE INTAKE % OF TOTAL OF ITEM CLAY UNMN CLAY UNMN INTAKE (g/day) @Ci/kg) WCi/kg) (pCi/yr) (pCi/yr) CLAY
BROCCOLI 3.51 22.58 3.00 2.89E+Ol 3.85E+OO 3.20
LEAFY Cabbage 7.04 10.53 Collard Grns. 0.45 46.07 Lettuce 23.38 40.41 Mustard Grns. 0.45 69.61 Spinach 3.28 20.81 Turnip Grns. 0.45 89.55 -----> 35.05
2.10 6.33 5.04 E 1.44
16.51 10.32
2.71E+Ol 5.40E+OO 3.00 7.57E+OO l.O4E+00 0.84 3.45E+02 4.3DE+Ol 38.18 1.14E+Ol 2.37E-01 1.27 2.49E+Ol 1.98E+Ol 2.76 1.47E+01 1.69E+OO 1.63 4.31E+02 7.12E+Ol 47.67
SEEDS/GRAINS Blackeyed Pea 5.61 3.96 Rice 22.94 14.70 Yellow Corn 14.41 5.30 -----> 42.96
2.57 7.10 4.90
8.11E+OO 5.27E+OO 0.90 1.23E+02 5.95E+Ol 13.63 2.79E+Ol 2.58E+Ol 3.09 1.59E+02 9.06E+Ol 17.61
ROOTS Carrot 2.92 113.07 Onion 4.19 9.91 Radish 0.32 14.90 Turnip 0.42 13.85 -----> 7.85
8.52 3.12 3.82 5.00
1.20E+02 9.08E+OO 13.33 1.52E+Ol 4.78E+OO 1.68 1.72E+OO 4.42E-01 0.19 2.13E+OO 7.71E-01 0.24 1.40E+02 1.51E+Ol 15.44
GENERAL Cucumber 2.62 11.30 E Green Beans 8.80 11.30 E Green Pepper 1.99 1.26 Strawberries 1.23 120.80 Tcinato 25.18 2.82 Uatermelon 3.44 11.30 E Squash / Zucc 1.26 6.08 -----> 44.53
3.22 5.16 1.87 2.81 2.94 1.24 4.11
l.O8E+Ol 3.08E+OO 1.20 3.63E+Ol 1.66E+Ol 4.02 9.16E-01 1.36E+OO 0.10 5.43E+Ol 1.26E+OO 6.00 2.59E+Ol 2.70E+Ol 2.87 1.42E+Ol 1.56E+OO 1.57 2.80E+OO 1.89E+OO 0.31 1.45E+02 5.28E+Ol 16.07
--
TOTALS: 133.90 TOTAL DIET: 3071.81
INTAKE: NON-SAMPLED FOODS
pCi/yr UNMINED, SAMPLED FOODS TOTAL
MINED, SAMPLED FOODS TOTAL
9.04E+02 2.33E+D2 100.00
1.68E+03 2.33E+02 1.92E+03 9.04E+02 2.59E+03
DOSE : NON-SAMPLED FOODS 2.22E+OO 3.08E-01 2.53E+OO 1.19E+OO 3.41E+OO 3.97E-01 2.62E+OO
mrem/yr CONTROL INDIV, SAMPLED FOODS TOTAL
MAX INDIV, SAMPLED FOODS TOTAL
LOCAL INDIV, SAMPLED FOODS TOTAL

TABLE A-3
DEBRIS LAND Ra-226 DCF: 1.3E-03 (mrem/pCi) _____-___--------------------------------------------------------------------- ____________________----------------------------------------------------------
DIET ITEM
INTAKE CCN CCN INTAKE INTAKE % OF TOTAL OF ITEM DEB UNMN DEB UNMN INTAKE (g/day) W/kg) W/kg) (pCi/yr) (pCi/yr) DEB
BROCCOLI 3.51 34.67 3.00 4.44E+Ol 3.85E+OO 1.55
LEAFY Cabbage 7.04 Collard Grns. 0.45 Lettuce 23.38 Mustard Grns. 0.45 Spinach 3.28 Turnip Grns. 0.45 -..---> 35.05
SEEDS/GRAINS Blackeyed Pea 5.61 Rice 22.94 Yellow Corn 14.41 -----> 42.96
ROOTS Carrot Onion Radish Turnip
2.92 113.83 8.52 4.19 33.30 E 3.12 0.32 33.30 E 3.82 0.42 23.64 5.00
32.20 2.10 86.23 6.33 45.41 5.04 E 64.22 1.44
540.25 16.51 55.47 10.32
25.60 E 2.57 82.18 E 7.10 25.60 E 4.90
-----> 7.85
1.21E+02 9.08E+OO 4.22 5.10E+Ol 4.78E+OO 1.78 3.85E+OO 4.42E-01 0.13 3.64E+OO 7.71E-01 0.13 1.80E+02 1.51E+Ol 6.26
GENERAL Cucumber 2.62 18.60 E Green Beans 8.80 9.79 Green Pepper 1.99 18.60 E Strawberries 1.23 806.68 E Tcnnato 25.18 18.60 E Uatermelon 3.44 18.60 E Squash / Zucc 1.26 5.15 -----> 44.53
3.22 5.16 1.87 2.81 2.94 1.24 4.11
1.78E+Ol 3.08E+OO 0.62 3.15E+Ol 1.66E+Ol 1.09 1.35E+Ol 1.36E+OO 0.47 3.62E+02 1.26E+OO 12.61 1.71E+02 2.70E+Ol 5.95 2.34E+Ol 1.56E+OO 0.81 2.37E+OO 1.89E+OO 0.08 6.22E+02 5.28E+Ol 21.65
--
TOTALS: 133.90 TOTAL DIET: 3071.81
2.87E+O3 2.33E+02 100.00
INTAKE: NON-SAMPLED FOODS 1.68E+03
pCi/yr UNMINED, SAMPLED FOODS 2.33E+02 TOTAL 1.92E+03
MINED, SAMPLED FOODS 2.87E+O3 TOTAL 4.56E+03
DOSE: NON-SAMPLED FOODS 2.22E+OO mrem/yr CONTROL INDIV, SAMPLED FOODS 3.08E-01
TOTAL 2.53E+OO MAX INDIV, SAMPLED FOODS 3.79E+OO
TOTAL 6.01E+oo LOCAL INDIV, SAMPLED FOODS 6.57E-01
TOTAL 2.88E+OO
8.28E+Ol 5.40E+OO 2.88 1.42E+Ol l.O4E+OO 0.49 3.88E+Ot 4.30E+Ol 13.49 1.05E+01 2.37E-01 0.37 6.47E+02 1.98E+Ol 22.52 9.11E+OO 1.69E+OO 0.32 1.15E+03 7.12E+Ol 40.07
5.25E+Ol 5.27E+OO 1.83 6.89E+02 5.95E+01 23.96 1.35E+02 2.58E+Ol 4.69 8.76E+02 9.06E+Ol 30.48

TABLE A-4
RECLAIMED LAND Pb-210 DCF: 5.4E-03 (mrem/pCi) ======e===zr=====================m=rn=e-====================================
DIET ITEM
INTAKE CCN OF ITEM REC
(g/day) (pCi/kg)
CCN INTAKE INTAKE % OF TOTAL UNMN REC UNMN INTAKE
W-i/kg) (pCi/yr) (pCi/yr) REC
BROCCOLI 3.51 24.23 4.00 RT 3.36E+Ol 5.13E+OO 19.88
3.80 E 5.43 T 3.80 E 5.43 T 3.80 E 5.43 T 3.80 E 5.43 T 3.80 E 5.43 T 3.80 E 5.43 T
2.10 E 3.00 RT 5.94 E 61.56 0.50 3.00 RT
0.40 E 1.90 T 0.40 E 1.40 T 0.40 E 1.73 T 0.40 E 1.73 T
0.70 E 1.00 RT 0.70 E 1.00 RT 0.70 E 1.00 RT
39.91 E 1.00 RT 0.70 E 1.00 RT 0.70 E 1.00 RT 0.71 1.00 RT
9.78E+OO 1.40E+Ol 5.78 6.24E-01 8.92E-01 0.37 3.25E+Ol 4.64E+Ol 19.19 6.24E-01 8.92E-01 0.37 4.55E+OO 6.51E+OO 2.69 6.24E-01 8.92E-01 0.37 4.87E+Ol 6.95E+Ol 28.76
4.30E+OO 6.15E+OO 2.54 4.98E+Ol 5.16E+02 29.43 2.63E+OO 1.58E+Ol 1.56 5.67E+Ol 5.38E+02 33.53
4.26E-01 2.02E+OO 0.25 6.13E-01 2.14E+OO 0.36 4.62E-02 2.00E-01 0.03 6.17E-02 2.67E-01 0.04 l.l5E+OO 4.64E+OO 0.68
6.71E-01 9.58E-01 0.40 2.25E+OO 3.21E+OO 1.33 5.09E-01 7.27E-01 0.30 1.79E+Ol 4.49E-01 10.60 6.44E+OO 9.20E+OO 3.81 8.80E-01 1.26E+OO 0.52 3.27E-01 4.60E-01 0.19 2.90E+Ol 1.63E+Ol 17.15
LEAFY Cabbage Co1 lard Grns. Lettuce Mustard Grns. Spinach Turnip Grns. ----->
7.04 0.45
23.38 0.45 3.28 0.45
35.05
SEEDS/GRAINS Blackeyed Pea Rice Ye1 low Corn
5.61 22.94 14.41 42.96 ----->
ROOTS Carrot Onion Radish Turnip --*-->
2.92 4.19 0.32 0.42 7.85
GENERAL Cucumber Green Beans Green Pepper Strawberries Tomato Watermelon Squash / Zucc ----->
2.62 8.80 1.99 1.23
25.18 3.44 1.26
44.53
--
TOTALS: 133.90 TOTAL DIET: 3071.81
1.69E+02 6.33E+O2 100.00
INTAKE: NON-SAMPLED FOODS 1.68E+03 pCi/yr UNMINED, SAMPLED FOODS 6.33E+02
TOTAL 2.32E+03 MINED, SAMPLED FOODS 1.69E+02
TOTAL 1.85E+03
DOSE : NON-SAMPLED FOODS 9.02E+OO mrem/yr CONTROL INDIV, SAMPLED FOODS 3.40E+OO
TOTAL 1.24E+Ol MAX INDIV, SAMPLED FOODS 9.07E-01
TOTAL 9.93E+OO LOCAL INDIV, SAMPLED FOODS 3.15E+OO
TOTAL 1.22E+Ol

TABLE A-5
CLAY LAND Pb-210 DCF: 5.4E-03 (mrem/pCi) ===r=======I===================================================================
DIET INTAKE CCN CCN INTAKE INTAKE % OF TOTAL ITEM OF ITEM CLAY UNMINED CLAY UNMINED INTAKE
(g/day) (pCi/kg) (pCi/kg) (pCi/yr) (pCi/yr) CLAY
BROCCOLI 3.51 16.07 4.00 RT 2.06E+Ol 5.13E+OO 2.14
LEAFY Cabbage Collard Grns. Lettuce Mustard Grns. Spinach Turnip Grns. ---me>
7.04 0.45
23.38 0.45 3.28 0.45
35.05
5.50 5.43 T 42.68 5.43 T 17.62 5.43 T 35.84 5.43 T 71.14 5.43 T 70.73 5.43 T
1.41E+Ol 1.40E+Ol 1.47 7.01E+OO 8.92E-01 0.73 1.50E+02 4.64E+Ol 15.61 5.89E+OO 8.92E-01 0.61 8.52E+Ol 6.51E+OO 8.84 l.l6E+ol 8.92E-01 1.21 2.74E+02 6.95E+Ol 28.46
SEEDS/GRAINS Blackeyed Pea Rice Yellow Corn ----->
5.61 22.94 14.41 42.96
15.00 E 3.00 RT 51.12 61.56 18.06 3.00 RT
3.07E+Ol 6.15E+OO 3.19 4.28E+02 5.16E+O2 44.44 9.51E+Ol 1.58E+Ol 9.86 5.54E+02 5.38E+02 57.49
ROOTS Carrot Onion Radish Turnip ----->
2.92 4.19 0.32 0.42 7.85
2.09 1.90 T 3.20 E 1.40 T 3.20 E 1.73 T 2.55 1.73 T
2.23E+OO 2.02E+OO 0.23 4.90E+OO 2.14E+OO 0.51 3.70E-01 2.00E-01 0.04 3.93E-01 2.67E-01 0.04 7.89E+OO 4.64E+OO 0.82
GENERAL Cucumber Green Beans Green Pepper Strawberries Tomato Watermelon Squash / WCC ---mm>
2.62 8.80 1.99 1.23
25.18 3.44 1.26
44.53
5.50 E 1.00 RT 5.50 E 1.00 RT 5.50 E 1.00 RT
49.04 1.00 RT 5.50 E 1.00 RT 5.50 E 1.00 RT 0.86 1.00 RT
5.27E+oo 9.58E-01 0.55 1.77E+Ol 3.21E+OO 1.83 4.00E+OO 7.27E-01 0.41 2.20E+Ol 4.49E-01 2.29 5.06E+Ol 9.20E+OO 5.25 6.92E+OO 1.26E+OO 0.72 3.96E-01 4.60E-01 0.04 l.O7E+O2 1.63E+Ol 11.09
TOTALS: 133.90 TOTAL DIET: 3071.81
IWTAKE: NON-SAMPLED FOODS 1.68E+03 pCi/yr UNMINED, SAMPLED FOODS 6.33E+02
TOTAL 2.326+03 MINED, SAMPLED FOODS 9.64E+02
TOTAL 2.65E+03
DOSE: NON-SAMPLED FOODS 9.02E+OO mrem/yr CONTROL INDIV, SAMPLED FOODS 3.40E+OO
TOTAL 1.24E+Ol MAX INDIV, SAMPLED FOODS 5.17E+OO
TOTAL 1.42E+Ol LOCAL INDIV, SAMPLED FOODS 3.58E+OO
TOTAL 1.26E+Ol
P -
9.64E+02 6.33E+02 100.00

TABLE A-6
DEBRIS LAND Pb-210 DCF: 5.4E-03 (mretn/pCi) _______-____-_---_------------------------------------------------------------ ___________-_-----------------------------------------------------------------
DIET ITEM
INTAKE CCN CCN INTAKE INTAKE % OF TOTAL OF ITEM DEB UNMN DEB UNMN INTAKE (g/day) (pCi/kg) (pCi/kg) (pCi/yr) Wi/yr) DEB
BROCCOLI 3.51 60.09 4.00 RT 7.70E+Ol 5.53E+OO 3.38
LEAFY Cabbage 7.04 122.61 Collard Grns. 0.45 33.29 Lettuce 23.38 75.56 Mustard Grns. 0.45 0.50 Spinach 3.28 166.49 Turnip Grns. 0.45 40.48 m-w--> 35.05
5.43 T 5.43 T 5.43 T 5.43 T 5.43 T 5.43 T
3.15E+02 1.40E+Ol 13.a4 5.47E+OO 8.92E-01 0.24 6.45E+02 4.64E+Ol 28.31 8.21E-02 8.92E-01 0.00 1.99E+02 6.51E+OO a.75 6.65E+OO 8.92E-01 0.29 1.17E+03 6.95E+Ol 51.44
SEEDS/GRAINS Blackeyed Pea 5.61 22.00 E Rice 22.94 62.26 E Yellow Corn 14.41 22.00 E -*---> 42.96
3.00 RT 61.56
3.00 RT
4.51E+Ol 6.15E+OO 1.98 5.22E+02 5.16E+02 22.89 l.l6E+O2 l.SaE+Ol 5.08 6.83E+O2 5.38E+O2 29.95
ROOTS Carrot Onion Radish Turnip ---mm>
2.92 5.97 4.19 4.70 E 0.32 4.70 E 0.42 10.22 7.85
1.90 T 1.40 T ‘I.73 T 1.73 T
6.36E+OO 2.02E+OO 0.28 7.20E+OO 2.14E+OO 0.32 5.43E-01 2.00E-01 0.02 1.58E+OO 2.67E-01 0.07 1.57E+Ol 4.64E+OO 0.69
GENERAL Cucusber 2.62 8.00 E Green Beans 8.80 8.00 E Green Pepper 1.99 8.00 E Strawberries 1.23 456.19 E Tcmeto 25.18 8.00 E Uatermelon 3.44 8.00 E Squash / 2ucc 1.26 8.00 E -----> 44.53
1.00 RT
1.00 RT 1.00 RT 1.00 RT 1.00 RT 1.00 RT 1.00 RT
7.66E+OO 9.58E-01 0.34 2.57E+Ol 3.21E+00 1.13 5.81E+OO 7.27E-01 0.26 2.05E+02 4.49E-01 a.99 7.36E+Ol 9.20E+OO 3.23 l.OlE+Ol 1.26E+OO 0.44 3&E+OO 4.60E-01 0.16 3.31E+02 1.63E+Ol 14.54
--
TOTALS: 133.90 TOTAL DIET: 3071.81
2.28E+03 6.33E+02 100.00
INTAKE: NON-SAMPLED FOODS
pCi/yr UNMINED, SAMPLED FOODS TOTAL
MINED, SAMPLED FOODS TOTAL
1.6aE+03 6.33E+02 2.32E+03 2.2aE+03 3.96E+O3
DOSE: NON-SAMPLED FOODS 9.02E+OO mrem/yr CONTROL INDIV, SAMPLED FOODS 3.40E+OO
TOTAL 1.24E+Ol MAX INDIV, SAMPLED FOODS 1.22E+Ol
TOTAL 2.12E+Ol LOCAL INDIV, SAMPLED FOODS 4.2aE+oo
TOTAL 1.33E+Ol

TABLE A-7
RADIONUCLIDE INTAKE FROM FOOD (pCi/yr)
LOCAL INDIVIDUAL MAXIMUM INDIVIDUAL -===ii=========i===~=-- ------ -===========-------=i__=
SAMPLED TOTAL ATTRIB. SAMPLED TOTAL ATTRIB. FOODS DIET FOODS DIET
CONTROL Ra-226 233 1915 233 1915 Pb-210 633 2315 633 2315
MINING-RELATED m===zs=*=--
RECLAIMED Ra-226 298 1985 65 886 2568 653 Pb-210 587 2269 0 169 1851 0
CLAY Ra-226 300 1987 67 904 2586 671 Pb-210 666 2348 33 964 2646 331
DEBRIS Ra-226 497 2184 264 2874 4556 2641 Pb-210 798 2480 165 2279 3961 1646
NOTE: "ATTRIB." is the intake attributable to the mining-related land of interest, and is equivalent to the difference of the sampled value and the corresponding control value. Zero entries indicate that no additional intake was detected.

TABLE A-8
RADIONUCLIDE DOSE FROM FOOD (mrem/yr)
LOCAL INDIV. MAXIMUM INDIV. =-~==--======~======-= -===========I==========
SAMPLED TOTAL ATTRIB. SAMPLED TOTAL ATTRIB. FOODS DIET FOODS DIET
CONTROL Ra-226 0.3 2.5 0.3 2.5 Pb-210 3.4 12.4 3.4 12.4 TOTAL 3.7 14.9 3.7 14.9
MINING-RELATED =e========I_=
RECLAIMED Ra-226 0.4 2.6 0.1 1.2 3.4 0.9 Pb-210 3.2 12.2 0.0 0.9 9.9 0.0 TOTAL 3.6 14.8 0.0 2.1 13.3 0.0
CLAY Ra-226 0.4 2.6 0.1 1.2 3.4 0.9 Pb-210 3.6 12.6 0.2 5.2 14.2 1.8 TOTAL 4.0 15.2 0.3 6.4 17.6 2.7
DEBRIS Ra-226 0.7 2.9 0.4 3.8 6.0 3.5 Pb-210 4.3 13.3 0.9 10.2 21.7 6.8 TOTAL 5.0 16.2 1.3 16.0 27.2 12.3
NOTE: "ATTRIB." is the dose attributable to the mining-related land of interest, and is equivalent to the difference of the sampled value and the corresponding control dose. Zero entries indicate that no additional dose was detected.

TABLE A-9
GROCERY Pb-210 m-========---==P==--E
DCF: 5.43-03 (mrem/pCi)
DIET ITEM
INTAKE CCN OF ITEM GROC (g/day) (PWW
CCN INTAKE INTAKE UNMN GROC UNMN
(PWW (pWyr> (pWyr>
BROCCOLI
LEAFY Cabbage Collard Grns. Lettuce Mustard Grns. Spinach Turnip Grns. ----- >
SEEDS/GRAINS Blackeyed Pea Rice Yellow Corn ---- ->
ROOTS Carrot Onion Radish Turnip ----- >
GENERAL Cucumber Green Beans Green Pepper Strawberries Tomato Watermelon Squash / Zucc ----- >
3.51 9.26 4.00 RT
7.04 9.13 0.45 24.26
23.38 0.45 3.28 0.45
35.05
5.61 22.94 14.41 117.12 42.96
2.92 0.50 4.19 0.32 0.42 31.38 7.85
2.62 0.50 8.80 12.66 1.99 1.23 45.94
25.18 15.73 3.44 1.26 2.72
44.53
5.43 T 5.43 T 5.43 T 5.43 T 5.43 T 5.43 T
3.00 RT 61.56
3.00 RT
1.90 T 1.40 T 1.73 T 1.73 T
1.00 RT 1.00 RT 1.00 RT 1.00 RT 1.00 RT 1.00 RT 1.00 RT
TOTALS: 133.90 TOTAL DIET: 3071.81
l.l9E+Ol 5.13E+OO
2.353+01 1.40E+Ol 3.983+00 8.923-01
4.643+01 8.923-01 6.51E+OO 8.923-01 6.953+01
6.15E+OO 5.163+02
6.163+02 1.58E+Ol 5.383+02
5.333-01 2.02E+OO 2.14E+OO 2.00E-01
4.843+00 2.673-01 4.643+00
4.793-01 9.583-01 4.07E+Ol 3.21E+OO
7.273-01 2.06E+Ol 4.493-01 1.453+02 9.20E+OO
1.26E+OO 1.25E+OO 4.60E-01
1.63E+Ol
6.333+02
NOTE: Potatoes had 35.85 pCi/kg Pb-210 and 9.85 pCi/kg Ra-226. All crops analyzed for PO-210 had levels less than detectable. Green beans had 9.12 pCi/kg Ra-226.

TABLE A-10
PO-210 DCF: 1.9E-03 (mrem/pCi) =====mm=====s= ==s= -======3=======-====----=========--=====
DIET ITEM
INTAKE CCN OF ITEM REC (g/day) (W-/kg)
CCN CLAY
(W-/kg)
BROCCOLI 3.51 3.36 0.50
LEAFY Cabbage Collard Grns. Lettuce Mustard Grns. Spinach Turnip Grns. ----- >
7.04 0.45
23.38 0.45 3.28 0.45
35.05
0.74 1.33 0.50 0.73 7.57 6.00 5.39 13.49
19.57 28.20 18.89 0.50
SEEDS/GRAINS Blackeyed Pea Rice Yellow Corn ----- >
5.61 22.94 14.41 42.96
1.62 0.50 5.98
ROOTS Carrot Onion Radish Turnip -_-_ ->
2.92 4.19 0.32 0.42 7.85
1.76 2.33
1.22 0.50
GENERAL Cucumber Green Beans Green Pepper Strawberries Tomato Watermelon Squash / Zucc ---we >
2.62 8.80 1.99 1.23
25.18 3.44 1.26
44.53 0.61 0.91
TOTALS: 133.90 TOTAL DIET: 3071.81
CCN DEB
(PWW
CCN
0.50

APPENDIX B
RAW DATA

1


1
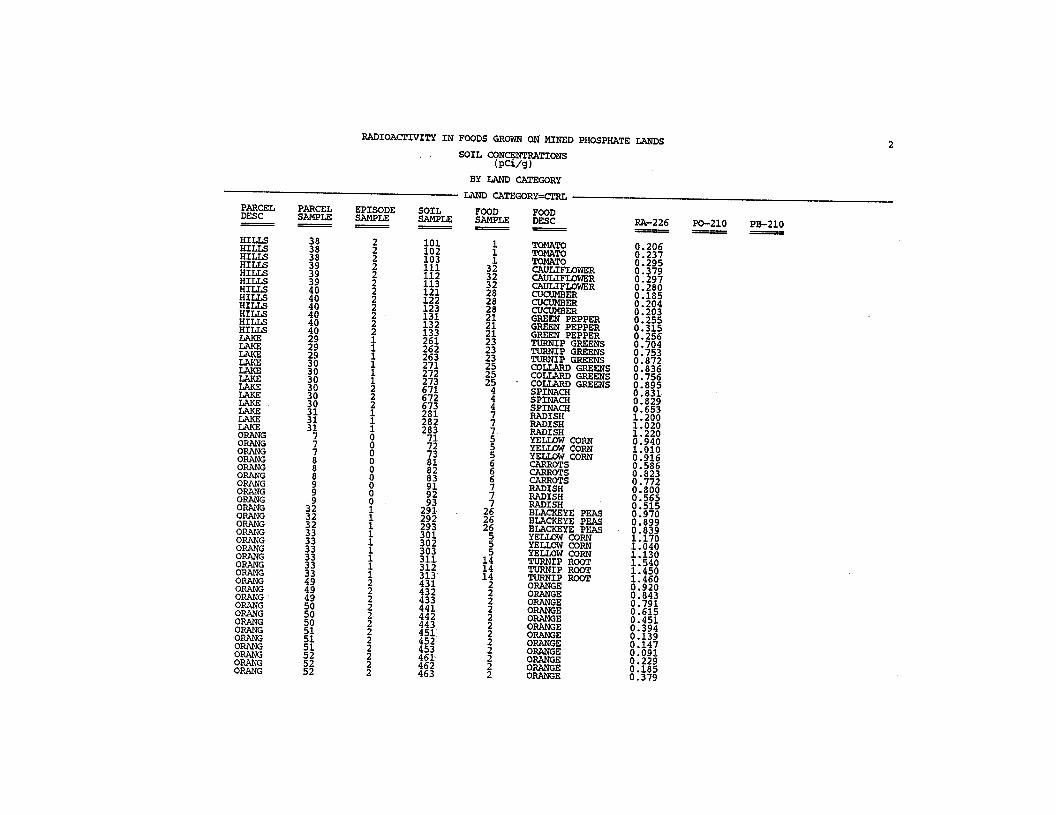

3

4
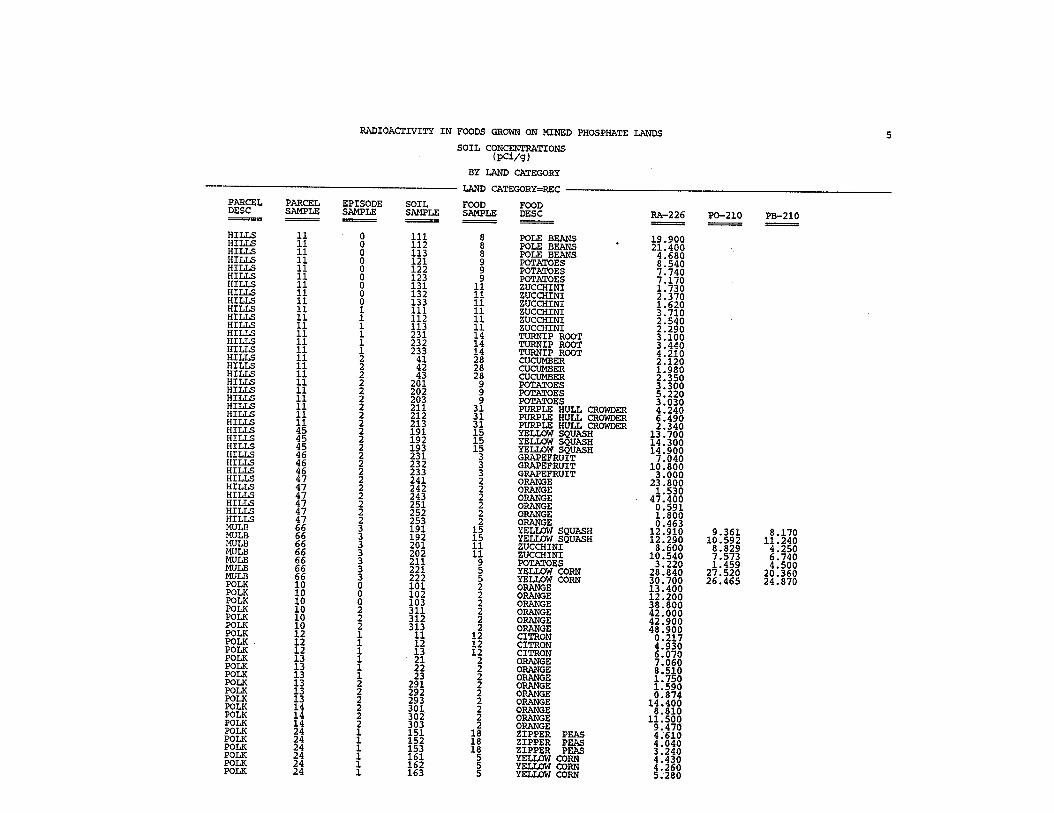

6


11