radiometric information content for water vapor and...
TRANSCRIPT

IEEE JOURNAL OF SELECTED TOPICS IN APPLIED EARTH OBSERVATIONS AND REMOTE SENSING, VOL. 8, NO. 2, FEBRUARY 2015 859
Radiometric Information Content for Water Vaporand Temperature Profiling in Clear Skies
Between 10 and 200 GHzSwaroop Sahoo, Xavier Bosch-Lluis, Steven C. Reising, Senior Member, IEEE,
and Jothiram Vivekanandan, Senior Member, IEEE
Abstract—Atmospheric profiles of water vapor and temper-ature can be estimated using appropriate retrieval algorithmsbased on radiometric measurements and atmospheric statistics.Radiometric measurements at multiple frequencies contributeinformation to profile retrieval, although at some frequencies theinformation they provide can be highly correlated with that atother frequencies due to similar sensitivities to changes in atmo-spheric pressure, temperature, and water vapor mixing ratio asa function of altitude. The goal for profile retrieval is to obtainas many independent measurements as possible, both to maxi-mize the vertical resolution and to minimize the retrieval errorof the profile. The goal of this study is to determine sets of fre-quencies in the range from 10 to 200 GHz that provide the largestamount of mutually independent information on water vapor andtemperature profiles from ground and airborne instruments forclear sky measurements. Results of such a study are importantand useful for frequency selection and design of microwave andmillimeter-wave radiometers for humidity and temperature profil-ing. A branch and bound feature selection algorithm has been usedto determine sets of frequencies between 10 and 200 GHz that havethe greatest number of degrees of freedom (DOF) for water vaporand temperature retrieval. In general, it has been found that thefrequency ranges of 20–23, 85–90, and 165–200 GHz are useful forwater vapor profile retrieval, whereas the frequency ranges of 55–65 and 116–120 GHz are useful for temperature profile retrieval.Finally, an analysis has been performed to determine the impact ofmeasurement uncertainty on the number of DOF of measurementand also on the vertical resolution. It was also found that verticalresolution is directly related to the number of DOF.
Index Terms—Atmospheric measurements, feature selection,humidity, radiometry, remote sensing, temperature.
I. INTRODUCTION
T YPICALLY, retrieval algorithms use frequencies nearwater vapor absorption at 22.235 and 183.31 GHz [1],
[2] for humidity profile retrieval as well as frequencies near
Manuscript received April 10, 2014; revised September 11, 2014; acceptedOctober 09, 2014. Date of publication December 23, 2014; date of currentversion February 09, 2015. This work was supported in part by the U.S.National Aeronautics and Space Administration, Science Mission Directorate,Earth Science Technology Office, as part of the Instrument Incubator Programunder Grant NNX11AH05G and Grant NNX14AK70G.
S. Sahoo, X. Bosch-Lluis, and S. C. Reising are with the Microwave SystemsLaboratory, Department of Electrical and Computer Engineering, ColoradoState University, Fort Collins, CO 80523 USA (e-mail: [email protected];[email protected];[email protected]).
J. Vivekanandan is with the Earth Observing Laboratory, University Centerfor Atmospheric Research, Boulder CO 80301 USA (e-mail: [email protected]).
Color versions of one or more of the figures in this paper are available onlineat http://ieeexplore.ieee.org.
Digital Object Identifier 10.1109/JSTARS.2014.2364394
60 GHz for temperature profile retrieval [3]. These frequencyranges provide the largest amount of information on watervapor and temperature in the troposphere as a function of alti-tude. However, accurately determining sets of frequencies thatprovide the maximum amount of information for retrievals isimportant to optimize the use of resources when designing andfabricating microwave and millimeter-wave radiometers.
Previous research has focused on information content anal-ysis of the frequency range of 20–70 GHz using eigenvalueanalysis of the weighting function (WF) covariance matrix [4].The WF or Jacobian is the sensitivity of ground-based zenith-viewing brightness temperatures to change in the atmosphericparameter of interest, as shown in (1) and (2) for the parametersof water vapor and temperature, respectively, [5]
WFρv(s) = e−τ(0,s) ∂α(s)
∂ρv
[T ′(s)− Tb0e
−τ(s,∞)
−∫ ∞
s
T ′(s′)αe−τ(s,s′)ds′]
(1)
WFT (s) =dT ′
dTα(s)e−τ(0,s) + e−τ(0,s) ∂α(s)
∂T
×[T ′(s)− Tb0e
−τ(s,∞) −∫ ∞
s
T ′(s′)αe−τ(s,s′)ds′]
(2)
where s represents the altitude above ground; α(s) is the totalabsorption coefficient; ρv(s) is the water vapor density; T (s)is the temperature; T ′(s) = T (s)
R(T ) ; R(T ) = 1, where R(T ) isthe Rayleigh–Jeans approximation factor [6]; Tb0 is the cosmicbackground radiation; and τ(s1, s2) is the optical depth from s1to s2, given by τ(s1, s2) =
∫ s2s1
α(s)ds.Other previous work has focused on finding the rank of fre-
quencies in 18–37 GHz range to determine those suitable forestimating the wet-path delay using microwave radiometers [7].This analysis consists of constructing two- and three-frequencysets for 18–37 GHz frequency range. Measurements were sim-ulated for each frequency set using radiosonde data collectedfrom various launch sites, and each set was ranked based on itsretrieval noise.
Additionally, the WFs in the frequency range of 10–1000 GHz were analyzed to identify frequencies that are usefulin retrieving water vapor and temperature profiles with high ver-tical resolution from nadir-viewing airborne radiometer mea-surements [8]. The selected frequency ranges were 43–86 GHzand 121–183 GHz for temperature and water vapor retrieval,
1939-1404 © 2014 IEEE. Personal use is permitted, but republication/redistribution requires IEEE permission.See http://www.ieee.org/publications_standards/publications/rights/index.html for more information.

860 IEEE JOURNAL OF SELECTED TOPICS IN APPLIED EARTH OBSERVATIONS AND REMOTE SENSING, VOL. 8, NO. 2, FEBRUARY 2015
respectively. These frequency sets were found to provide thebest resolution for retrieval over the range of effective heights[8] from 1.9 to 6.4 km, although this result varies slightlywith season and geographic location. The water vapor and tem-perature WFs [8] for nadir-viewing radiometers are given in(3) and (4)
WF ↑ρv(s) = e−τ(s,h) ∂α(s)
∂ρv
[T ′(s)− T 0↓RE
b0 e−τ(0,s)
−∫ s
0
T ′(s′)αe−τ(s′,s)ds′]+WF ↓R
ρv(s) (3a)
T 0↓REb0 = (1− r)T ′(f, TS) + (rTB (f, 0,∞)) (3b)
WF ↓Rρv
(s) = e−τ(0,s)rWFρv(s) (3c)
WF ↑T (s) =
dT ′
dTα(s)e−τ(s,h) + e−τ(s,h) ∂α(s)
∂T
×[T ′(s)−
∫ s
0
T ′(s′)αe−τ(s,s′)ds′ − e−τ(0,s)
×{(1− r)T ′ + r(T ′(f, Ts) +WFT (s))}](4)
where
h observation height above ground level;r surface reflection coefficient;TS surface temperature;(1− r)T ′(f, TS) brightness temperature emitted from the
surface;TB(f, 0,∞) downwelling brightness temperature;(rTB(f, 0,∞)) atmospheric downwelling brightness
temperature reflected from the surface;T 0↓REb0 sum of the reflected and the emitted
radiation; andWFρv
and WFT downwelling water vapor andtemperature WFs from (1) and (2),respectively.
To extend and expand upon previous work, this paper focuseson determining the maximum number of independent mea-surements possible in the range from 10 to 200 GHz, witha bandwidth of 100 MHz, for the retrieval of atmosphericwater vapor and temperature profiles using zenith-pointingground-based and nadir-pointing airborne radiometers under avariety of clear sky atmospheric conditions, including winterand summer weather, as well as over the diurnal cycle.
II. FREQUENCY IDENTIFICATION PROCESS BASED ON
FEATURE SELECTION TO MAXIMIZE THE NUMBER OF
DEGREES OF FREEDOM
The strategy used in this work is to identify the nonredundantfrequencies in the range from 10 to 200 GHz, with a bandwidthof 100 MHz, which contribute to water vapor and temperatureprofile retrieval, with the goals of fine vertical resolutionand good retrieval accuracy. The 100-MHz bandwidth is arequirement to ensure that the frequency channels do not“average over” any features of interest. However, from a
practical point of view, radiometers often have bandwidthsgreater than 100 MHz to reduce noise, but this should nothave a significant impact on this study. The number of degreesof freedom (DOF) is used as a criterion and is consideredto be the same as the number of independent measurementsin the retrieval solution. To determine this number, we firstselect those frequency sets that are the most sensitive to theatmospheric parameter of interest and retrieve the parameterwith optimum vertical resolution from ground level to the topof the troposphere (∼10 km). A feature selection algorithm isused to determine the most significant frequencies by selectingthose with linearly independent WFs, i.e., those providingnonredundant information. The WFs are calculated using (1)and (2) for zenith-pointing ground-based radiometers and (3)and (4) nadir-pointing airborne radiometers.
WFs are dependent on atmospheric conditions and onmeasurement frequency. Therefore, atmospheric parametersare needed to compute the WF for each frequency. Theseparameters can be obtained from radiosondes that are launched2–4 times daily from many weather stations in and nearpopulated areas of the world’s land masses. This study usesradiosonde data from the U.S. Department of Energy (DOE)’sAtmospheric Radiation Measurement (ARM) Southern GreatPlains (SGP) site near Lamont, Oklahoma (OK), USA tocalculate the WFs [9].
A. Feature Selection and Number of DOF
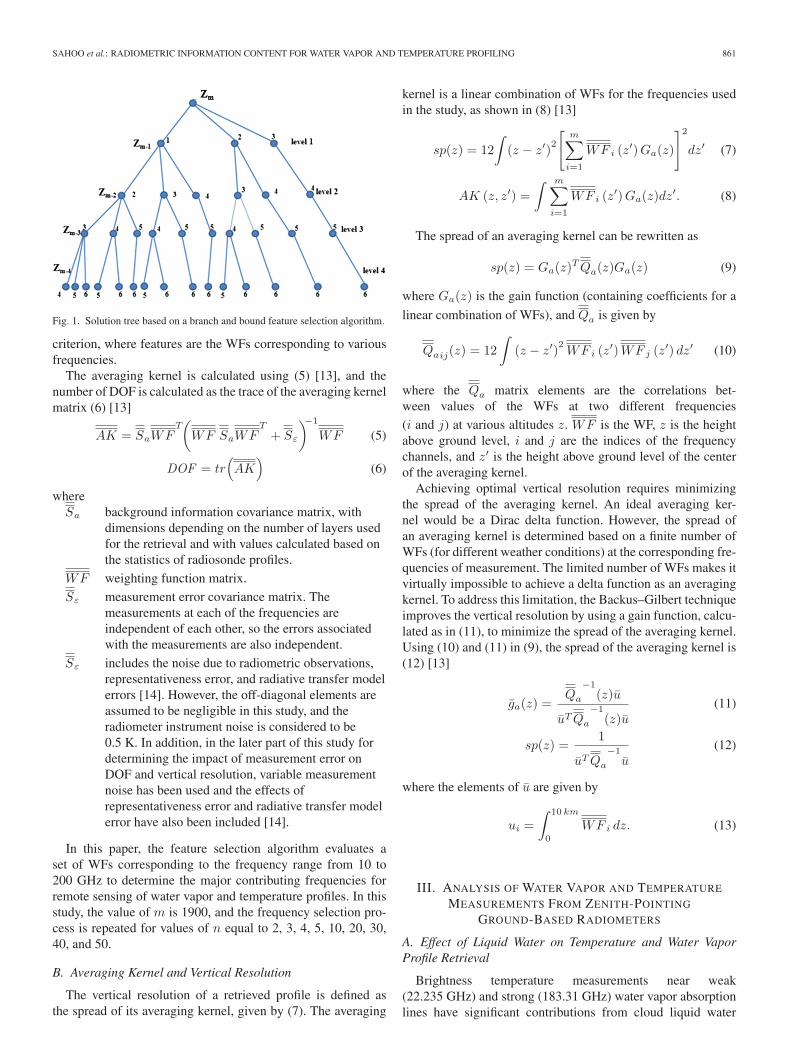
Feature selection [10], [11], also known as variable selection,is the process of selection of a subset of relevant variables froma larger set. For this study, the variables are the measurementfrequencies. When using a feature selection algorithm, the mainassumption is that the data (here the WFs) have some redundantor irrelevant elements and the goal is to identify and removethem. Therefore, feature selection is a dimensionality reductionalgorithm. In this study, a branch and bound algorithm [12] isused, as described below.
Assume that a set Zm contains relevant, redundant, andunnecessary features, i.e., X1, X2, X3, . . . Xm, where m is thetotal number of elements of the set. The selection algorithmprovides a subset of n elements, Zn which are those n elementsthat have the most relevant features within Zm. To select thesubset Zn, a selection criterion J has to be defined.
If J is monotonic, any subset of features should have a valueof J that is less than or equal to that of any proper superset orsuperset. However, excluding a particular feature from a largeset may not significantly impact the criterion values (i.e., num-ber of DOF). Therefore, each feature in the m-feature superset(Zm in Fig. 1) is removed (one at a time), and the value ofJ is evaluated for each of the resulting subsets at level 1 inFig. 1. The subset with the maximum value of J(Zm−1) at level1 is selected, and all other subsets are discarded. All subsets ofZm−1 at level 2 have a value of J that is less than or equal tothat of Zm−1. The subset of Zm−1 (at level 2 in Fig. 1) withthe maximum value of J(Zm−2) is selected, while others arediscarded. This process of selecting the subset with the maxi-mum value of J and discarding all others is repeated until thedesired number of features is selected. In this study, the numberof DOF for a set of features under consideration is the selection
SAHOO et al.: RADIOMETRIC INFORMATION CONTENT FOR WATER VAPOR AND TEMPERATURE PROFILING 861
Fig. 1. Solution tree based on a branch and bound feature selection algorithm.
criterion, where features are the WFs corresponding to variousfrequencies.
The averaging kernel is calculated using (5) [13], and thenumber of DOF is calculated as the trace of the averaging kernelmatrix (6) [13]
AK = SaWFT(WF SaWF
T+ Sε
)−1
WF (5)
DOF = tr(AK
)(6)
whereSa background information covariance matrix, with
dimensions depending on the number of layers usedfor the retrieval and with values calculated based onthe statistics of radiosonde profiles.
WF weighting function matrix.
Sε measurement error covariance matrix. Themeasurements at each of the frequencies areindependent of each other, so the errors associatedwith the measurements are also independent.
Sε includes the noise due to radiometric observations,representativeness error, and radiative transfer modelerrors [14]. However, the off-diagonal elements areassumed to be negligible in this study, and theradiometer instrument noise is considered to be0.5 K. In addition, in the later part of this study fordetermining the impact of measurement error onDOF and vertical resolution, variable measurementnoise has been used and the effects ofrepresentativeness error and radiative transfer modelerror have also been included [14].
In this paper, the feature selection algorithm evaluates aset of WFs corresponding to the frequency range from 10 to200 GHz to determine the major contributing frequencies forremote sensing of water vapor and temperature profiles. In thisstudy, the value of m is 1900, and the frequency selection pro-cess is repeated for values of n equal to 2, 3, 4, 5, 10, 20, 30,40, and 50.
B. Averaging Kernel and Vertical Resolution
The vertical resolution of a retrieved profile is defined asthe spread of its averaging kernel, given by (7). The averaging
kernel is a linear combination of WFs for the frequencies usedin the study, as shown in (8) [13]
sp(z) = 12
∫(z − z′)2
[m∑i=1
WF i (z′)Ga(z)
]2
dz′ (7)
AK (z, z′) =∫ m∑
i=1
WF i (z′)Ga(z)dz
′. (8)
The spread of an averaging kernel can be rewritten as
sp(z) = Ga(z)TQa(z)Ga(z) (9)
where Ga(z) is the gain function (containing coefficients for a
linear combination of WFs), and Qa is given by
Qaij(z) = 12
∫(z − z′)2 WF i (z
′)WF j (z′) dz′ (10)
where the Qa matrix elements are the correlations bet-ween values of the WFs at two different frequencies
(i and j) at various altitudes z. WF is the WF, z is the heightabove ground level, i and j are the indices of the frequencychannels, and z′ is the height above ground level of the centerof the averaging kernel.
Achieving optimal vertical resolution requires minimizingthe spread of the averaging kernel. An ideal averaging ker-nel would be a Dirac delta function. However, the spread ofan averaging kernel is determined based on a finite number ofWFs (for different weather conditions) at the corresponding fre-quencies of measurement. The limited number of WFs makes itvirtually impossible to achieve a delta function as an averagingkernel. To address this limitation, the Backus–Gilbert techniqueimproves the vertical resolution by using a gain function, calcu-lated as in (11), to minimize the spread of the averaging kernel.Using (10) and (11) in (9), the spread of the averaging kernel is(12) [13]
ga(z) =Qa
−1(z)u
uTQa
−1(z)u
(11)
sp(z) =1
uTQa
−1u
(12)
where the elements of u are given by
ui =
∫ 10 km
0
WF i dz. (13)
III. ANALYSIS OF WATER VAPOR AND TEMPERATURE
MEASUREMENTS FROM ZENITH-POINTING
GROUND-BASED RADIOMETERS
A. Effect of Liquid Water on Temperature and Water VaporProfile Retrieval
Brightness temperature measurements near weak(22.235 GHz) and strong (183.31 GHz) water vapor absorptionlines have significant contributions from cloud liquid water

862 IEEE JOURNAL OF SELECTED TOPICS IN APPLIED EARTH OBSERVATIONS AND REMOTE SENSING, VOL. 8, NO. 2, FEBRUARY 2015
Fig. 2. Microwave and millimeter-wave absorption spectra from 10 to 200 GHzfor water vapor density of 15.1 g/m3, temperature of 297 K and cloud liquidwater density of 0.1 g/m3.
and precipitation, when present, which can be major sourcesof error in water vapor retrieval. The contributions from cloudsand precipitation can be due to scattering and/or absorptionat microwave and millimeter-wave frequencies. Fig. 2 showsmicrowave and millimeter-wave absorption spectra of watervapor, oxygen, and liquid water absorption coefficients for10–200 GHz.
Typically, scattering occurs in nonprecipitating ice clouds,whereas absorption occurs in liquid clouds. The emission byclouds is also affected by cloud thermodynamic temperature[15]. Cloud liquid is a significant contributor to measuredbrightness temperature near the weak water vapor absorptionline at 22.235 GHz. However, water drops in clouds can bevery small compared to the wavelength of the radiation, so theRayleigh approximation can be used. Based on this approx-imation, scattering can be neglected in the forward radiativetransfer equations, so only absorption models are used [16].Water vapor profile retrieval with current methods is highlyinaccurate during precipitation [17], unless specifically tunedfor it [18]. For this reason, in this study, cloudy conditions havenot been considered, and all the cases used in this study are forclear sky conditions.
B. Determining Measurement Frequencies for Ground-BasedWater Vapor Profiling
A branch and bound feature selection technique is appliedto the water vapor WFs calculated using (1) for frequen-cies in the range from 10 to 200 GHz. As described inSection II, WFs have been calculated using radiosondeslaunched from the ARM SGP site. These WFs have beencalculated for four “typical” weather conditions, i.e., win-ter day/night and summer day/night based on radiosondeslaunched during December/January and June/July for winterand summer, respectively, and at noon/midnight for day/night,respectively. The frequencies selected for each value of n areshown in Fig. 3, where n is the number of main contributingfrequencies, as defined in Section II-A.
For any of these four combinations of season and time ofday, frequencies near the weak water vapor absorption line at
Fig. 3. Main contributing frequencies for water vapor profile retrieval from aground-based radiometer determined using the feature selection method for thefrequency range of 10–200 GHz. The width of the horizontal axis divisions is5 GHz.
TABLE IFIRST 10 FREQUENCIES (IN GHZ) SELECTED FOR WATER VAPOR
PROFILE RETRIEVAL FROM GROUND-BASED MEASUREMENTS FOR
WINTER DAY/NIGHT AND SUMMER DAY/NIGHT CONDITIONS
22.235 GHz are selected as the first contributing measurementfrequency for water vapor sensing, in agreement with previ-ous work [7]. The first 10 selected frequencies for water vaporretrieval in each case are given in Table I. Similarly, frequen-cies relatively close to the strong water vapor absorption line at183.31 GHz are selected as the second contributing frequency,near 200 GHz. When the number of frequencies to be selectedis greater than 2, the frequencies selected vary with the seasonand time of the day. When the number of frequencies selectedis 3 and 4, frequencies near 90 and 165 GHz are also selectedalong with the frequencies near 23 and 183 GHz.
The selected frequencies were analyzed to determine thenumber of independent pieces of information by calculatingtheir number of DOF using (5) and (6). The parameters requiredfor the averaging kernel in (5), i.e., background covariance
matrix Sa and WF matrix WF , are calculated using a back-ground data set of radiosonde profiles measured at the ARMSGP site [9]. The background data set is a collection of watervapor and temperature profiles for the appropriate season andtime of the day, i.e., winter day/night or summer day/nightfor this study. Similarly, WFs are calculated using mean watervapor and temperature profiles from the same data set. Thenumber of DOF is calculated for each set of selected frequen-cies based on the value of n. This process is followed for anumber of background data sets, and the resulting mean andstandard deviation for each value of n are shown in Fig. 4. It canbe seen that the number of DOF is slightly lower during win-ter than during summer, for both day and night. This is because

SAHOO et al.: RADIOMETRIC INFORMATION CONTENT FOR WATER VAPOR AND TEMPERATURE PROFILING 863
Fig. 4. Number of DOF for water vapor profile retrieval from ground-basedradiometer measurements under four different clear-sky weather conditions,i.e., winter day/night and summer day/night, for the frequency range of10–200 GHz.
water vapor profiles are more variable during summer than dur-ing winter. When the number of frequencies selected is in therange of 2–5, the mean number of DOF increases linearly withthe number of selected frequencies. When the number of fre-quencies selected is in the range of 5–20, the number of DOFcontinues to increase, but at a much slower rate. For the rangeof 20–50 frequencies, the number of DOF saturates. The rangeof maximum number of DOF (for a mean profile) is 5–6.2 forany atmospheric condition. Hence, increasing the number ofselected frequencies of measurement above a certain value doesnot significantly increase the number of independent pieces ofinformation. For example, the number of DOF increases byonly one or two as the number of measurement frequencies isincreased from 10 to 40.
It is also important to determine the vertical resolution of theretrieval using the selected frequencies. In this study, verticalresolution is defined as spread of the averaging kernel basedon the Backus–Gilbert technique, as described in Section II-B.Vertical resolution is computed as the spread of the averagingkernel for the first two frequencies selected for winter and sum-mer daytime using (12) for a height range of 0–10 km aboveground level, as shown by the black curves in Fig. 5(a) forwinter and (b) for summer. Similarly, the vertical resolution iscalculated for the first three selected frequencies, as shown bythe red curves in Fig. 5. This process is continued for 4, 5, and10 selected frequencies.
There is a general trend of degradation in vertical resolu-tion as the altitude increases. However, the spread decreases(and vertical resolution improves) as the number of selected fre-quencies increases. The vertical resolution for 10 measurementsis approximately 0.5–1.5 km from 0 to 2 km above groundlevel for both winter and summer. However, from 2 to 9 kmabove ground level the vertical resolution for 10 measurementsis approximately 1.5–3 km.
The WFs corresponding to the frequencies contributing thegreatest number of independent pieces of information as well asimproving the vertical resolution of water vapor profile retrievalare shown in Fig. 6.
Fig. 5. Vertical resolution for water vapor profile retrieval from a ground-basedradiometer as a function of altitude for (a) winter and (b) summer daytime.
Fig. 6. WFs for the frequencies selected for water vapor profile retrieval fromground-based radiometer measurements in the range from 10 to 200 GHz.
WFs corresponding to 131.3, 165.3, and 198.9 GHz showthat these measurement frequencies are sensitive to water vaporin the lower parts of the troposphere and hence are comple-mentary to 21.3 GHz for estimation of water vapor profiles.Frequencies closer to the strong water vapor absorption line aremore sensitive to changes in water vapor close to the ground.The WF at 198.9 GHz is highly sensitive to small changesin water vapor, as noted by Cimini et al. [19] and Racetteet al. [20]. This and similar frequencies are useful to retrievethe water vapor profile in very dry climates, such as the polarregions [19]. Measurements close to 90.5 GHz in the win-dow region from approximately 85–110 GHz have been usedto estimate the total precipitable water, as described by Payneet al. [21].
C. Determining Measurement Frequencies for Ground-BasedTemperature Profiling
Temperature profiles have been retrieved from satellite-basedradiometric measurements in the range from 50 to 70 GHz [22],
864 IEEE JOURNAL OF SELECTED TOPICS IN APPLIED EARTH OBSERVATIONS AND REMOTE SENSING, VOL. 8, NO. 2, FEBRUARY 2015
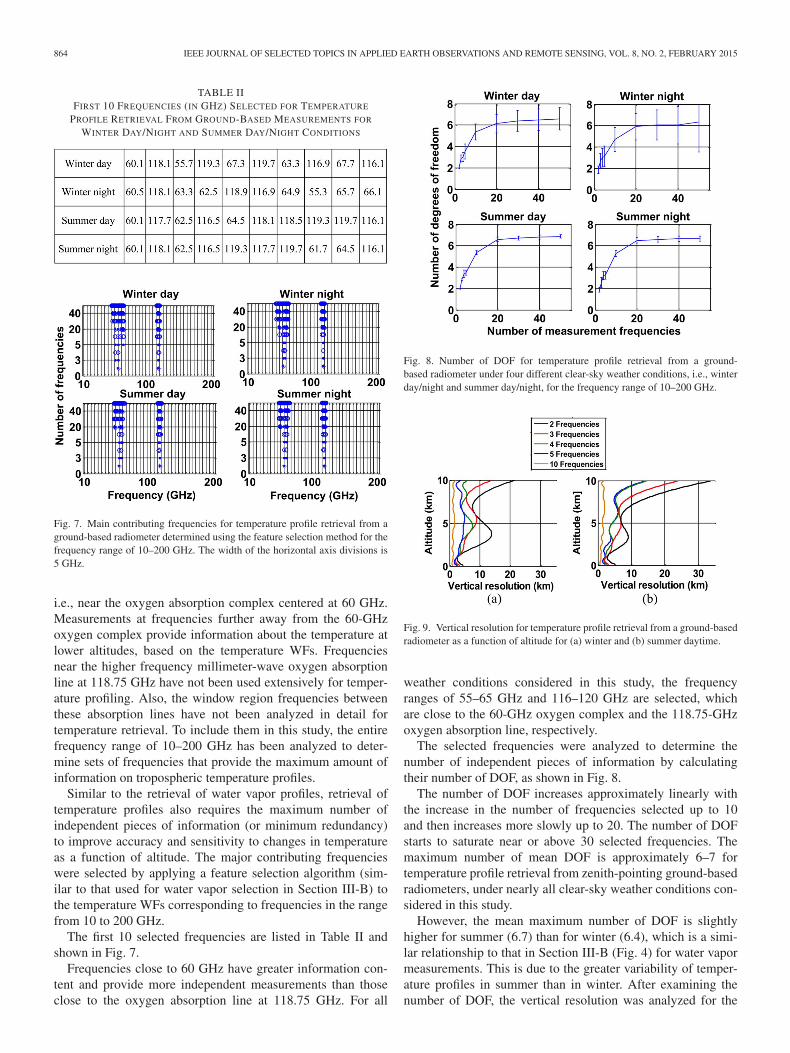
TABLE IIFIRST 10 FREQUENCIES (IN GHZ) SELECTED FOR TEMPERATURE
PROFILE RETRIEVAL FROM GROUND-BASED MEASUREMENTS FOR
WINTER DAY/NIGHT AND SUMMER DAY/NIGHT CONDITIONS
Fig. 7. Main contributing frequencies for temperature profile retrieval from aground-based radiometer determined using the feature selection method for thefrequency range of 10–200 GHz. The width of the horizontal axis divisions is5 GHz.
i.e., near the oxygen absorption complex centered at 60 GHz.Measurements at frequencies further away from the 60-GHzoxygen complex provide information about the temperature atlower altitudes, based on the temperature WFs. Frequenciesnear the higher frequency millimeter-wave oxygen absorptionline at 118.75 GHz have not been used extensively for temper-ature profiling. Also, the window region frequencies betweenthese absorption lines have not been analyzed in detail fortemperature retrieval. To include them in this study, the entirefrequency range of 10–200 GHz has been analyzed to deter-mine sets of frequencies that provide the maximum amount ofinformation on tropospheric temperature profiles.
Similar to the retrieval of water vapor profiles, retrieval oftemperature profiles also requires the maximum number ofindependent pieces of information (or minimum redundancy)to improve accuracy and sensitivity to changes in temperatureas a function of altitude. The major contributing frequencieswere selected by applying a feature selection algorithm (sim-ilar to that used for water vapor selection in Section III-B) tothe temperature WFs corresponding to frequencies in the rangefrom 10 to 200 GHz.
The first 10 selected frequencies are listed in Table II andshown in Fig. 7.
Frequencies close to 60 GHz have greater information con-tent and provide more independent measurements than thoseclose to the oxygen absorption line at 118.75 GHz. For all
Fig. 8. Number of DOF for temperature profile retrieval from a ground-based radiometer under four different clear-sky weather conditions, i.e., winterday/night and summer day/night, for the frequency range of 10–200 GHz.
Fig. 9. Vertical resolution for temperature profile retrieval from a ground-basedradiometer as a function of altitude for (a) winter and (b) summer daytime.
weather conditions considered in this study, the frequencyranges of 55–65 GHz and 116–120 GHz are selected, whichare close to the 60-GHz oxygen complex and the 118.75-GHzoxygen absorption line, respectively.
The selected frequencies were analyzed to determine thenumber of independent pieces of information by calculatingtheir number of DOF, as shown in Fig. 8.
The number of DOF increases approximately linearly withthe increase in the number of frequencies selected up to 10and then increases more slowly up to 20. The number of DOFstarts to saturate near or above 30 selected frequencies. Themaximum number of mean DOF is approximately 6–7 fortemperature profile retrieval from zenith-pointing ground-basedradiometers, under nearly all clear-sky weather conditions con-sidered in this study.
However, the mean maximum number of DOF is slightlyhigher for summer (6.7) than for winter (6.4), which is a simi-lar relationship to that in Section III-B (Fig. 4) for water vapormeasurements. This is due to the greater variability of temper-ature profiles in summer than in winter. After examining thenumber of DOF, the vertical resolution was analyzed for the

SAHOO et al.: RADIOMETRIC INFORMATION CONTENT FOR WATER VAPOR AND TEMPERATURE PROFILING 865
Fig. 10. Temperature WFs for frequencies selected for temperature profileretrieval from ground-based radiometer measurements in 10–200 GHz range.
selected frequencies for temperature profiling, similar to whatwas done for water vapor profiling. The spread of the averag-ing kernel is determined for first 2, 3, 4, 5, and 10 frequenciesselected for temperature profiling during daytime, as shownby the black, red, green, blue, and gold curves, respectively,in Fig. 9(a) for winter and (b) for summer. There is a gen-eral degradation in vertical resolution as the altitude increases.However, the vertical resolution decreases as the number offrequencies selected increases. The vertical resolution for 10measurements is approximately 0.2–0.5 km from the ground to4 km above ground level.
Fig. 10 shows the WFs for the frequencies selected for tem-perature profile retrieval. Most of the WFs are most sensitive totemperature changes in the lowest 2 km of the troposphere.
The 55.7, 60.5, and 63.3 GHz frequencies are most sensi-tive to changes in temperature from the ground to 2 km aboveground level, whereas the frequencies 64.5 and 66.1 GHz (fur-ther from the 60-GHz oxygen complex) are generally moresensitive to changes in temperature from the ground to 4 kmabove ground level. None of the WFs studied in this sectionhave much sensitivity to changes in temperature above about7 km above ground level.
IV. ANALYSIS OF WATER VAPOR AND TEMPERATURE
MEASUREMENTS FROM NADIR-POINTING AIRBORNE
RADIOMETERS
This section focuses on determining the measurement fre-quencies in the range from 10 to 200 GHz to provide themaximum number of independent measurements for watervapor and temperature profile retrievals for a nadir-pointing air-borne microwave radiometer. For the study in Sections IV-C1and IV-C2, the background temperature is assumed to be 290 Kand the emissivity of the sea surface to be 0.5. However, inSection IV-C2, an analysis has been performed to determine thevariability in the number of DOF due to variations in sea and
Fig. 11. Main contributing frequencies for water vapor retrieval from airbornemeasurements selected using the feature selection method for the frequencyrange of 10–200 GHz. The width of the horizontal axis divisions is 5 GHz. Thebandwidth is assumed to be 100 MHz.
TABLE IIIFIRST 10 FREQUENCIES (IN GHZ) SELECTED FOR WATER VAPOR
PROFILE RETRIEVAL FROM AIRBORNE MEASUREMENTS FOR WINTER
DAY/NIGHT AND SUMMER DAY/NIGHT CONDITIONS
land surface emissivity. The altitude of the aircraft is assumedto be at least 10 km above ground level.
A. Determining Measurement Frequencies for Airborne WaterVapor Profiling
Again, the branch and bound feature selection algorithm wasapplied to water vapor WFs in the range from 10 to 200 GHzto determine the major contributing frequencies for retrieval ofwater vapor profiles. The first 10 selected major contributingfrequencies for a nadir-pointing airborne radiometer are shownin Fig. 11 and listed in Table III.
The plots show that there are major contributions from fre-quencies from 180 to 200 GHz for all clear-sky weather condi-tions studied, but there are also some significant contributors inthe window region in the range of 130–165 GHz. Measurementsin the latter frequency range can be used for accurate ret-rieval of profiles of water vapor in the upper troposphere(5–10 km) where the water vapor density is less than 0.5 g/m3.This is because frequencies close to the strong water vaporabsorption line are highly attenuated, even when a small amountof water vapor is present.
However, the atmosphere is more transparent near the weakwater vapor absorption line (in the range of 20–23 GHz), so21.3 GHz can be used for retrieval of water vapor profiles inthe lowest 10 km of the troposphere. The number of DOF cal-culated for each value of n (from 2 to 50) corresponding to

866 IEEE JOURNAL OF SELECTED TOPICS IN APPLIED EARTH OBSERVATIONS AND REMOTE SENSING, VOL. 8, NO. 2, FEBRUARY 2015
Fig. 12. Number of DOF for water vapor profile retrieval from airbornemeasurements under four different clear-sky weather conditions, i.e., winterday/night and summer day/night, for the frequency range of 10–200 GHz.
Fig. 13. Vertical resolution for water vapor profile retrieval from airbornemeasurements as a function of altitude for (a) winter and (b) summer daytime.
all weather conditions studied is shown in Fig. 12. The maxi-mum number of mean DOF for all weather conditions studiedis approximately 8–9, lowest for winter night and highest forsummer day. The maximum number of mean DOF is greaterthan that for zenith-pointing ground-based radiometers.
The vertical resolution is computed for frequencies selectedfor water vapor profile retrieval using a nadir-pointing airborneradiometer. The spread of the averaging kernel determined forfirst 2, 3, 4, 5, and 10 frequencies selected for daytime is shownby the black, red, green, blue, and orange curves, respectively,in Fig. 13(a) for winter and (b) for summer.
The vertical resolution in this case is better at 10 km aboveground level than at ground level due to the difference in theradiative transfer integral, resulting in nadir-pointing airborneand spaceborne radiometers providing more information in theupper troposphere.
The vertical resolution is best for 10 measurements and isapproximately 0.2–0.5 km from 6 to 10 km above ground levelfor winter, and it is 0.2–1 km for similar altitudes in summer.The vertical resolution is degraded closer to the ground.
WFs corresponding to the major contributing frequencies areshown in Fig. 14. Those corresponding to frequencies close tothe strong water vapor absorption line at 183.31 GHz as wellas the window channels peak at various altitudes, are most
Fig. 14. Water vapor weighting functions for frequencies selected for watervapor profile retrieval from nadir-pointing airborne measurements in the10–200 GHz range.
TABLE IVFIRST 10 FREQUENCIES (IN GHZ) SELECTED FOR TEMPERATURE
PROFILE RETRIEVAL FROM AIRBORNE MEASUREMENTS FOR WINTER
DAY/NIGHT AND SUMMER DAY/NIGHT CONDITIONS
Fig. 15. Main contributing frequencies for temperature profiling from airbornemeasurements selected using the feature selection method for the frequencyrange 10–200 GHz. The width of the horizontal axis divisions is 5 GHz. Thebandwidth is assumed to be 100 MHz.
sensitive to changes above 4 km altitude and can be used forretrieval of water vapor profiles in the upper troposphere.
B. Determining Measurement Frequencies for AirborneTemperature Profiling
Analysis of the temperature WFs in the range of 10–200 GHzresults in the first 10 frequencies selected for a nadir-pointingairborne radiometer shown in Table IV and Fig. 15. Theyshow that frequencies close to 60 and 118.75 GHz temperature
SAHOO et al.: RADIOMETRIC INFORMATION CONTENT FOR WATER VAPOR AND TEMPERATURE PROFILING 867
Fig. 16. Number of DOF for temperature profile retrieval from airbornemeasurements under four different clear-sky weather conditions, i.e., winterday/night and summer day/night, for the frequency range of 10–200 GHz.
Fig. 17. Vertical resolution for temperature profile retrieval from airbornemeasurements as a function of altitude for (a) winter and (b) summer daytime.
absorption lines provide the greatest amount of informationfor temperature profile retrieval from nadir-pointing airborneradiometers.
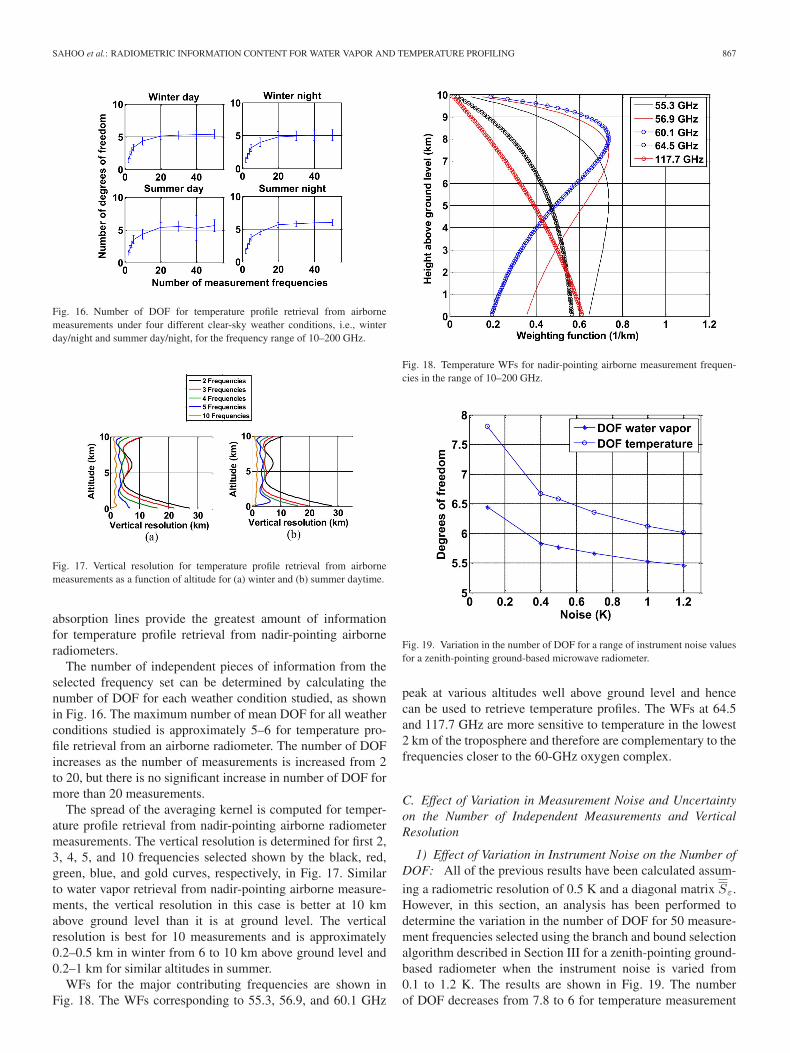
The number of independent pieces of information from theselected frequency set can be determined by calculating thenumber of DOF for each weather condition studied, as shownin Fig. 16. The maximum number of mean DOF for all weatherconditions studied is approximately 5–6 for temperature pro-file retrieval from an airborne radiometer. The number of DOFincreases as the number of measurements is increased from 2to 20, but there is no significant increase in number of DOF formore than 20 measurements.
The spread of the averaging kernel is computed for temper-ature profile retrieval from nadir-pointing airborne radiometermeasurements. The vertical resolution is determined for first 2,3, 4, 5, and 10 frequencies selected shown by the black, red,green, blue, and gold curves, respectively, in Fig. 17. Similarto water vapor retrieval from nadir-pointing airborne measure-ments, the vertical resolution in this case is better at 10 kmabove ground level than it is at ground level. The verticalresolution is best for 10 measurements and is approximately0.2–0.5 km in winter from 6 to 10 km above ground level and0.2–1 km for similar altitudes in summer.
WFs for the major contributing frequencies are shown inFig. 18. The WFs corresponding to 55.3, 56.9, and 60.1 GHz
Fig. 18. Temperature WFs for nadir-pointing airborne measurement frequen-cies in the range of 10–200 GHz.
Fig. 19. Variation in the number of DOF for a range of instrument noise valuesfor a zenith-pointing ground-based microwave radiometer.
peak at various altitudes well above ground level and hencecan be used to retrieve temperature profiles. The WFs at 64.5and 117.7 GHz are more sensitive to temperature in the lowest2 km of the troposphere and therefore are complementary to thefrequencies closer to the 60-GHz oxygen complex.
C. Effect of Variation in Measurement Noise and Uncertaintyon the Number of Independent Measurements and VerticalResolution
1) Effect of Variation in Instrument Noise on the Number ofDOF: All of the previous results have been calculated assum-
ing a radiometric resolution of 0.5 K and a diagonal matrix Sε.However, in this section, an analysis has been performed todetermine the variation in the number of DOF for 50 measure-ment frequencies selected using the branch and bound selectionalgorithm described in Section III for a zenith-pointing ground-based radiometer when the instrument noise is varied from0.1 to 1.2 K. The results are shown in Fig. 19. The numberof DOF decreases from 7.8 to 6 for temperature measurement
868 IEEE JOURNAL OF SELECTED TOPICS IN APPLIED EARTH OBSERVATIONS AND REMOTE SENSING, VOL. 8, NO. 2, FEBRUARY 2015
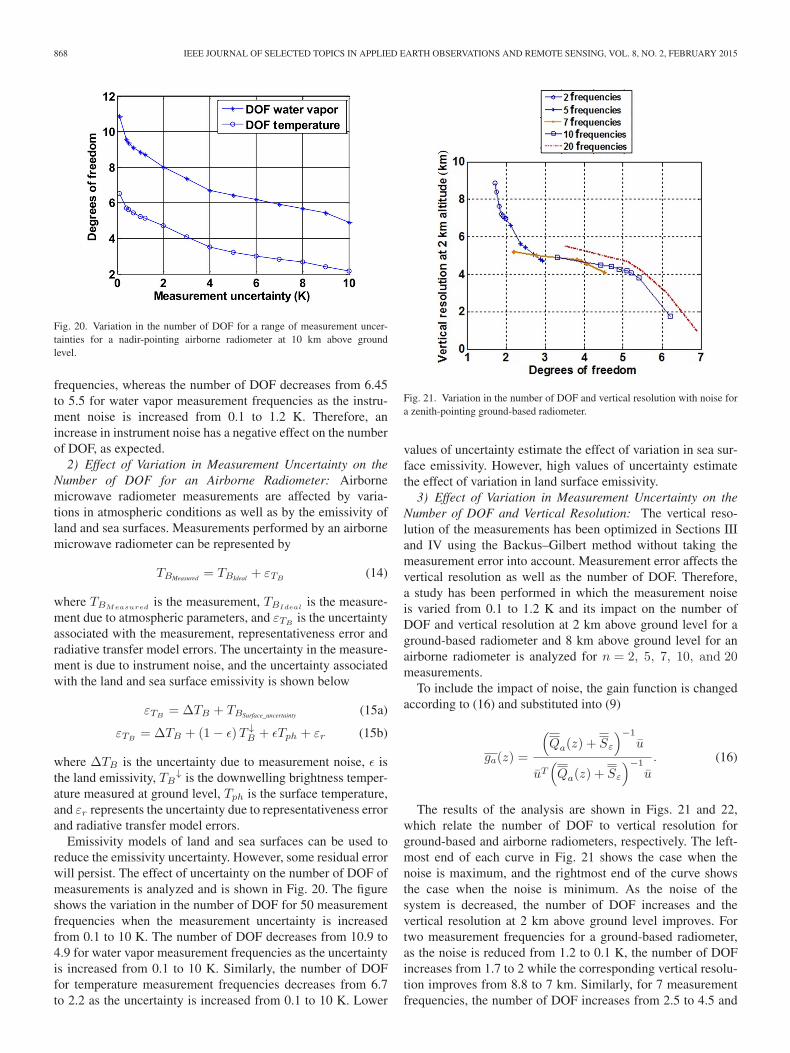
Fig. 20. Variation in the number of DOF for a range of measurement uncer-tainties for a nadir-pointing airborne radiometer at 10 km above groundlevel.
frequencies, whereas the number of DOF decreases from 6.45to 5.5 for water vapor measurement frequencies as the instru-ment noise is increased from 0.1 to 1.2 K. Therefore, anincrease in instrument noise has a negative effect on the numberof DOF, as expected.
2) Effect of Variation in Measurement Uncertainty on theNumber of DOF for an Airborne Radiometer: Airbornemicrowave radiometer measurements are affected by varia-tions in atmospheric conditions as well as by the emissivity ofland and sea surfaces. Measurements performed by an airbornemicrowave radiometer can be represented by
TBMeasured = TBIdeal + εTB(14)
where TBMeasuredis the measurement, TBIdeal
is the measure-ment due to atmospheric parameters, and εTB
is the uncertaintyassociated with the measurement, representativeness error andradiative transfer model errors. The uncertainty in the measure-ment is due to instrument noise, and the uncertainty associatedwith the land and sea surface emissivity is shown below
εTB= ΔTB + TBSurface_uncertainty (15a)
εTB= ΔTB + (1− ε)T ↓
B + εTph + εr (15b)
where ΔTB is the uncertainty due to measurement noise, ε isthe land emissivity, TB
↓ is the downwelling brightness temper-ature measured at ground level, Tph is the surface temperature,and εr represents the uncertainty due to representativeness errorand radiative transfer model errors.
Emissivity models of land and sea surfaces can be used toreduce the emissivity uncertainty. However, some residual errorwill persist. The effect of uncertainty on the number of DOF ofmeasurements is analyzed and is shown in Fig. 20. The figureshows the variation in the number of DOF for 50 measurementfrequencies when the measurement uncertainty is increasedfrom 0.1 to 10 K. The number of DOF decreases from 10.9 to4.9 for water vapor measurement frequencies as the uncertaintyis increased from 0.1 to 10 K. Similarly, the number of DOFfor temperature measurement frequencies decreases from 6.7to 2.2 as the uncertainty is increased from 0.1 to 10 K. Lower
Fig. 21. Variation in the number of DOF and vertical resolution with noise fora zenith-pointing ground-based radiometer.
values of uncertainty estimate the effect of variation in sea sur-face emissivity. However, high values of uncertainty estimatethe effect of variation in land surface emissivity.
3) Effect of Variation in Measurement Uncertainty on theNumber of DOF and Vertical Resolution: The vertical reso-lution of the measurements has been optimized in Sections IIIand IV using the Backus–Gilbert method without taking themeasurement error into account. Measurement error affects thevertical resolution as well as the number of DOF. Therefore,a study has been performed in which the measurement noiseis varied from 0.1 to 1.2 K and its impact on the number ofDOF and vertical resolution at 2 km above ground level for aground-based radiometer and 8 km above ground level for anairborne radiometer is analyzed for n = 2, 5, 7, 10, and 20measurements.
To include the impact of noise, the gain function is changedaccording to (16) and substituted into (9)
ga(z) =
(Qa(z) + Sε
)−1
u
uT(Qa(z) + Sε
)−1
u. (16)
The results of the analysis are shown in Figs. 21 and 22,which relate the number of DOF to vertical resolution forground-based and airborne radiometers, respectively. The left-most end of each curve in Fig. 21 shows the case when thenoise is maximum, and the rightmost end of the curve showsthe case when the noise is minimum. As the noise of thesystem is decreased, the number of DOF increases and thevertical resolution at 2 km above ground level improves. Fortwo measurement frequencies for a ground-based radiometer,as the noise is reduced from 1.2 to 0.1 K, the number of DOFincreases from 1.7 to 2 while the corresponding vertical resolu-tion improves from 8.8 to 7 km. Similarly, for 7 measurementfrequencies, the number of DOF increases from 2.5 to 4.5 and

SAHOO et al.: RADIOMETRIC INFORMATION CONTENT FOR WATER VAPOR AND TEMPERATURE PROFILING 869
Fig. 22. Variation in the number of DOF and vertical resolution with noise fora nadir-pointing airborne radiometer.
the vertical resolution improves from 5.4 to 4 km. For 10 mea-surements, the vertical resolution improves from 4.8 to 1.7 kmand the number of DOF increases from 2.8 to 6.3. For 20 mea-surements, the number of DOF increases from 3.5 to 6.9 andthe vertical resolution improves from 5.6 to 1 km.
Fig. 22 shows that for two measurements of an airborneradiometer, as the noise is reduced from 1.2 to 0.1 K, the num-ber of DOF increases from 1.7 to 2, whereas the correspondingvertical resolution improves from 5.6 to 4.6 km for 8 km aboveground level. Similarly, for five measurement frequencies, thenumber of DOF increases from 2.2 to 3.7 and vertical resolutionimproves from 4.6 to 3.5 km. For 10 measurements, the verticalresolution improves from 3.3 to 2.1 km and the number of DOFincreases from 6.5 to 8.0. For 20 measurements, the numberof DOF increases from 8.5 to 10.9 and the vertical resolutionimproves from 3.2 to 1.2 km. These plots show that for assess-ing vertical resolution the important parameter is the number ofDOF. Fewer frequency channels with smaller uncertainty havesimilar performance to a larger number of frequency channelswith greater uncertainty.
V. ORTHOGONALIZING WATER VAPOR AND
TEMPERATURE MEASUREMENTS
The feature selection method has been used to determine thefrequencies that have the highest number of DOF in the fre-quency range of 10–200 GHz. However, it is important to notethat there are a number of frequencies in that range at which themeasured brightness temperature has contributions from bothwater vapor and temperature. This is because the absorptionlines for water vapor and temperature are sometimes similarlyclose to those frequencies, particularly in the window regions.Therefore, it becomes important to determine the particular fre-quency channels for measuring water vapor or temperature, i.e.,
Fig. 23. Fractional contributions of water vapor and temperature to totalbrightness temperature measurements.
the frequencies for which water vapor and temperature con-tributions are orthogonal, to identify those with contributionsto brightness temperature from water vapor that are signif-icantly larger than those from temperature, and vice versa.To accomplish this, the percentage contribution to the bright-ness temperature due to water vapor absorption is computedusing (17).
This relationship is used to compute the relative contributionof water vapor to the total brightness temperature
Percentage water vapor contribution =TBwv
TBtotal× 100
=ρ.Wwv
T.WT + ρ.Wwv× 100 (17)
for each frequency. It has already been observed that watervapor provides a strong contribution to brightness tempera-ture measurements in the frequency ranges of 20–23 GHz and165–200 GHz.
These frequency ranges can be used to determine themajor contributing channels. To calculate the contribution, 10radiosonde measurements were performed at the ARM site. Thecontribution from water vapor is shown in blue in Fig. 23, andthe contribution from temperature is shown in red.
Frequencies in the ranges of 20–23, 80–108, and 175–184 GHz have water vapor contributions of more than 90%.Temperature contributes only 10% or less to the total bright-ness temperature in those frequency ranges. For the frequencyranges of 50–70 and 115–130 GHz, the contribution due to tem-perature is stronger than that due to water vapor. Frequencies inthe ranges of 57–60 and 115–121 GHz have temperature con-tributions of more than 90% and 60%, respectively. The resultspresented in Fig. 23 are for a zenith-pointing ground-basedradiometer. Similar results were also found for a nadir-pointingairborne radiometer.

870 IEEE JOURNAL OF SELECTED TOPICS IN APPLIED EARTH OBSERVATIONS AND REMOTE SENSING, VOL. 8, NO. 2, FEBRUARY 2015
VI. SUMMARY AND DISCUSSION
Feature selection methods have shown that the frequencyranges of 20–23, 85–90, and 165–200 GHz provide themaximum number of independent pieces of information forwater vapor profile retrieval from zenith-pointing ground-basedmicrowave radiometer measurements. The same frequencyranges are useful for water vapor profile retrieval from nadir-pointing airborne radiometers. On the other hand, for tempera-ture profiling from ground-based measurements, the frequencyranges of 55–65 and 116–120 GHz provide the maximum num-ber of independent pieces of information. For temperature pro-file retrieval from nadir-pointing airborne measurements, nearlythe same frequency ranges are needed, but the millimeter-wavefrequency range is more narrowly focused near 118.75 GHz.
To determine the number of independent pieces of infor-mation and consequently the number of frequencies usefulfor retrieval of water vapor, the number of DOF has beendetermined for the selected frequencies in each case. Fromthis analysis, it is found that a limited number of frequencymeasurements can be used to achieve fine vertical resolutionand good accuracy of retrieved water vapor profiles. The max-imum number of independent pieces of information is 5–6for water vapor profiling and 6–7 for temperature profilingfrom zenith-pointing ground-based radiometer measurements.For nadir-pointing airborne radiometer measurements, the max-imum number of independent pieces of information is 8–9for water vapor profiling and 5–6 for temperature profiling. Ifadditional measurement frequencies are chosen, they will pro-vide redundant information since the information provided islinearly dependent on that already measured at other frequen-cies. Noise analysis has shown that increasing measurementuncertainty and instrument noise reduces the number of DOF.Similarly, increasing measurement uncertainty degrades thevertical resolution. It was also found that vertical resolution isinversely related to the number of DOF.
REFERENCES
[1] T. M. Scheve and C. T. Swift, “Profiling atmospheric water vapor with aK-band spectral radiometer,” IEEE Trans. Geosci. Remote Sens., vol. 37,no. 3, pp. 1719–1729, May 1999.
[2] E. R. Westwater, S. Crewell, and C. Matzler, “Surface-based microwaveand millimeter wave radiometric remote sensing of the troposphere: Atutorial,” IEEE Geosci. Remote Sens. Newslett., no. 134, pp. 16–33, Mar.2005.
[3] N. C. Grody, “Remote sensing of the atmosphere from satellites usingmicrowave radiometry,” in Atmospheric Remote Sensing by MicrowaveRadiometry. New York, NY, USA: Wiley-Interscience, 1993, pp. 259–314.
[4] F. S. Solheim et al., “Radiometric profiling of temperature, water vapor,and cloud liquid water using various inversion methods,” Radio Sci.,vol. 33, pp. 393–404, 1998.
[5] E. R. Westwater, “Ground-based microwave remote sensing of mete-orological variables,” in Atmospheric Remote Sensing by MicrowaveRadiometry. New York, NY, USA: Wiley-Interscience, 1993, pp. 145–214.
[6] M. A. Janssen, “An introduction to the passive microwave remote sens-ing of atmospheres,” in Atmospheric Remote Sensing by MicrowaveRadiometry. New York, NY, USA: Wiley-Interscience, 1993, pp. 1–35.
[7] A. J. Gasiewski, “Channel ranking in passive microwave wet-path delaymeasurements,” in Proc. IEEE Geosci. Remote Sens. Symp., 1993,pp. 1765–1767.
[8] M. Klein and A. J. Gasiewski, “The sensitivity of millimeter and sub-millimeter frequencies to atmospheric temperature and water vapor vari-ations,” in Proc. IEEE Geosci. Remote Sens. Symp., 1998, pp. 568–571.
[9] M. P. Cadeddu, J. C. Liljegren, and D. D. Turner, “The AtmosphericRadiation Measurement (ARM) program network of microwave radiome-ters: instrumentation, data and retrievals,” Atmos. Meas. Techn., vol. 6,pp. 2359–2372, 2013.
[10] I. Guyon and A. Elisseeff, “An introduction to variable and featureselection,” J.. Mach. Learn. Res., vol. 3, pp. 1157–1182, Mar. 2003.
[11] O. Ludwig and U. Nunes, “Novel maximum-margin training algorithmsfor supervised neural networks,” IEEE Trans. Neural Netw., vol. 21, no. 6,pp. 972–984, Jun. 2010.
[12] P. M. Narendra and K. Fukunaga, “A branch and bound algorithm forfeature subset selection,” IEEE Trans. Comput., vol. C-26, no. 9, pp. 917–921, Sep. 1977.
[13] C. D. Rodgers, Inverse Methods for Atmospheric Sounding: Theory andPractice. Singapore: World Scientific, 2000.
[14] T. J. Hewison, Profiling Temperature and Humidity by Ground-basedMicrowave Radiometers. Reading, U.K.: Univ. Reading, 2006.
[15] P. C. Pandey, E. G. Njoku, and J. W. Waters, “Inference of cloud temper-ature and thickness by microwave radiometry from space,” J. Clim. Appl.Meteorol., vol. 22, pp. 1894–1898, Jul. 1983.
[16] D. D. Turner et al., “Retrieving liquid water path and precipitablewater vapor from the Atmospheric Radiation Measurement (ARM)microwave radiometers,” IEEE Trans. Geosci. Remote Sens., vol. 45,no. 11, pp. 3680–3690, Nov. 2007.
[17] J. A. Weinman, “The effect of cirrus clouds on 118-GHz brightness tem-peratures,” J. Geophys. Res., vol. 93, no. D9, pp. 11059–11062, Sep.1988.
[18] C. Kummerow et al., “The evolution of the Goddard profiling algorithm(GPROF) for rainfall estimation from passive microwave sensors,” J.Appl. Meteorol., vol. 40, pp. 1801–1820, Jun. 2001.
[19] D. Cimini, E. R. Westwater, and A. J. Gasiewski, “Temperature andhumidity profiling in the Arctic using millimeter-wave radiometry and1DVAR,” IEEE Trans. Geosci. Remote Sens., vol. 48, no. 3, pp. 1381–1388, Mar. 2009.
[20] P. E. Racette et al., “Measurement of low amounts of precipitable watervapor using ground-based millimeterwave radiometry,” J. Atmos. Ocean.Technol., vol. 22, pp. 317–337, Apr. 2005.
[21] V. H. Payne, E. J. Mlawer, K. E. Cady-Pereira, and J. Moncet, “Watervapor continuum absorption in the microwave,” IEEE Trans. Geosci.Remote Sens., vol. 49, no. 6, pp. 2194–1388, Jun. 2011.
[22] T. J. Hewison, “1D-VAR retrieval of temperature and humidity pro-files from a ground-based microwave radiometer,” IEEE Trans. Geosci.Remote Sens., vol. 45, no. 7, pp. 2163–2168, Jul. 2007.
Swaroop Sahoo received the B.Tech. degree in elec-trical engineering from Biju Pattnaik University ofTechnology, Bhubaneswar, India, in 2005, and theM.S. degree in electrical engineering from ColoradoState University, Fort Collins, CO, USA, in 2011.He is currently working toward the Ph.D. degree inelectrical engineering at Colorado State University.
Xavier Bosch-Lluis received the Master’s degree intelecommunication engineering specialized in com-munications systems, the M.Sc. degree in researchon information and communication technologies(MERIT), the Master’s degree in electronics engi-neering, and the Ph.D. degree in department of sig-nal theory and communications from the UniversitatPolitècnica de Catalunya (UPC), Barcelona, Spain, in2005, 2007, 2010, and 2011, respectively.
Since April 2011, he has been a PostdoctoralResearcher with the Microwave Systems Laboratory,
Electrical and Computer Engineering Department, Colorado State University,Fort Collins, CO, USA. His research interests include developing innova-tive radiometer systems and retrieval algorithms for passive microwave andmillimeter-wave remote sensing.

SAHOO et al.: RADIOMETRIC INFORMATION CONTENT FOR WATER VAPOR AND TEMPERATURE PROFILING 871
Steven C. Reising (S’88–M’98–SM’04) received theB.S.E.E. (magna cum laude) and M.S.E.E. degreesin electrical engineering from Washington Universityin St. Louis, Saint Louis, MO, USA, in 1989 and1991, respectively, and the Ph.D. degree in electricalengineering from Stanford University, Stanford, CA,USA, in 1998.
He is currently a Full Professor in electrical andcomputer engineering with Colorado State University(CSU), Fort Collins, CO, USA, since July 2011,where he served as an Associate Professor from
August 2004 to June 2011. Before joining the CSU faculty in 2004, he servedas an Assistant Professor in Electrical and Computer Engineering with theUniversity of Massachusetts Amherst, Amherst, MA, USA, where he receivedtenure. He served as a Summer Faculty Fellow for three summers in the RemoteSensing Division of the Naval Research Laboratory, Washington, DC, USA.His research interests include remote sensing disciplines, passive microwaveand millimeter-wave remote sensing of the oceans, atmosphere, and land;microwave circuits and radiometer systems; lidar systems for sensing of tem-perature and winds in the middle and upper atmosphere; and atmosphericelectrodynamics. He has been the Principal Investigator of more than 12 grantsfrom the National Science Foundation (NSF), NASA, Office of Naval Research(ONR), National Polar-orbiting Operational Environmental Satellite SystemIntegrated Program Office, European Space Agency, and Ball Aerospace andTechnologies Corporation.
Dr. Reising serves as the Vice President of Information Resources (2011–present) and formerly as the Vice President of Technical Activities (2008–2010)of the IEEE Geoscience and Remote Sensing Society (GRSS). He has servedas an elected member of the IEEE Microwave Theory and Techniques Society(MTT-S) Administrative Committee (AdCom) since January 2014, for whichhe is currently Technical Coordinating Committee Vice-Chair and OutstandingChapter Award Co-Chair. He has served as an elected member of the IEEEGRSS AdCom continuously since 2003, after three-year terms as Editor of theGRSS Newsletter (2000–2002), and Associate Editor for University Profiles(1998–2000). He was an Associate Editor of the IEEE TRANSACTIONS ON
GEOSCIENCE AND REMOTE SENSING LETTERS (GRSL) from its found-ing in 2004 to 2013. He has been a Guest Editor of IEEE TRANSACTIONS
ON GEOSCIENCE AND REMOTE SENSING (TGRS) for the InternationalGeoscience and Remote Sensing Symposium (IGARSS) 2012 Special Issuepublished in September 2013, the IGARSS 2008 Special Issue published inNovember 2009 and the Special Issue on Microwave Radiometry and RemoteSensing Applications published in July 2007. He has served as a Reviewer forTGRS, GRSL, the IEEE TRANSACTIONS ON MICROWAVE THEORY AND
TECHNIQUES, Remote Sensing of Environment, the Journal of Atmosphericand Oceanic Technology, the Journal of Geophysical Research—Oceans,Geophysical Research Letters, Marine Geodesy, Atmospheric Chemistry andPhysics, the Journal of Oceanography, and Radio Science. He was the recip-ient of the NSF CAREER Award (2003–2008) in the areas of physical andmesoscale dynamic meteorology and the ONR Young Investigator ProgramAward (2000–2003) for passive microwave remote sensing of the oceans.He was awarded the Barbara H. and Joseph I. Goldstein Outstanding Junior
Faculty Award in 2004, the Lilly Teaching Fellowship for 2001–2002, and aYoung Scientist Award at the URSI General Assembly in Toronto, Canada, in1999. While at Stanford, he received first place in the United States NationalCommittee (USNC) of URSI Student Paper Competition at the National RadioScience Meeting in Boulder, CO, USA, in 1998. In organizing scientific meet-ings, he was one of two Technical Program Co-Chairs of the IEEE IGARSS2008 in Boston, MA, USA, with over 1700 attendees. He served as the GeneralChair of MicroRad’06, the 9th Specialist Meeting on Microwave Radiometry,held in March 2006 in San Juan, Puerto Rico, with 126 attendees from15 countries. He was the Local Arrangements Chair for IGARSS 2006 inDenver, with over 1250 attendees. He has been an active participant in eachIGARSS Technical Program Committee from 2001 to the present. He servesthe URSI as the Chair (2012–2014) and previously as Secretary and Chair-Elect(2009–2011) of its USNC, consisting of 10 scientific commissions focusing onthe theory and applications of electromagnetics and radio waves from ultra-lowfrequencies to Terahertz. He chaired the first three URSI International StudentPaper Prize Competitions at the URSI General Assemblies and ScientificSymposia held in Chicago, IL, USA, in 2008; Istanbul, Turkey, in 2011;and Beijing, China, in 2014. Previously, he chaired the annual USNC-URSIStudent Paper Prize Competition at the National Radio Science Meeting inBoulder each year from 2004 to 2008 and at the URSI North American RadioScience Meeting in Ottawa, in 2007. In addition, he has served as TechnicalProgram Co-Chair for the USNC-URSI National Radio Science Meetings heldeach January in Boulder, CO, USA, from 2010 to 2014. He served as theSecretary of USNC-URSI Commission F (2006–2008) and is a member ofURSI Commissions F, G, and H, the American Meteorological Society, theAmerican Geophysical Union, Tau Beta Pi, and Eta Kappa Nu.
Jothiram Vivekanandan (M’05–SM’10) receivedthe B.E. degree in electronics and communicationsengineering from the Madurai-Kamaraj University,Madurai, India, the M.Tech. degree in microwaveand radar engineering from the Indian Instituteof Technology, Kharagpur, India, and the Ph.D.degree in electrical engineering from Colorado StateUniversity, Fort Collins, CO, USA, in 1986.
He holds a Senior Scientist appointment inboth the Earth Observing Laboratory and theResearch Applications Laboratory, National Center
for Atmospheric Research (NCAR), Boulder, CO, USA. He led the devel-opment of the dual-wavelength system by adding millimeter-wave radar toNCAR’s S-band polarization radar (S-Pol). He is currently involved in build-ing airborne cloud radar and provides scientific leadership to lidar remotesensing. He collaborates with a number of research groups toward the devel-opment of airborne and ground-based polarization and Doppler weather radarat centimeter wavelengths. He is an Associate Editor of Radio Science.His research interests include interpretation of remote sensing instruments’responses to clouds and precipitation using mathematical models and actualfield observations.