radiomics data management, computation, and analysis for qin f2f 2016
TRANSCRIPT

1
Large Scale Data Management, Computation, and Analysis for Quantitative Imaging Research
Ashish Sharma, Ph.D.
Department of Biomedical Informatics, Emory University
Fred Prior, Ph.D.
Department of Biomedical Informatics,Univ. of Arkansas for Medical Sciences
2
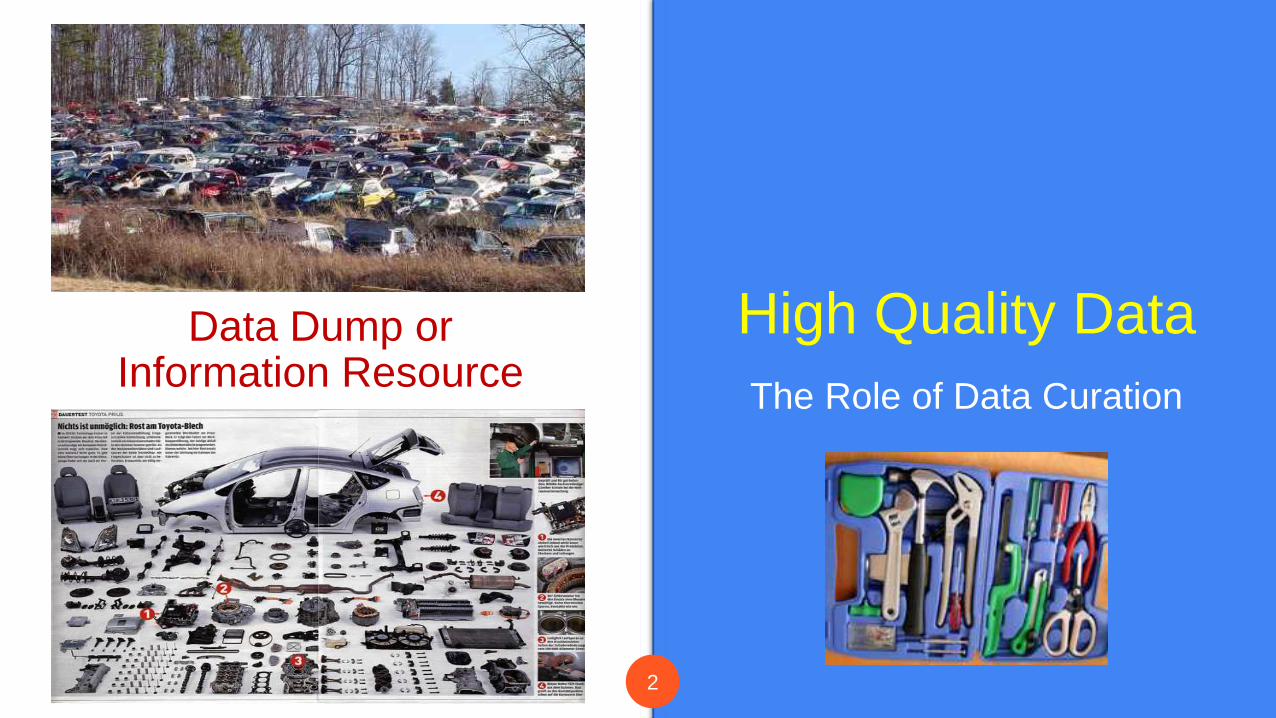
High Quality Data
The Role of Data Curation
Data Dump orInformation Resource

3
Challenges to Advances in Quantitative Imaging
“Data! Data! Data!” he cried impatiently. “I
can’t make bricks without clay.”
— Sherlock Holmes
• Large, well-curated, repositories• High Quality Data• Radiology, Pathology, RT• Clinical, Genomic• Derived Feature Sets• Security and Access Control• Flexible Access
• Co-Located Computation• Reproducible pipelines
• Systematic, Reproducible tools for imaging phenotype/biomarker exploration

4
Resources Provided by the UAMS + Emory QIN
Features

5
Built on The Cancer Imaging Archive
TCIA encourages and supports cancer-related open science communities by hosting and managing the data archive,, and relevant resources to facilitate collaborative research.

6
RT Collections and Curation Process Partial collections:
• RTOG 0522• NRG-1106 (private)• NRG-1308 (Private)
TCGA-HNSC
Additional collections in process or planned

7
Automated RT, Image Set CurationIndividual Bulk Correction
Reduce the time needed to
correct data inconsistencies
Curation Time: Days few minutes(15 Collections 120K images)
Extend POSDA to all curation related checks and activities

8
Digital Pathology
caMicroscope
• Visualization of Pathology Images and Features
• Data Management
• Native Support for Scanner Format (Scanner caMic)
• Dynamic Services (launch analysis from browser)
• Scientific Mashups (DataScope and DataCafe)
Supported by NCIP/CTIIP Project; ITCR U24
9
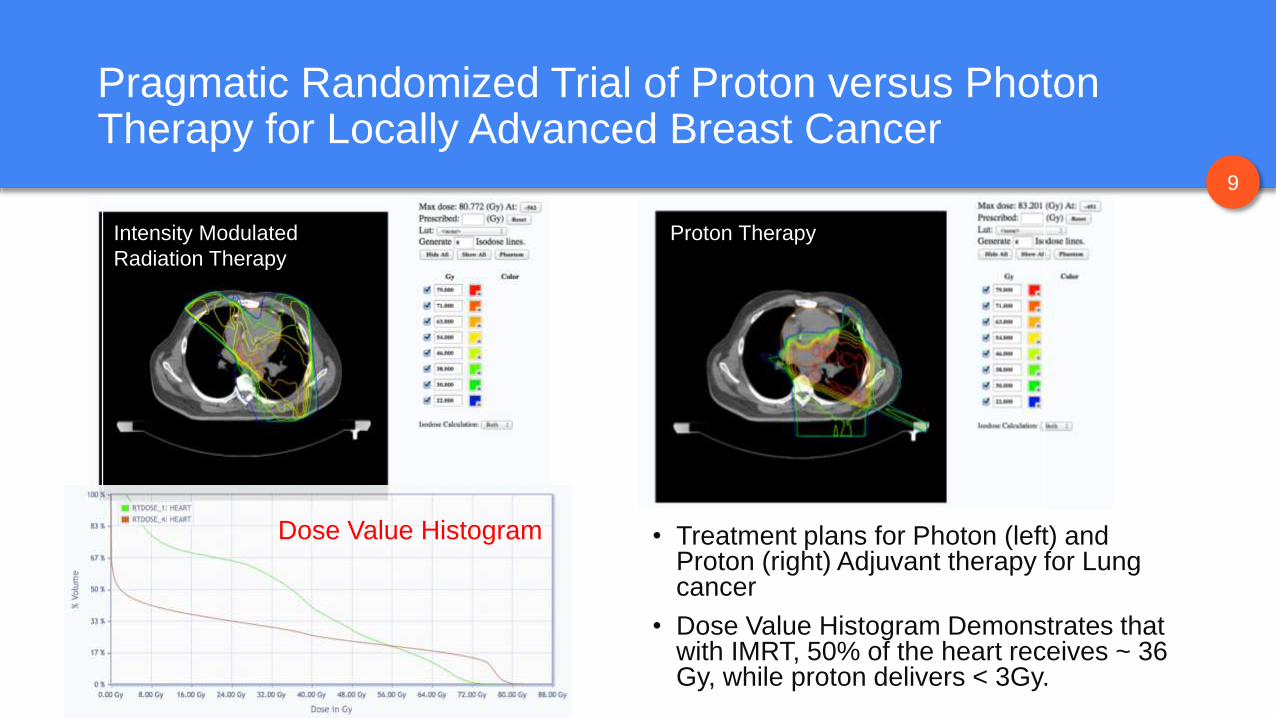
Pragmatic Randomized Trial of Proton versus Photon Therapy for Locally Advanced Breast Cancer
• Treatment plans for Photon (left) and Proton (right) Adjuvant therapy for Lung cancer
• Dose Value Histogram Demonstrates that with IMRT, 50% of the heart receives ~ 36 Gy, while proton delivers < 3Gy.
Dose Value Histogram
Intensity Modulated
Radiation Therapy
Proton Therapy

10
Data Access
REST APIs to access TCIA Data
APIs to access protected data (coming soon)
Mashups from fusion of diverse datasets to support
• Data exploration
• Hypothesis formulation
• Discovery of latent relationships and patterns

11
Reproducible Science
Incentives for data sharing
TCIA assigns DOIs for individual collections as well as data subsets that were used in publications
One click access to data via DOI
Use this DOI to get a Nature Scientific Data publication
Will be developing mechanisms to track usage
12
Co-Located Data Analysis

13
Radiomics Portal
(Galaxy + Lessons from Connectome Workbench)
Fast access to co-located data
Imaging, RT, RadiomicFeatures (TCIA)
Clinical and other structured (i2b2/Eureka!)
Lung Segmentation Pilot
Tool Dissemination

14
Lung Analysis Pipeline
1. Segment lung field from CT
2. Use three parallel
segmentation algorithms to
identify all closed structures
3. Voting algorithm produces final
segmented regions
4. Feature Extraction (shape,
texture, margin,...)
5. Feature Classification
(optional)
6. Image-based phenotype
Top, Green Expert Manual Segmentation
Bottom, Blue Automated Segmentation
The results of three independent automatic
segmentation algorithms are combined using a
voting mechanism to arrive at final automatic
segmentation.

15
Biomarker Exploration Pipeline
• Data Loading: Radiomics data is integrated into Eureka! Custom sources can be incorporated via REST APIs
• Construct Radiomic Phenotypes: Using the Eureka GUI, users can explore their radiomics data and construct radiomicphenotypes, that incorporate clinical, imaging and computed features. These phenotypes are captured as graphs and stored in a graph database (Neo4J)
i2b2
TCIA
MongoDB & Others…
RadiomicPhenotypes
16
Eureka! Clinical Analytics
• Open source (Apache 2 license) RESTful clinical phenotyping systemClinical phenotyping: computing temporal patterns from EHR data reflecting disease, therapeutic response and prognosis
• Supports loading data and computed phenotypes from data warehouses and flat files into i2b2, Neo4j and flat files
• One REST service + web interface controlling many ETL processes setup with configurable metadata stored in an extended i2b2 metadata schema

17
Use Cases• Construct phenotypes by
fusing clinical and derived feature data
• Compute phenotypes on available data
• Ongoing pilot with NLST data
• LungRADS
• Study changes to LungRADSscreening recommendations by incorporating demographics

18
Summary
• TCIA is a stable yet continually evolving and expanding information resource for QIN and other Cancer Imaging initiatives
• Radiomic & Radiogenomic analyses require information fusion and HPC pipelines to deal with large subject populations and advanced computationally intensive algorithms
• We are exploring the potential of OODA graph statistics for multi-parametric biomarker discovery and validation.

• NCI QIN: Resources for development
and validation of Radiomic Analyses &
Adaptive Therapy — PI: Prior, Sharma
(UAMS, Emory)
• NCIP/Leidos caMicroscope — A Digital
Pathology Integrative Query System;
PI: Sharma
• PCORI, Pragmatic Randomized Trial of
Proton versus Photon Therapy for
Locally Advanced Breast Cancer to
compare the effectiveness of photon vs.
proton Radiotherapy. (PI: Bekelman)
• Leidos Biomedical Research, Contract
16X011 for NCI, Maintenance and
Extension of The Cancer Imaging
Archive (TCIA), (PI: Prior)