raffles institution hi mathematics 8864 · pdf fileraffles institution 2010 year 6 preliminary...
TRANSCRIPT

RAFFLES INSTITUTION 2010 Year 6 Preliminary Exam H I Mathematics 8864
H1 Maths Preliminary Exam Solutions
Section A: Pure Mathematics [35 marks]
1 Find —(J(x — l)2+3)1 and simplify your answer, dx
Hence, evaluate \ =dx giving your answer in the form where a and b are l ) 2 +3
positive constants to be determined. [4]
Solution
- i ( ^ - i ) ^ 3 ) ^ 1
d* 2V(A:-1) 2 +3 (2)(*-l)
x-\ 7 ( x - l ) 2 + 3
1- JC d x - L
x - 1 J(x-\)2+3 J(x-\)2+3
= - [ V ( x - l ) 2 + 3 ] 3 _
= - V 7 + 7 l 2
a = \2, b = l
dx
2 Find the exact area bounded by the curve>> = ln(2x +1), the v-axis and the line y = ln9 (as shown in the diagram below) in the form p - l n q wherep and q are constants to be determined. [3]
y = ln(2*+l)
>- = ln9
2010 H 1 Maths Year 6 Preliminary Exam P a g e 1 6 f 1p

Solution
v = ln(2x+l) =>x = 2 V
Area of shaded region by integrating with respect to the y - axis,
2 ln9
dx = 2 2
In 9
2 2 = 4 - ln3 p=4 , ^ = 3
1 = 4_Iln9 2 2
Using a non-calculator method, find the coordinates of all the stationary points of the curve y = 3x5 — 20x3 . Determine the nature of each of the stationary points, showing your working clearly. [6]
Solution
^ = 15x 4 -60x 2 =0 dx
15x 2 (x 2 -4) = 0
X = 0 or x = 2 or x = -2
y = 0 or y =-64 or x-= 64
X o- 0
dx -ve 0 -ve
X 2" 2 2 +
dx -ve 0 +ve
X -2" -2 -2+
dy dx +ve 0 -ve
(0 , 0) is a stationary point of inflexion, (2 , -64) is a min turning point, (-2 , 64) is a max turning point.
2 0 1 0 H 1 Maths Year 6 Prel iminary Exam y P a g e 2 of 10

Given log3 2 = a, log3125 = b, express the following in terms of a and b. 4 t
(0 log3-r> *
(ii) log320ti, (iii) log, 10.
[2]
[2] [3]
Solution
(i) log31 = log3 22 -log3125^ = 2a~
(ii) log3200 = log3(8x25) = log3 2 3 +log3125* =^+-b
( I I I ) ^ I Q = j o g J 0 = j o g ^ x S ) m log 32 + lo g 3 5 =
9 log39 log 33 2 2 2 2 6
Find the range of values of m for which the graphs of y = x2 —2mx + \d y-m — xdo not intersect. [3]
For m = 1, find the coordinates of the two points at which the two graphs intersect. Hence find the equation of the normal to y = x2 — 2mx+1 at each of the two points. [4]
2mx + \ m-x Solution
x x2 —2mx+\—m + x = 0 x2 +(l-2m)x + \-m = 0 Discriminant = (1 - 2m)2 - 4(1 - m) < 0 1 - 4m+4m - 4 + 4w < 0 -4m~ <3
^ & <m<
2 2 y = x2 - 2 x + land y = \ xintersect at (0,1) and (1,0)
For y = x2-2x + \, ^- = 2x-2 dx
dy 1 At (0,1), — = —2, gradient of normal = —
dx 2
Equation of normal: J 7 - ^ *
^ - 0 At (1,0), ( k - u
Equation of normal: x = 1
2 0 1 0 H1 Maths Year 6 Prel iminary Exam P a g e S o f 10

6 The curve C has equation y = ———. 2-x
(i) Sketch the graph of C, showing clearly the inte:jfeepts with the axes and the equation(s) of any • asymptote(s). . - - [3]
(ii) By adding a suitable graph on the same diagram, solve the inequality,
6-5x 2-x
<\x\]
(iii)Hence, solve the inequality ^ + "** <|x|. [2]
Solution 20
- 1 0
" y \ \ \ \
\
i . . . . . io ^
-10
7 \
I
S 10
x=2
x< —431 or l < x < 2 o r x > 6
Replace x by -x,
—x< —437 or l < - x < 2 or — x>6
jc>4.37or | - 2 < x < — 1 or x<-6
2010 H1 Maths Year 6 Prel iminary Exam P a g e 4 of 10

Section B: Statistics [60 marks]
At an ASEAN Games^hess Championship, a reporter in the competition village is conducting a
survey to find out what the participants think of the weather, accommodation and food provided.
From a namelist of 300 participants from 5 countries, the reporter selects the 10 th, 20 th, 30 th ...
person to conduct the survey via the systematic sampling method. It is noted that each country has
varying number of participants.
(i) How should he improve on the way he got his data for the systematic sampling method?
[1]
(ii) Give a reason why stratified sampling method might be preferable in this context and describe
how it can be done. [4]
Solution
(i) He should have randomly picked a number from 1 to 10 as the 1st person, and pick
every 10th person on the namelist after that.
(ii) In stratified sampling, the participants are divided into non-overlapping groups of
strata, for example nationality. As participants from different countries could have
differing views on weather, food and accommodation based on their backgrounds,
selecting the participants randomly from each stratum with sample size proportional
to the relative size of the stratum will give a more representative sample and avoid
any possible cyclical pattern from the systematic sampling.
For example if the 300 participants from the 5 countries were in the proportion a%
from country A, b% from country B, c% from country C, d% from country D and
e% from country E, then number of participants selected from each country for the
survey should follow the same proportion. Furthermore, the participants within each
country are randomly selected using simple random sampling or stratified sampling.
v s
2010 H1 M a t h s Y e a r 6 Preliminary E x a m Page 5 of 10
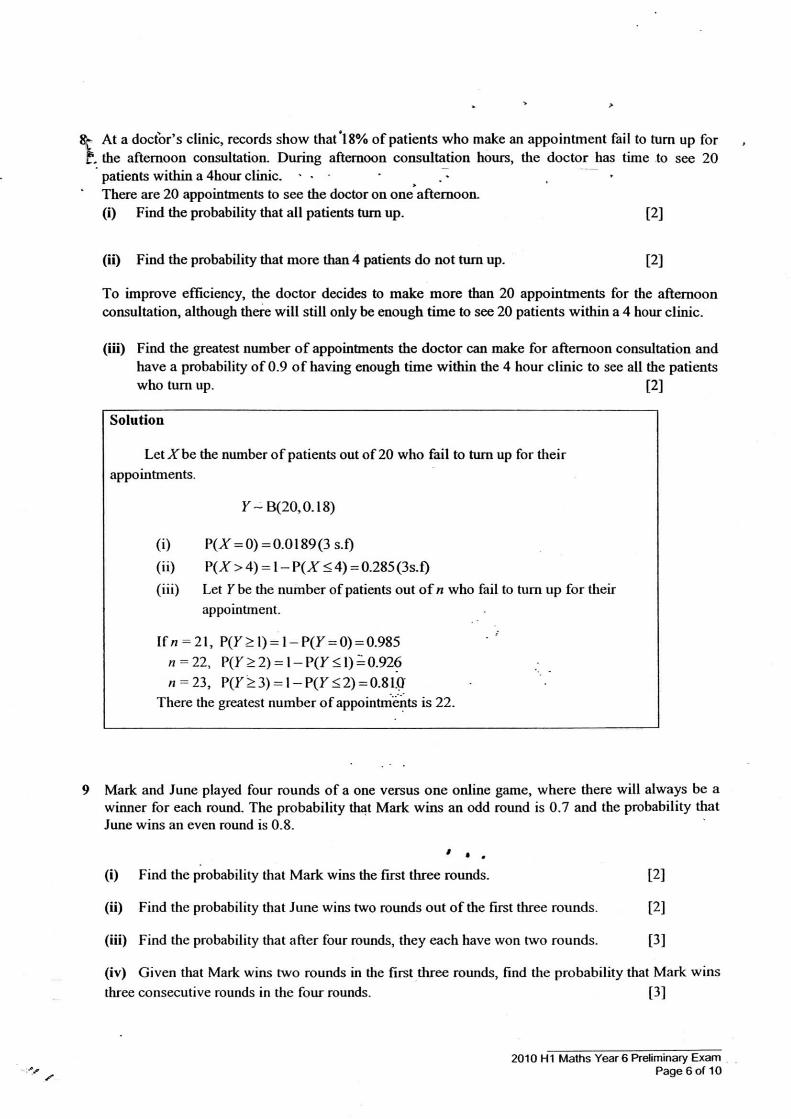
{K At a doctor's clinic, records show that 18% of patients who make an appointment fail to turn up for i. the afternoon consultation. During afternoon consultation hours, the doctor has time to see 20
patients within a 4hour clinic. * • There are 20 appointments to see the doctor on one afternoon. (i) Find the probability that all patients turn up. [2]
(ii) Find the probability that more than 4 patients do not turn up. [2]
To improve efficiency, the doctor decides to make more than 20 appointments for the afternoon consultation, although there will still only be enough time to see 20 patients within a 4 hour clinic.
(iii) Find the greatest number of appointments the doctor can make for afternoon consultation and have a probability of 0.9 of having enough time within the 4 hour clinic to see all the patients who turn up. [2]
Solution
Let X be the number of patients out of 20 who fail to turn up for their appointments.
r~B(20,0.18)
(i) P(X = 0) =0.0189(3 s.f)
(ii) P( X > 4) = 1 - P( X < 4) = 0.285 (3s.f)
(iii) Let Y be the number of patients out of n who fail to turn up for their appointment.
\fn = 21, P(r>l) = l-P(r = 0) = 0.985 n = 22, P(r>2) = l - P ( 7 < l ) = 0.926 n = 23, P(r>3) = l -P( r<2) = 0.81.0
There the greatest number of appointments is 22.
9 Mark and June played four rounds of a one versus one online game, where there will always be a winner for each round. The probability that Mark wins an odd round is 0.7 and the probability that June wins an even round is 0.8.
(i) Find the probability that Mark wins the first three rounds. [2]
(ii) Find the probability that June wins two rounds out of the first three rounds. [2]
(iii) Find the probability that after four rounds, they each have won two rounds. [3]
(iv) Given that Mark wins two rounds in the first three rounds, find the probability that Mark wins three consecutive rounds in the four rounds. [3]
2010 H 1 M a t h s Year 6 Prel iminary E x a m P a g e 6 of 10

Solution
(i) P(MMM) = (0.7X0.2)(0.7) = 0.098
(ii) P(JJM) + P(JMJ) + P(MJJ) - (0.3X0.8X0.7)+(0.3X0.2X0.3)+(0.7X0.8)(0.3) = 0.354
(iii) P(MMJJ) + P(JJMM) + P(MJMJ) + P(JMJM) + P(JMMJ) + P(MJJM) = (0.7)(0.2)(0.3)(0.8) + (0.3X0.8)(0.7)(0.2) + (0.7)(0.8)(0.7)(0.8) + (0.3)(0.2)(0.3)(0.2) + (0.3)(0.2)(0.7)(0.8) + (0.7)(0.8)(0.3)(0.2) = 0.4516
P(JMMM) = (0.3)(0.2)(0.7)(0.2) P(JMM) + P(MMJ) + P(MJM) (0.3)(0.2)(0.7) + (0.7X0.2)(0.3) + (0.7)(0.8)(0.7)
= 0.176 (3s.f)
A coffee company claims that a new coffee product can lower cholesterol level by as much as 20 mg/dL. Over a period of time, a random sample of 60 volunteers drinks this new coffee product. The decrease in cholesterol level, JC in mg/dL are summarised by
, £ J C = 1020, $ V = 2 I 1 6 4
(i) Find the unbiased estimates of the population mean and variance. [3]
(ii) Test a t the 5% significance level, whether the mean decrease in cholesterol level is less than 20 mg/dL. [4]
(iii) State, giving a reason, whether any assumptions about the population are needed in order for the test to be valid. [ 1 ]
(iv) In another test, using the same data and at the 1% significance level, the hypotheses are as follows:
ftufl hypothesis: the population mean decrease in cholesterol level is equal to fa , Alternative hypothesis: the population mean decrease in cholesterol level is not equal to / i 0 .
Given that the null hypothesis is rejected in favour of the alternative hypothesis, find the range of possible values of / / 0 . [4]
2010 H1 Maths Year 6 Preliminary E x a m Page 7 of 10

Solution £ x = 1020, 5]JC 2 =21164
- _ Z * _ 1 0 2 0
( • )
X =
* 2 =
60 = 17
/ i - l ( I » 2 J _
59 21164-
(1020)2
60 = 64.814
H 0 : / i = 20 vs H, : / i<20
Perform a 1-tail test at 5% level of significance. 2 \
Under H 0 , X~N \- approximately, by Central Limit Theorem,
where ^ = 2 0 , s = 764.814, x = 17, « = 60
Using a z-test, p -value =0.00195 ( 3 s f ) Conclusion: Since the p -value = 0.00195 < 0.05, we reject H 0 and conclude that there is sufficient evidence, at 5% significance level, that the mean decrease in cholesterol level is less than 20.
(iii) No assumption is needed as n is large and the sample mean follows a normal distribution by Central Limit Theorem.
(iv) For H0 to be rejected,
P(X<x)< 0.005 OR P{X>x)< 0.005 From GC, P(Z < -2.57583) = 0.005 P{Z < 2.57583) = 0.98
Hence, 17-/ / 0 <-2.57583 OR ' 764.814/60 764.814/60
Solving, fa * 1 9 7 (3sf) OR // 0 < 14.3 (3sf)
> 2.57583
For two years, a factory records the number of components, x thousands, it produces each quarter and the total cost, y thousands of dollars, of producing the components. The table below summarises the results.
x 15 17 13 21 16 22 14 18 y 29 35 27 43 34 41 30 36
(i) Give a sketch of the scatter diagram for the data as shown on your calculator. [2]
(ii) Calculate the product moment correlation coefficient, and comment on its value in relation to the scatter diagram. [2]
(iii) Calculate the equation of the regression line of y on x , and draw this line on your scatter diagram.
[2]

(iv) Find the total cost of production (to* the nearest thousand) if the number of components produced is 40000 for next three-month period. Comment on the validity of this prediction.
[2]
(V) For the next three-month period, the budget for the total cost of producing the components is $38000. Using an appropriate equation of the regression line, estimate the number of components (to the nearest thousand) that will be produced. [2]
(vi) The selling price of each component is $2.05. Indicate on the same scatter diagram the additional line you have to include to estimate the number of components it has to produce so that the total cost and total income balances. Write down the number of components (correct to 2 s.f.) and give a brief interpretation what this value means. [3]
Solution
( i )
(ii) r = 0.969. This value is consistent with the scatter diagram which shows that x and y have a strong positive correlation.
(iii) v = 5.3333+1.7083* v = 5.33 +1.708* (3 s.f)
(iv) When x = 40, y = 5.3333 + 1.7083(40) = 73.6653 = 73.7(3 s.f)
This value may not be accurate because we are extrapolating. The linear relation may not exist outside the range of values given.
(v) x = 0.549v - 1.89 When v = 38, * = 0.549 (38)- 1.89= 19 -The number of components is 19000.
(vi)
Intersection X = iS . f i09?56 Y=32 . . .
The number of components (correct to 2 significant figures) it has to produce so that the total cost and total income balances = 16000. The factory makes a profit i f the output is above this level. If the output is below this level, it suffers a loss.
2010 H1 Maths Year 6 Preliminary Exam Page 9 of t O

12 (a) The random variable X has the distribution N(ji,a2). Given that, • > ?(X < 65) = ?(X > 95) = 0.345 find the values of p and a. [£]
(b) The total playing time of a football match may be modelled using a normal distribution with mean 94 minutes and standard deviation 1.3 minutes.
(i) Two football matches are chosen at random. Find the probability that one has a total playing time of more than 95 minutes and one has a total playing time of less than 95 minutes.
[3]
(ii) Using a suitable approximation, find the probability that, in fifty football matches, there is at least 10 matches in which the total playing time is more than 95 minutes.
[4]
(iii) Find the probability that, in a random sample of five football matches, the average total playing time is more than 95 minutes. [3]
Solution (a) ?(X < 65) = ?(X > 95) = 0.345
^ = ^ = 80 2
?(X< 65) = 0.345
P ( Z < ^ ) = 0.345 a
— = -0.39886 cr
a = 37.6(3 s.f)
(b) Let A'be the total playing time of a football match. X~N(94,1.3 2)
(i)
2?(X <95)P(X >95) = 2(0.77912)(1 -0.77912)
= 0.344(3s.f) (ii) Let Y be the number of matches out of 50 where the total playing time is more than 95 minutes.
r~B(50,0.22088) Since np >5 and n(l-p) >5 and n is large,
r~Af ( l 1.044,8.6046) P(r > 10) = P(r > 10.5) by continuity correction
= 0.701 (3s.f) (iii) Let Wbe the average total playing time of a random sample of 5 football matches.
w=xl+x2+x3+x4 ^ 5 5
P(W>95) = 0.0427(3s.f)
2010 H1 Maths Year 6 Prel iminary Exam V Page 10 of 10