rail review 2016 - national transport authority · the mobilisation of the customer first...
TRANSCRIPT

Rail Review 2016REPORT
August 2016


2
1 Introduction .................................................................................................................................... 7
1.1 Terms of Reference ....................................................................................................................... 7
1.2 Funding ......................................................................................................................................... 8
1.3 Current Position Compared to 2014 ............................................................................................. 8
1.4 Review Participants ....................................................................................................................... 9
1.5 Supporting technical resources .................................................................................................... 9
2 The Rail Network ........................................................................................................................... 11
2.1 Passenger Rail Services ............................................................................................................... 13
2.2 Existing passenger demand......................................................................................................... 16
2.3 Fleet ............................................................................................................................................ 19
3 The Role of Rail ............................................................................................................................. 21
3.1 Introduction ................................................................................................................................ 21
3.2 The Benefits of Travel by Rail ...................................................................................................... 21
3.3 Sustainability ............................................................................................................................... 23
3.4 Rail Freight .................................................................................................................................. 24
4 Potential For Future Growth ......................................................................................................... 25
4.1 Introduction ................................................................................................................................ 25
4.2 Future trends .............................................................................................................................. 25
4.3 Proposed Measures to Improve Rail Services ............................................................................. 26
4.4 Line Speed and Infrastructure ..................................................................................................... 27
4.5 Strategic Network Developments ............................................................................................... 29
5 Financial Situation ......................................................................................................................... 31
5.1 Overview ..................................................................................................................................... 31
5.2 Financial History 2007 to 2015 ................................................................................................... 31
5.3 Appropriate Funding Levels ........................................................................................................ 34
5.4 Fleet ............................................................................................................................................ 37
5.5 Financial Overview ...................................................................................................................... 37
6 Possible Funding Solutions ................................................................................................................. 39
6.1 Introduction ................................................................................................................................ 39
6.2 Existing Projected Funding Gap .................................................................................................. 39
6.3 Potential Solutions to Resolve the Funding Gap and Solvency Concerns ................................... 39
6.4 Balance Sheet .............................................................................................................................. 43

3
7 Conclusions ........................................................................................................................................ 45
Appendices ............................................................................................................................................ 47

4
Executive Summary
Ireland has a network of rail lines that have been in place for almost 150 years over which a significant number of public transport rail services are provided. The network supports the economic and social development of the state in providing accessible transport to many key destinations. Approximately 42 million passenger journeys will be completed on the network in 2016, which is returning to the levels achieved at the height of the boom in 2007. The network and services all require significant state funding in order to continue to operate.
During the recent economic downturn, the funding for the operation and maintenance of the rail network was reduced significantly and has not recovered to a sustainable level for the network that currently exists.
This Rail Review examines the network that is operated, the potential of that network to meet both travel demand and environmental objectives. It examines the funding required to operate and maintain the existing network and identifies the funding gap. It then proposes other means of reducing the funding gap if the full state funding is not available.
If the funding gap is not addressed, the consequences are a deteriorating network, increasing safety rules mitigated by slower services or cessation in services, subsequent reduction in passenger numbers resulting in further reduction in revenues to the company, no alternative but to reduce services and a reduction in the benefit to the state of the investment in fleet and track under the Transport 21 programme.
This review is also undertaken in the context of the Department of Transport, Tourism & Sport’s document “Investing in Our Transport Future – Strategic Investment Framework for Land Transport” which sets as its first funding priority the achievement of steady state maintenance of the land transport system prior to investing in new assets.
Funding Gap
The company’s funding gap between current funding levels and appropriate funding levels for the period 2017 – 2021 is approximately €103m per annum. An increased funding of this level per year will bring the spending on the maintenance of the network and the fleet up to an appropriate level and start the investment in refurbished and new fleet to meet future growth.

5
For the period 2009 to 2015 Iarnród Éireann has incurred accumulated losses of €125.1m despite delivering €76m in cost savings in the same period. The accumulated losses were incurred primarily as a result of reduced exchequer funding and falling passenger numbers. The net result of this practice has been to weaken the balance sheet to the point where it is not possible to incur any losses in the future without risking insolvency. The European Union in setting the principles for the operation of railways has outlined that railways should be operated such that the Infrastructure Manager breaks even and the Railway Undertaking returns a reasonable profit.
The funding required to address the legacy of accumulated losses since 2009 is an additional investment of €41.7m in each of the years 2017 to 2019, the remaining term of the current Direct Award Contract between the NTA and Iarnród Éireann. The table below combines the funding gap and solvency issues.
Potential Solutions to Resolve the Funding Gap and Solvency Concerns There are three broad possible solutions for resolution of the company’s current funding shortfall; 1. Increased exchequer grants 2. Network reduction and line closures 3. A combination of 1 and 2 above with a further proposal to address the under compensation to Iarnród Éireann for the Department of Social Protection’s Free Travel Scheme. These are outlined in full detail within this Rail Review.
2017 2018 2019 2020 2021€m €m €m €m €m
Funding Gap 102.9 116.7 113.1 93.4 90.6Compensation for Underfunding 2010 to 2016 41.7 41.7 41.7 - - Total Additional Funding 144.6 158.4 154.8 93.4 90.6
Funding to address solvency/under-compensation in previous years:

6
Conclusion Iarnród Éireann has experienced a return to growth in all business areas since 2014. However, despite this, the solvency of the company remains a major concern due to the accumulated losses as a result of the reduced Exchequer funding and the consequent deterioration of shareholder funds. Both the NTA and Iarnród Eireann want to ensure that there is a resilient rail network in place and an appropriately funded company to manage that network so that rail can contribute to the wider social and economic objectives of the state. The rail network is a valuable asset that the state has invested in over many years. An additional €103m over the next five years will secure the long term sustainability of the rail network, the financial stability of Iarnród Éireann and the development of the railway network for the future. Along with the support of other effective policies to encourage modal shift to integrated public transport, the rail network can contribute to facilitating more sustainable land use development patterns, to providing a viable alternative to congested roads and to achieving the national climate change targets.

7
1 Introduction
Ireland has a network of rail lines that have been in place for almost 150 years over which a significant number of public transport rail services are provided. The network supports the economic and social development of the state in providing accessible transport to many key destinations. Almost 40 million passenger journeys were completed on the network in 2015. The network and services all require significant state funding in order to continue to operate.
During the recent economic downturn, the funding for the operation and maintenance of the rail network was reduced significantly and has not recovered to a sustainable level for the network that currently exists.
This Rail Review examines the network that is operated, the potential of that network to meet both travel demand and environmental objectives. It examines the funding required to operate and maintain the existing network and identifies the funding gap. It then proposes other means of reducing the funding gap if the state funding is not available.
If the funding gap is not addressed, the consequences are a deteriorating network, increasing safety rules mitigated by slower services or cessation in services, subsequent reduction in passenger numbers resulting in further reduction in revenues to the company and a reduction in the benefit to the state of the investment in fleet and track under the Transport 21 programme.
This review is also undertaken in the context of the Department of Transport, Tourism & Sport’s document “Investing in Our Transport Future – Strategic Investment Framework for Land Transport” which sets as its first funding priority the achievement of steady state maintenance of the land transport system prior to investing in new assets.
1.1 Terms of Reference
The National Transport Authority (‘NTA’, the Authority) and Iarnród Éireann (IÉ) have undertaken a process to review and evaluate possible solutions to the Rail Company’s financial requirements under a number of funding scenarios. This report is the outcome of the process.
In light of the envisaged financial envelope for Irish rail PSO subvention and capital spending in respect of the period 2016-2021, the terms of reference for the review are as follows:
1. To identify the implication for Iarnród Éireann (IÉ) finances of the existing financial envelope for PSO and capital works and to consider the funding requirements to avoid losses in Irish Rail;
2. To examine the scope, subject to retention of the existing route network, for (a) changes in PSO rail services (b) other efficiencies and (c) revenue generation;
3. To explore the impact of adjustments to the existing route network in terms of impacts on costs and revenues (including obligations relating to closed lines);

8
4. As part of the assessment at (3) above, to examine alternative PSO funding of bus services that may be required to meet public transport needs, currently met by rail, and the impacts on passengers in terms of journey times and service frequencies of such adjustments;
5. To illustrate potential scenarios for a sustainable operating and funding model for Irish Rail based on an evaluation of the routes and services that could be retained on a financially viable and efficient basis by Irish Rail;
6. To examine the future investment required for the development of the railway network to meet future demands.
1.2 Funding
The management and operation of the rail network by Iarnród Éireann is divided into two separate business units:
a) Railway Undertaking – operation of rail services under contract with the NTA funded by PSO and fare revenue
b) Infrastructure Manager – maintenance and enhancement of the rail track and stations under contract with the Department of Transport Tourism & Sport (the Multi-annual Contract i.e. the “MAC” ) funded by grant from Department and Track & Station Access Charges.
Table 1 below contains the various components of this financial envelope for the review period 2016-2021.
Table 1: Current and Capital Funding Estimates 2016 – 2021
2016 2017 2018 2019 2020 2021
Dept. - MAC Total 126.0 130.17 130.17 130.17 130.17 130.17
NTA - PSO 110.64 110.64 110.64 110.64 110.64 110.64
Dept. & NTA - Capital Enhancement Total 26.0 11.0 41.0 32.0 31.0 22.0
1.3 Current Position Compared to 2014
The last Rail Review was completed in 2014, a time when passenger numbers on the network were only starting to recover from their lowest point in a decade in 2013, and IÉ’s funding was at its lowest level for a decade, both effects of the economic downturn and significant underfunding from central government.
Encouragingly, IÉ’s position has improved since then in line with the wider economic recovery and the back drop for this Rail Review is more positive. There is growth in passenger numbers, which are set to rise for a third straight year (approaching the pre-recession level of 2007) and the funding situation has stabilised as no additional cuts are being applied.

9
Furthermore, several of the proposals included in the 2014 Rail Review are being acted upon, with the mobilisation of the Customer First programme, the forthcoming reopening of the Phoenix Park Tunnel and the planned implementation of the 10 minute frequency on DART services in 2017.
However, there are still significant challenges to overcome. The decrease in multi annual contract funding for the Infrastructure Management in recent years has led to a deteriorating asset base. Large and varied parts of the railway’s infrastructure are in need of urgent maintenance due to this lack of investment, which is of concern to all stakeholders including the Commission for Railway Regulation.
The aim of this report is to set out how IÉ can maintain a steady state of investment in the years ahead, and build on this to provide an improved and expanded level of service for its customers and to meet the state’s objective to grow sustainable transport use.
1.4 Review Participants
The review, which commenced on 3rd March and was concluded on 30th June, was jointly progressed by teams from each of IÉ and the Authority, led by the CEO of each organisation. The process was advanced through regular Steering Group meetings supported by the production of technical notes and position papers.
1.5 Supporting technical resources
The internal technical, transport planning and financial teams of IÉ and NTA supported the review process through the production of position papers and the analysis of various scenarios as requested by the Steering Group. External technical support was provided by Roland Berger Strategy Consultants Ltd (Roland Berger) and AECOM.
Roland Berger had been appointed 2014 and again in 2016 by Iarnród Éireann to develop a model (Route Profitability Model) for the financial assessment of various rail network and service scenarios.
The basis of the model development was an analysis of route profitability to provide an understanding of the contributions to profit and loss of its constituent operations. The analysis considered performance at an overall system level and separated into the individual business units. The assessment model was used to examine various network and service scenarios and to assess the financial implications of these.
The Roland Berger reports can be found in Appendix 6 and 7 of this document.
AECOM were initially appointed by IÉ in 2010 to undertake a comprehensive review of the infrastructure investment needs of the network up to 2030.
The AECOM review (2030 Rail Network Strategy Review, April 2011) established the infrastructure maintenance and renewal investment requirement for the current network in order to achieve a steady state infrastructure.

10
This year IÉ re-commissioned AECOM to update its original analysis, with particular reference to the backlog of work that has emerged as a result of underfunding since 2011. AECOM have been tasked with identifying the future funding requirement in this context taking account of efficiencies and other impacts on costs that have arisen both since the original analysis and the last Rail Review.
The AECOM report can be found in Appendix 4 of this document.

11
2 The Rail Network The rail network in Ireland comprises approximately 2,400 km of railway track, of which approximately 1,660 km is currently active, and includes 1471 passenger stations and 372 platforms2. It also comprises 5,100 bridges, 1,240 level crossings, over 4,900 cuttings and embankments and 14 tunnels. The railway is mainly single track, with 886km of double track and 60km of multiple track.
The network includes main lines, Dublin suburban and commuter passenger routes and Cork Suburban routes, together with freight-only routes. The majority of the network is comprised of radial lines focused on Dublin. The network largely provides for inter-urban connections providing strategic transport links at the national level between the six key cities on the island, Dublin, Cork, Galway, Limerick, Waterford and Belfast as well as linking to smaller cities and large towns which have strong regional functions in particular Sligo, Tralee, Wexford (see the Network Map overleaf). 1 Including Manulla Junction which only operates as a transfer point for services to/from Ballina, and Kishogue the opening of which is pending and Mosney which currently has no service. 2 See Appendix 1 for breakdown of track lengths and depiction of network configuration

12

13
Intra-urban rail is also extensive within the Dublin area with the provision of DART in 1984 on the main network providing the core high capacity network that is central to the Greater Dublin Area’s mass transit system. Freight terminals at Ballina, Westport, and Waterford, which are operated by Iarnród Éireann, also form part of the rail network. All are intermodal terminals handling the interchange of traffic between road and rail modes. In addition to the Iarnród Éireann depots there are a number of facilities owed by other companies including facilities at Dublin Port, Tara Mines (Navan), and Belview Port (Waterford). A disused rail line linking the Port of Foynes to Limerick is also being considered for future development.
2.1 Passenger Rail Services
Various passenger service types operate across the national rail network, in the main they can be broken down into 3 categories – Intercity, Commuter and DART. Different service types share lines (as described above) at various locations across the network and many stations are served by a number of service types, particularly within the Dublin Region. The range of passenger services currently in operation on the national network is detailed in the tables below (Tables 2&3) - Intercity and Commuter/DART services are set out separately. This provides a high-level indication of service frequency and underlines the variations in service provision which occur across the network at present. The most frequent services overall are Commuter and DART services, which tend to be shorter journeys. The most frequent InterCity service is between Dublin and Limerick (direct and indirect services), or between Dublin and Cork (direct).

14
Ta
ble
2 In
terc
ity/I
nter
-Reg
iona
l Ser
vice
s
Rout
e/Li
ne
Serv
ice
No.
Ser
vice
s,
(2
dire
ctio
nal,
Wee
kday
)3 Du
blin
Con
nolly
- Bo
rder
(NI)
Dubl
in C
onno
lly -
Belfa
st C
entr
al
16
Dubl
in C
onno
lly -
Slig
o M
cDia
rmad
a Du
blin
Con
nolly
- Sl
igo
14
Dubl
in C
onno
lly -
Ros
slare
Eur
opor
t Du
blin
Con
nolly
- Ro
ssla
re/R
ossla
re
Euro
port
8
Dubl
in H
eust
on -
Port
arlin
gton
-Gal
way
Cea
nnt
Dubl
in H
eust
on -
Galw
ay
18
Dubl
in H
eust
on -
Cher
ryvi
lle Ju
nctio
n –
Wat
erfo
rd P
lunk
ett
Dubl
in H
eust
on -
Wat
erfo
rd
14
Dubl
in H
eust
on -
Cork
Ken
t Du
blin
Heu
ston
– C
ork/
Lim
eric
k 29
Du
blin
Heu
ston
- Po
rtar
lingo
n –
Bally
brop
hy –
Lim
eric
k Co
lber
t Du
blin
Heu
ston
- Li
mer
ick
7 Du
blin
Heu
ston
- Po
rtar
lingt
on –
Ath
lone
– M
anul
la Jn
t –W
estp
ort/
Balli
na
Dubl
in H
eust
on -
Wes
tpor
t/Ba
llina
8
Dubl
in H
eust
on -
Cork
Ken
t – T
rale
e Ca
sem
ent
Dubl
in H
eust
on -
Tral
ee
2 Li
mer
ick
Colb
ert -
Gal
way
Cea
nnt
Lim
eric
k-Ga
lway
9
Lim
eric
k Co
lber
t - W
ater
ford
Plu
nket
t Li
mer
ick-
Wat
erfo
rd
4 Co
rk K
ent -
Tra
lee
Case
men
t Co
rk-T
rale
e 5
3 As o
pera
ted
on N
atio
nal R
ail C
ensu
s Day
201
5

15
Tabl
e 3
Com
mut
er &
DAR
T Se
rvic
es
Rout
e/Li
ne
Dubl
in C
omm
uter
No.
Ser
vice
s,
(2
dire
ctio
nal,
Wee
kday
)4 Du
blin
Heu
ston
– C
ork
Kent
/Gal
way
Cea
nnt
Dubi
n He
usto
n - P
ortla
oise
37
Du
blin
Heu
ston
– C
ork
Kent
/Gal
way
Cea
nnt
Dubl
in H
eust
on -
New
brid
ge
7 Du
blin
Heu
ston
– C
ork
Kent
/Gal
way
Cea
nnt
Dubl
in H
eust
on -
Kild
are
2 Du
blin
Heu
ston
– C
ork
Kent
/Gal
way
Cea
nnt
Dubl
in H
eust
on -
Athl
one
3 Du
blin
Con
nolly
– S
ligo
McD
iarm
ada
Dubl
in C
onno
lly/P
ears
e - L
ongf
ord
4 Du
blin
Heu
ston
–Ch
erry
ville
Junc
tion
– W
ater
ford
Plu
nket
t Du
blin
Heu
ston
- Ca
rlow
3
Port
arlin
gton
– G
alw
ay C
eann
t Ga
lway
- At
hlon
e 2
Dubl
in C
onno
lly –
Slig
o M
cDia
rmad
a Du
blin
Con
nolly
/Pea
rse/
Bray
- M
ayno
oth
62
Dubl
in C
onno
lly -
Dock
land
s Lin
e Du
blin
Con
nolly
/Doc
klan
ds -
M3
Park
way
19
Cl
onsil
la -
M3
Park
way
Cl
onsil
la -
M3
Park
way
22
Du
blin
Con
nolly
– B
orde
r (N
I) Du
blin
Con
nolly
/Pea
rse/
Bray
- Du
ndal
k 14
Du
blin
Con
nolly
– B
orde
r (N
I) Du
blin
Con
nolly
/Pea
rse/
Bray
- Dr
oghe
da
36
Dubl
in C
onno
lly –
Bor
der (
NI)
Dubl
in C
onno
lly -
New
ry
1
Cork
Com
mut
er
Co
rk K
ent-
Cobh
(Cor
k Su
burb
an)
Cork
- Co
bh
46
Cork
Ken
t-M
idle
ton
(Cor
k Su
burb
an)
Cork
-Mid
leto
n 44
Du
blin
Heu
ston
– C
ork
Kent
Co
rk-M
allo
w
14
O
ther
Sub
urba
n/Co
mm
uter
Lim
eric
k Co
lber
t – G
alw
ay C
eann
t Li
mer
ick-
Enni
s 9
Lim
eric
k Co
lber
t – G
alw
ay C
eann
t Ga
lway
-Enn
is 1
Dubl
in H
eust
on –
Por
tarli
ngto
n -G
alw
ay C
eann
t At
henr
y-Ga
lway
4
Bally
brop
hy –
Lim
eric
k Co
lber
t Li
mer
ick-
Bally
brop
hy
4 Ba
llybr
ophy
– L
imer
ick
Colb
ert
Lim
eric
k-N
enag
h 1
DART
Du
blin
Con
nolly
/Pea
rse-
Grey
ston
es-
Mal
ahid
e/Ho
wth
15
7
4 A
s ope
rate
d on
Nat
iona
l Rai
l Cen
sus D
ay 2
015

16
2.2 Existing passenger demand
Total passenger journeys on the national rail network in 2015 were 39.7 million. This represents an annual increase of 5% and is the second year of continuous passenger journey growth. Rail passenger demand peaked in 2007 at 45.5m passengers, before falling back to a low 36.7m in 2012 and a subsequent flattening of volumes in 2013. The first significant increase in passenger volumes was recorded in 2014 (3%).
Figure 2 Annual Rail Journeys Nationally
In 2015 all network segments delivered positive year on year growth with Intercity services at 2.3%, Commuter at 3.6% and DART at 7.5%. DART and Commuter growth can be attributed to the improved employment levels within the Greater Dublin area together with the significant increase in Leap card penetration and usage. Intercity growth was more moderate as disposable incomes remain challenged in areas outside of Dublin. Currently approximately 17.2m passengers use the DART network, 12.1m Commuter network and 10.4m use the Intercity network annually. Rail usage varies significantly across the national network – the annual National Rail Census provides a snapshot of this. The annual rail census gives an indication of the journey pattern across the network and is a good reference point for previous years’ census data. An overview of the 2015 Census is provided within Appendix 1. Some key findings are as follows:
The total patronage5 on the rail network on Census day was 141,393, involving around 678 rail services6.
Approximately 83% of daily journeys were undertaken in the Greater Dublin Area7 underlining that the majority of rail demand is associated with this region.
5 Passengers boarding services, National Heavy Rail Census 2015, NTA/IÉ 6 Including shuttle services operating Limerick Colbert – Limerick Junction and return 7 Dublin, Kildare, Meath and Wicklow

• WhileDARTservicesrepresentedaround23%oftotalservicesoperatedtheyaccountedforapproximately46%oftotalpassengerboarding’sonthenetwork-thisunderlinesthefocusofdemandonthispartofthenetwork.
• Almost1.5timestheproportionofboardingstookplaceonConnollyservicesasonHeustonservices (14,763 boardings versus 9,639 boardings), reflecting the number of DublincommuterservicesinConnolly.
• Regional services (i.e. thoseservices thatdonot terminate inDublin) combinedpassengernumbersaccounted foronly5%of totalpassengerdemandonCensusdayunderliningthelimitedusageoftheseservices.
• Thebusieststationinthecountry,withjustover29,755boardingsandalightingscombined,wasConnolly station; thequietest stationwith a total of 1 boarding andno alightingwasCarrickonSuir.
• Thetoptenstationsaccountedforapproximately46%oftotalboardingsnationallyand48%oftotalalightings.WiththeexceptionofCork’sKentStation,allofthetoptenstationswerelocatedintheDublinarea.
Stations Sum of
Reconciled On
Sum of Reconciled
Off Daily Total
Connolly 14,763 14,992 29,755 Pearse 13,439 13,766 27,205 Heuston 9,639 9,680 19,319 Tara Street 7,802 9,550 17,352 Lansdowne 3,428 4,035 7,463 Cork 3,478 3,512 6,990 Dun Laoghaire 3,308 3,439 6,747 Grand Canal Dock 2,673 3,731 6,404 Bray 2,957 2,837 5,794 Blackrock 2,859 2,844 5,703
Thetotalpassengernumbersacrossthedifferentlinesfor2015isasfollows:RouteDescription PassengerJourneys(millions)in2015Intercity Dublin-Cork 2.902Dublin-Tralee 0.596Dublin-Limerick 0.828Dublin–Galway 1.592Dublin–WestportBallina 0.539Dublin-Waterford 1.189Dublin–Belfast 1.068Dublin–Sligo 1.259Dublin–Rosslare 0.316LimerickJunction–Waterford 0.032Limerick–Ballybrophy 0.025Limerick–Galway(EnnistoAthenry) 0.102TotalIntercity 10.448

18
Commuter Dublin – Drogheda 4.718 Dublin – Maynooth 3.620 Dublin – Kildare 2.222 Dublin – Wicklow 0.278 Dublin – Navan 0.0119 Cork – Cobh 0.764 Cork – Midleton 0.340 Total Commuter 12.062 DART 17.150
25 stations in the country generated less than 100 journeys on Census day and a further 19 stations generated between 100 and 200 journeys
All five stations between Ballybrophy and Limerick, all four stations between Limerick
Junction and Wateford, and three stations between Ennis and Athenry were all among the 15 least used on the network with less than 40 passenger movements.
Stations Sum of
Reconciled On
Sum of Reconciled
Off Daily Total
Services
Carrick-on-Suir 1 0 1 Limerick Jct – Waterford Roscrea 7 3 10 Ballybrophy – Limerick Ardrahan 3 8 11 Galway – Limerick Cahir 9 2 11 Limerick Jct – Waterford Foxford 5 7 12 Dublin – Ballina Attymon 7 7 14 Dublin – Galway Cloughjordan 6 9 15 Ballybrophy – Limerick Fota 10 9 19 Cork – Cobh Castleconnell 15 5 20 Ballybrophy – Limerick Birdhill 11 10 21 Ballybrophy – Limerick Tipperary 11 10 21 Limerick Jct – Waterford Craughwell 13 14 27 Galway – Limerick Gort 19 13 32 Galway – Limerick Nenagh 17 17 34 Ballybrophy – Limerick Clonmel 23 17 40 Limerick Jct – Waterford Newry 49 0 49 Dublin – Belfast Carrigaloe 37 13 50 Cork – Cobh Rosslare Europort 20 30 50 Dublin– Rosslare Europort Farranfore 22 39 61 Tralee – Cork/Dublin Banteer 42 24 66 Tralee – Cork/Dublin Rosslare Strand 22 44 66 Dublin– Rosslare Europort Woodlawn 38 45 83 Dublin – Galway Thomastown 40 48 88 Dublin – Waterford Clondalkin/Fonthill 42 48 90 Commuter: Dublin – Kildare Sixmilebridge 53 37 90 Galway – Limerick

19
2.3 Fleet
In 2013, in response to falling passenger demand and with the aim to reducing fuel and energy costs, IÉ implemented its Fleet Strategy Project which saw a reduction in the maximum train sizes of Intercity and off-peak DART services. However, since the recovery of passenger levels from 2014 and with the proposed introduction of new services using the Phoenix Park Tunnel, the previously removed MKIV fleet has now been reintroduced.
This is not sufficient, however, to deal with potential capacity demands as passenger numbers recover to 2007 levels. Already there are a number of Intercity and Commuter routes which are approaching or exceeding capacity. Since 2007, MK2, MK3 and 2700 Class DMU rolling stock have been phased out, and while the new fleet of ICR vehicles was introduced, this will not be adequate to meet demand in the short- to medium-term. For a period around 2007, Iarnród Éireann had more fleet than they currently have, as there was overlap between delivery of new rail fleet and withdrawal of old rail cars.
To adequately meet the future growth objectives of this report, a number of measures need to be taken to enhance IÉ’s fleet. This is particularly relevant to Intercity and Commuter services, as DART services have already undergone capacity enhancements in April of this year in preparation for the future DART 10 minute timetable.
Firstly, it is proposed that the Class 2700 DMU fleet, which was withdrawn from service in 2012, be refurbished at a unit cost of €0.3m and reintroduced on a phased basis in 2018/19 thus releasing ICR sets to other services. Furthermore, new ICR centre car vehicles should be purchased at a unit cost of €2.4m to €3.1m depending on procurement, with the lower cost estimate associated with a continuation of the existing Mitsui / Rotem Framework Agreement. It is yet to be determined from a procurement viewpoint whether the Mitsui purchase is possible. An alternative supplier would involve a new tendering process, longer lead in period and likely increased capital, operational and maintenance costs compared to the Mitsui option.
Another option is to purchase a new build fleet however this is more costly, involving a new tendering process, longer lead in period and increased operational and maintenance costs compared to the Mitsui option.
The table overleaf highlights the number of vehicles which will be required based on the various growth levels considered and costs. Iarnród Éireann has chosen the 6% Annual Loading Increase as the appropriate figure for design purposes. Further details on this can be found in Appendix 5. A detailed business case will be required if this fleet purchase was to be progressed.

20
Annual Loading Increase
No. of services increased
2700 Class Vehicles
Additional ICR Vehicles
Fleet Cost €’M
4% 19 28 31 82.4
6% 23 28 41 106.4
8% 25 28 49 125.6

21
3 The Role of Rail
3.1 Introduction
Iarnród Éireann carries 39.78 million passenger journeys accounting for 15.9% of the 249 million passenger journeys made annually on public transport throughout the State9. Currently around 17m passengers use the DART network and 22m passengers use the Intercity and Commuter network annually, accounting for over 1,500m passenger kilometres.
Rail also carries around 1% of freight tonne kilometres.10
This demonstrates the attraction that rail has for a very significant section of the travel market and the volume of trips that would be carried out using other modes (predominantly private car and bus) in the absence of rail. As such, rail has a key role to play in contributing to sustainable travel in Ireland now and into the future.
Envisioning the optimal rail network, in terms of national transport needs and value for money, needs to be against the backdrop of both its current role and the role it should serve into the future, given the forecast population and economic growth in Ireland.
3.2 The Benefits of Travel by Rail
This Chapter presents the conclusions in the comprehensive report included as Appendix 2. The report in Appendix 2, entitled ‘The Role of Rail – towards a national rail policy’, sets out all the factors that need to be weighed up when deciding on the optimal funding model for the rail network. These factors include:
The current role discharged by rail in Ireland Meeting policy goals – European and national Supporting the economy – growth, competitiveness, trade and freight, business travel Tourism – general, special tourism markets, rail tourism The environment and climate change –emissions and air quality Social benefits – social inclusion, improved accessibility and travel safety
The report examines the current transport role of rail, its position relative to other modes and how rail contributes to achieving national policy goals in relation to the environment, land use development, regional sustainability and economic development. To give a complete picture the report also sets out the challenges that rail faces in terms of competition from road-based transport.
The report concludes that the current strengths of the rail network in providing for regular travel demand within Ireland’s largest urban areas (Dublin and Cork) and strategic inter-urban demand
8 ‘Rail Statistics for Ireland’, Statistical Bulletin Number 02/2016, National Transport Authority, (2016) 9 ‘Commercial Bus Services in Ireland (2015 statistics), Statistical Bulletin Number 04/2016 (Draft), National Transport Authority, (2016) 10 ‘Investing in our transport future – A strategic framework for investment in land transport’, Department of Transport Tourism and Sport (DTTAS), 2014

22
between Dublin and the other key cities and regional towns11 on the island will increase in importance as overall demand for travel increases with economic growth along with the requirement to meet other national policy goals in relation to carbon emissions. The wider social, environmental and economic benefits associated with the rail network are summarised as follows:
Rail provides the core high capacity element of the public transport network in the Greater Dublin Area (GDA) - approximately 7% of existing commuting demand in the GDA is met by rail. Without rail this demand would have to be met by other modes (car/bus) on a road network that would then suffer increased congestion. Demand for travel to/from and within the Greater Dublin Area is predicted to increase further in future years – maximising the capabilities of the existing rail network will be critical in managing this as the road network becomes more constrained, and will also prolong the economic life of the road network itself. Rail provides an irreplaceable role in providing high volume commuter transport in the Greater Dublin Area serving locations up to 80km from the city centre with high frequency services of approximately one hour travel time, and in providing a mass transit line through the heart of the city with DART.
Intra-urban rail, as a high capacity transport mode, delivers significant business agglomeration benefits by reducing travel times and/or the cost of travel, thereby reducing the effective distances between firms, as well as between firms and labour markets and raising overall productivity. Between urban centres it allows for reduced transport costs and thus increases commercial links between the centres. Multiple options for travel help support economic activity and encourage investment. The larger city regions in Ireland are now the focal points for internationally mobile investment with a growing number of investments attracted to the capital city and the larger population centres12. Strong inter-urban access, at present contributed to by the rail network, and international connectivity are part of what has secured this investment and part of what will continue to secure and maintain investment into the future. Reducing the strategic rail transport network is likely to have a negative impact on the attractiveness of Ireland’s larger city regions for foreign investors. Intra-urban rail also offers the facility to work while travelling which is not available to the same extent on other public transport modes.
A primary focus across national policy documents in the various sectors mentioned above is to increase sustainability and efficiency through more effective alignment of land use and transport and modal shift towards more sustainable forms of transport. Focusing especially on the development of locations within and around the key cities and towns that are served by the rail network is central to achieving these aims.
Rail currently has a significant market share of interurban travel associated with Dublin and while this was subject to decline from 2007 onwards, due largely to the economic downturn and increased competition for car and bus travel, more recent signs are that this is beginning to stabilise – maintaining and increasing this mode share is critical to preventing future shift
11 Belfast, Cork, Galway, Limerick, Waterford, Sligo, Tralee/Killarney, Westport, Wexford 12 ‘Policy Statement on Foreign Direct Investment in Ireland’, Department of Jobs, Enterprise and Innovation, (2014)

23
to private car for such journeys and to keeping Ireland’s road network moving, particularly in the Dublin area, now and into the future as demand increases.
The national rail network also plays a central role in sustaining and growing tourism demand and its associated benefits. Approximately 11% of domestic tourists and 5% of out-of-state tourists utilise the intercity rail network. Rail also provides high capacity transport links for high volume tourism and leisure demand created by special events and is regarded as a key part of the package to support and increase the attractiveness of the Port of Cork to the cruise industry. A significant reduction in the ability to travel by rail would be likely to impact negatively on how the country is viewed by international tourism markets and how strongly it can compete with other destinations for tourist travel. The introduction of the Belmond luxury cruise train indicates that the market has the potential to grow further.
As part of the overall public transport network rail supports social inclusion and social mobility by providing access to services, communities and jobs for those vulnerable to social exclusion including older people and people with disabilities. High levels of accessibility across the rail network facilitate and support universal access. Furthermore, each year more than 780,000 people benefit from rail travel through the Free Travel Scheme. Should the railways be cut back significantly there would be a requirement to find alternative means of enabling these groups to travel.
The rail network contributes not only to meeting transport demands but also to broader social, environmental and economic needs and objectives, all of which need to be taken into consideration in planning for the future of the network.
3.3 Sustainability
Ireland’s targets in relation to emissions reductions are already proving challenging and transport is one of the key sectors in which substantial improvements are required. Part of the necessary package of transport actions is maintaining and increasing the mode share of walking, cycling and public transport.
The environmental benefits of rail travel are well known. The International Union of Railways (UIC) reports that travelling by rail is 3-10 times less CO2 intensive compared to road or air transport. During 2010, the average rail passenger km in Ireland created just 60g of greenhouse gases, vs. 210g for road vehicles.13 If all rail journeys were made by car it would increase greenhouse gas (GHGs) emissions by around 240,000 tonnes, equivalent to 30,000 households14. Sustaining and building upon the role of rail in providing for travel demand will support national efforts to reach emissions targets.
13 'Energy efficiency and specific CO2 emissions', European Environment Agency (2013); 'Railway Handbook: Energy Consumption and CO2 Emissions', International Energy Agency and International Union of Railways, (2013),; The World Bank 14 Sustainable Energy Authority, Ireland; Central Statistics Office

24
The government is currently preparing the National Mitigation Plan, in which transport is a key sector (along with electricity generation, built environment and agriculture). The DTTAS will present a series of mitigation measures for the transport sector which will focus on the development of a cost effective policy platform for reducing emissions and increasing energy efficiency across all modes. It is envisaged that matters to be considered will include the role of technology, sustainable land use patterns, modal shift and travel demand. NTA and IÉ will play a key role in meeting these objectives.
The plan will also draw on the recently published Investing in our transport future – A Strategic Framework for Investment in Land Transport, which includes achieving steady state maintenance of rail infrastructure as one of its key priorities and principles for future investment
Already IÉ has made huge inroads in the area of energy efficiency over the past number of years, to the extent that IÉ has already passed the target of 30% improvement, set by Government, to be achieved by 2020. It has also reduced its emissions by 22% since 1996, whilst increasing train kilometres operated.
However, the transport sector as a whole is set to miss the 2020 targets, and more stringent targets of a 40% reduction are required by the EU by 2030, as part of a road map to reduce emissions by over 80% by 2050. In addition, the United Nations Climate Agreement (COP21) binds all governments to work to limit global temperature increase, with the role of transport highlighted.
A move to electrified systems such as envisaged in the DART Expansion Programme will accelerate the use of renewable energy in transport delivery, resulting in up to 75% of all journeys on the Iarnród Éireann network being powered by electricity.
3.4 Rail Freight
The principle of moving freight by rail supports existing Irish and EU requirements relating to sustainability of transport and environmental policies and aligns with the National Ports Policy, Dublin Port Master Plan and the emerging National Low Carbon Roadmap. Both the NTA and Iarnród Éireann welcome the proposed National Freight Review that is being commissioned by the DTTAS to identify the opportunities rail freight can deliver from both a commercial and environmental perspective to the Irish economy in the context of increasing economic growth and road congestion. Iarnród Éireann’s key strategy for freight is to organically grow the business by focusing on commercially viable niche point to point markets revenue streams. Rail offers a unique ability to move traffic in larger volumes and relatively higher speeds particularly using existing lines and assets that specifically have direct connectivity between Ports and inland distribution hubs. In this respect, Iarnród Éireann is pursuing new rail freight business opportunities including the drinks, healthcare, building materials, bio-mass, waste and dairy industries. Any rail lines that could support the development of rail freight in the future, where passenger services do not exist, should be protected in the interim while the business case for that investment is developed.
25
4 Potential For Future Growth
4.1 Introduction
Ireland’s economic future appears good – the economy is in recovery following the recent downturn. As the economy grows, demand for transport also increases in tandem. Rail can play a significant role in meeting this growth in demand for travel and movement of goods and can facilitate a switch to more sustainable patterns of mode choice amongst existing travellers and operators in the transport of goods. If investment in infrastructure is made today, and effective appropriate services are provided. There are four key markets where rail can carry out this role:
Travel within the major conurbations of Dublin and Cork, Travel to cities and large and medium-sized towns from their surrounding commuter
hinterlands that are served by rail, and Interurban travel between the cities and large and medium-sized towns in the State. Rail Freight
4.2 Future trends
National trends show:
The State is increasingly urbanising, i.e. as population grows, a higher proportion of people locate in towns and cities as defined by the CSO. In 201115, 62% of the population lived in ‘aggregate town areas’ i.e. those greater than 1500 population, a rise of 2.2% since 2006;
The population is living longer, and enjoying a more active and healthy period of retirement. This trend will increase the demand for travel by this cohort of the population;
The policy of increasing specialisation of healthcare facilities is being followed within the State, leading to an increase in the demand for travel for healthcare purposes;
Tourism is growing, both in absolute numbers of overseas and domestic visitors and the sector’s contribution to the national economy. The characteristics of tourists are also changing, with an increase in the proportion of independent tourists who often visit more than one location during their stay, and have a higher propensity to use public transport while travelling internally in Ireland;
As trip length increases, the mode share of travel undertaken by public transport increases, perhaps due to worsening road traffic congestion and scarce and costly parking at some types of destinations, in addition to the stress of driving in unfamiliar surroundings;
An increase in the regionalisation of employment, i.e. the location of new investment by FDI entities in areas outside the GDA to contribute to the achievement of balanced regional development;
There has been an increase recently in applications from commercial bus operators for licenses to operate services between cities and large towns outside the GDA to meet
15 2011 Census data being used as detailed 2016 Census data not yet available

26
demand for transport between these locations, indicating an increase in the diversity of the pattern of demand for travel nationally.
These trends indicate an increase in the diversity of travel pattern and future need for transport. Rail services need to be revised and updated to stay relevant to these new needs.
4.3 Proposed Measures to Improve Rail Services
The following measures which have significant potential to increase patronage on rail should be progressed where appropriate. Similar measures to those in the domain of service development have been implemented in several bus markets throughout the State over recent years. These have been in the main successful and have significantly increased patronage, particularly in cities and towns.
1. Improve the frequency of service so as to increase the utility offered by rail across a diverse range of needs and person-types, thereby increasing the likelihood that people will consider rail when planning a trip. This applies especially when travel during interpeak periods, the evenings, at weekends, in groups / families and in directions counter to traditional peaks is being planned – particularly in towns within the commuter belts of Dublin and other cities. Plans to increase the frequency of DART services to 10 minute headway during the core operating week should be progressed;
2. Targeted reduced fares to become more competitive with alternative modes of travel
available for the same journey, especially targeting groups / families;
3. Offer interoperable tickets to maximise passenger utility from the public transport network; 4. Increase the length of the core operating day to better address the needs of discretionary
travellers, especially at weekends and during the summertime. This is particularly important when targeting the market for travel to cities from towns within their commuter belts. Timetables for the planned suburban rail services via the Phoenix Park tunnel approach to Dublin City Centre will be assessed to ensure that the principles set out here are incorporated;
5. Standardise train stopping patterns to more accurately reflect the importance of large towns
and cities as attractions in their regions and nationally, and to develop transport hubs in the network where interchange can be facilitated for those making less popular, indirect journeys. This will make reading the network more intuitive and comprehensible by visitors and those planning less popular trips;
6. Develop direct train-paths for less popular trips between larger towns and cities outside the
GDA to avoid passengers having to interchange as often and incur long waiting times;
7. Improve the passenger environment at stations, in particular at those where interchange is planned to occur and minimise interchange times and penalties;
8. Enhance rail infrastructure to better meet operating needs of new improved services, e.g. a
targeted approach to the removal of Permanent Speed Restrictions (PSRs), on corridors where the elasticity of demand for travel with respect to speed indicates that an increase in

27
patronage is likely to accrue as a result of the investment. Further passenger quality and speed benefits will also accrue from investment in electrification of certain intercity corridors16. The benefits of providing additional passing points on single track corridors, improved junctions to allow for more train movements, and new stations in urban areas, should be examined. Provide additional infrastructure and services to widen the catchment of rail where appropriate by providing bus access links and operating facilities for buses and taxis at stations, and more car parking facilities;
9. Re-configure rolling stock to better meet the accessibility needs of the population travelling
on rail;
10. Market and promote rail travel in domestic and international markets.
11. Co-ordinated policy support. The viability of the railway as a sustainable mode cannot be guaranteed long term by just increased funding and the withdrawal of services from the least well performing sections of the network. The railway needs to be supported by a wide array of policies that facilitates the timely delivery of capacity, mode shift traffic and demand management schemes, effective integration with other modes and the concentration of development adjacent to the railway. It is particularly important in this respect that the role of public transport including the rail network is clearly acknowledged in the National Planning Framework currently under development. It is vital that the trend of dispersed spatial development is arrested in any future planning policy.
4.4 Line Speed and Infrastructure
Passenger demand and elasticity analysis indicates that improving InterCity journey time to at least 2.00 hours on the Cork route and at least 1:30 hours on the Dublin to Belfast, Galway, Limerick and Waterford routes would further strengthen rail as an option for such connections, and will bring a high level of consistency and transparency to the network. Measures to improve journey times on these routes were considered and for a relatively small investment, journey time gains can be delivered in the short term, which go some way towards achieving the targets outlined above. Longer term, given the focus of transport policy on the promotion of sustainable development, electrification of the more highly trafficked routes is a key enabler of achieving the competitive journey times outlined above.
On the IÉ network, each railway route/line is assigned a Maximum Line Speed Limit. Restrictive (i.e. less than line speed) Permanent Speed Restrictions (PSRs) are imposed for specific infrastructural and operational reasons.
A high level Technical Review of the Permanent Speed Restrictions (PSRs) on the IÉ Network has been undertaken with a view to identifying the opportunities for removing these PSRs and also for increasing line speeds beyond their current designation, with a particular focus on 100mph running. The review considers the line speed and restrictions with respect to the complexity associated with their removal, the estimated cost and a realistic timeframe that can be achieved for each.
16 Appendix 3 – Potential for Future Growth from investment in Rail Infrastructure, IÉ, May 2016.

28
It also provides details of the journey time improvements that can accrue from undertaking this work. It is then possible to quantify the increased passenger demand resulting from journey time elasticities and determine the associated potential for revenue growth.
The methodology adopted was to undertake a high level review of each main radial route so as identify potential opportunities for line speed improvements with an approximate cost and journey time saving in each case. Assumptions with regard to general track maintenance are that the AECOM funding review incorporates and includes improvements such as ballast cleaning and rail/sleeper renewals. Capital projects are identified separately.
Ultimately this provides a high level review of current restrictions on the network and establishes a time-lined and costed review of each route along with the potential journey time that can be made from eliminating the restriction.
Based on the AECOM demand model, the journey time elasticity improvement can be converted to increased passenger demand and associated growth in revenues.
The scope of the review covers the following routes: Cork, Limerick, Kerry, Belfast and Galway.
A summary by route is outlined below:
Route
Incremental Capital Cost
(€m) Time saving (mins)
Annual Revenue (€m)
Increment
Cork €5.8 14 €2.4 Limerick - 11 €1.0 Kerry - 20 €0.8 Belfast - 10 €0.4 Galway €8.6 17 €1.8
Totals €14.4
€6.4
The profile below presents an illustration for the Dublin to Cork route which clearly highlights the speed improvements relative to various initiatives;

29
In conclusion, short term journey time improvements as a result of steady state investment as per AECOM analysis, together with modest additional capital expenditure of €14.4m, generates an additional €6.4m annual revenue. This capital expenditure includes Limerick Junction platform, Portarlington (PSR) and a number of initiatives on the Galway route. The Belfast journey time improvements result from general track maintenance south of the Border and the impact of ballast cleaning in the North by NIR.
Electrification of Dublin – Cork/Belfast/Galway will deliver significant journey time savings and yield significant returns. The economic return to electrification depends on the timing of the investment. If this investment were to take place in the near future when the current fleet of InterCity carriages are all still within their useful life, the relevant costs of electrification would include the full cost of a new electric fleet (EMUs), and the investment would not be justified. However, if electrification is postponed until the current fleet is being replaced, the relevant capital cost of electrification would be limited to the cost of the civil works needed to the line. This would make electrification an attractive investment at that juncture. This strategy becomes an option from 2025.
4.5 Strategic Network Developments
In the context of emerging economic growth and the importance of the rail network for the greater Dublin area it is essential that the proposed DART expansion programme be pursued as a priority as a key element of the Government’s current capital plan. This programme, including the DART Underground ‘missing link’ connection in the city centre, is a key element of the NTA strategy for the Greater Dublin area. It is recognised as vitally important to improving local, regional and national access to the capital and to contributing to the national climate change targets through significant modal shift from the private car. The scope of the DART Underground is currently under NTA and Iarnród Éireann review to investigate the potential for optimisation and acceleration. The review is

30
scheduled for completion by mid-2017. A further delay in implementing the programme will contribute to unsustainable development patterns in the greater Dublin area in the absence of an early commitment to a network of high capacity public transport connections to the city centre and between key suburbs. The funding for Strategic Rail Investment is not considered in detail in this review.

31
5 Financial Situation
This Chapter sets out the financial position of Iarnród Éireann as follows:
Overview; Financial history 2007 to 2015; Current funding and funding requirements.
5.1 Overview
For the period 2007 to 2015 Iarnród Éireann has incurred accumulated losses of €150m despite delivering €76m in cost savings in the same period. A further €11m loss is forecasted for 2016. The accumulated losses were incurred primarily as a result of reduced exchequer funding and falling passenger numbers. Furthermore, despite the capitalisation of intercompany loans in 2009 and 2010, the solvency of the company remains a major concern due to the accumulated losses and the deterioration of shareholder funds. The company cannot incur further losses as it will become insolvent.
This unsustainable level of funding has resulted in the deterioration of the infrastructure asset, giving rise to increased safety risks and unacceptably high commercial risks to the various revenue streams. Iarnród Éireann has estimated the potential impact in financial terms of a deteriorating asset. It is estimated that each 10-minute deterioration in intercity journey times, could reduce customer satisfaction, leading to a €4.9m reduction in fare revenue.
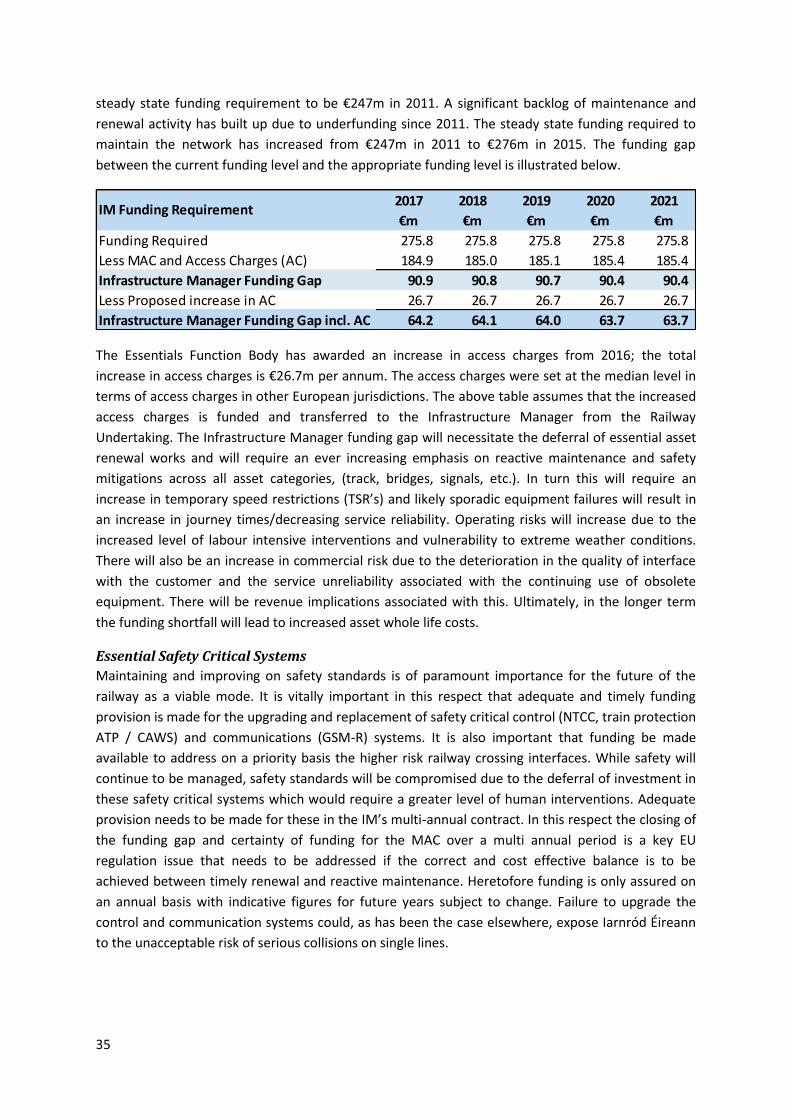
The continued underfunding of the Infrastructure Manager has resulted in a significant funding gap. The annual steady state funding required to maintain the rail network, continues to increase as a result of delayed maintenance due to a lack of appropriate funding and tender price escalations. The annual steady state funding requirement has increased from €247m in 2011 to €276m in 2016, and will continue to increase as long as the Infrastructure Manager continues to be underfunded.
Iarnród Éireann has experienced a return to growth in all business areas in 2015 including Rosslare Europort which contributes circa €3m p.a. to Iarnród Éireann’s operating result. This contribution is used to cross subsidise the activities of the rail network. The purpose of this chapter is to highlight the escalating funding gap and the detrimental impact this unsustainable level of funding is having on the company’s financial viability and solvency.
5.2 Financial History 2007 to 2015
Revenue During the period 2007 to 2015, total revenue of which passenger revenue is the largest proportion, fell from €230.9m (2007) per annum to €185.6m (2011) per annum. Total revenue has increased from 2013 onwards, with marketing activity and sales initiatives contributing significantly. The continued improvement in the macro economic climate has also been a major factor in revenue and passenger growth.

32
Public Service Obligation (PSO) Subvention and Infrastructure Management Multi Annual Contract (MAC) Funding Most rail passenger businesses in Europe are supported through PSO, and Iarnród Éireann is no exception. The PSO payments for 2015 have reduced by €96.7m (49.6%) since 2007, this has had a detrimental impact on the company’s balance sheet to the point where it is no longer possible to incur losses in the future without crystallising insolvency.
The Infrastructure Manager has not received sufficient funding to complete a programme of infrastructure maintenance and renewals in line with the required funding levels as set out in the AECOM report and to adequately provide for the IM’s obligations regarding closed and abandoned lines as set out in Appendix 3. As a result, a significant backlog of maintenance and renewal activity has built up. Consequently, the steady state funding required for maintenance of the network has increased from €247m per annum (AECOM, 2011) to €276m per annum (AECOM, 2016) due to growth in the funding gap over the last six years. This unsustainable level of funding has resulted in the ongoing deterioration of the infrastructure asset, giving rise to increased safety risks and unacceptably high commercial risks to the various revenue streams. The focus has been on reactive maintenance as opposed to timely renewals of the asset which results in higher life cycle costs. Essential signalling issues have arisen on the network with the acute issue at Cherryville junction only resolved by supplementary funding being received. Iarnród Éireann’s level of spending is below any reasonable benchmark figure, for example Iarnród Éireann’s spend is 33% below the levels allowed for in Scotland.
Passenger Journeys Passenger journeys increased by 32% from 2002 to 2007, however since then they have fallen by 19.3% (8.8m) from 45.5m in 2007 to 36.7m in 2013. The reduced journeys can be attributed to the economic downturn. Passenger journeys bottomed out in 2012/2013 and have increased year on year since then, although still 12.7% below the peak in 2007. The growth in passenger numbers is

33
likely to continue in 2016 and future years as long as the level of rail service matches demand. There are capacity issues which can only be resolved through the provision of additional fleet. The funding required to meet the additional fleet required is approximately €88mfor the period 2017 to 2021. Additional funding will be required beyond 2021 to meet the estimated total cost of €106.4m.
Expenditure Notwithstanding the increased costs from new lines opened since 2007, new rolling stock and heavy maintenance depreciation, and a carbon tax levy, the operational cost base reduced by €75.7m. Additional supplementary funding provided in 2014 and 2015 resulted in a small increased expenditure on previously deferred asset renewal works.
Shareholder Funds Despite the reduction achieved in the cost base and the capitalising of intercompany loans the combined effect of reduced revenue and PSO monies have seriously impaired shareholder funds, which at the year-end 2015 represent 22.6% of called up share capital. Critically, Iarnród Éireann can no longer incur any future losses without crystallising insolvency. This situation needs immediate remediation to avoid a financial crisis.

34
Current Funding The current level of funding is unsustainable and is the primary cause for the deterioration of the infrastructure asset. The consequence for underfunding is increased safety risks and unacceptably high commercial risks to the various revenue streams, which in turn runs the risk of the company incurring further losses and entering insolvency.
The table below illustrates the expected deterioration in key performance indicators based on the current funding levels.
The impact of the deterioration of the infrastructure asset will manifest by way of increased journey times and decreased service reliability including service cancellations and an erosion of customer confidence. Inevitably this will result in reputational damage leading to significant revenue loss and a decline in customer satisfaction. It is not inconceivable that a journey time deterioration of 10 minutes across our intercity network would occur each year due to asset failure arising from this under investment. This is summarised together with the revenue impact in the table below.
Operating risks will also increase as equipment reliability decreases, which will result in increased labour and equipment costs. As the KPI’s continue to diminish, costs will escalate and the fall in demand will accelerate. This will have a detrimental effect on the profitability of Iarnród Éireann and in a short period of time will lead to insolvency.
5.3 Appropriate Funding Levels
Providing appropriate funding levels over the next few years will bring the railway infrastructure to a steady state condition by 2030. This will place Iarnród Éireann in a strong sustainable competitive position with improvements across a wide array of KPI’s including safety, reliability, punctuality, value for money and customer satisfaction. Growth and operational risks would also reduce significantly and the company will be in a position to respond to the growth in demand for sustainable transport.
Additional Funding Requirement (Infrastructure Manager) Management, maintenance, and renewals of Railway Infrastructure are funded by the Multi Annual Contract (MAC) and by Access Charges to the TOC. AECOM were commissioned by Iarnród Éireann to identify the level of funding required to maintain the railway infrastructure. AECOM identified the
Key Performance Indicators 2016 2017 2018 2019 2020 2021Safety Index (equivalent fatalities) 8.1 8.9 9.7 10.5 11.3 11.3Service Punctuality 92.5% 91.5% 90.5% 89.0% 87.5% 86.0%Train Reliability 99.0% 98.5% 98.0% 97.5% 97.0% 96.5%Delay (minutes) 221,000 234,000 255,000 275,000 295,000 315,000 Overall Customer Satisfaction 90.0% 89.0% 88.0% 87.0% 86.0% 85.0%Service Value for Money 53.0% 52.0% 50.0% 49.0% 48.0% 47.0%
35
steady state funding requirement to be €247m in 2011. A significant backlog of maintenance and renewal activity has built up due to underfunding since 2011. The steady state funding required to maintain the network has increased from €247m in 2011 to €276m in 2015. The funding gap between the current funding level and the appropriate funding level is illustrated below.
The Essentials Function Body has awarded an increase in access charges from 2016; the total increase in access charges is €26.7m per annum. The access charges were set at the median level in terms of access charges in other European jurisdictions. The above table assumes that the increased access charges is funded and transferred to the Infrastructure Manager from the Railway Undertaking. The Infrastructure Manager funding gap will necessitate the deferral of essential asset renewal works and will require an ever increasing emphasis on reactive maintenance and safety mitigations across all asset categories, (track, bridges, signals, etc.). In turn this will require an increase in temporary speed restrictions (TSR’s) and likely sporadic equipment failures will result in an increase in journey times/decreasing service reliability. Operating risks will increase due to the increased level of labour intensive interventions and vulnerability to extreme weather conditions. There will also be an increase in commercial risk due to the deterioration in the quality of interface with the customer and the service unreliability associated with the continuing use of obsolete equipment. There will be revenue implications associated with this. Ultimately, in the longer term the funding shortfall will lead to increased asset whole life costs.
Essential Safety Critical Systems Maintaining and improving on safety standards is of paramount importance for the future of the railway as a viable mode. It is vitally important in this respect that adequate and timely funding provision is made for the upgrading and replacement of safety critical control (NTCC, train protection ATP / CAWS) and communications (GSM-R) systems. It is also important that funding be made available to address on a priority basis the higher risk railway crossing interfaces. While safety will continue to be managed, safety standards will be compromised due to the deferral of investment in these safety critical systems which would require a greater level of human interventions. Adequate provision needs to be made for these in the IM’s multi-annual contract. In this respect the closing of the funding gap and certainty of funding for the MAC over a multi annual period is a key EU regulation issue that needs to be addressed if the correct and cost effective balance is to be achieved between timely renewal and reactive maintenance. Heretofore funding is only assured on an annual basis with indicative figures for future years subject to change. Failure to upgrade the control and communication systems could, as has been the case elsewhere, expose Iarnród Éireann to the unacceptable risk of serious collisions on single lines.
2017 2018 2019 2020 2021€m €m €m €m €m
Funding Required 275.8 275.8 275.8 275.8 275.8 Less MAC and Access Charges (AC) 184.9 185.0 185.1 185.4 185.4 Infrastructure Manager Funding Gap 90.9 90.8 90.7 90.4 90.4 Less Proposed increase in AC 26.7 26.7 26.7 26.7 26.7 Infrastructure Manager Funding Gap incl. AC 64.2 64.1 64.0 63.7 63.7
IM Funding Requirement

36
Additional Funding Requirement (Train Operator) While Essential Functions Body has awarded an increase in access charges as outlined above, it has to be paid by the Railway Undertaking (Train Operator). This can be funded by either additional PSO or additional fare revenue generated by volume growth and/or increases in fares or a combination of both.
It is envisaged that the Train Operator will generate additional revenues in the long term to facilitate the increased access charges although this is dependent on an aggressive revenue growth plan. However there is a shortfall for a number of years which will have to be funded through the PSO Contract.
Passenger Revenue is projected to grow from a forecast €190.6m in 2016 to €221.2m in 2021 with passenger journeys growing from 41.4m to 46.1m over the same period. This equates to a compound annual growth rate of +3.2% which exceeds growth projections for economic indicators including domestic demand and levels of employment. Revenue growth comprises of a number of key drivers including improved macro-economic environment, fare increases (CPI), segmental marketing activity and benefits from the Customer First project from 2016.
Risk to Revenue With an unsustainable level of infrastructure investment, there is a high level of commercial risk associated with achieving the aggressive demand and revenue projections outlined above. This commercial risk arises due to significant deterioration across a number of key performance indicators identified under current funding.
Growth Volume growth in passenger journeys will require an urgent investment in fleet and services. Passenger journeys are expected to increase by 4.7m (11.4%) from 2016 to 2021. These increases in demand particularly at peak times and coupled with the proposed introduction of new services for the Phoenix Park Tunnel have resulted in the requirement to re-introduce fleet which was previously retired. The operational DART fleet has also increased by 12 vehicles to facilitate the planned increase in frequency to every 10 minutes. There are a significant number of outer Commuter and Intercity services which are currently approaching or exceeding capacity.
The potential for capacity demands to return to 2007 levels is fast becoming a reality; however the fleet currently available to meet this demand is far less than was available in 2007. The fleet requirements are outlined in the Iarnród Éireann Fleet Strategy and the level of investment (€88m out of a total cost of €106.4m) for the next 5 years is illustrated in the table below (Additional Funding).

37
Reasonable Profit Under EC Regulation 1370/2007 Iarnród Éireann are entitled to make a reasonable profit. Reasonable profit is currently estimated to be approximately €3.5m per annum by the NTA. This is not included in the funding gap.
Heavy Maintenance Iarnród Éireann have funded heavy maintenance costs of €35m per annum from own resources or through a Capital grant from the NTA, the cost of depreciation relating to heavy maintenance funded from own resources has been charged to PSO. This remains unfunded and is now included in the funding requirement for the Railway Untertaking.
Total Additional Funding Required Providing the appropriate level of funding for Iarnród Éireann will deliver a vastly improved rail network and significant improvements in service and safety KPI’s. Increased fleet capacity will enable Iarnród Éireann to provide additional services and meet additional capacity requirements, which in turn will contribute to revenue growth.
The table below adds all the funding requirements together for the Infrastructure and Railway Undertaking business within Iarnród Éireann as follows:
5.4 Fleet
The Authority has also included a funding requirement to refurbish some fleet to bring back into service and purchase new fleet to meet the expected growth in passenger demand.
5.5 Financial Overview
The company is projected to have retained losses of €161m by the end of 2016. Underfunding of the railway has resulted in spending levels running ahead of revenue for a number of years. This has been facilitated by debt through the parent company. The net result of this practice has been to weaken the balance sheet to the point where it is not possible to incur any losses in the future without risking insolvency. It is not feasible or acceptable to allow Net Assets of the company fall

38
beyond the current level; this view is shared by the Board of Iarnród Éireann. The balance sheet cannot sustain any unexpected financial shock. The table below illustrates the impact of the underfunding on shareholder funds.
The continued under funding of Iarnród Éireann and the weak balance sheet need to be addressed as a matter of urgency. Potential solutions to address these concerns are detailed in the following chapter.

39
6 Possible Funding Solutions
6.1 Introduction
The two areas of concern identified in Chapter 5 are:
1. The operational funding gap between current funding levels and appropriate funding levels for the Infrastructure Manger (€64.2m in 2017 reducing to €63.7m in 2020) and the Train Operator (€52.6m in 2018 reducing to €26.9m by 2021).
2. Iarnród Éireann’s weak balance sheet and critical solvency concerns issue. The additional funding outlined in Chapter 5 excludes the compensation for underfunding 2010 - 2016. The funding required for the restoration of shareholder funds is identified in table 6.3 and outlined in detail in section 6.4.
6.2 Existing Projected Funding Gap
As identified in the previous chapter, the projected funding gap from 2017 to 2021 is illustrated in the table below:
6.3 Potential Solutions to Resolve the Funding Gap and Solvency Concerns
There are three broad possible solutions for resolving the day to day funding gap and the more long-term under-investment in the maintenance of assets.
1. Increased exchequer grants to eliminate the funding gap and solvency concerns
This would require the Exchequer to provide all the funds to ensure solvency and adequately maintain the assets resulting in a maximum increase in funding of €116.7m in 2018 reducing to €90.6m by 2021. Compensation for losses incurred over the contract period 2010 to 2016 for the provision of transport services is required to ensure solvency which adds €41.7m for each of the years 2017, 2018 and 2019. The details are outlined in section 6.4 and illustrated below:

40
The additional funding required excludes reasonable profit. Under EC Regulation 1370/2007 Iarnród Éireann are entitled to make a reasonable profit which is currently estimated to be approximately €3.5m. Compensation for losses incurred before 2010 are excluded as they were incurred outside the term of the current transport services contract.
2. Network reduction and sufficient line closures to eliminate the funding gap
Assuming no extra Government funding is provided, the operational funding gap would have to be eliminated through large rail network reductions. This will require the closure of the majority of the rail network leaving only the following services:
DART (current underfunding based on AECOM steady state funding is €0.70 per passenger journey);
Dublin and Cork commuter services (current underfunding based on AECOM steady state funding is between €5.10 and €12.20 per passenger journey);
InterCity services from Dublin to Cork, Belfast and Limerick (current underfunding based on AECOM steady state funding is between €8.70 and €26.00 per passenger journey).
Apart from the length of time it would take to implement, such a level of network reduction and line closures would incur substantial additional costs in targeted Voluntary Severance if, indeed, such a large-scale reduction in the organisation could be achieved solely through a Voluntary Severance scheme.
3. Possible median solution to eliminate the funding gap and solvency concerns
A possible solution which integrates some line closures and additional Exchequer funding has been developed during the Rail Review to eliminate the operational funding gap.
There are a number of components to a median solution including:
Additional Government funding; Free Travel Scheme; Network reductions.
These potential measures are set out below.
Additional Government Funding The additional funding required to eliminate the funding gap and to repair the balance sheet ranges between €158.4m in 2018 and €90.6m in 2021. The additional funding requirement can be reduced by implementing the measures detailed below.
2017 2018 2019 2020 2021€m €m €m €m €m
Funding Gap 102.9 116.7 113.1 93.4 90.6Compensation for Underfunding 2010 to 2016 41.7 41.7 41.7 - - Total Additional Funding 144.6 158.4 154.8 93.4 90.6
Funding to address solvency/under-compensation in previous years:

41
Free Travel Scheme The Department of Social Protection (DSP) pays CIE in respect of the Free Travel Scheme (FTS). CIE in turn allocates this payment to the three group companies. Despite an increase in passenger journeys from 3.9m in 2009 to 4.6m in 2016 IÉ’s annual payment from the scheme has remained at €14.6m since 2009. Based on ageing population trends, it is expected that FTS passenger journeys will continue to increase to 5.1m by 2021, based on a conservative annual growth rate of 1.5%,
FTS passenger journeys now represent 11.6% of all passenger journeys, while FTS passenger revenue represents only 7.5% of total passenger revenue. It is no longer viable that Iarnród Éireann continue to subsidise free travel. Prior to the freeze of FTS funding at 2009 levels, funding was matched to general fare increases. It is now proposed that FTS funding is increased by €5.9m to reflect the increased usage of 27% since 2009 and that the relationship to general fare increases is reinstated to close the funding gap.
Network Reductions Iarnród Éireann has worked with Roland Berger to produce an analysis of 2015 revenue and expenditure performance across the rail network. For this analysis, 17 routes were identified. The analysis provides the cash per journey required to breakeven for each of the 17 routes by identifying the total cash costs less revenue divided by the passenger journeys on the route. For clarity all government subvention, capitalisation, depreciation and exceptional costs were excluded.
In addition to the actual results for 2014 and 2015, the cost per route after applying the cost to maintain the railway infrastructure to an acceptable steady state condition (per AECOM) was included.
While there was an improvement in performance for the majority of the routes in 2015 as a result of strong revenue growth and a positive contribution from cost reductions, four routes performed poorly. The four poorest performing routes were:
Following on from the overall analysis of the breakeven level of subvention required per route, the four routes/line segments were analysed further to establish the level of revenue and costs that would cease if network changes were made. The criteria adopted for selection of possible route/line segment closures included the following:
Recognising the need to maintain commuter services to support growth in the Greater Dublin Area and Cork;
Retaining the Intercity Network, i.e. Dublin to Cork, Galway, Limerick, Waterford and Belfast; Focussing on impacting the fewest number of passengers; Focussing on those passenger journeys which have the highest net costs deducting fare
revenue.
Cash Cost per Passenger Journey to Breakeven:
Actual 2014
Actual 2015
Steady State
Limerick - Ballybrophy -€417.2 -€551.9 -€761.6Limerick Junction - Waterford -€360.2 -€362.4 -€491.5Limerick - Galway -€55.0 -€44.0 -€68.1Dublin - Rosslare -€30.8 -€29.1 -€39.6

42
The routes/line segments were examined purely in financial terms and not on their potential to meet travel demands or other policy objectives in the future. The routes/line segments selected are illustrated in the map below:
These projections are an initial view of the commercial impact of network changes to these four routes/line segments. Costs which are shared with other routes are not assumed saveable nor are any central costs included in these projections. Implementation costs have also been excluded. Therefore the cost saving per passenger journey is lower than the cash cost to break even because some of the central overhead costs remain if a line is closed. The results are illustrated below:
The earliest possible date for implementation of route/line segment closures is assumed to be the beginning of 2018. Implementation costs, lost revenues and expenditure savings have been projected out to 2021 and illustrated below:

43
The funding gap will be reduced by a minimum of €16.8m should the option to close these four routes/line segments be considered. Costs which are shared with other routes are not assumed as saveable nor are any central costs included in the above projections.
Exchequer Funding Implementing the route/line segment closures and the increased FTS funding would reduce the funding gap. The details are illustrated below:
The reduction in the network proposed as a median solution only contributes a small amount to bridging the funding gap. The Ennis to Athenry section of rail line should only be considered for closure after a full review is carried out of the extension of the Western Rail corridor and when the National Planning Framework has been published. Similarly the Gorey to Rosslare line closure would impact on a large number of passengers. The Authority proposes a strategic review with Transport Infrastructure Ireland on how growth in travel demand along the M/N11 corridor can be met in the future. It is recommended that no reduction in service on this section of track be considered at this time.
However the Limerick-Ballybrophy and Limerick Junction-Waterford sections of track should be considered as part of the median strategy.
6.4 Balance Sheet
The company is projected to have retained losses of €161m by the end of 2016. Underfunding of the railway has resulted in spending levels running ahead of revenue for a number of years. This has been facilitated by debt borrowing through the parent company. The net result of this practice has been to weaken the balance sheet to the point where it is not possible to incur losses in the future without crystallising a solvency problem. It is not feasible to allow Net Assets of the company fall beyond their current level. The balance sheet cannot sustain any unexpected financial shock.

44
Restoration of Shareholder Funds The options available to repair the balance sheet include:
A new issuance of share capital. Shareholder funds as a percentage of called up share capital will continue to be significantly less than 100% due to accumulated losses.
A once off funding payment. This would represent compensation for losses which were incurred in the period 2010 to 2016, the forecasted accumulated losses for the period 2010 to 2016 are €125.1m. The current contract ends in 2019, payments to reverse the accumulated losses incurred since 2010 could be split over the next 3 years at €41.7m per annum. This would restore shareholders’ funds and resolve the solvency issues faced by Irish Rail.

45
7 Conclusions
This report is the outcome of a review process, undertaken by the NTA and IÉ, to appraise and evaluate possible solutions to Iarnród Éireann’s financial requirements under a number of funding scenarios as requested by the Department of Transport, Tourism and Sport (DTTAS, the Department). The purpose of this review is to brief key stakeholders of the critical financial challenges facing Iarnród Éireann today, secure agreement on how best to resolve and thereby to deliver a vastly improved rail network including significant improvements in service level and safety KPI’s.
The underfunding of Iarnród Éireann cannot continue indefinitely. The Infrastructure Manager has accumulated a significant backlog of maintenance and renewal activity and the steady state funding required for maintenance of the network has increased from €247m p.a. as calculated in 2011 to €276m p.a. as calculated in 2016. The Infrastructure Manager funding gap necessitates the deferral of asset renewal works and will require an ever increasing emphasis on reactive maintenance across all asset categories, (track, bridges, signals, etc.). In turn this will require an increase in temporary speed restrictions (TSR’s), and sporadic equipment failures will result in an increase in journey times/decreasing service reliability. This has significant repercussions for the profitability and viability of Iarnród Éireann.
The Train Operator cannot continue to subsidise PSO through commercial activities, and the fleet heavy maintenance costs must be funded by the Exchequer. The Train Operator is approaching full capacity on its fleet and is close to exhausting all avenues to provide additional capacity. Increased fleet capacity is required to enable Iarnród Éireann to provide additional services and to meet increased customer demand into the future. This in turn will contribute to revenue growth and an increased contribution by the railway to more sustainable development and environmental improvements.
A short window of opportunity to repair the balance sheet exists. Iarnród Éireann can be compensated for losses incurred due to underfunding since 2010. However once a new public services contract is signed in 2019, the legacy losses can no longer be funded through the public service contract. Iarnród Éireann will be restricted to reasonable profit under Regulation 1370/2007. Alternatively it would require in excess of 30 year’s reasonable profits to restore shareholder funds to a reasonable level.
The review has focussed on the financial aspects of the operation and maintenance of the rail network. However the rail network plays a key role in the economic and social life of the country. The review also predates the conclusion of the National Planning Framework and the National Mitigation Plan to address the states obligations to meet reductions in carbon emissions.
The long term sustainability of the rail network and the financial health of Iarnród Éireann will require the timely delivery of the DART expansion programme in the greater Dublin area in order to improve local, regional and national access to the capital. This major rail development should in turn be supported by a wide array of effective policies to encourage modal shift to integrated public

46
transport solutions and to concentrate development adjacent to high capacity public transport services.

47
Appendices
Appendix 1: Overview of the Rail Network – services and patronage
Appendix 2: The Role of Rail – towards a national policy
Appendix 3: Advisory note on abandoned and closed lines
Appendix 4: Meeting the capital investment requirements
Appendix 5: Fleet Strategy
Appendix 6: Route Profitability
Appendix 7: Line Segment Analysis
Appendix 8: Potential Alternative Service Provision
Appendix 9: Financial Reconciliation to Five Year Plan

Rail Review 2016APPENDICES TO REPORT
August 2016


An Overview of the Rail Network, Services and Patronage
Appendix 1 August 2016

2
Contents1.0Introduction.....................................................................................................................................3
2.0TheExistingNetworkanditsServices............................................................................................4
2.1OverviewoftheRailNetwork.....................................................................................................4
2.2DescriptionoftheNetworkandServices...................................................................................7
2.3NetworkDevelopments..............................................................................................................8
2.4PassengerRailServices................................................................................................................9
2.4RailFreight.................................................................................................................................13
3.0AnOverviewofRailPatronage.....................................................................................................14
3.1Existingpassengerdemand.......................................................................................................14
3.3RailusageinDublin...................................................................................................................17
Appendix1:TrackLengthandTrackConfiguration
Appendix2:RailStationswithlessthan100passengermovementsonRailCensusDay2015

3
1.0Introduction
ThefollowingprovidesanoverviewoftheexistingrailnetworkinIreland,theservicesthatoperate
on it and the function that it provides in meeting current travel demand. This includes a
considerationofexistingrailpatronageasindicatedbytheNationalRailCensus2015.

4
2.0TheExistingNetworkanditsServices
2.1OverviewoftheRailNetwork
The rail network in Ireland comprises approximately 2,400 km of railway track, of which
approximately 1,660 km is currently active, and includes 1471 passenger stations and 372
platforms23
.Thepopulationofallofthesettlementswitharailstationisapproximately233,80534–
representingapproximately50%ofthenationalpopulation.
Italsocomprises5,100bridges,1,240levelcrossings,over4,900cuttingsandembankmentsand14
tunnels.
Therailwayismainlysingletrack,with886kmofdoubletrackand60kmofmultipletrack.
Thenetworkincludesmainlines,Dublinsuburbanandcommuterpassengerroutes,CorkSuburban
routes, together with freight-only routes. The majority of the network is comprised of radial lines
focused on Dublin. The network largely provides for inter-urban connections providing strategic
transport links at the national level between the six key cities on the island Dublin, Cork, Galway,
Limerick,WaterfordandBelfastaswellaslinkingtosmallercitiesandlargetownswhichhavestrong
regionalfunctionsinparticularSligo,Tralee,Wexford(SeeFigure1overleaf).
Intra-urbanrail isalsoextensivewithintheDublinMetropolitanareawiththeadditionofDARTto
themainnetwork(SeeFigure2overleaf)providingthecorehighcapacitynetworkthatiscentralto
theGreaterDublinArea’smasstransitsystem.
1includingManullaJunctionwhichonlyoperatesasatransferpointforservicesto/fromBallina,
HansfieldandKishoguetheopeningofwhichispendingandMosneywhichcurrentlyhasno
service.2IrishrailNetworkStatement2015
3seeApendix1forbreakdownoftracklengthsanddepictionofnetowrkconfiguration
4POWSCAR(2011)‘Settlement’populations

5
Figure1IntercityNetwork

6
Figu
re2Dub
linNetwork

7
2.2DescriptionoftheNetworkandServicesThefollowingprovidesabriefdescriptionofthenetworkanditsexistingservices:
• The Northern line - extends from Connolly northwards to Belfast. The line provides anelectrifiedDARTservice fromMalahideandHowth,which isservedbyabranchspur fromHowthJunction,alongwithdieselcommuterservicesfromDrogheda/DundalkandintercityserviceslinkingtoBelfast.IncludingDublinConnollythereare8stationsalongthemainlineasfarastheborderwithNorthernIrelandwithDundalkandDroghedaasthemaincentresofpopulation.TheDARTserves13stationsincludingConnollyalongthiscorridor.
• TheSouth-EasternLineextendsfromDublinCityCentreasfarasRosslareEuroportprovidingforelectrifiedDARTservicesasfarasGreystonesanddieselservicesfurthersouthserving11stationsoutsideofDublincitycentre.ThemainsettlementsonthislineareWexford,GoreyandArklow.ThislineissignificantlyconstrainedsouthofBrayasitissingletrackwithlimitedpassingcapacity.
• TheMaynooth or Sligo line along operating out of Dublin Connolly provides for intercityservicestoSligowith11stationsenroute.ThemainintermediatesettlementsonthelineareMullingar and Maynooth. Diesel commuter services are also provided extending toMaynooth and Longford. A recently constructed branch spur line connects from themainlinetoHansfield,DunboyneandM3Parkway.
• The Kildare Line runs from Dublin Heuston west as far as Galway. The line provides forintercityservicestoGalway,Cork,LimerickandTraleeanddieselcommuterservicesoperatealongthislineasfarasPortlaoise.AlongtheKildarelinetoGalwaythereare12intermediatestationsandthelargestsettlementsservedareNewbridge,AthloneandTullamore.
• The Westport/Ballina line branches off the main Kildare line after Athlone. There are 6intermediate stations along the line including Manulla Junction which is a transfer pointonly.ThemainintermediatesettlementsservedareRoscommonandClaremorris.BallinaisservedbyabranchspurfromManullawhichalsoservesFoxford.
• The Waterford Line branches off the Kildare Line after Kildare serving 5 additionalintermediatestationsbeyondthispointtoWaterfordCityincludingKilkennyandCarlow.AtPortarlington theKildareLinealsobranchesand thenetworkexpandssouthwestwards toCork,LimerickandTralee.
• Portlaoiseline,Westport/BallinalineandtheGalway/LimericklineallbranchofftheKildarelineservingthevariousregionsofthecountry.ThemainPortlaoiseLineconnectstoCorkviaLimerick Junction.AfterPortlaoise thereare6 further stationson the linebefore reachingCork Kent Station. Portlaoise and Mallow are the main intermediate settlements on thisportionof the railnetwork.AfterCork thenetworkextends furtherwitha regional line toTralee. The Portlaoise line branches further at Ballybrophy into the Nenagh branch line.IncludingBallybrophythereare6stationsalongthelinebeforeitconnectswiththeGalway-LimericklinebetweenLimerickandLimerickJunction.
• The Galway–Limerick Line runs from Limerick Junction connectingwith themain Galway-Dublin lineatAthenry.Thereare8 stationsbetweenLimerick JunctionandGalwayCeanttStationincludingLimerickCityandEnnisasthekeypopulationcentres.
• LimerickJunctionisacentral interchangepoint inthenetwork– it isthefocalpointofthePortlaoiseLine(Dublin/Cork/Tralee)andtheGalway-LimerickLine,asalreadydescribedandalsooftheLimerickJunction-WaterfordLinewhichhas4intermediatestations.ThelargestintermediatesettlementservedisClonmel.
• ThefinalpieceofthenationalrailnetworkcurrentlyinoperationistheCorkSuburbanRailNetworkwhichconsistsoflinelinkingfromMallow,throughCorkCitytoMidletonandCobh,branchingatGlouthaune.Intotalthereare10stationsontheCorkSuburbanlines.

8
Figure3CorkSuburbanNetworks
2.3NetworkDevelopmentsThe rail network continues to develop and evolve. The table below highlights some of themostrecentchangestotheinfrastructureofthenetwork.
Table1NetworkChanges
NetworkChanges Year
OpeningofHansfieldStation,Co.Dublin 2013
OpeningofOranmoreStation,Co.Galway 2013
NewentrancetoPearseStation,DublinCity 2013
KildareRailProject,phase1(CherryOrchard-Hazelhatch) 2010
WesternRailProject–OpeningEnnistoAthenry 2010
OpeningofCorkCommuterRail 2009
Furtherworkremainstobedoneandpriorityissuesfortackling,inthecontextoftheGreaterDublinArea have been identified in the National Transport Authority’s ‘Integrated Implementation Plan2013-2018’.ThePlanunderlinesconstraintsonDARTandthelimitedlevelsofintegrationbetween

9
thevariousraillines,arisingfromthenatureofhistoricraildevelopmentinIreland,ascentralissues.‘Forinstance,Heustonstation,asthekeyterminalpointofseveralcommuterandIntercityservices,is remote from the Northern and South-Eastern lines and the overall DART system, requiring, atpresent,abusorLuasjourneytoachievethatconnection.’5Furtherenhancements to thenetworkareenvisagedand theobjectives setout in thePlanareasfollows:
• Develop the Phoenix Park Tunnel Link to bring commuter train services directly from theKildarelineintotheheartofDublinCityCentre;
• EliminatethecurrenttrainrestrictionsinthecitycentrethroughthecompletionoftheCityCentrere-signallingproject;
• ProtectthesafetyandreliabilityoftheGDArailwaysystemthroughinvestmentinupgradingoftraincontrolandmonitoringsystems;
• Continueinvestmentinalevelcrossingclosureprogramme;• Enhancecustomerinformationsystemsandticketingsystems;• ContinuetheupgradingandenhancementoftrainstationsintheGDA;• Continue development work on the extension of DART services north of Malahide and
westwardstoMaynooth;and• ProtectorprogressDARTUndergroundin linewiththeGovernment’sdecisiononthenext
nationalcapitalplan.The IÉFiveYearPlan (2016-2021)also includes theestablishmentofa10minute frequencyDARTserviceonweekdaysasaprincipalaim.Atanationallevel,thekeyrequirementsareasteadystatelevel of infrastructure maintenance and renewal investment, improved journey times betweenDublinandtheprovincialcitiesandelectrificationofkeyelementsofthenetworkonaphasedbasisoverthelongerterm.
2.4PassengerRailServicesVariousservicetypesoperateacrossthenationalrailnetwork,inthemaintheycanbebrokendowninto3categories–Intercity,CommuterandDART.Differentservicetypessharelines(asdescribedabove)atvariouslocationsacrossthenetworkandmanystationsareservedbyanumberofservicetypes,particularlywithintheGDA.Therangeofservicescurrentlyinoperationonthenationalnetworkisdetailedinthetablesbelow-Intercity and Commuter/DART services are set out separately. The line on which each serviceoperates is included as is the number of each service in operation on a typical weekday. Thisprovides a high-level indication of service frequency and underlines the variations in serviceprovisionwhichoccuracrossthenetworkatpresent.
5‘IntegratedImplementationPlan2013-2018’,NationalTransportAuthority(2013)

10
Themost frequent services areCommuter andDART services,which tend tobe shorter journeys.ThemostfrequentInterCityserviceisbetweenDublinandLimerick(directandindirectservices),orbetweenDublinandCork(direct).

11
Ta
ble
2In
terc
ity/I
nter
-Reg
iona
lSer
vice
s
Rout
e/Li
ne
Serv
ice
No.S
ervi
ces,
(2
dire
ctio
nal,
Wee
kday
)6 Dub
linCon
nolly-Bo
rder(N
I)
Dub
linCon
nolly-Be
lfastCentral
16
Dub
linCon
nolly-SligoMcD
iarm
ada
Dub
linCon
nolly-Sligo
14
Dub
linCon
nolly-RosslareEuropo
rt
Dub
linCon
nolly-Ro
sslare/Rosslare
Europo
rt
8Dub
linHeuston
-Po
rtarlington
-GalwayCeann
tDub
linHeuston
-Galway
18
Dub
linHeuston
-Ch
erryvilleJu
nction
–W
aterfordPlunkett
Dub
linHeuston
-Waterford
14
Dub
linHeuston
-Co
rkKent
Dub
linHeuston
–Cork/Limerick
29
Dub
linHeuston
-Po
rtarlingon–Ballybrop
hy–LimerickCo
lbert
Dub
linHeuston
-Limerick
7Dub
linHeuston
-Po
rtarlington
–Athlone–M
anullaJn
t–W
estport/Ballina
Dub
linHeuston
-Westport/Ballina
8Dub
linHeuston
-Co
rkKent–TraleeCasem
ent
Dub
linHeuston
-Tralee
2LimerickCo
lbert-G
alwayCeann
tLimerick-Galway
9LimerickCo
lbert-W
aterfordPlunkett
Limerick-Waterford
4Co
rkKent-TraleeCasement
Cork-Tralee
5
6 Asop
eratedonNationalRailCensusDay2015

12
Tabl
e3
Com
mut
er&
DAR
TSe
rvic
es
Rout
e/Li
ne
Dubl
inC
omm
uter
No.S
ervi
ces,
(2
dire
ctio
nal,
Wee
kday
)7 Dub
linHeuston
–CorkKent/GalwayCeann
tDub
inHeuston
-Po
rtlaoise
37
Dub
linHeuston
–CorkKent/GalwayCeann
tDub
linHeuston
-New
bridge
7Dub
linHeuston
–CorkKent/GalwayCeann
tDub
linHeuston
-Kildare
2Dub
linHeuston
–CorkKent/GalwayCeann
tDub
linHeuston
-Athlone
3Dub
linCon
nolly–SligoMcD
iarm
ada
Dub
linCon
nolly/Pearse-Lon
gford
4Dub
linHeuston
–Ch
erryvilleJu
nction
–W
aterfordPlunkett
Dub
linHeuston
-Carlow
3
Portarlington
–GalwayCeann
tGalway-Athlone
2Dub
linCon
nolly–SligoMcD
iarm
ada
Dub
linCon
nolly/Pearse/Bray-Mayno
oth
62
Dub
linCon
nolly-DocklandsLine
Dub
linCon
nolly/Docklands-M3Parkway
19
Clon
silla-M3Parkway
Clon
silla-M3Parkway
22
Dub
linCon
nolly–Border(NI)
Dub
linCon
nolly/Pearse/Bray-Dun
dalk
14
Dub
linCon
nolly–Border(NI)
Dub
linCon
nolly/Pearse/Bray-Drogheda
36
Dub
linCon
nolly–Border(NI)
Dub
linCon
nolly-New
ry
1
Cork
Com
mut
er
Co
rkKent-Co
bh(C
orkSubu
rban)
Cork-Co
bh
46
CorkKent-Midleton(CorkSubu
rban)
Cork-M
idleton
44
Dub
linHeuston
–CorkKent
Cork-M
allow
14
O
ther
Sub
urba
n/Co
mm
uter
LimerickCo
lbert–GalwayCeann
tLimerick-Ennis
9LimerickCo
lbert–GalwayCeann
tGalway-Enn
is
1Dub
linHeuston
–Portarlington
-GalwayCeann
tAthenry-Galway
4Ballybrop
hy–LimerickCo
lbert
Limerick-Ballybrop
hy
4Ballybrop
hy–LimerickCo
lbert
Limerick-Nenagh
1
DART
Dub
linCon
nolly/Pearse-Greystones-
Malahide/How
th
157
7 Asop
eratedonNationalRailCensusDay2015

13
2.4RailFreight
FreightterminalsatBallina,Westport,andWaterford,whichareoperatedbyIarnródÉireann,also
form part of the rail network. All are intermodal terminals handling the interchange of traffic
betweenroadandrailmodes.
InadditiontotheIarnródÉireanndepotsthereareanumberoffacilitiesowedbyothercompanies
includingfacilitiesatDublinPort,TaraMines(Navan),andBelviewPort(Waterford).Adisusedrail
linelinkingthePortofFoynestoLimerickisalsobeingconsideredforfuturedevelopment.
IarnródEireannareindiscussionswithBordnaMónaregardingpotentialfuturepartnershipsinthe
transportationofbiomass.

14
3.0AnOverviewofRailPatronage
3.1Existingpassengerdemand
2015saw totalpassenger journeyson thenational railnetworkof39.8million -a5% increaseon
2014whentotaljourneysamountedto37.8million.
Passengernumberscarriedontherailnetworkhad increasedsignificantly in theyearsup to2007
whentheypeakedat45.5mperannum.Adeclineinpassengernumbersfollowedoverthenextsix
years to 36.7m per annum (-19.3%) in 2013, as the impacts of low economic growth, high
unemployment, austerity measures and poor consumer and business sentiment were felt. That
period also coincided with the completion of the major inter-urban motorway network linking
DublinwithBelfastand the fourprovincial citiesand theupgradingof theM50motorwayaround
Dublin.
Rail passengernumbershave stabilised in recent years, thedeclinehavingbottomedout towards
theendof2013.Withimprovingeconomicindicators,growingconsumerconfidenceandmarketing
initiatives,2014 sawanearly3% increase inpassengernumbersover2013 levelsand2015 sawa
further 4.9% increase in passenger numbers to 39.7m. The largest growth was in DART, which
increasedby7.6%from15.9mto17.2m,demonstratingtheneedforplannedserviceincreases.On
commuterroutesnumbersjumpedby3.3%from11.6mto12m,withstrongestgrowthontheCork–
Middleton lineupalmost9% to340,000. InterCitygrewby2% to10.4m.Themain factorsdriving
growthin2015included:
• Thestrengtheningeconomy,• Marketingactivity,• Leapcardandotherintegrationmethods,and• Focusoneventstobringnewbusinesstotherailway• Theresultstodatefor2016indicatecontinuingstronglevels,particularlyintheGDA
Figure4AnnualRailJourneys

15
Rail usage varies significantly across the national network – the National Rail Census provides a
snapshotofthisandanoverviewofthe2015Censusisprovidedbelow.
3.2RailCensus2015–Overview
The2015NationalRailPassengerCensus,whichwasconductedon13thNovember2015,recordedboardings and alightings of passengers on every service operated at every train station in thecountry.ThiswasthefourthannualNationalRailPassengerCensusthereforefacilitatingcomparisonwith rail usage across the country in since 2012. Prior to this the Censuswas carried out for theGreaterDublinArea(GDA)only.TheRailCensus isa snapshotof railusageonasingleday.While it isgenerallyaccepted that thissurvey isbroadlyrepresentativeofatypicalweekday it is importanttorememberthat itdoesnotpresent systematic use or provide information on variations in rail usage by day of week orseasonally.Annualdataofrailusagewillgiveabalancedpictureofferthecourseofanentireyear.AnalysisoftheRailCensusshouldbeinterpretedinthiscontext.
Table4belowprovidesasummaryofthenumberof journeysonthenationalrailnetworkonRail
Census Day 2015 broken down by area of the network. Table 5 provides a comparison of 2015’s
CensusDaywiththatof2014,showinganincreaseinpatronageatallservicelevels.
Table4RailUsage2015(BoardingsandAlightingsonNationalRailCensusDay)

16
Table5:Changefrom2014to2015CensusDays
ThefollowinghighlightssomekeyoutputsfromtheCensus:
• The total patronage8 on the rail network on Census day was approximately 141,393,
involving6699railservices.
• Approximately83%ofdailyjourneyswereundertakenintheGreaterDublinArea10
• WhileDARTservicesrepresentedaround23%oftotalservicesoperatedtheyaccountedfor
approximately46%oftotalpassengerboardingsonthenetwork-thisunderlinesthefocus
ofdemandonthispartofthenetwork
• In terms of remaining services almost double the proportion of boardings took place on
ConnollyservicesasonHeustonservices
Adding thenumberofboardingsandalightingsateachstation toprovideameasurementofdaily
journeysassociatedwitheachstationprovidesan insight intothevariation instationusageacross
therailnetwork.Boardings,alightingandtotaljourneysforthehighestdemandstationsaresetout
inTable6.Table6:HighestDemandStations,CensusDay2015
8Passengersboardingservices9IncludingservicesoperatingLimerickColbert–LimerickJunctionandreturn10Dublin,Kildare,MeathandWicklow

17
Twelve stations generated in excess of 5,000 passenger journeys on Census day (See Table 5).
Connolly, Pearse, Heuston and Tara respectively generated the highest number of passenger
journeysin2015,aswasalsothecaseinpreviousyears.
Nineoutofthetenbusieststationsforboardingsandalightingsinthecountrywerelocatedinthe
GreaterDublinArea(Table6).Kentstation, inCorkcity,wastheonlystationoutsideoftheDublin
area to feature in the top ten in terms of passengermovements – Cork Kentwas the 6th busiest
stationinthecountry.
In2015,25stationsinthecountrygeneratedlessthan100journeysonCensusday(downfrom27
stationsin2013)–noneofthestationsontheNorthernline,Sligoline,CorklineorDARTlinesfell
intothiscategoryandonlyoneCorkCommuterstationwasincluded(Carrigaloe)(SeeAppendix2).A
further20stationsgeneratedbetween100and200journeys.
Of the low performing stations, 1211 generated less than 30 passengermovements. 11 of the 12
poorest performing stations were all located on the Waterford-Limerick Junction, Ballybrophy-
Limerick Junction and Limerick-Galway lines. Relative to the rest of the network these lines have
lower population catchments characterised by small-medium size settlements surrounded by
dispersed rural populations. They also exhibit rail journey times that struggle to compete with
journey times by road and have the lowest levels of services on the network. This is a similar
scenariotothatwhichappearedin2013.
Theabove indicatessignificantvariation instationusageacross thenetworkand in thevolumeof
movementsgenerated to/fromstations.The top ten stations representa significantproportionof
overalldailypatronageontherailnetworkaccountingforapproximately46%oftotalboardings in
the country and 48%of total alightings. Effectively thismeans that, on census day, just over half
(47%)ofallpassengermovementsonthenetworkoccurredatthestationslistedinTable6above.
ThisunderlinestheconcentrationofrailactivityontheDublinnetworkandalsothestrongroleof
Corkinfacilitatingrailtraveldemand.
3.3RailusageinDublinHeavyRaillostasignificantshareoftravelintoDublincitycentre,withadropof5%inmodeshare
between2007and201112,whenitreacheditslowestlevelofa12.5%modeshare.Thiswasfollowed
byaperiodofstabilisationbetween2011and2014.Morerecenttrendsshowareturntogrowth,
withtherailmodesharejumpingfrom12.9%in2014to14.8%in2015.Ifthistrendcontinues,the
modesharewillrecovertopre-recessionlevelsby2017.
ThetotalnumberofpeoplecrossingtheDublinCanalCordon in themorningpeakperiod (7:00to
10:00) increased by 4% between 2013 and 2015, from 192,188 person trips in 2013 to 199,943
person trips in 2015. The total number of people travelling by heavy rail was 29,521 in 2015 –
11CarrickonSuir,Birdhill,Ardrahan,Tipperary,Castleconnell,Cloughjordan,Craughwell,Cahir,Roscrea,Foxford,Attymon,Fota12‘ReportontrendsinmodeshareofvehiclesandpeoplecrossingtheCanalCordon2006-2015’,NTA,2016

18
representing15%of those travellingandapproximately4,552morepeople than in2013.Figure5
illustratestrendsinmodesharefortravelintoDublinCityCentre2006-2015.
Overall,theproportionofthosecrossingthecanalcordonbypublictransportincreasedby2%from
2013to2015.BusshowedaslightdecreaseinthisperiodandLuasshowedaslightincrease,whilst
rail showed the most significant increase. Despite the numbers using heavy rail increasing, the
numberofpassengersin2015wasstillover5,000lessthanthe2007peakwhenafigureof35,692
wasrecorded,equatingtoa17.5%modeshare.

19
Figure5Modeshareofpeoplecrossingthecanalcordon2006to2015
0%
10%
20%
30%
40%
50%
60%
2006 2007 2008 2009 2010 2011 2012 2013 2014 2015
%ofA
llPersonTrip
s
PersonTripsbymodecrossingtheCanalCordon0700-10002006- 2015
Bus Rail LUAS AllPublicTransport
Car Walk Cycle Taxi
Goods Motorcycles

20
Appendix1:TrackLengthandTrackConfiguration
ActiveLines TrackLengths(kms)DublinHeuston CorkKent 265.94
IslandbridgeJunction Glasnevinjunction 8.38
NorthStrandJunction DublinConnolly 0.85
LiffeyJunction DublinDocklands 5.02
CherryvilleJunction WaterfordPlunkett 124.79
Portarlington GalwayCeannt 141.65
AthloneWestJunction Westport 133.32
ManullaJunction Ballina 33.65
BallybrophyJunction KillonanJunction 73.00
LimerickCheck Athenry 96.59
LimerickJunctionDirectCurve 0.85
LimerickColbert WaterfordWest 123.98
KillarneyJunction TraleeCasement 98.72
CorkKent Cobh 18.52
Glounthaune Midleton 10.03
DublinLiffeyJunction SligoMcDiarmada 213.70
Clonsilla M3Parkway 7.24
DublinConnolly RosslareEuroport 168.16
WaterfordPlunkett Belview 6.49
DublinConnolly Border(NI) 95.92
ChurchRoadJunction EastWallJunction 0.80
HowthJunction Howth 5.63
Drogheda Navan(TaraMines) 29.02
TotalActiveLines 1662.25
OtherLines TrackLengths(Kms)Athenry Collooney 126.49
Midleton Youghal 23.42
LimerickCheck Foynes 43.15
Mullingar Athlone 44.42
TaraJunction Kingscourt 31.54
WaterfordAbbeyJunction NewRoss 21.89
Belview RosslareStrand 49.97
Tralee Fenit 14.31
Sligo SligoGoodsYard 0.80
TotalOtherLines 355.99TotalAll 2018.24

21

22
Appendix2:RailStationswithlessthan100passengermovementsonRailCensusDay2015
Clondalkin/Fonthill 90
Sixmilebridge 90
Thomastown 88
Woodlawn 83
Banteer 66
RosslareStrand 66
Farranfore 61
Carrigaloe 50
RosslareEuroport 50
Newry 49
Clonmel 40
Nenagh 34
Gort 32
Craughwell 27
Birdhill 21
Tipperary 21
Castleconnell 20
Fota 19
Cloughjordan 15
Attymon 14
Foxford 12
Ardrahan 11
Cahir 11
Roscrea 10
Carrick-on-Suir 1

The Role of Rail –towards a national rail policy
Appendix 2 August 2016

2
Contents1. TheCurrentRoleofRailinIreland_________________________________________________4
1.1Introduction _________________________________________________________________4
1.2Populationanddemandfortravel________________________________________________4
1.3InterCityTravel_______________________________________________________________5
1.4CommuterandIntra-UrbanTravel________________________________________________6
1.5NationalCommutingDemand ___________________________________________________7
1.6Commutingandthekeycities ___________________________________________________7
1.7Competitionfromothermodes_________________________________________________10
1.8Urbancongestion____________________________________________________________11
2. FutureMeasures______________________________________________________________12
2.1GuidingPrinciples____________________________________________________________12
2.2AreasforConsideration _______________________________________________________13
3. MeetingPolicyGoals __________________________________________________________15
3.1EuropeanPolicy _____________________________________________________________15
3.2NationalPolicy ______________________________________________________________15
3.3GreaterDublinAreaIntegratedImplementationPlan________________________________16
3.4Sustainabledevelopmentinurbanareas__________________________________________16
4. Economy____________________________________________________________________18
4.1GrowthandRegeneration _____________________________________________________18
4.2CompetitivenessandInvestment________________________________________________19
4.3TradeandFreight____________________________________________________________19
4.4BusinessTravel______________________________________________________________20
5. Tourism_____________________________________________________________________21
5.1General____________________________________________________________________21
5.2SpecialTouristMarkets _______________________________________________________22
5.3RailTourism–Apotentialgrowtharea___________________________________________23
6. RailandSustainability__________________________________________________________25
6.1EmissionsandAirQuality______________________________________________________25
6.2EnergyEfficiency_____________________________________________________________27
6.3ProtectionoftheNaturalEnvironment___________________________________________28
7. Socialbenefits________________________________________________________________29
7.1Accessibility_________________________________________________________________29
7.2Socialinclusion______________________________________________________________29

3
7.3Safety _____________________________________________________________________29
8. Conclusions__________________________________________________________________31

4
1. TheCurrentRoleofRailinIreland
1.1Introduction
Iarnród Éireann carries 39.8 million passenger journeys annually, accounting for 18% of the 224million passenger journeys made annually on Public Service Obligation (PSO)public transportthroughouttheState1.Thisequatesto€174.5minpassengerrevenue.Currentlyc.16mpassengersuse the DART network and c.21m passengers use the Intercity and Commuter network annually,accountingforover1500mpassengerkilometres.
Thisdemonstratestheattractionthatrailhasforaverysignificantsectionofthetravelmarketandthevolumeoftripsthatwouldbereassignedtoothermodes(predominantlyprivatecarandbus)orsuppressed intheabsenceofrail.Assuch,railhasakeyroletoplay incontributingtosustainabletravelinIrelandnowandparticularlyintothefutureastheeconomygrows.
Railalsocarriesaround1%offreighttonnekilometres.2
Thisnotepresentsahigh leveloverviewof theexisting roleof railnationally consideringnotonlytraveldemandbutalsothewiderexternalimpactsoftherailnetworkincludingeconomic,socialandenvironmental.
1.2Populationanddemandfortravel
Accordingtothe2011Census,56%ofIreland’spopulationresidesinurbanareaswithapopulationgreaterthan5,000persons.Inaddition,justunderhalfofthetotalpopulationofIrelandlivewithintheboundaryofasettlementservedbyrail3-thisrepresentsthemaindirectmarketforregularrailtravelforalltrippurposesandamountstoapproximately2.3millionpeople.38%ofthepopulationisdispersedthroughoutruralIreland.Themajorityofthedispersedruralpopulationwillhavelimitedaccesstorail,largelyachievablebyaccessmodessuchascar,busandruralhackney/taxi.
Demand for travel is also skewed regionally. More than 27% of the country’s population lives inDublinand39%liveintheGreaterDublinArea4(GDA).35%ofthejobsareinDublinand43%areintheGDA. It followsthatsome57%ofnationalemployment is locatedacross therestof theState,clusteredinregionalcitiesandlargetowns. In2015,53%ofnewjobscreatedbyIDAFDIclients inIrelandwerelocatedoutsidetheGDA,comparedto49%in2014.However,Dublinremainsthefocusofboththe intercityandcommuterrailnetworkandrailhasacritical role toplay inproviding forradialtraveldemandto/fromDublin.ThepopulationoftheGDAgrewby9%duringthe2006-2011inter-Censusperiod,andwhileDublinCity’spopulationgrewbyamoremodest4%therewasdoubledigitgrowthrecordedinareasthatareservedtosomeextentbyrail:Fingal,KildareandMeath.The1NationalTransportAuthority,PublicTransportPassengerNumbers2015(2016)2‘Investinginourtransportfuture–Astrategicframeworkforinvestmentinlandtransport’,DepartmentofTransportTourismandSport(DTTAS),20143TotalpopulationofsettlementswithrailstationsusingCSOSettlementboundarydefinitions4GreaterDublinAreacomprisesthecountiesofDublin,Meath,WicklowandKildare.

5
volumeandcharacteristicsoftraveldemandgeneratedinrelationtoDublinisuniqueincomparisonwith the rest of the country due to the size and strengths of the Dublin city region. Thesecharacteristicshavesetthecontextfortheusageoftherailnetwork.SimilarpopulationgrowthalsooccurredoutsidetheGDAinLaois,Longford,LouthandWexford,areasalsoservedbyrail.
1.3InterCityTravel
The Dublin-Cork corridor remains the most dominant InterCity corridor in the country, with asignificant level of inter-city movements, particularly by business travellers. It competes stronglywithcarfortripsbetweenthecities,accountingforapproximately50%ofnon-bustrips.Dublin-SligoandDublin-Limerickalsostrongperformers,performingrelativelyclosetotheirpotential.5Dublin-Belfast,ontheotherhand,underperformsinitsroleasanInterCityservice,withmuchofitsdemand accounted for by outer-commuting trips fromDundalk andDrogheda toDublin. The lowlevel of business travel is also notable. Dublin-Waterford also underperforms, partly due to thestoppingarrangementsatKilkenny,andpermanentspeedrestrictions.6More recent research carried out by theNTA onDublin to Cork intercity travel suggests that theimportanceofpublictransportforinter-urbantravelmayhavebeenunderestimated.Theresearchsuggests that thepublic transportmodeshare for such trips isaround50% -and thatasmuchas60%ofthisiscapturedbyrail.End-to-endtraveldemandbetweenDublinandthe5otherkeycitiesonthenetworkamountedtoapproximately5%oftotalofjourneysonthenetworkin2015.(SeeTable1)
Table1:IntercityPatronage2015(annualendtoendjourneysonIntercityServices)7
InterCity Journeys2015 %ofEndtoEndInterCity
%ofTotalJourneysontheNetwork8
Dublin/Cork 632,661 27.3% 1.6%Dublin/Belfast 182,883 7.9% 0.5%
Dublin/Limerick 292,056 12.6% 0.7%Dublin/Galway 339,917 14.6% 0.9%
Dublin/Waterford 214,561 9.2% 0.5%SubTotal 1,662,078 71.6% 4.2%
Dublin/Sligo 174,151 7.5% 0.4%Dublin/Westport 114,475 4.9% 0.3%
Dublin/Tralee 118,569 5.1% 0.3%Dublin/Ballina 44,122 1.9% 0.1%
Dublin/Wexford9 61,753 2.7% 0.2%SubTotal 513,070 22.1% 1.3%
5‘2030RailNetworkStrategyReview,FinalReport’,AECOMandIarnródÉireann,(2011)p.21962030RailNetworkStrategyReview,FinalReport’,AECOMandIarnródÉireann,(2011)p.2207IÉTicketingdata,annualpatronage(paid+DSP).ItshouldbenotedthattheabovetableexcludespatronagedatafortheBelfasttoDublinservicewasprovidedbyTranslinkinNorthernIreland.8Totaljourneysin2015amountedto39.7million(IÉ2015)9Includedasthelargesturbansettlementonthislineandintheregion

6
Limerick/LimJnt/Galway 42,198 1.8% 0.1%Limerick/LimJnt/Waterford 2,049 0.1% 0.0%
Limerick/LimJnt/Cork 67,937 2.9% 0.2%Cork/Tralee 33,833 1.5% 0.1%SubTotal 146,017 6.3% 0.4%
Total 2,321,165 100% 5.9%Thehighest intercitydemand is for travelbetweenDublinandCork, (justoveronequarterof thetotal city to citymarket) followed by Dublin-Belfast. Belfast andGalway display stronger demandfromDublinthantoDublin.LimerickandGalwayhavesimilar levelsofdemandandWaterfordthelowestshareoftheend-to-endintercitymarket.
Ofthesmallerregionalcitiesandlargetowns,SligoandWestportexhibitnotablelevelsofpatronageto/fromDublin.Themajorityoftravelisto/fromDublinwithanextremelylowproportionofoveralltraveloccurringbetweentheregionalcities(i.eLimerick-Galway).
1.4CommuterandIntra-UrbanTravel
The number of people travelling to work almost doubled between 1990 and 2008, and currentpredictionsseea35%increaseincommutertripsfrom2011levelsby2041;thisequatestoaround650,000additionaltripstoworkperdayannually.10Thecapacityoftherailwaynetworkenablesittoprovideessentialmobilityforgrowingtraveldemand.Areductionincommuterservices,oralackofdevelopment of the rail service into the future, would limit the ability to meet growing demandsustainably, leadtomorecommutingbycarandaconsequentialerosionofthe levelofserviceonthenationalandregionalroadnetworkapproachingthemaincitiesandtowns.With regard to local and commuter travel the ability of rail to grasp a significant portion of thismarket,outsideoftheDublinarea,hasbeenlimitedsignificantlybyland-usepatternsdominatedbylowtomediumdensitydevelopmentinsuburbanareas,highlydispersedruralpopulationsandthegrowth in peripheral development of services and employment not served by the railway. Incombination,thisacknowledgedfailureinspatialplanningpolicyhasnoweffectivelylocked-inacutecar dependency.11 This settlement and employment locational context, which dictates traveldemand,isdifficulttoservebypublictransport,particularlybyrail,asacriticalmassofpopulation,employment and education located close to rail stations is required. The provision of freedestinationcar-parkingataquantum isalsocentral in facilitatingcaruse in largesettlementsandfurtherlimitstheabilityofpublictransporttocompetewiththecar.TheonlyexceptiontothisisincentralDublin,whereparkingstandardsaresetoutonthebasisofcentralityandpublic transportaccessibility.These characteristics have been critical in defining the function of rail nationally, regionally andlocally. This is considered in more detail below particularly with regard to the key cities andcommutingdemandasoneofthekeygeneratorsoftraveldemand.10'Investinginourtransportfuture',DepartmentofTransport,TourismandSport,(2014)11‘AtlasofIreland2015Report’(AIRONUIMaynoothandCentreforCrossBorderStudies)(2015)

7
1.5NationalCommutingDemand
Thereareanumberofkeyfiguresthathighlightthepositionofrailinmeetingcommutingdemandat thenational level and in theGreaterDublinArea (GDA) for comparativepurposes. Theyareasfollows:
• Nationallyapproximately4%ofpeoplecommutingtoworkdosobyrailamountingtoapproximately48,400peoplein201112
• AlmostallofthisexistingraildemandassociatedwithcommutingislocatedintheGreaterDublinAreawithlessthan1,500peopleoutsideoftheGDAcommutingtoworkbyrail.(SeeTable2below)
• Theexistingrailnetworkhasastrongmass-commutingfunctionintheGreaterDublinArea.• CommutingbyrailisnegligibleoutsideoftheDublinareaincludingintotheothercities
(Limerick,Galway,Waterford,andCork)• Theabilityofbustocapturecommutertraveldemandisstrongerthanthatofrailwithbus
modeexceedingrailforworktripsatthenationallevel,insidetheGDAandoutsideoftheGDA.
Table2–National,GDA,NonGDAModeSplitWork
TraveltoWorkModeSplit(CSOPOWSCAR2011)
Bicycle BusCarDriver Walk
CarPassenger Rail Van Other Total
NationalTotal 35,233 79,583 916,857 144,992 60,311 48,399 54,608 22,7591,362,74
2NationalMode% 3 6 67 11 4 4 4 2 100
GDATotal 25,662 66,798 366,490 72,942 22,130 46,935 16,763 10,157 627,877GDAMode% 4 11 58 12 4 7 3 2 100
Non-GDATotal 9,571 12,785 550,367 72,050 38,181 1,464 37,845 12,602 734,865Non-GDAMode% 1 2 75 10 5 0 5 2 100
Thisshowsthesignificantdifferencesincommuterrailusenationallywhichisalsoreflectiveofthenetworkandserviceprovision.
1.6Commutingandthekeycities
The following describes what is considered to represent the extent of the potential demand forcommuterrailalongtheexistingnetworkintothekeycitiesandsummarisestheexistingroleofrailinrelationtocommutingfunction13.
12CentralStatisticsOffice,(CSO),POWSCAR(2011)13Summariesarebasedonananalysisofcommuterdemandintothekeycitiesfromwitha5kmradiusofeachrailstationsupplementedasappropriatebyanalysisofcommuterdemandintokeycitiesattheCSOSettlementlevel(Source,CSO,POWSCAR2011)

8
1.6.1TheDublinAreaAs noted above, the Dublin Area is unique within Ireland – population, employment, economicactivityandassociatedtraveldemandareallfarinexcessofthatevidentelsewhere.
• ThepublictransportnetworkhasacriticalroletoplayinkeepingDublinmovingandthisroleislikelytoincreaseintothefuture.
• Approximately7%ofcommutingdemandintheGreaterDublinAreaiscurrentlymetbyrail(includingLuas).
• Rail provides the core high capacity network that is central to the Greater Dublin Area’smasstransitsystem.
• Fortravel intotheDublinmetropolitanarea14fromelsewherethestrongestdemandexistsalong theeast coast of the country fromDublin to theborderwithNorthern Ireland– allsettlements on the rail network as far as Dundalk display a significant commutingrelationshipwithDublin15.
• Significant numbers commuting to Dublin are also evident as far out as Mullingar on theSligoLine,CarlowontheWaterfordline,Portarlington,ontheGalwayline,PortlaoiseontheLimerick/CorklineandGoreyontheRosslareline.TheselocationscanbeconsideredastheextentoftheDublinoutercommuterareabeyondwhichexistingcommutertraveldemandisatlevelsthatdoesnotjustifyrailcommuterservices.
• Therearesignsthatcongestiononkeyradialandorbitalroadsservingthemetropolitanareaislikelytobecomeanissueinthenearfuture.
• Demandfortravelislikelytoincreaseinfutureyears–maximisingthecapabilitiesofrailtocapturetraveldemandwillbecriticaltomanagingthisastheroadnetworkbecomesmoreconstrained.
1.6.2CommutingintoCork• Despitethepresenceofdemandfortravelandtheincreasingissueoflimitedcapacityonthe
roadnetwork, theexistingmodeshare for rail foremployment trips is low (approximately1%).
• CensusfiguressuggestthattotheeastofthecitydemandisstrongasfaroutasMidletonincludingfromCarrigtwohill,Cobh,RushbrookeandCarrigaloe–areaswherecomuterrailisprovided
• ThereisalsosignificantdemandtravelintoCorkasfarasMallow16totheNorthWest,fallingdramaticallybeyondthis.
• SimilartoDublin,the localandregionalroadsarecapacityconstrainedandcongestion isagrowingissue.
• Residentialdevelopmentatorigin isnotbasedonaccessibility to therail stations,andkeydestinations have developed up away from the rail line or are characterised in manylocations by large estates, making access to/from rail stations unattractive. Settlementsalongtheraillinehavenotbeenappropriatelydevelopedtosupportit.Thelatterisamajorissueforthecityandneedstobeaddressed.
• ThereispotentialtoincreasethismodeshareandrecentindicationsarethatpatronageontheCorksuburbannetworkisgrowing.
14AsdefinedbytheRegionalPlanningGuidelinesfortheGreaterDublinArea2010-2022,DublinRegionalandMid-EastRegionalAuthorities,(2010).TheMetropolitanAreaincludesallofDublinCityCouncil,substantialpartsofSouthDublinandDunLaoghaireRathdownandcertainEDs(ElectoralDivisions)inFingal,Kildare,MeathandWicklow.15Censusinformationdoesnotallowcrossbordercommuting(i.e.Newry-Dublin)tobequantified.16945peoplecommutingtoworkintoCorkfromwithinMallowsettlementboundary,1449fromwithina5kmradiusofMallowtrainstation,CSO,(2011)

9
1.6.3CommutingintoGalway• CommutingbyrailisalmostirrelevantfortripstoworkintoGalwayatpresentwithlessthan
1%ofworktripstakenbyrail.• Oranmoreisthemainfeedertownforthecity(1,211commutersintoGalwaycity),followed
by Athenry (597 commuters)17. Beyond Athenry demand for commuting into Galway cityfallsawayrapidly.
• The volume of people commuting into Galway from within the boundaries of thesettlementsontheGalway-Limericklinecollectivelyamountstolessthan400people18.
• The central location of Ceannt station provides a strong advantage for Intercity rail andtourism/leisuredemand
• Duetothecompetitivenessofjourneytimesbyroad,thedispersednatureofthepopulationand the location of large employment destinations dislocated from rail, the rail networkdoesnotfacilitatesignificantcommuterdemand.ThescaleanddensityofGalwayisunlikelytosupportacomprehensivecommuterrailnetworkeveninthelongterm
• The primary function of rail services along the Limerick-Galway corridor is to serve othertypesofdemand(shopping,leisure,tourism).
1.6.4CommutingintoWaterford• Along the Waterford-Dublin rail corridor there are extremely low levels of commuting
demandintoWaterfordCity(approx.38019people–fromwithin5kmofallstations)• AlongtheWaterford-Limericklineapproximately600peoplecommuteintoWaterfordfrom
within the settlements along the rail line. The most significant demand for travel intoWaterfordtoworkisfromCarrickonSuir(28820people)
• Accordingtothe2011Census28221peoplecommutedintoWaterfordbyrail.TheuseofrailfortraveltoworkintoWaterfordisnegligibleandislikelytoremainsogiventhepopulationsand scale of demand in the area. The majority of commuters originate from disperseddevelopmentinruralareas,therearenocriticalcapacityissuesontheroadnetworkandthesmall scale of the city and the dispersed low-density pattern of development limit thepotentialforcommuterrail.
1.6.5CommutingintoLimerick• Atpresentlessthan1%ofcommuterdemandismetbyrail.• TraveldemandfortripstoworkwithdestinationsinLimerickCityextendstoEnnis,including
Sixmilebridge,ontheGalway-Limerickline• Demand for travel to work into Limerick from within the settlements on the Limerick-
Ballybrophyraillineislow(approx.600peoplefromallsettlementsalongtheline).• AswithinGalway,theseparationofmajoremploymentdestinationsfromLimerickColbert
stationhasfurther limitedtheabilityofrail tomeetcommuterdemandand journeytimesbyroadareoftenquickerthanbyrail.
• As a small city, with a dispersed low-density population, it is likely to remain extremelychallengingforrailtoplayasignificantroleinLimerick.
• ThepotentialexceptiontothisisfortravelfromEnnisandsurroundsintoLimerickbyrail.
17‘Profile10DoortoDoor’,CentralStatisticsOffice(CSO),201218Approximately1500peoplecommutingintoGalwayfromwithina5kmradiusofCraughwell,GortandArdrahanrailstationscollectively.Themajorityofthesepeopleoriginateintheruralareassurroundingthesettlements19POWSCAR201120POWSCAR201121POWSCAR2011

10
1.7Competitionfromothermodes
Railmustcompeteformarketsharewithbothcarandbusintermsofcost,journeytimes,flexibilityandreliability.
Market research both at EU and national level indicates that rail scores highly across a range ofcharacteristicsincludingcomfort,qualityofservice,on-boardinformation,punctualityandreliabilityallofwhichinfluencemodechoice.Studiesofthevaluesputontraveltimeshowthatthedisutilityassociatedwithrailtravelislowbycomparisonwithothermodes.Thelowdisutilityderivesfromtheadditionalcomfortaffordedbyrailtravelandtheopportunitytobeproductive’22.
Despitethesegeneralbenefits,railinIrelandhassufferedinrecentyearsfromcompetitiononroad.MajornationalroadsimprovementsbetweenDublinandthekeycitiesarenowcompleteand,asaresultanygainsintermsofimprovedjourneytimesbycarandbusarelikelytohavepeaked.This,coupledwitha levellingoff ineconomic conditionsoffersanopportunity for rail tobecomemorecompetitive,byimprovingtherange,innovationandpriceofrailservices.
1.7.1PrivateCarBoth the car fleet and commercial vehicle fleets have roughly doubled in size compared to theirlevelsintheearly1990s.Thenetresultisthat,forexample,therewere1.06millionpeopledrivingto work in 2011 compared to 440,000 in 1991 – an increase of 140%.’23 The increase in carownershiphadtheknockonimpactofadeclineinuseofothermodes.TherelationshipbetweencarownershipandrailpassengerkilometrestravelledisillustratedinFigure1below.
Figure1Railpassengerkmvsnumberoflicencedvehicles2004-2012(index,2004=100)
Inrecentyearstherehasalsobeenadramaticreductionofapproximately40%injourneytimesbyroad between Dublin and the other core cities (Belfast, Cork, Limerick, Waterford) as a result ofroadsinvestmentprogrammesandthecompletionoftheMajorInterUrbanMotorwayprogramme.
22‘2030RailNetworkStrategyReview,FinalReport’,AECOMandIarnródÉireann,(2011)23'Investinginourtransportfuture',DepartmentofTransport,TourismandSport(2014)
Figure 2: Rail passenger km vs. number of licenced vehicles, 2004-12 [index, 2004=100]
95
100
105
110
115
120
125
130
2004 2005 2006 2007 2008 2009 2010 2011 2012
Year
Licenced vehicles
Rail passenger km

11
Thishas increasedtheattractivenessoftravelbycarandbusfor intercity journeys.Nationalroadsbetween Dublin and Cork, Galway, Limerick, Waterford and Belfast have all been significantlyimprovedandalldirectlycompetewiththeInterCityrailroutes.
Table3EstimatedCoreCityCentretoCoreCityCentreJourneyTimesbyMode(minutes)24
Origin Destination RailJT BusJT CarJTDublinHeuston Galway 150-170 160-215 139DublinHeuston Limerick 145-162 176-206 142DublinHeuston Cork 186-201 206-236 179DublinHeuston Waterford 157-172 151-161 118DublinConnolly Belfast 151-161 138-153 131
WhenestimatedendtoendjourneysareconsideredcarismorecompetitivethanrailonallroutesparticularlyfromDublintoWaterfordandtoBelfast(thelocationoftherailstationsrelativetothecitycentrescontributestothis).Giventheadditionalflexibilityprovidedwithcartravelandthefactthatcarcanprovidedoortodooraccessibilitythisislikelytomakecartravelparticularlyattractiveagainstrailfortheseroutes.
1.7.2BusBusjourneytimesappeartobesignificantlymorecompetitivethanrailontheDublintoWaterfordandDublintoBelfastrouteswhilerailcanstillachievelowerjourneytimestoCorkandLimerickandtosomeextentGalway.The attractiveness of bus for such trips has been further bolstered by the development of theprivate25busmarketwhichhasincreasedchoiceforconsumerswithanumberofoperatorsofferingintercitytraveloptions.Serviceimprovements,forexampleintheprovisionoffreeon-boardWi-Fi,competitivefares,thefrequencyofservicesacrossthedayandweek,andtherangeofdestinationsservedalsoincreasetheattractivenessoftravelbybus.
1.8Urbancongestion
Notwithstanding the current attractive journey times by bus, as population grows, along with itsrelatedeconomyactivity,journeytimesonroadnetworkswithinsuburbanandinnerurbanareasofIreland’scitieswillincreaseforroadbasedtransportcomparedtorail.
National policy to better consolidate residential and commercial developmentwill result inmanysettlement areas being created in close proximity to commuting rail lines. The penetration of railintocitycentres,particularlyinDublinandCork,willbecomeanincreasinglyimportantfactorinthechoiceofmodeofpublictransporttravelandwillensuremodesharegrowthforrail.
24Estimatesusecorecitycentrelocations(i.e.O’ConnellStreet)andincludeadditionaltimeforaccessto/fromtrainstations/busdrop-offpointsbyfastestmodetoestimateoveralljourneytime25PublicTransportRegulationAct2009
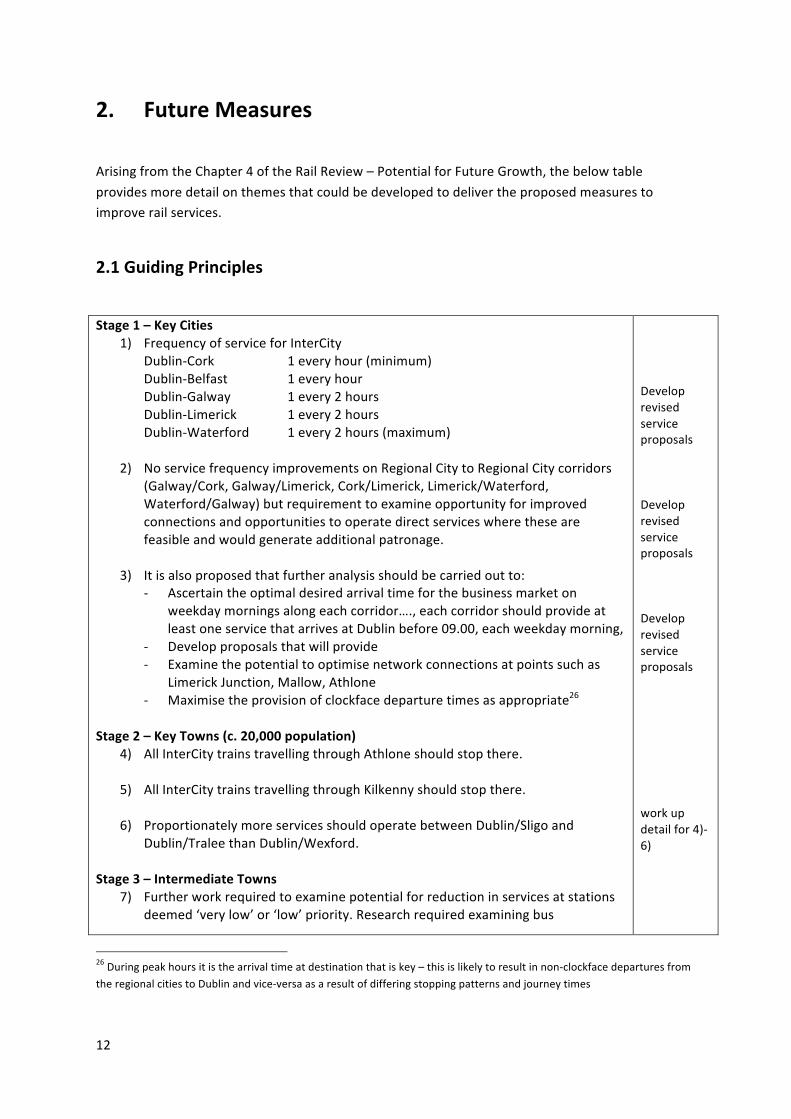
12
2. FutureMeasures
ArisingfromtheChapter4oftheRailReview–PotentialforFutureGrowth,thebelowtableprovidesmoredetailonthemesthatcouldbedevelopedtodelivertheproposedmeasurestoimproverailservices.
2.1GuidingPrinciples
Stage1–KeyCities
1) FrequencyofserviceforInterCityDublin-Cork 1everyhour(minimum)Dublin-Belfast 1everyhourDublin-Galway 1every2hoursDublin-Limerick 1every2hoursDublin-Waterford 1every2hours(maximum)
2) NoservicefrequencyimprovementsonRegionalCitytoRegionalCitycorridors(Galway/Cork,Galway/Limerick,Cork/Limerick,Limerick/Waterford,Waterford/Galway)butrequirementtoexamineopportunityforimprovedconnectionsandopportunitiestooperatedirectserviceswherethesearefeasibleandwouldgenerateadditionalpatronage.
3) Itisalsoproposedthatfurtheranalysisshouldbecarriedoutto:
- Ascertaintheoptimaldesiredarrivaltimeforthebusinessmarketonweekdaymorningsalongeachcorridor….,eachcorridorshouldprovideatleastoneservicethatarrivesatDublinbefore09.00,eachweekdaymorning,
- Developproposalsthatwillprovide- Examinethepotentialtooptimisenetworkconnectionsatpointssuchas
LimerickJunction,Mallow,Athlone- Maximisetheprovisionofclockfacedeparturetimesasappropriate26
Stage2–KeyTowns(c.20,000population)4) AllInterCitytrainstravellingthroughAthloneshouldstopthere.
5) AllInterCitytrainstravellingthroughKilkennyshouldstopthere.
6) ProportionatelymoreservicesshouldoperatebetweenDublin/Sligoand
Dublin/TraleethanDublin/Wexford.Stage3–IntermediateTowns
7) Furtherworkrequiredtoexaminepotentialforreductioninservicesatstationsdeemed‘verylow’or‘low’priority.Researchrequiredexaminingbus
DeveloprevisedserviceproposalsDeveloprevisedserviceproposalsDeveloprevisedserviceproposalsworkupdetailfor4)-6)
26Duringpeakhoursitisthearrivaltimeatdestinationthatiskey–thisislikelytoresultinnon-clockfacedeparturesfromtheregionalcitiestoDublinandvice-versaasaresultofdifferingstoppingpatternsandjourneytimes

13
alternativesto/fromtheselocationsalongexistingrailconnectionsandassesscosts/benefitsofanyproposedreduction(journeytimeimplicationsetc).Stationsareasfollows:‘VeryLow’–Attymon,Banteer,Collooney,Foxford,‘Low’Woodlawn,Clara,Ballybrophy,Farranfore,Rathmore,Rosslare,Ballymote,Dromod,Ballyhaunis,Castlerea,Cahir,Birdhill,Cloughjordan
Stage4–UrbanCommuting
8) Considerinfurtherdetailthepotentialforrailtoperformacommuterfunctionintothekeycitiesbasedonthestationparameterssetoutbelowandthetimetablecharacteristicsanysuchserviceshouldhaveinordertooperateeffectively.
- IntoDublin–fromDundalktothenorth(potentiallyNewryinNorthern
Ireland),Mullingartonorth-west,PortarlingtonandPortlaiosetothewestandCarlowandGoreytothesouth.
- Into,acrossandoutofCorkMetropolitanArea–fromMallowtotheNorthWest,fromMidletontotheeastandincludingtheCorkSuburbanstationsparticularlyCarrigtwohill,Cobh,RushbrookeandCarrigaloe
- IntoGalway–fromAthenrytotheeast- IntoLimerick–fromEnnisontheWesternRailCorridor- IntoWaterford–levelsofcommutingintoWaterfordfromsettlements
alongtherailcorridorsarenotsignificantlyhightojustifycommuterrailserviceshowever,inrelativeterms,thereissignificantlymorecommutingdemand(andoverallexistingpassengerdemand)fromLimerickintoWaterfordthanfromWaterfordtoLimerick-thisshouldbereflectedinpublictransportserviceprovision
9) AllInterCitytrainsshouldstopatthelast‘commuterstation’inacommuterbelttofacilitateinterchangeforexampleAthenry,Dundalk,Portarlington
PrincipleAgreed–furtherassessmentrequiredDeveloprevisedservicesDeveloprevisedservicesFurtherresearchforGalway,Limerick,andWaterford
2.2AreasforConsideration
a) MuchofcurrenttimetableprovidesthesameservicelevelsonSaturdayasMonday-
Friday.AnalysisisrequiredtoclarifyhowdemanddiffersonSaturday(andSunday)fromweekdaydemand.Differencemustbereflectedinfuturetimetables(Stage5ofreview)
b) TraleetoDublinservices–somearedirectwhilethemajorityrequireinterchangeat
Mallow.Whatisthejustificationforthis?ShouldallTraleeservicesinterchangeatMallow
c) RecommendallInterCitytrainsonDublin/TraleewillconnectatMallowwithDublin/Corktrains.Thismaybefeasibleiftheadverseimpactismitigatedbyadditionalbenefitsconferredbyofferingnewservices.Forexample,ifTralee–Mallow–Cork–Cobhwereofferedeveryhour,itwould:
• DissipatethespikeofloadingatMallowontoCork-Dublinservices;

14
• GenerateCobh-KillarneyandCobh–Traleeleisuretraffic• GenerateTralee/Killarney/Mallow–Fota/Cobhleisuretraffic
d) AllInterCitytrainsonDublin/Corkwilloperateasthroughservices
e) LimericktoDublinservices–somearedirectwhilemajorityrequireinterchangeatLimerickjunction.ShouldallLimerickservicesrequireinterchangeatLimerickJnt?
f) RecommendallInterCitytrainsonDublin/LimerickwillconnectatLimerickJunctionwithDublin/Corktrains

15
3. MeetingPolicyGoals
3.1EuropeanPolicy
Rail is very much at the centre of European transportation policy with regards to sustainabletransport.TheEuropeanCommission’sefforts inrelationtorailhaveconcentratedonthreemajorareas:(1)openingoftherailtransportmarkettocompetition,(2)improvingtheinteroperabilityandsafetyofnationalnetworksand(3)developingrailtransportinfrastructure.TheEuropeanCommissioninarecent‘WhitePaper’27hascommittedtomaintainingadenserailwaynetworkinallMemberStatesand,morespecifically,toconnectingallcorenetworkairportstotherail network and to achieving a 50% shift of medium distance intercity passengers and freightjourneys from road to rail by2050.Clearly, at a European level, rail is seenas an integral part ofsustainable transport networks going forward. Ireland’s ability to meet and contribute to thesetargetswouldrequireanequallystrongpolicyandprogrammeofsupportingmeasuresdefiningandbuildingupontheroleofrailnationally.CruciallyfromanEUperspectivetheCork–Dublin–Belfastrailcorridor, linkingthethreeprimaryurban centres on the island, is an important TEN-T corridorwhich is part of awiderNorth Sea –Mediterranean Corridor. The corridor aims to remove barriers to the internal market by offeringgreater modal choice, safer and less congested travel, smoother and quicker journeys whileminimisingenvironmentalimpact.
3.2NationalPolicy
Rail travel is supported in various sectors of national policy. The Government’s transport policy,‘Smarter Travel’28 requires a significant modal shift towards more sustainable forms of transport(public transport,walkingandcycling)coupledwitha renewed focuson theachievementofmorecompact settlement patterns within urban and rural areas, which in turn will complement andoptimisetheuseofinfrastructureinvestment.TheNational Spatial Strategy (NSS) has been the guiding framework for planning and investmentsince2002.Notably16ofthe20GatewaysandHubsearmarkedintheNSSforconcentratedgrowthareservedbytheInterCityrailnetwork.Thekeyhigh-levelobjectivesincludedintheNSSinrelationtorailareasfollows:
• BuildingonIreland’sradialtransportsystemofmainroadsandraillinesconnectingDublintootherregions
• Ensuringthatrailcontinuestoofferrealisticalternativestoroadtravelonthekeyinter-cityroutesand
• Increasingrailfreight
27‘Whitepaper:RoadmaptoaSingleEuropeanTransportArea-Towardsacompetitiveandresourceefficienttransportsystem’,EuropeanCommission,(2011)28‘SmarterTravel’:ASustainableTransportFuture–ANewTransportPolicyforIreland2009–2020’,DepartmentofTransport,(2009)

16
TheNSSistobereplacedbytheNationalPlanningFrameworkinthenewDáil.
3.3GreaterDublinAreaIntegratedImplementationPlan
In January 2014 the Minister for Transport, Tourism and Sport approved the National TransportAuthority’s Integrated ImplementationPlan2013-2018 for theGreaterDublinArea. Thisplan setsout actions to be taken by the Authority to ensure the effective integration of public transportinfrastructure, the effective integration of public passenger transport services and to ensure themostbeneficialandefficientuseofExchequerresources.Theneedformeaningful integrationoftransportandlanduseplanningisaddressedaspartoftheplan. In this regard, the need to match high capacity public transport with complementarydevelopmentpatterns that facilitate itsuse is seenas critical toachievingmore sustainable travelpatternsgoingforward.The prioritisation of ‘residential development located proximate to high capacity publictransport…overdevelopmentinlessaccessiblelocationsintheGDA’andthelocationoftripintensivedevelopment destinations (retail, employment etc) in areas ‘well served by existing or committedhighqualitypublictransport’areidentifiedastwoofthekeyprinciplesforoptimisingtheintegrationoftransportandland-use.The existence of the rail network, as the highest capacity element of the GDA public transportnetwork,offersstrongpotentialtoachievestrongintegrationbetweenland-useandtransportintheGDA.TheIntegratedImplementationPlanisnowunderpinnedbytheNTA’srecentlypublishedTransportStrategyfortheGreaterDublinArea2016-2035.
3.4Sustainabledevelopmentinurbanareas
Aprimaryfocusinthepolicyandplandocumentsmentionedaboveistoincreasesustainabilityandefficiencyinurbanareasthroughgreateralignmentoflanduseandtransport.Inparticular‘SmarterTravel’29underlinestheneedtoincreaseresidentialdensitiesinareasproximatetopublictransportcorridors,focusingespeciallyonthedevelopmentoflocationswithinandaroundthekeycitiesandtownsthatareservedbytherailnetwork.IntheDublinarea,anumberof largeandmediumscalesustainableresidentialdevelopmentareasonrail-basedpublictransportcorridorsweretobedelivered(Adamstown,NorthFringe,Clongriffen,Baldoyle, Pelletstown, Clonburris, Cherrywood). However, the downturn in the economy stalledtheirdelivery.
29‘SustainableResidentialDevelopmentinUrbanAreas’(DepartmentofEnvironment,CommunitiesandLocalGovernment,(2009)and‘SmarterTravel:ASustainableTransportFuture–ANewTransportPolicyforIreland2009–2020’,DepartmentofTransport

17
A joint study by the NTA and the Department of Environment, Heritage and Local Government‘PlanningandDevelopmentofLarge-Scale,RailfocusedResidentialAreasinDublin’(2013)assessedthis issue and concluded that Government policy in relation to sustainable residential densityguidelinesremainsapplicableandshouldbeappliedandsupported.‘ItisconsideredthatforDublintocontinuetogrow,improveitseconomicstatus,andfunctionaseconomicdriverforthecountry,acoordinated and integrated approach to land use and transport planning must continue to beimplemented through national policy.’ The rail network, as the focus for future residentialdevelopmentiscentraltoachievingthis.
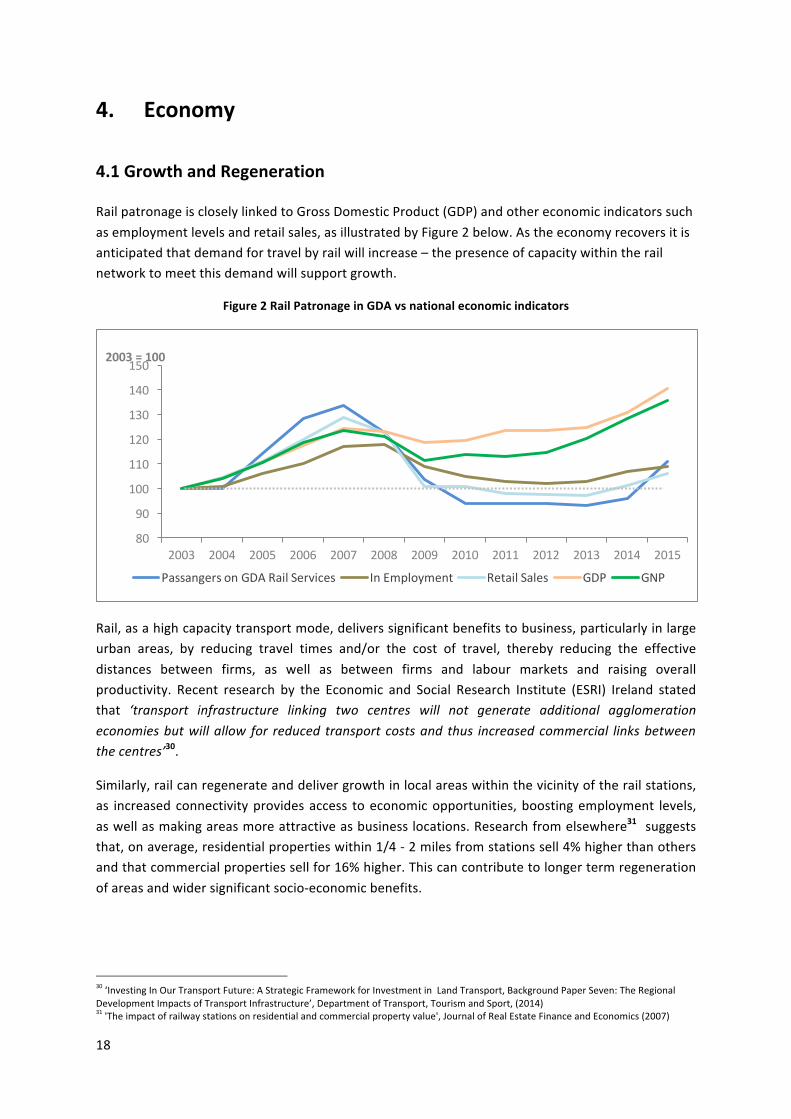
18
4. Economy
4.1GrowthandRegeneration
RailpatronageiscloselylinkedtoGrossDomesticProduct(GDP)andothereconomicindicatorssuchasemploymentlevelsandretailsales,asillustratedbyFigure2below.Astheeconomyrecoversitisanticipatedthatdemandfortravelbyrailwillincrease–thepresenceofcapacitywithintherailnetworktomeetthisdemandwillsupportgrowth.
Figure2RailPatronageinGDAvsnationaleconomicindicators
Rail,asahighcapacitytransportmode,deliverssignificantbenefitstobusiness,particularlyinlargeurban areas, by reducing travel times and/or the cost of travel, thereby reducing the effectivedistances between firms, as well as between firms and labour markets and raising overallproductivity. Recent research by the Economic and Social Research Institute (ESRI) Ireland statedthat ‘transport infrastructure linking two centres will not generate additional agglomerationeconomiesbutwillallow for reduced transportcostsand thus increasedcommercial linksbetweenthecentres’30.
Similarly,railcanregenerateanddelivergrowthinlocalareaswithinthevicinityoftherailstations,as increasedconnectivityprovidesaccess toeconomicopportunities,boostingemployment levels,aswellasmakingareasmoreattractiveasbusinesslocations.Researchfromelsewhere31 suggeststhat,onaverage,residentialpropertieswithin1/4-2milesfromstationssell4%higherthanothersandthatcommercialpropertiessellfor16%higher.Thiscancontributetolongertermregenerationofareasandwidersignificantsocio-economicbenefits.
30‘InvestingInOurTransportFuture:AStrategicFrameworkforInvestmentinLandTransport,BackgroundPaperSeven:TheRegionalDevelopmentImpactsofTransportInfrastructure’,DepartmentofTransport,TourismandSport,(2014)31'Theimpactofrailwaystationsonresidentialandcommercialpropertyvalue',JournalofRealEstateFinanceandEconomics(2007)
80
90
100
110
120
130
140
150
2003 2004 2005 2006 2007 2008 2009 2010 2011 2012 2013 2014 2015
2003=100
PassangersonGDARailServices InEmployment RetailSales GDP GNP

19
4.2CompetitivenessandInvestment
Government policy recognises the need for a modern high quality transport system to ensureIreland’s economic competitiveness and to support enterprise development.Work carried out byGoodbodyindicatesthattherailnetworkservesthevastmajorityofthecentresofeconomicactivityinthecountry32.Fast,reliablepublictransportsystems,andinparticularhighqualityconnectionsbetweentransportnodes,business,retail,residential,educationalandculturaldistrictsareincreasinglybecomingapre-requisite for attracting global investment33. The 2009 Forfás reportOur Cities: Drivers ofNationalCompetitiveness34 highlighted the need for sustained investment to improve public transportparticularlyinthekeyurbancentres.Recentstatisticsinrelationtoforeigndirectinvestment(FDI) inIrelandconfirmthatthelargercityregions are now the focal points for internationallymobile investmentwith a growing number ofinvestments attracted to the capital city and the larger population centres35. Strong inter-urbanaccess,apresentpartlycontributedtobytherailnetwork,andinternationalconnectivityarepartofwhatmakesandwillcontinuetomaketheselocationsastrongpropositionforFDI.
4.3TradeandFreight
Railfreight,particularlyforbulkygoods,couldremoveconsiderablenumbersoftrucksfromtheroadnetwork which would reduce congestion, in turn leading to environmental benefits such asreductionsinnoiseandairpollution.Roadisestimatedtobearound30%moreexpensivethanrailper tonnekm in the transportationofbiomassover100kmandaround45%moreexpensiveover200km36giventheeconomiesofscaleassociatedwithrail.Furthermore,railfreighthaslessimpacton theenvironment than road freight: rail is estimated toemit 22.8 gramsCO2per tonne kmvs.123.1gramsCO2pertonnekmforroad.37
AreportbytheCompetitionAuthorityon ‘CompetitionintheIrishPortSector’underlinedthelinkbetweenIreland’sfutureeconomicsuccess,itsabilitytotradeinternationallyasanislandnationanditsheavydependencyonitsportstodoso.Theexistenceandqualityofroadandrailinfrastructurelinkingportstofinalon-landdestinationsinfluencesportselectionandtheabilityofindividualportstocompeteandexpand.Like road infrastructure, a good rail link can strengthen the competitive position of a port,particularlywhenhandlingbulkyproductsliketimber,mineralores,liquidbulkandbiomass.Whilefreightoptionswerelimitedfordecades,therehasbeenrenewedinterestintheuseofrailfreightinthe faceofagrowingeconomy–combinedwith rising roadcongestionandhigherenvironmental
32ibid33‘ReportonProposedCapitalInvestmentProgramme2012-2016.TransportCapitalInvestmentProgramme,Appendix1’,DepartmentofTransport,TourismandSport(2011)34‘OurCities:DriversofNationalCompetitiveness’,NationalCompetitivenessCouncilandForfás,(2009)35’PolicyStatementonForeignDirectInvestmentinIreland’,DepartmentofJobs,EnterpriseandInnovation,(2014)36‘Biomass:StrategicIssuesinSupplyChainLogistics’,Limatel37TERM200327EEA31,EuropeanEnvironmentAgency,(2003)

20
concerns–andthenumberof freightservicesbeingprovidedby IarnródÉireannhasgrown.3839 InthecaseofDublin, improvements intheroadandrailnetworksuchastheDublinPortTunnelandtheadditionofarailspurhaveincreasedthecompetitivepositionofDublinPort.Also, the introduction of longer freight trains in 2016 supports the competitive positioning of railfreightversus road.Thekeystrategy for freight is toorganicallygrowthebusinessby focusingoncommerciallyviablerevenuestreams.Inthisregard,highleveldiscussionsaretakingplacebetweenIarnródÉireannandcorporate importers/exporterstofurtherdeveloptherail freightbusinessandexplorefeasiblemarketopportunities.
TheprincipleofmovingfreightbyrailsupportsexistingIrishandEuropeanrequirementsrelatingtosustainability of transport and environmental policies and aligns with the National Ports Policy,Dublin PortMaster Plan and the emerging Department of the Environment National Low CarbonRoadmap.Subjecttofeasibility,railcouldhavearoletoplayinthissectornotonlycontributingtoeconomicbenefitsbutalsoinassistingIrelandinmeetingits2020EURenewableEnergytarget.
4.4BusinessTravel
IarnródÉireanncustomerresearchindicatesthatapproximately23%oftheirintercitypassengersin2015travelledforbusinesspurposescomparedwiththepeak in2007of31%anda lowof19%in2010.Asinpreviousyears,theDublin/Corkroutehadthehighestproportionofpassengerstravellingforbusiness.Astheeconomycontinuestostabiliseandimproveitislikelythatdemandforbusinesstravelwillalsoincreaseandthereisanopportunityforrailtograspalargershareofthismarket.
The rail system also contributes to congestion alleviation which has knock on economic gains intermsoftimesaved.Atpresentatleast60percentofrailusersarecar-owning.Thismeansthattherailsystemiscontributingsignificantlytocongestionalleviation,wherethesecarownerswouldhaveotherwise travelled on congested networks. The congestion alleviation benefits of the rail systemareatpresentfocusedonlyontheenvironsofDublinwhereroadnetworksaremorecongestedandthevolumeofdemand,particularlycommutingdemand,currentlymetbyrailissignificant.Nationally, in2006,20%of total travel timeby roadwasclassifiedas 'delayed'duetocongestion,fallingto16%in2013.ThefiguresformajorroadsintheGreaterDublinAreawere24%in2006vs.20%in2013.Whiletheroadnetworksawlowerlevelsoftrafficduringtheeconomicdownturnitisexpectedtobecomemorecongestedduringtheeconomicrecovery,particularlyinandapproachingthe largest urban centres. The capacity available in the rail network, as part of the overall publictransportnetwork,makesitanimportanttoolforlimitingcongestion.As the economy continues to improve it is likely that demand for business travelwill continue togrowandthereisanopportunityforrailtocapturealargershareofthismarket.
38‘CompetitionintheIrishPortsSector’,TheCompetitionAuthority,(2013)39Thecatalystforthisrevivalinfortuneisthestrategyoftargetingtrainloadbusiness.IarnródÉireannoperatesthetrainpointtopointforacustomer,andtheonusisonthecustomertofillorsellthetrain.

21
5. Tourism
5.1General
Tourism is amajor sector of the Irish economy, amounting to a €6.6 bn industry annually40. Thisrepresentedsome2.1%ofGDP in2014(risingto9%ifwider impactsare includede.g. investmentactivity and other activity in the tourism chain)41. The sector accounts for 7.3% of nationalemployment,onaconservativeestimate.Thesectorisforecasttogrowby6%in2016relativetolastyearandthisgrowthisforecasttogenerallycontinueintheabsenceofshocks.Good public transport enhances the ability of a country, a region or a city to attract visitors, bymaking tourist destinations and attractions more accessible and by offering legible and frequentservicesduringtheinterpeak,eveningsandweekendswhenmostleisurerelatedtraveltakesplace.Nationalrailwayshaveacriticalroletoplayinthisandarerecognisedacrosstheglobeasanassetintegraltosustainingandgrowingtourismdemandanditsassociatedeconomicbenefits.The World Economic Forum Travel and Tourism Competitiveness Reports highlight the role ofgroundtransportnetworksincludingrailroadinfrastructureaspartofthepackageofcharacteristicsthat influence a country’s ability to attract foreign tourists. In 2011 the report by the forumhighlighted a disimprovement in Ireland’s ability to attract foreign tourists with Ireland’s rankingfalling from 18th in 2009 to 21st in 2011. In the 2015 Ireland’s position had stabilised at 19th.However, transport remained one of the weak areas for Ireland, with the quality of the State’sground transport network ranking 41st out of 141 countries surveyed. The quality of railroadinfrastructure was ranked more positively at 30th position – up from 42nd in 2011. A significantreduction intheabilitytotravelbyrailwouldbe likelyto impactnegativelyonhowthecountry isviewedbyinternationaltourismmarketsandonitsabilitytoattractforeigntourism.Therewereapproximately7.1millionoverseastouristvisitstoIrelandin2014,representinga13%increaseon2012,andanadditional1.7millionvisitors fromNorthern Ireland,amounting to8.8mvisitorstotheStateintotal.
• The7.1moverseasvisitorstravelledinternallywithintheStateduringtheirstay,accountingfor11.1mvisitstoregions,and11.7mvisitstocountieswithinthoseregions.Thismeansthatvisitorsfromout-of-statetravelmediumdistancesfromplacetoplacewhilstinIreland.
• Asignificantproportionofoverseasholidaymakersarrangedtheirholidayindependently.Independenttouristsareinterestedinexperiencingeverydaylifeinthecountriestheyvisit,andhaveapropensitytouseregularpublictransportwhilehere,fosteredbytheiruseofpublictransportathome.
• 56%ofoverseasholidaymakersdidnotuseacarwhilstinthecountrytherebyrelyingonsustainablemodes–publictransport,walkingandcycling–intravellingwithintheStateduringtheirstayhere.
• Intheregionof40%ofoverseastouristsvisitedtheDublinRegion.
40TourismFacts2014,FailteIreland,October2015(RevisedFebruary2016)41Travel&TourismEconomicImpact2015Ireland,WorldTravel&TourismCouncil,2015

22
• Thenationalrailnetworkhasaroleinprovidingforthistraveldemand.ResearchbyFáilteIreland(2010)estimatedthataround5%42ofallout-of-stateholidaymakersutiliseintercityrailand6%uselocalrail.
Inadditiontoout-of-statevisitorstothecountrytherewere7.4mdomestic(in-state)tripsin2014(anincreaseof5%intripson2012).
• In2014,10%ofdomestictouristsreliedonintercityrailtomaketheirtrips.• Whilecarisbyfarthemostdominantmodeusedbydomesticholidaymakersthemode
shareofintercityrailexceedsthatofintercitybusdespitesignificantimprovementsintheintercitybusofferingoverrecentyears.Thismaybeduetotheperceptionthatarailtripispartoftheoverallholidayexperience,especiallywhentravellingwithchildren.
The rail network covers many of the main centres for tourism across the country. Fáilte Irelandidentifiedprioritydevelopmentdestinationsacrossthecountry43.Thesepriorityareascumulativelyaccount for 70%of Ireland’s tourismproduct - 78%of hotel beds, 80%of attractionswith visitornumbersabove20,000and60%ofallattractions.TherailnetworkservesandlinkskeysettlementsthatareNSSGatewayswithin thesepriorityareas includingDublin,Cork,Sligo,Westport,Galway,Limerick,Tralee/KillarneyandKilkenny/Waterford.
InparticulartheDublin-Westport/BallinarouteandtheDublin-Traleeroutesshowpatronagethatisrelativelystrongwhencomparedto theircatchmentpopulations– this ismainlyasa resultof thetourismdemandonthelines44.
5.2SpecialTouristMarkets
CruiseTourismThe Port of Cork hosted 62 cruise liners in 2013, mostly at the Cobh cruise terminal, bringing inapproximately123,000passengersandcrew.Cobhisservedbyrail,withawell-locatedstationintheheartofthetown.Statisticsforthecruiseseasonshowupto28%ofcruisepassengerstookthetrainfromCobhtoCorkCityduringtheirvisit(IÉ).Theportauthorityaimtoincreasethenumberofcruiseships entering the port in coming years – onward land travel by rail is regarded as part of thepackagetodothis.TheattractivenessofrailforonwardtravelaroundtheregiontotouristsenteringatCobhwouldbeimprovedbyofferingservicestodestinationsbeyondKentStationinthecentreofCork.
ThecontinuedsupportofrailandtheabilitytoincreaseandadaptservicesisrecognisedbythePortauthorities as critical to the continuedgrowthof the cruise tourism industry. There is likely tobepotentialtofurtherenhancetherailofferingandinturngrowthtouristsuseofrailinthewiderCorkareaintheshort,mediumandlongtermthroughthedevelopmentoftouristspecificrailpackages.
MasstransitforlargepubliceventsTheincreaseinoccurrenceofeventssuchasmega-concerts,sportsfixtures,andculturaleventssuchas Tall Ships generates date- and location-specific large scale demands for transport for
42Approximately0.4millionpeople43DunlinanditsDoorstep,theSouthEast,ShannonCorridor,CorkCity,Connemara,WestCork,RingofKerry,DinglePenninsula,Donegla/Sligo44‘2030RailNetworkStrategyReview,FinalReport’,AECOMandIarnródÉireann,(2011)

23
leisure/tourism.Trainsaretheidealchoicetomovelargenumbersofpeoplesafelytoandfromsuchevents.Whilethismeansthatvenuesclosetorailstationsaretheidealchoicestohostsuchevents,it also means that improved more comprehensive rail services must be operated to meet thedemand for transport that arises, frequently outside of normal service operating hours. Goodexperienceofusingrailtospecialeventscanintroducepeopleforthefirsttimetothebenefitsofrailtravel, and encourage them to re-examine commuting habits in favour of switching to rail in thefuturefortheirregularneeds.
IarnródÉireanncurrentlyoperatesarangeoftargetedeventspecificservicesoftensupportedwithcorresponding marketing campaigns and fares/ticket offers. Additional opportunities to providespecialstoeventsacrossthenetworkshouldalsobeexaminedanddeveloped.
RailtoursRailtoursIreland,aprivatecompany,hasorganisedrail-specificvacationsforalmost350,000visitorssince 1998: approximately 22,000per year.45 Furthermore, 80%of thesepassengers are from theU.S.A.andCanada.AsvisitorsfromNorthAmericamakeup25%ofalloverseastourismrevenuesinIreland,thisrepresentsanimportantsegmentofIreland'stourismindustry.46
BelmondLtd.,aglobalcollectionofluxuryhotelandtraveladventures,planstointroducetheGrandHibernianserviceduring2016.
5.3RailTourism–Apotentialgrowtharea
Thepointsabovedemonstratetheexistingroleofrailinmeetingdemandfortourismrelatedtravel.In this context it is widely accepted that there is potential to further increase the proportion oftourismandleisurerelatedtraveldemandcapturedbyrail.
AnewlypublishedreportfromtheIrishTourismIndustryConfederationsuggeststhatthenumberofnon-car using tourists could potentially grow from 4.7m in 2016 to 5.3m in 2020.47 It states thatpublic transportusageamongvisitors is likely to increaseabove theaverage tourismgrowth rate,particularlyinthemediumtolongterm,asimprovementsthatarecurrentlyindevelopmentstagestakeeffect.Thegradualdeclineofcarownershipandusageamongcertaintourists,combinedwithanervousness aboutusing a car in anunfamiliar destinationwhereparkingmaybe constrained forothers,indicatesanincreasedpropensitytousepublictransportwhilevisitingIreland.Furthermore,the increasing integration of web-based sales platforms supports ease of travel by consumers -facilitatingmulti-modal andmulti-country travel bypublic transport. The increasinguseofmobiletechnology for both ticket sales and paperless travel also makes public transport usage moreappealingtovisitorstravellinginunfamiliarlocationsorfacinglinguisticbarriers.
Thereportrecommendsthatafull integrationofallmodesintermsofpricing,ticketing,stopsandroutesisthebestmethodofachievingthispotentialgrowth.Scheduledservicesshouldbepromotedto tourists asday-trip and shortbreakproducts,with specificbundlesdeveloped for thedifferenttourist groups (business travel, visiting friends/family, international tourists etc). A consistent
45‘RailtoursIrelandFirstClass’,RailToursIreland,(2014)46'TourismFacts2013',FailteIreland,(2014)47AReviewofPublicTransport&TourisminIreland,IrishTourismIndustryConfederationReport(2016)

24
approach intheareaof theuseofonlineandmobiletechnology for ticketing is recommended, toensurethatthepotentialofweb-basedsalesplatformsismaximised.
Initiatives togrow touristnumberson IarnródÉireann servicesarealreadyunderway include thelaunchofa touristLeapCardonsaleatDublinairportwhilepotential futuremarketdevelopmentinitiativesmayinclude:
• OutsideofDublin,Corkattractsthe largestnumberofoverseasvisitorstothecountryandthree of the top four tourist destinations in the south-west of Ireland are located in theGreater Cork area (Fota Wildlife Park (railway station at Fota), Blarney Castle (disusedrailwaystationatBlarney),theJamesonExperienceMidleton(railwaystationatMidleton)).Improvingthecoverageoftherailnetworkbyreopeningstationsorprovidingnewonesonthe network, the development of a rail tourism package and the development of railservices to facilitate a coherent offer to those visiting these attractions merits furtherconsideration,
• Recentyearshaveseenagrowthinactivetourismparticularlycyclingandthedevelopmentofthisnichemarket in Irelandinanopportunity.There isanopportunityforrailtoexploitthis market by making rail-cycle simple, particularly on services to key destinations (e.g.Westport,Ennis,Killarney,Tralee,SligoandBallina.

25
6. RailandSustainability
6.1EmissionsandAirQuality
Railwaysarewidelyrecognisedasoneofthe‘greenest’waysthereistoprovidemobilityforgoodsandpeople.
• Itisafuelefficientmethodoftransporto FuelusageandemissionsperPassenger/Tonnekilometrearelowo Electricrailwaysarecommonplaceandtheserepresentthecleanestformof
poweredtransport;emissionsrelateonlytotheenergysourceusedforgeneratingpower.
• Itiseminentlysuitedtomovingheavyfreightloadsoverland,o Itisparticularlygoodforlargetonnageandlongdistances.
• Itcanmovelargenumbersofpeopleincomfortintoandoutofcities,andbetweencities
o Itisfastandgenerallyfreefromcongestiondelays.o Travellerproductivityisenabled,asthetravellerdoesnothavetodriveandcan
workwhiletravelling(wi-fienabledetc.).• Theroadfootprintperpassengerisverylow,comparedtocartransport.
o Thisleadstolessconstructionwork.• Thevehiclesareverydurable,returningverylongservicelivesforthematerialsand
energyinvestedinthem.o Itisnotunusualtooperatevehiclesfor40years,coveringmillionsofkilometres
overtheirlifetime.• Noiseemissionsfromrailwaysarelessintrusivethanroadtransport.
o Thenoisefromroadtyresisthemostsignificantnoisepolluter.
The International Union of Railways (UIC) reports that travelling by rail is 3-10 times less CO2intensivecomparedtoroadorairtransport.During2010,theaveragerailpassengerkmin Irelandcreatedjust60gofgreenhousegases,vs.210gforroadvehicles.48Ifallrailjourneysweremadebycar it would increase greenhouse gas (GHGs) emissions by around 240,000 tonnes, equivalent to30,000households49.
Thefollowingtableshowstheprogressmadebyrailways,inthepastdecades,comparedtoalternativemeansoftransport:
48'EnergyefficiencyandspecificCO2emissions',EuropeanEnvironmentAgency(2013);'RailwayHandbook:EnergyConsumptionandCO2Emissions',InternationalEnergyAgencyandInternationalUnionofRailways,(2013),;TheWorldBank49SustainableEnergyAuthority,Ireland;CentralStatisticsOffice

26
Mode Emissions
(gCO2/passengerkm)
%agechangesince
1995/1996
Passengerrail,diesel 74 -16%
Passengerrail,electric 54 -28%
Passengerrail,overall 61 -22%
Car/Taxi 106 -08%
Domesticairservices 231 +06%
Source:ATOCUKReport
InIrelandtransportemissionshavedecreasedby20%since2007.Thedecreaseprimarilyreflectstheimpact of the economic downturn plus the changes in vehicle registration tax and road taxintroduced in mid-2008. Despite this, transport remains the second largest contributor to overallGHGemissionsinIreland(afteragriculture)responsiblefor21.8%ofthetotal.
‘Latestprojectionsindicatethatthroughfull implementationofallforeseenmitigationmeasures,asmallreductionintransportemissionsisachievableby2020’50.Thisisdependentonmaintainingandimprovingthecurrentmodeshareforsustainablemodesincludingrail.
With regard toairemissions, Irelanddidnotmeet theprescribed2010ceiling fornitrogenoxidesemissions due to sustained emissions from road transport. ‘Levels of NOX in traffic-impacted citycentreareaswillcontinuetobeaproblemduetothedifficultyinachievinglarge-scalereductionsinroad traffic numbers. This shouldbeaddressed throughpolicies to reduce car use; increaseuseofpublictransport;andreduceemissionsfromvehicles.’51Sustainingandbuildingupontheroleofrail,particularlyintheDublinmetropolitanareahasaroletoplayinthis.
For Ireland to complywith its international commitmentsonairquality andair emissions, furtherimprovementsinthetransportsectorarecritical.Centraltothisistheimplementationofpoliciestoincreasetheuseofalternativestoroadtransportforthemovementofbothpeopleandgoods.Todosoalternativesintermsofpublictransportmustbemadeavailableandmustbeattractive.IarnródÉireann’splanstofurtherimproveitsimpactontheenvironmentincludethefollowing:-
• Biodieselandenergyreductionmeasures,• Plansforexpansionofelectrification(DARTexpansionprogramme)• PotentialelectrificationofInterCityroutesinthelongerterm• Explorecommerciallyviablefreightopportunities
50‘Ireland’sEnvironment,AnAssessment’,EnvironmentalProtectionAgency,(2012)51(ibid)

27
• Promotionoffurthermodeshiftfromtheprivatecar.
6.2EnergyEfficiency
IarnródÉireannhasmadehugeinroadsintheareaofenergyefficiencyoverthepastnumberofyears,totheextentthatIÉhasalreadypassedthetargetof30%improvement,setbyGovernment,tobeachievedby2020.
IÉisachievingareductionintotalenergyconsumptionof272GWhperyear,comparedtothebaseline;thisequatesto27MillionlitresofDieseloilperyearsaved,whichrepresentsa36%reduction.
Thesereductionshavetakenplaceinthecontextofservicesbeingeitherunaffectedorslightlyimproved,asthebelowtableshows.
Quantitybaseline2006
Quantity2015 Change%
Energyused 769 GWhr 497 GWhr - 35%
Trainkilometres 18.2Mkm 18.4Mkm +1%
EnergyperTrainkilometre 4.14
MWhper100Trainkilometres
2.7
MWhper100Trainkilometres
-35%
Passengerkilometres 1,872Mkm 1,917Mkm +2%
EnergyperPassengerkilometre
4.03
MWhper10,000Passengerkilometres
2.59
MWhper10,000Passengerkilometres
-36%
Thisisanexemplarperformance,anditcontinueswithfurtherprojectstoachievemoresavings,butthelongtermgoalmustbetheelectrificationoftherailway.

28
6.3ProtectionoftheNaturalEnvironment
IarnródÉireannareintheprocessofachievingISOCertification,foralloperationswithasignificantimpactonenergyconsumption,orwiththepotentialtocausesignificantenvironmentalharm.
ThreeseparateStandardsarebeingimplemented:
- ISO9001 QualityManagementStandard- ISO14001 EnvironmentalManagementStandard- ISO50001 EnergyManagementStandard
Thesestandardsarebeingimplementedtoensuregoodpracticeinitsoperatingprocedures,sothatitcanachieveameasurableconsistencyinperformanceanddrivecontinuousimprovement.EachoftheaffectedlocationsimplementReviewWorkshopsonbothenvironmentalandenergyonaregularbasis.
Theinfrastructureandsystemsrelatingtotheenvironmentarecontinuallyupdatedandimprovedincludingfuelmanagementsystems,wastemanagementthetreatmentofbrownfieldsites.
IarnródÉireann’srailnetworktraversesadiversenetworkofnaturalhabitatsandlandscapesincludingrivers,coastalareas,peatlands,wetlands,seminaturalgrasslandsandestuaries.Therailwaynetworkcanbeanagentofgoodorharm,asitcanprovidevitalcorridorsforwildlifewithinurbanandagriculturallandscapesbutcanalsoactasavectorfortheexpansionofinvasivespeciesinfestations.
IarnródÉireannisaparticipantinseveralprogrammesdesignedtoimprovetheenvironment,orataminimum,ensurethatthereisnodeteriorationintheenvironment.Itisanactiveparticipantinseveralareas:
• The“AllIrelandPollinatorPlan”initiatedbytheNationalBiodiversityCentre;levelcrossingsitesareparticularlysuitableforbees.
• Anongoingprogrammefortheidentificationandtreatmentofinvasivespeciesofplantlifeandanimallife.
• Anongoingprogrammeforthesafeuseof(necessary)pesticidesandweedkillers.
Greatcareistakeninplanningworks,particularlyinSpecialAreasofConservation,toensurethatbiodiversityissustained,andimproved,ifsuchimprovementmakessenseintheoverallcontextoftheworksinhand.
Insummary,IarnródÉireannisoperatinginthemostsustainablepoweredlandtransportarena,andisoperatingatanexceptionallyhighlevelintermsofitsworktoreducespecificfuelconsumptionandguardtheenvironmentalassetsentrustedtoit.

29
7. Socialbenefits
7.1Accessibility
The accessibility of rail enables greater participation in the economy by those with mobility andsensory impairments. In a 2013National Disability Survey, respondents living in towns and ruralareasstatedthattheyweremorelikelytouseintercitytrainsthanintercitybuses52andreportsbythe National Disability Authority suggest that disabled users have benefitted significantly frominvestmentinnewrollingstockandstationfacilities.53
Since 2000, all new railway stations have generally been designed and constructed in accordancewith accessibility standards/best international practice. An accessibility refurbishment programmetomaketheexistingrailwaystationsaccessibleisunderwayonarailwaylinebyrailwaylinebasis.
ArecentEuropeanCommissionsurveyonsatisfactionwithrailservicesindicatedthatIreland,alongwith the United Kingdom, are the two countries in Europe that consistently have the highestsatisfactionwithaccessibility,54
7.2Socialinclusion
TheDepartmentofSocialProtectionFreeTravelSchemeenablesseniorcitizenstoplayafullroleinsociety.Betterinclusionalsobringswithitassociatedeconomicbenefits.
The wider benefits of the scheme, beyond facilitating travel, of supporting and encouragingrecipients to be active and participate in the community and providing access to services andfacilities(shopping,healthservices)arewidelyrecognised.
Around11%ofjourneysontherailnetworkeachyeararemadebypassengersundertheFreeTravelScheme.TheSchemebenefitsmore than780,000peopleeveryyear,amounting to4.6m journeysannually, and should the railways be cut back significantly there would be a requirement to findalternativemeansofenablingthesegroupstotravel.
Further benefit to the economy is derived, through supporting domestic tourism and associatedspendsinlocaleconomicsatdestinations(throughpatronageofbusinesses,restaurants,hotelsandotheramenities).Rail iscurrentlyplayingakeyrole in facilitatingthis,particularlyon lines liketheDublin-WestportandDublin-Sligo.
7.3Safety
Rail has a strong safety record, with railway accident and injury statistics much lower than mostothermodesoftransportbothinIrelandandacrosstheEU(fatalitiesperpassengerkmfortrainsare
'TransportandDisabilitybyGeographicalArea',52NationalDisabilitySurvey,(2013),53'TowardsBestPracticeinProvisionofTransportServicesforPeoplewithDisabilitiesinIreland',NationalDisabilityAuthority,(2004),54'Europeans'satisfactionwithrailservices',EuropeanCommission,(2013)

30
30 times lower than for cars across Europe). The Railway Safety Commission has reported thatIarnródÉireannisperformingaboveaverageintermsofsafetyperformance55acrossabroadrangeofsafetyKeyPerformanceIndicators(KPIs)whenbenchmarkedagainsttheEUaverage,andoverallIrelandisinthetopfivesafestEuropeancountriesforrailtravel.From2008to2011therewere917road fatalities in Irelandwith estimated total costs of EUR1.8bn-2bn, or around EUR500mp.a.56Since2008therewereonlyeightfatalitiesforrailpassengersandemployees.57Thevalueofcasualtypreventionresultingfromuseoftherailnetworkasopposedtoprivatecarisawiderbenefit.
UsageoftherailnetworklowersthenumbersofpeoplekilledorseriouslyinjuredonthetransportnetworkinIreland(relativetowhatwouldbeexpectedtohappenifthosejourneysweremadebyothermodes).
55’RailwaySafetyStatisticalReport’RailwaySafetyCommission,(2010)56‘CasualtyandAccidentValues’GoodbodyEconomicConsultantsforTheRoadSafetyAuthority–Ireland,(2002);‘AvaluationofroadaccidentsandcasualtiesinGreatBritain’,DepartmentofTransport–UK,(2011),57‘EUtransportinfigures:StatisticalPocketbook’,EuropeanCommission,(2013),

31
8. ConclusionsThis report has examined the current role of rail in the national transport network, its positionrelativetoothermodesandhowrailcontributestoachievingnationalpolicygoalsinrelationtotheenvironment, land use development, regional sustainability and economic development. Tocompletethepicturethereportalsosetsoutthechallengesthatrailfacesintermsofcompetitionfrom road-based transport, and identifies opportunities for rail to improve its share of nationaltravelgoingforward.
Envisioningtheoptimalrailnetwork,intermsofnationaltransportneedandvalueformoney,needstobeagainstthebackdropofbothitscurrentroleandtheroleitshouldserveintothefuture,giventheforecastpopulationandeconomicgrowthinIreland.
Thecurrentstrengthsoftherailnetworkinprovidingforintra-urbantraveldemandwithinIreland’slargest urban areas (Dublin and Cork) and strategic inter-urban linkages between Dublin and theotherkeycitiesandregionaltowns58ontheislandwillincreaseinimportanceasoveralldemandfortravel increaseswith economic growth. In years to come railwill be central to achieving broadernationalpolicygoals,soweneedtoinvestnowtodevelopbothinfrastructureandservicestoensureitsfuturesuccess.
Thewidersocial,environmentalandeconomicbenefitsderivedfromrailtravelcanbesummarisedasfollows:
• Rail provides the core high capacity element of the public transport network in theGreatDublinArea(GDA)-approximately7%ofexistingcommutingtoworkintheGDAisbyrail.Without rail, this trafficwould reassign toother road-basedmodes (car/bus)whichwouldincrease traffic congestion and erode the useful life of the national and regional roadnetwork approaching the capital. . Demand for travel within the Greater Dublin Area ispredicted to increase further in futureyears–maximising the roleof railwillbecritical inmanagingthissustainablyastheroadnetworkbecomesmoreconstrained.Railprovidesanirreplaceableroleinprovidinghighvolumecommutertransport intheGreaterDublinAreaserving locations up to 80km from the city centre with high frequency services ofapproximatelyonehourtraveltime,andinprovidingamasstransitlinethroughtheheartofthecitywithDART.
• Inter-urban rail, as a high capacity transport mode, delivers significant businessagglomerationbenefitsbyreducingtraveltimesand/orthecostoftravel,therebyreducingthe effective distances between firms, as well as between firms and labour markets andraisingoverallproductivity.Betweenurbancentresitallowsforreducedtransportcostsandthus increases commercial links between the centres. Multiple options for travel help tosupporteconomicactivityandencourage investment.The largercityregions in Irelandarenow the focal points for internationally mobile investment with a growing number ofinvestments attracted to the capital city and the largerpopulation centres59. Strong inter-urbanaccess,atpresentcontributedtoby therailnetwork,and internationalconnectivityarepartofwhathassecuredthis investmentandpartofwhatwillcontinuetosecureandmaintain investment into the future. Reducing the strategic transport network is likely to
58Belfast,Cork,Galway,Limerick,Waterford,Sligo,Tralee/Killarney,Westport59‘PolicyStatementonForeignDirectInvestmentinIreland’,DepartmentofJobs,EnterpriseandInnovation,(2014)

32
have a negative impact on the attractiveness of Ireland’s larger city regions for foreigninvestors.
• Aprimaryfocusacrossnationalpolicydocumentsinthevarioussectorsmentionedaboveisto increase sustainability andefficiency throughmoreeffective alignmentof landuse andtransportandmodalshifttowardsmoresustainableformsoftransport.Focusingespeciallyonthedevelopmentoflocationswithinandaroundthekeycitiesandtownsthatareservedbytherailnetworkiscentraltoachievingtheseaims.
• RailcurrentlyhasasignificantmarketshareofinterurbantravelassociatedwithDublinandwhilethiswassubjecttodeclinefrom2007onwards,due largelyto increasedcompetitionfor car andbus travel, this has now stabilised and is beginning to grow -maintaining thismode share is critical to preventing future shift to private car for such journeys and tokeeping Ireland’s road networkmoving, particularly in the Dublin area, now and into thefutureandasdemandincreases.
• Thenationalrailnetworkalsoplaysakeyroleinsustainingandgrowingtourism.TourismisakeysectorintheIrisheconomy.Approximately11%ofdomestictouristsand5%ofout-of-statetouriststravelled intercityonrail in2014.Touristsvisitingthemajorcitiesandtownsalso generally use public transport to travel, including by rail. Rail also provides highcapacity transport links for high volume tourism and leisure demand created by specialevents and is regarded as a key part of the package to support and increase theattractivenessofthePortofCorktothecruiseindustry.Asignificantreductionintheabilityto travel by rail would be likely to impact negatively on how the country is viewed byinternationaltourismmarketsandhowstrongly itcancompetewithotherdestinationsfortouristtravel.
• Ireland’s targets in relation to emissions reductions are already proving challenging andtransportisoneofthekeysectorsinwhichsubstantialimprovementsarerequired.Partofthenecessarypackageoftransportactionsismaintainingandincreasingthemodeshareofwalking,cyclingandpublictransport.During2010,theaveragerailpassengerkminIrelandcreatedjust60gofgreenhousegases,vs.210gforroadvehicles.60Ifallrail journeysweremadebycaritwouldincreasegreenhousegas(GHGs)emissionsbyaround240,000tonnes,equivalentto30,000households. Sustainingandbuildingupontheroleofrail inprovidingfor traveldemandwill supportnationalefforts to reachemissions targets. IarnródÉireannhasalreadypassedthetargetof30%improvement,setbyGovernment,tobeachievedby2020. Since 2006 energy consumption has reduced by 35% whilst services have beenmaintainedandinsomecasesenhanced.
• As part of the overall public transport network rail supports social inclusion and socialmobilitybyprovidingaccesstoservices,communitiesandjobsforthosevulnerabletosocialexclusion including older people and people with disabilities. High levels of accessibilityacrosstherailnetworkfacilitateandsupportuniversalaccess.Furthermore,eachyearmorethan 780,000 people benefit from rail travel through the Social Protection Free TravelScheme,amountingto4.6mjourneysannually.Shouldtherailwaysbecutbacksignificantlytherewouldbearequirementtofindalternativemeansofenablingthesegroupstotravel.
60'EnergyefficiencyandspecificCO2emissions',EuropeanEnvironmentAgency,(2013),;InternationalEnergyAgencyandInternationalUnionofRailways(2013),'RailwayHandbook:EnergyConsumptionandCO2Emissions';TheWorldBank

33
The rail network contributes not only to meeting transport demands but also to broader social,environmentalandeconomicneedsandobjectives,allofwhichmustbetakenintoconsiderationinplanningforthefutureofthenetwork.


Advisory Note on Abandoned & Closed Rail Lines
Appendix 3 August 2016

2
Contents
1 Introduction...........................................................................................................................................3
2 DefinitionofClosedandAbandonedLines............................................................................................3
3 MaintenanceofClosedandAbandonedLines.......................................................................................3
4 Conclusion..............................................................................................................................................4

3
1 IntroductionThisadvisorynotesetsoutabriefoverviewoftheresponsibilitiesthatcontinuetobeheldbyIarnródÉireann(IE)formaintainingofAbandoned&ClosedRailLinesandforwhichnofundingiscurrentlyprovided.
2 DefinitionofClosedandAbandonedLinesAclosedlineisoneinwhichtheCIÉ/IÉBoardisrelievedofitsobligationtooperatetrains,butallotherstatutorydutiesremain,includingmaintenanceofaccommodationworks,drains,fences,bridgeslevelcrossingsetc.Anabandonedlineisonewhich,undersection21ofthe1950TransportAct,anabandonmentorderhasbeenmadebytheBoard.
Thereare10ClosedLinesonthenetworkwith387bridges.
Therearesome80AbandonedLineswith1107bridgesinvaryingformsservingdifferingpurposesthroughouttheNetwork.Thereareanumberoftheselineswheretheactualownershiphasnotbeenfullyascertained.
ClosedandAbandonedlinesrepresentasignificantriskandresponsibilitytoCIÉ.
3 MaintenanceofClosedandAbandonedLinesOneofthemajorconcernsaroundclosedandabandonedlinesisthoseassets,inparticularbridges,wherethereisathirdpartyinterface.Thereare387bridgeson10closedlineswhereresponsibilitiesforthesestructuresremainwithIÉ.Structuralinspectionsonclosedlinesarethereforeundertakeninaccordancewiththetechnicalstandardsonarisk-prioritisedbasiswithspecialconsiderationforstructureswithpublic/thirdpartyinterfaces.
Aswithallassets,thereisabasicrequirementforthemaintenanceoftheseassetstoensuretheirfunctionalityandsafety.Nofundingiscurrentlyprovidedforassetsonanyclosedlinesoranyassociatedworks.Workrequirementscommonlyarisesuchasforboundaryprotectionorbridgerepairandthesearecarriedoutastheissuesarise.
Withregardtoabandonedlines,representationsfromLocalAuthoritiesandothersarebecomingmorefrequentwhererequestsarebeingmadetocarryoutworkstotheseassets.Forexample,followingrecentrepresentationsbytheLocalAuthority,IÉhavehadtoundertakerepairstoalocalroadbridgewherethereisnofunctioningrailwayatGraigueinCo.Tipperary.Thebridgeposedasafetyrisktoroadusers,includingarecentaccidentwhereaschoolbuswasinvolvedinacollisionatthisbridge.
The80abandonedlineshaveanestimated1107bridgesonthem.Aswithclosedlines,nofundinghasbeenprovidedfortheinspection,maintenanceorgeneralupkeepoftheseassets.

4
Theestimatedfundingrequirementformaintainingtheseclosedandabandonedlinesis€3mperyear.
4 ConclusionSection21ofthe1950TransportActsetsoutthemechanismforabandoningarailwayline.Closureofthelineisapre-requisite.WhereanAbandonmentOrderismadethereisaprocedurebywhichtheBoardmayrelieveitselfofitsstatutorydutiesbytheserviceofnoticesandthepaymentofcompensation.
IarnródÉireannproposesthattheDTTaSfacilitatesthetransferofallbridgesonabandonedlinestotherelevantLocalAuthority(LA)andtheabandonmentofallclosedlines.Thisproposalwillreducetheestimatedfundingrequirementformaintainingclosedandabandonedlinesby€3mperyear.

5
ListofAbandonedorClosedLines
Abandoned Lines
Nr Section Mileage Length Miles
Length Km's
1 Sallins-Tullow 0-34.75 34.75 31.38
2 Bagnalstown-PallasEast 66-90 24.0 38.62
3 Clara-Banagher 0-18.75 18.75 30.18
4 Portlaoise-Kilkenny 0-28.25 28.25 45.46
5 Birdhill-Killaloe 0-4 4.0 6.44
6 Banteer-Newmarket 0-9 9.0 14.48
7 Headford-Kenmare 0-22 22.0 35.41
8 Gortatlea-Castleisland 0-4.25 4.25 6.84
9 Mallow-Waterford 0-75.5 75.5 121.51
10 Fermoy-Mitchelstown 0-12 12.0 19.31
11 Portlaoise-Mountmellick 0-7.5 7.5 12.07
12 CastlecomberJct-Deerpark 0-9.5 9.5 15.29
13 Roscrea-Birr 0-11.75 11.75 18.91
14 CharlevilleJct-Patrickswell 0-17.5 17.5 28.16
15 Farranfore-ValentiaHb 0-39.25 39.25 63.17
16 Thurles-Clonmel 0-25.75 25.75 41.44
17 GooldsCross-Cashel 0-5.75 5.75 9.25
18 BridesGlen-Shanganagh 8.25-12 3.75 6.04
19 Woodenbridge-Shillelagh 44.75-61.5 16.75 26.96
20 MacmineJct-NewRoss 83.25-102 18.75 30.18
21 Broadstone-LiffeyJct 0-1.5 1.5 2.41
22 Streamstown-Clara 61.75-69.5 7.75 12.47

6
23 Enfield-Edenderry 27.75-37.25
9.5 15.29
24 InnyJct-Cavan 61-85.75 24.75 39.83
25 Galway-Clifden 126.75-174.5
47.75 76.85
26 Attymon-Loughrea 107.25-116.25
9.0 14.48
27 Kilfree-Ballaghadereen 112.5-122 9.5 15.29
28 Claremorris-Ballinrobe 135-147.5 12.5 20.12
29 Westport-WestportQuay 161.25-163
1.75 2.82
30 Ballina-Killala 166.5-174.25
7.75 12.47
31 Dunboyne-Navan 10.5-30.5 20.0 32.19
32 Kilmessan-Athboy 24.25-36.5 12.25 19.71
33 Westport-Achill 160.75-187.5
26.75 43.05
34 Dundalk-Derry-bordernearClones 0-41 41.0 65.98
35 BorderPorthall-BorderStJohnson 109-114 8.25 13.28
36 Dromin-Ardee 0-5 5.0 8.05
37 Portadown(BorderGlaslough)-Cavan 21-54.75 33.75 54.32
38 Armagh(BorderKanesRock)-Castleblaney 14-18.25 4.25 6.84
39 Inniskeen-Carrickmacross 0-6.5 6.5 10.46
40 Navan-Oldcastle 18-39.5 21.5 34.60
41 BundoranJct-Bundoran Below 0.00
42 BorderPettigo-BorderLetter 15-17 2.0 3.22
43 BorderBelleek-Bundoran 27.75-35.25
7.5 12.07
44 Sutton-Howth 0-5.25 5.25 8.45

7
45 Ballyhaise-Belturbet 0-4.25 4.25 6.84
46 ShantonaghJct-Cootehill 0-7.5 7.5 12.07
47 Cork-Coachford 0-15.5 15.5 24.94
48 Coachford-Donoughmore 6.25-15.75 9.5 15.29
49 St.Annes-Blarney 7.25-8.5 1.25 2.01
50 Cork-Baltimore 0-62 62.0 99.78
51 KinsaleJct-Kinsale 0-11 11.0 17.70
52 ClonakiltyJct-Clonakilty 24-33 9.0 14.48
53 Drimoleague-Bantry 45.5-58.75 13.25 21.32
54 CorkCityRailways 0/25-0.75 0.5 0.80
55 Ballinascorthy-Courtmacsherry 0-9 9.0 14.48
56 Listowel-Ballybunion 0-9.25 9.25 14.89
57 BorderStrabane-Killybegs 2-50.75 48.8 78.46
58 Stranorlar-Glenties 0-24 24 38.62
59 Donegal-Ballyshannon 31.5-47 15.5 24.94
60 BorderStrabane-Letterkenny 1-19.25 18.25 29.37
61 Belturbet-Dromod 33.75-0 33.75 54.32
62 Ballinamore-Arigna 0-18.75 18.75 30.18
63 Cork-Crosshaven 0-16 16.0 25.75
64 Waterford-Tramore 0-7.25 7.25 11.67
65 Cork-Macroom 0-23.5 23.5 37.82
66 Skibbereen-Schull 0-14.5 14.5 23.34
67 Tralee-Dingle 0-32.25 32.25 51.90
68 CastlegregoryJct-Castlegregory 0-6 6.0 9.66
69 Ennis-Kilkee 0-48 48.0 77.25
70 Moyasta-Kilrush 43-47.5 4.5 7.24
71 Athy-Wolfhill 0-9.5 9.5 15.29

8
72 Terenure-Poulaphouca 0-20.25 20.25 32.59
73 ConyghamRoad-Leixlip 0-9 9.0 14.48
74 Parsonstown-PortumnaBridge 0-12.25 12.25 19.71
75 Dundalk-Greenore 0-12.5 12.5 20.12
76 Greenore-BorderNewry 0-13 13.0 20.92
77 Derry-Burtonport 2-74.5 72.5 116.68
78 ToobanJct-Carndonagh 6.25-30.5 24.0 38.62
79 Crossdoney-Killeshandra 81.5-88.5 7 11.27
80 Summerhill(Cork)lines 0.5 0.80
Total80 1358 2161

9
Closed Lines
Nr Section Mileage Length Miles Length Km's
1 NavanKingscourt 31-50.5 19.5 31.38
2AbbeyJunction-NewRoss
102-115.75 13.75 22.13
3Belview-RosslareStrand
79.75-110.75 31.0 49.89
4 Mullingar-Athlone 50.25-78 27.75 44.66
5 Athenry-Claremorris 60.5-76.25+0-16.75 32.5 52.30
6Claremorris-Collooney
0-46.25 46.25 74.43
7 Limerick-Foynes 0-26.75 26.75 43.05
8Tralee-Fenit(14Bridges)
0-8.5 8.5 13.68
9 Midleton-Youghal 6.25-20.5 14.25 22.93
10Ballingrane-Tralee(lifted)
14.25-46+0.75 29.5 47.48
Total 10 250 402

10
MapofAbandonedorClosedLines
Greenindicatesabandoned.
Blueindicatesclosed.

Meeting the capital investment requirements
Appendix 4 August 2016

1
Maintenance and Renewal Spending Update from 2030 Rail Network Strategy Review
10th May 2016

Maintenance and Renewal Spending AECOM
2
TABLE OF CONTENTS
Executive Summary 1
1. Introduction and methodology 3
2. Planned spending 4
3. Reviews and benchmarking of planned spending 6
4. Emerging shortfall 11
5. Effect of shortfall on CCE 15
6. Effect of shortfall on SET 17
7. Potential risks 19
8. Conclusions and catch up needed 24

Maintenance and Renewal Spending AECOM
1
EXECUTIVE SUMMARY
As part of its work on Irish Rail’s “2030 Rail Network Strategy Review, 2011”1 AECOM devised a recommended programme of infrastructure maintenance and renewal activities to be carried out by Irish Rail over the twenty years from 2011 to 2030 inclusive. Based on its work, AECOM recommended that Irish Rail spend the equivalent of €2,896m on the maintenance and renewal of its civil engineering infrastructure over the period, and a further €1,384m on the maintenance and renewal of its Signalling, Electrical and Telecoms infrastructure over the same period.
In the years since 2011, Irish Rail has not had sufficient funding to complete this planned programme of maintenance and renewal spending. A significant backlog of infrastructure maintenance and renewal activity has built up and there is an urgent need to secure funding for an enhanced level of maintenance and renewal activity over the coming years to make up this backlog and to restore the planned level of maintenance and renewal activity.
Irish Rail’s planned level of infrastructure maintenance and renewal is actually below any reasonable benchmark figure. It is a full 21% less than the spending allowed in Scotland, which is one of the best comparators in terms of scale and local economic conditions. Irish Rail’s actual level of spending is significantly lower than its plans. Its current actual spending is running at a level a full 33% below the levels allowed in Scotland.
Irish Rail has been spending significantly less than a sustainable amount on infrastructure maintenance and renewal since 2011. It has been able to maintain the operational performance of the network by carrying out short term repairs that temporarily restore time expired assets to a workable condition and by managing safety issues. Funds for this extra repair and maintenance work have been secured by postponing planned renewal work. This is reflected in the fact that total planned spending on maintenance and renewal is running €285m behind planned levels by the end of 2016. Spending on maintenance is currently running ahead of planned levels, reflecting short term fixes to keep the network operational
This is strictly a short term approach. As time passes and renewal spending is postponed to pay for short term fixes, more and more of the assets that make up the network will reach the end of their useful life and will cease to be fully functional. In order to keep the rail network operating these assets will require short term repairs. The number of assets requiring this type of repair and the cost of carrying out individual repairs will both increase as time passes. In a relatively short time the annual cost of reactive repairs to keep the network operational will exceed the cost of a well-planned predictive approach based on renewing assets as they reach the end of their normal life.
More seriously as the average age of the network assets continues to increase under the current approach there will be an increasing risk of reductions in service as the operating speed of the lines declines. Ultimately the risk of safety being compromised will emerge.
There is a clear need to increase spending on maintenance and renewal and to return the network to a sustainable state. We have devised a revised estimate of the Irish Rail infrastructure maintenance and renewal annual requirement over the 14 year period 2017 – 2030 assuming track asset lives of 40 years. This takes account of the backlog built up over the last six years, adjusted for a level of avoidable expenditure, and with adjustments for tender price inflation and efficiencies The updated infrastructure annual maintenance and renewal steady state funding requirement is €239.5m over 14 years (2017 prices) compared to the original 2011 funding requirement of €214.0m over 20 years. In addition to infrastructure maintenance and renewal costs, the Irish Rail Infrastructure Manager will have ongoing operating costs. The average of these for the years 2014 to 2016 has been: €23.0m per
1 2030 Rail Network Strategy Review, Final Report, AECOM October 2011,

Maintenance and Renewal Spending AECOM
2
annum signalling and control operating costs and €9.2m per annum safety management costs. Funding for €37.3m of operating and safety management costs per annum is required for the future including an increased provision (internal transfer cost) for the Infrastructure Manager EU compliance (4b/c). The minimum funding requirement of the Infrastructure Manager to meet operating, safety management and steady state infrastructure maintenance and renewal costs is therefore €276.8m per annum over the 14 year period to 2030. This compares to the original requirement of €244m per annum over 20 years derived in the original 2011 AECOM analysis.
It should be noted that this does not include any provision for works and responsibilities that may be associated with closed and abandoned lines which has been estimated at €3m per annum.

Maintenance and Renewal Spending AECOM
3
1. INTRODUCTION AND METHODOLOGY
As part of its work on Irish Rail’s “2030 Rail Network Strategy Review” AECOM (2011) devised a recommended programme of infrastructure maintenance and renewal activities to be carried out by Irish Rail over the twenty years from 2011 to 2030 inclusive. Based on its work, AECOM recommended that Irish Rail spend the equivalent of €2,896m on the maintenance and renewal of its civil engineering infrastructure over the period, and a further €1,384m on the maintenance and renewal of its Signalling, Electrical and Telecoms infrastructure over the same period. This equated to an average annual spend of €214m over 20 years. It was recommended that this spending be slightly front loaded into the period to 2019 to prioritise completing the renewal of the Dublin-Cork rail line. Key details of the programme are summarised in the next section of this report.
This recommended programme of infrastructure maintenance and renewal spending was devised when a major programme of inspection and renewal of rail infrastructure was coming to an end. Between 1999 and 2013 three five year phases of a “Railway Safety Programme” were completed. As a result the infrastructure managed by Irish Rail was in a relatively good physical condition, and there was a high level of knowledge as to its likely future state and future needs for maintenance and renewal.
In the years since 2011, Irish Rail has not had sufficient funding to complete its planned programme of infrastructure maintenance and renewal spending. Accordingly a significant backlog of maintenance and renewal activity has built up and there is an urgent need to secure funding for an enhanced level of maintenance and renewal activity over the coming years to make up this backlog and to restore the planned level of maintenance and renewal activity.
Irish Rail commissioned AECOM to update the work it had done on infrastructure maintenance and renewal during the preparation of the “2030 Rail Network Strategy Review”, and to gauge the effect of this backlog of spending. Specifically AECOM was asked to consider:
The impact of the shortfall in infrastructure maintenance and renewal on the current state of the Irish Rail network;
The future deterioration of the network if the backlog in infrastructure maintenance and renewal is not made up; and,
The level of infrastructure maintenance and renewal needed to manage the Irish Rail network on a sustainable and efficient basis given the backlog that has been allowed to develop.
This report sets out the results of the work carried out by AECOM. The following sections of this report set out:
A summary of the maintenance and renewal programme originally planned for Irish Rail; The results of a benchmarking exercise on the planned level of spending carried out by
AECOM, together with a summary of the results of other independent reviews of Irish Rail’s original spending plans for maintenance and renewals;
Details of the emerging shortfall in maintenance and renewal spending; AECOM’s assessment of the effect of this shortfall on Irish Rail’s CCE assets; AECOM’s assessment of the effect of this shortfall on Irish Rail’s SET assets; The potential risks that will arise if the emerging backlog is not addressed in a timely manner;
and, An overview of the level of spending needed over the 14 year period 2017 – 2030 bearing in
mind the backlog over the last six years, cost escalations and efficiencies.

Maintenance and Renewal Spending AECOM
4
2. PLANNED SPENDING
The 2030 Rail Network Strategy Review (AECOM 2011) described a programme of infrastructure maintenance and renewal spending for the 20 years from 2011 to 2030 which would maintain Irish Rail’s infrastructure assets in a safe, usable “steady state” in the most cost effective manner possible. The average annual civil engineering (CCE) maintenance and renewals requirement was established at €144.8m per annum, and the requirement for maintenance and renewal of signalling, electrical and telecommunications (SET) assets was set at €69.2m per annum. A further annual spend of €21m was required to cover the Infrastructure Manager’s operational costs (signalling and control) and €9.0m for a safety management system. Irish Rail’s planned levels of spending based on this review are summarised in Table 1 below:
Table 1: Irish Rail/AECOM Maintenance and Renewal programme 2011-2030 Description Average
Spend 2011-2030 (€m)
Total Spend 2011-2030 (€m)
CCE Maintenance and Renewal Track Renewal 48.0 960.0 Track Maintenance 34.8 696.0 Bridge Renewals 17.6 351.2 Points and Crossings 9.5 189.0 Fencing 4.1 81.0 Level Crossings 10.8 216.2 Cuttings, Embankments and Other Structures 10.1 202.6 Facilities and Buildings 10.0 200.0 144.8 2,896.0 SET Maintenance and Renewal Signalling * 26.0 520.0 Telecoms ** 8.4 168.0 Electrification 4.4 88.0 Maintenance 30.4 608.0 69.2 1,384.0 Total Maintenance and Renewal 214.0 4,280.0 Signalling and Control Operating Costs 21.0 Safety Management System Operating Costs 9.0 Total Costs of Irish Rail Infrastructure Manager 244.0 * including provision for train protection systems (CAWS / ATP) but excluding NTCC
** including provision for train protection systems (CAWS / ATP) and GSMR.

Maintenance and Renewal Spending AECOM
5

Maintenance and Renewal Spending AECOM
6
3. REVIEWS AND BENCHMARKING OF PLANNED SPENDING
The €244m programme outlined in the 2030 Rail Network Strategy Review (AECOM 2011) and summarised in the previous section has been subject to a high degree of independent scrutiny, all of which have confirmed that it represented an essential level of spending if the network is to be used in a safe and effective way for the long term. For this report, AECOM carried out a benchmarking exercise to compare Irish Rail’s spending on infrastructure Maintenance and Renewal with the levels of spending in England and Wales, and Scotland. This benchmarking exercise also referenced the wider international statistics produced by UIC.
Independent Scrutiny of Irish Rail Maintenance and Renewal Programme
As noted above Irish Rail’s original infrastructure maintenance and renewal programme was devised in 2011 as part of its 2030 Rail Network Strategy Review. This review was carried out with the assistance of AECOM and Goodbody Economic Consultants and at the request of the Department of Transport, Tourism and Sport. It was published in October 2011.
Subsequently, in late 2012, Risk Solutions completed a mid-term review of the Third Railway Safety Programme (2009 – 2013)2. The steering group for this review included the Department of Transport Tourism and Sport, the Department of Public Expenditure and Reform and the Railway Safety Commission. Amongst other things, this review endorsed Irish Rail’s planned levels of steady state infrastructure maintenance and renewal spending.
In 2014 the Department of Transport Tourism and Sport working group on the Railway Infrastructure Manager Multi-Annual Contract produced its report on the funding needed for the Irish Rail Infrastructure Manager for the period from 2014 to 20183. The working group was advised by Jacobs/Leigh Fisher during its work. The working group broadly endorsed Irish Rail’s planned level of steady state spending of €244m per annum but noted that funding would not be available for this level of spending in 2014. The working group acknowledged that reducing maintenance and renewal spending below the steady state levels planned by Irish Rail is not sustainable in the long term and will lead to a reduction in operational performance.
The then Railway Safety Commission (now incorporated into the Commission For Railway Regulation) requested a review of the safety implications of Irish Rail not receiving enough funding to complete its planned level of maintenance and renewal activity. Irish rail, engaged Risk Solutions to carry out this review and they reported in April 20154. Risk Solutions were able to report that the shortfall in funding would not lead to an immediate safety or operational risk. However, they were very explicit that continued shortfalls would eventually lead to an unsustainable situation.
Benchmarking
For this review, AECOM has benchmarked Irish Rail’s maintenance and renewal spending against a range of international benchmarks. Rail infrastructure in England and Wales is owned and operated by Network Rail. Network Rail is subject to economic regulation by the Office of the Rail Regulator (ORR). The ORR reviews and approves Network Rail’s five year plans for maintaining and regulating its assets. These reviews are publicly available and provide a detailed benchmark of the maintenance and renewal activity of a rail Infrastructure Manager operating in line with best practices and subject to 2 Mid-term review of Iarnród Éireann’s Third Railway Safety Programme, A report for Department of Transport, Tourism and Sport, Risk Solutions, October 2012 3 Funding for the Railway Infrastructure manager Multi- Annual Contract 2014 – 2018, Working Group report, Final Report, Department of Transport, Tourism and Sport, 31st January 2014. 4 A review of the safety risk implications of agreed funding levels for the Infrastructure Manager Multi-Annual Contract, A report for Iarnród Éireann, Risk Solutions, April 2015

Maintenance and Renewal Spending AECOM
7
independent regulation designed to impost cost efficiency. Similar levels of detail are available on the maintenance and renewal activities of Scottish Railways. Finally, the Union International des Chemins de Fer (UIC) carries out regular benchmarking exercises on the maintenance and renewal spending of its member railways. AECOM has compared Irish Rails maintenance and renewal programme against these benchmarks.
The results of this benchmarking exercise are set out in Table 2 overleaf.
Country comparison shows an average annual infrastructure maintenance and renewal spend per track-km of €140k for England and Wales, €113k for Scotland, compared to €89k for Ireland. Irish Rail’s spending is significantly lower than that in England and Wales and Scotland, particularly for Bridges and Signalling renewals. The percentage spend on SET maintenance is also much higher for Ireland, showing a disproportionate focus on maintenance rather than renewal. However the level of SET maintenance in Ireland (€ / track-Km) is much lower than that of Network Rail, notwithstanding the significantly higher levels of renewal spend (€ / track-km) carried out by Network Rail in its SET assets.
It should also be noted that these benchmark figures are all net of VAT. Irish Rail is not in a position to recover VAT which adds approximately 9 to 10% to its cost base compared to that of Network Rail or Scottish Rail.
Based on Electrification % data (Figure 29 in LICB report – see Annex) and with reference to an older ORR/BSL benchmarking study (also attached), we made a reasonable assumption that UK is ‘N’ and Ireland is ‘Q’ in the list of anonymised countries. If this assumption is correct, Ireland would be the 11th of 15 countries in terms of expenditure on renewals and maintenance per track-km (note: this is normalised by purchasing power) until 2010. Figures 21 and 22 in the LICB report also show the fluctuations in annual expenditures, where Ireland’s renewal shows a marked decrease in spend from 2010, which aligns with information Irish rail has provided.
Even though this data pre-dates the period we are looking at from 2011, it presents valuable information on trends and the positioning of Ireland in comparison with other countries. In terms of annual spend per asset from 2011; we drew a comparison with the data provided for Civils against the UK CP5 data shown below. The data for signalling and SET was not provided. This shows again a disproportionate spend in maintenance for Ireland in comparison to renewals for all Civils. It may be possible that some small renewal are classified as maintenance. The LICB report indicated that maintenance accounts for approx. half of that spend with several countries clearly increasing the renewals over maintenance to help clear backlogs.
In comparison in the UK, the Network Rail in CP5 is expecting to employ a strategy to have greater proportion of track renewals on main lines, with greater use of heavy maintenance / life extension elsewhere.

Mai
nten
ance
and
Ren
ewal
Spe
ndin
g
AEC
OM
8
Tabl
e 2:
Ben
chm
arki
ng o
f Iris
h R
ail a
gain
st N
etw
ork
Rai
l, Sc
otla
nd a
nd re
st o
f Eur
ope
Aver
age
spen
d pe
r ann
um
€m
€k/
km
trac
k €
m€k
/ km
tr
ack
£m
€m€k
/ km
tr
ack
£m€m
€k/
km
trac
kTr
ack
&Po
ints
and
Cro
ssin
g55
2344
1869
089
028
9011
726
Ci
vils
(Incl
. Brid
ges,
Cut
tings
,etc
) 27
1130
1346
159
518
8110
524
Fa
cilit
ies a
nd B
uild
ings
104
104
224
289
919
256
Ci
vil M
aint
enan
ce
3515
4820
469
604
1978
101
23
Oth
er R
enew
als (
incl
. Pla
nt a
nd M
achi
nery
)187
00
205
264
835
4510
Si
gnal
ling
188
83
616
795
2559
7617
Te
leco
mm
s (in
cl. I
T )
84
63
177
228
79
123
El
ectr
ifica
tion
42
21
196
253
85
71
SE
T M
aint
enan
ce30
1331
1346
860
419
1216
4
SET
Refu
rbish
men
t/Pl
anne
d Jo
bs8
30
0
214
8918
075
35
0545
2214
0
389
502
113
Plan
ned
Actu
al 2
011-
16
Irela
nd (2
011-
30)
Net
wor
k Ra
il (2
013-
19)
Scot
land
(201
5-19
)24
00 k
m tr
ack
3219
0 km
trac
k44
30 k
m tr
ack

Maintenance and Renewal Spending AECOM
9
Conclusions on Benchmarking
The infrastructure maintenance and renewal plan described in the 2030 Rail Network Strategy Review called for average annual infrastructure maintenance and renewal spending of €214m per annum in 2011 prices over 20 years. This is equivalent to €89,000 per track kilometre on main running lines. In contrast the latest determination from the Office of Rail Regulation in the UK allows Network Rail to spend the equivalent of €140,000 per track kilometre on maintenance and renewals (2012/2013 prices). In Scotland the equivalent of €113,000 per track kilometre is allowed for maintenance and renewals (2012/2013 prices). Irish Rails planned level of maintenance and renewal is actually below any reasonable benchmark figure. It is a full 21% less than the spending allowed in Scotland, which is one of the best comparators in terms of scale and local economic conditions. Irish Rail’s actual level of spending is significantly lower than its plans. Its current actual spending is running at a level a full 33% below the levels allowed in Scotland.
There is significant outside support from benchmarks and the work of outside experts for Irish Rail’s concern that its current levels of maintenance and renewal spending are unsustainably low.
Asset Management and Efficiencies.
Irish Rail continues to seek and deliver efficiencies insofar as is possible to offset the funding shortfall currently being experienced.
One of the key developments in recent years has been investment in and development of the Infrastructure Manager’s asset management systems through the introduction of a suite of Decision Support Tools for each of the main asset bases in CCE. This has been a critical component in Irish Rail’s on-going ability to withstand the cumulative under-funding as they provide means of asset knowledge, risk management and prioritisation and therefore cost optimisation. This has contributed to the achievement of a number of efficiencies over the last number of years and which are reflected in the overall updated steady-state requirement outlined in this report.
Examples of efficiencies achieved in the area of track to withstand the less than steady state funding include:
Undertaking works with longer track possession timeframes (where possible and with a minimisation on service disruption) have been achieved in some areas such as the major ballast cleaning project on the Dublin/Cork Line. This has resulted in a higher output rate of ballast cleaning (and thus will generate a lower unit rate cost)
Despite less than steady-state funding, some limited line speed increases have been achieved by changes to track geometry standards and some of the tolerances within which allows better optimisation of the track asset.
The introduction of track measurement and monitoring technologies, for example, the introduction of the ‘Sperry’ rail flaw detection system provides greater visibility of rail defects at an early stage allowing better risk management and subsequently therefore cost management. This will be further enhanced and supplemented in 2016 with the introduction of rail grinding/milling services which will allow greater serviceability of the rail asset, thus reducing the requirement for otherwise earlier replacement of rails.
Other examples of efficiencies include:
Rationalisation of little used assets. More competitive tendering in some areas generated through the construct of various
contracts

Maintenance and Renewal Spending AECOM
10
Improvements to technical specifications, for (a recent) example fencing, are helping to achieve efficiency and productivity and therefore cost but overall, a review of all standards has helped to optimise in terms of maintenance and renewal requirements
An extensive project of low-value level crossing closures have been achieved through land buyouts, transfers and so on. Despite the lack of investment available, over 60 level crossings have been closed in the last 3 years as a result of this low cost project.
Updated maintenance interventions are being achieved across the asset bases – as a simple example, the introduction of a teflon based lubricant for points and crossings has generated savings on more traditional methodologies which were previously in place for lubrication of these critical assets
A general change in asset inspections methodologies from a simple condition based to more rounded risk based methodologies has generated efficiency, not only in resources, but also in terms of determining and prioritising works, so as to provide optimisation of investment.
Investment in infrastructure around the leaf fall season which causes considerable disruption to services during the autumn period has seen significant benefits. In particular, the introduction of Traction Gel Applicators (TGA’s), rail scrubbers and sandite / waterjetting technologies have significantly reduced the adverse service impact during this period.

Maintenance and Renewal Spending AECOM
11
4. EMERGING SHORTFALL
Emerging Backlog in Spending
Since 2011 financial constraints have prevented Irish Rail from achieving planned levels of steady state spending on infrastructure maintenance and renewal in line with the AECOM 2011 recommendation. In the years from 2014-2018 Irish Rails’ funding for the maintenance and repair of infrastructure is the subject of an Infrastructure Manager Multi-Annual Contract (IMMAC) between the DTTAS and Irish Rail, as required by S.I. No. 249 of 2015. The nature of the IMMAC, which is essentially an annual contract, does not provide the Infrastructure Manager with certainty of funding over the five years as required under EU directives. The contract sets out the actual level of funding available for the current year (including exchequer funds, access charges and own funds) and only states an indicative level of exchequer funding for subsequent years which has been subject to change. The level of exchequer grants set out in Schedule A of the contract falls well short of that required to support the required level of steady state infrastructure maintenance and renewal investment bearing in mind the funds available from access charges and Irish Rail own funding.
Despite a clear consensus amongst policy makers and their professional advisors that Irish Rail’s planned level of spending on infrastructure maintenance and renewal represents the steady state level of spending needed to preserve the network in a fully operational condition over the long term, a significant backlog in spending and activity is emerging. By the end of 2016 this backlog will reach €285m. The speed at which this backlog is accumulating is set out in Tables 2 and 3 below.
An analysis of this shortfall has been conducted to identify works that have been deferred over the six year period (2011 – 2016) due to funding constraints and that may now no longer be required e.g. a missed station painting cycle. It should be noted however that it may not be possible to exclude the full cost of a missed cycle of works as the cost of a subsequent cycle is likely to be more expensive as the asset may be in a more deteriorated state, Following an analysis of the backlog of each asset category a possible cost saving of €12m was estimated. This reduced the unavoidable deferred spend at the end of 2016 from €285m to €273m as set out in Table 4.
It should be noted from Table 3 and 4 that the SET maintenance spend has been higher than planned due to underspend in renewals while the points and crossing spend has been higher than originally planned due to a required acceleration of works. Significant backlogs of works have emerged across all other asset categories and particularly in the areas of track renewal, bridges, level crossings and signalling renewal / upgrade including train protection (ATP/ CAWS) and GSMR.

Mai
nten
ance
and
Ren
ewal
Spe
ndin
g
AEC
OM
12
Tabl
e 3:
Pla
nned
and
Act
ual M
aint
enan
ce a
nd R
enew
al S
pend
ing
2011
-201
8 (€
m)
Pl
anne
d Sp
endi
ng
2011
20
12
2013
20
14
2015
20
16
fore
cast
Aver
age
2011
-20
16
Tota
l An
nual
Av
erag
e
Shor
tfal
l CC
E
Trac
k
R
enew
al
48.0
50
.9
31.8
36
.5
22.0
32
.9
29.6
34
.0
M
aint
enan
ce
34.8
27
.1
27.3
24
.3
47.9
40
.6
42.7
35
.0
TO
TAL
82
.8
78.0
59
.1
60.8
69
.9
73.5
72
.3
68.9
-1
3.9
Brid
ges
Re
new
al
16
.3
18.1
12
.7
5.6
7.7
7.0
11.2
Mai
nten
ance
0.0
0.0
0.0
4.0
5.2
4.4
2.3
TO
TAL
17
.6
16.3
18
.1
12.7
9.
6 12
.9
11.4
13
.5
-4.1
Po
ints
and
Cro
ssin
gs
Re
new
al
5.
1 8.
9 12
.9
9.2
5.9
4.3
7.7
M
aint
enan
ce
0.
0 0.
0 0.
0 4.
4 6.
0 5.
7 2.
7
TOTA
L
9.5
5.1
8.9
12.9
13
.6
11.9
10
.0
10.4
0.
9 Fe
ncin
g
Rene
wal
3.0
1.8
3.2
3.1
1.5
2.6
2.5
M
aint
enan
ce
1.
3 1.
0 0.
8 0.
8 1.
1 0.
7 1.
0
TOTA
L
4.1
4.3
2.8
4.0
3.9
2.6
3.3
3.5
-0.6
Le
vel C
ross
ings
Rene
wal
2.1
2.6
3.5
2.3
1.4
1.5
2.2
M
aint
enan
ce
1.
7 1.
5 1.
2 1.
7 2.
5 2.
3 1.
8
TOTA
L
10.8
3.
8 4.
1 4.
7 4.
0 3.
9 3.
8 4.
1 -6
.8
Cutt
ings
, Em
bank
men
ts e
tc.
Rene
wal
5.5
4.0
4.4
3.9
2.1
2.3
3.7

Mai
nten
ance
and
Ren
ewal
Spe
ndin
g
AEC
OM
13
Mai
nten
ance
4.0
4.3
3.2
6.2
7.8
7.3
5.5
TO
TAL
10
.1
9.5
8.3
7.6
10.1
9.
9 9.
6 9.
2 -1
.0
Faci
litie
s and
Bui
ldin
gs
10.0
11
.1
8.0
10.8
9.
5 9.
9 8.
3 9.
6 -0
.4
Subt
otal
CCE
14
4.8
128.
1 10
9.3
113.
5 12
0.6
124.
6 11
8.7
119.
1 -2
5.7
TOTA
L CC
E Re
new
al
82
.9
67.2
73
.2
46.1
51
.5
47.3
61
.4
TO
TAL
CCE
Mai
nten
ance
45.2
42
.1
40.3
74
.5
73.1
71
.4
57.8
SET
Si
gnal
ling
26.0
12
.7
3.1
6.2
8.4
11.1
7.
8 8.
2 -1
7.8
Tele
com
s 8.
4 5.
7 8.
5 5.
3 6.
2 5.
4 5.
7 6.
1 -2
.3
Elec
trifi
catio
n 4.
4 1.
2 2.
4 1.
9 1.
6 1.
3 1.
8 1.
7 -2
.7
Mai
nten
ance
30
.4
30.1
29
.7
31.1
32
.1
31.5
33
.8
31.4
1.
0
Su
btot
al S
ET
69.2
49
.7
43.7
44
.5
48.2
49
.3
49.0
47
.4
-21.
8
TO
TAL
IM
214.
0 17
7.8
153.
0 15
8.0
168.
8 17
3.9
167.
7 16
6.5
-47.
5 IM
Ope
ratio
nal C
osts
& S
MS
30.0
To
tal
244.
0
So
urce
: AEC
OM

Maintenance and Renewal Spending AECOM
14
Table 4: Cumulative Backlog in Maintenance and Renewal Spending 2011-2016 (€m)
2011 2012 2013 2014 2015 2016 forecast
Unavoidable deferred
spend
CCE Track -4.8 -28.5 -50.5 -63.4 -72.7 -83.2 -80.8 Bridges -1.3 -0.7 -5.6 -13.6 -18.3 -24.5 -23.7 Points and Crossings -4.3 -4.8 -1.4 2.7 5.1 5.7 5.4 Fencing 0.2 -1.1 -1.1 -1.3 -2.7 -3.5 -3.2 Level Crossings -7.0 -13.7 -19.9 -26.7 -33.7 -40.7 -38.6 Cuttings, Embankments and other Structures
-0.7 -2.5 -5.1 -5.1 -5.3 -5.9 -5.6
Facilities and Buildings 1.1 -0.9 -0.1 -0.6 -0.7 -2.4 2.3 Subtotal CCE -16.8 -52.3 -83.8 -108.1 -128.3 -154.5 -148.8 SET Signalling -13.3 -36.2 -56.0 -73.6 -88.6 -106.8 -101.4 Telecoms -2.7 -2.6 -5.7 -7.9 -10.9 -13.7 -13.0 Electrification -3.2 -5.2 -7.7 -10.5 -13.6 -16.2 -15.4 Maintenance -0.3 -1.0 -0.3 1.4 2.5 5.9 5.9 Subtotal SET -19.5 -45.0 -69.7 -90.7 -110.6 -130.8 -123.9 TOTAL IM -36.3 -97.3 -153.5 -198.8 -238.9 -285.3 -272.7
Source: AECOM

Maintenance and Renewal Spending AECOM
15
5. EFFECT OF SHORTFALL ON CCE
The effect of this emerging backlog in steady state infrastructure maintenance and renewal spending will be serious. Based on our review of the data available, and discussions with Irish Rail management, the effects on each area of CCE infrastructure will be as outlined below:
Track Renewals and Maintenance
The AECOM 2030 Rail Network Strategy Review recommended a track renewal spend of €2,088m on track renewal and maintenance over the 20 year period 2011-2030. Actual spend for the first 5 years has been €413.5m euros - leaving a backlog of €81m when account is taken of deferred works that are now avoidable. Design life expectancy is critical to determination of a steady state renewal level and this is widely acknowledged as critical by the UIC.
The 2030 Rail Network Strategy Review recommended that 485km of track be renewed over the 20 year planning period on the core Dublin-Cork and Dublin-Belfast lines and the DART system, all of which were at or near their design life in 2011. This renewal programme has not been implemented and as such these lines are closer to the end of their design life
Irish Rail’s actual spend on track renewals has been running at an average of €34m per annum 2011-2016 against the 2011 plan of €48m per annum.
Spend on track maintenance has been running at an average of €35m per annum 2011-2016 which is in line with the original plan of €34.8m per annum. However, over the last three years there has been a significant escalation in maintenance spend - which averages as €43.7m per annum. This reflects the increased maintenance needed to keep an increasing amount of track infrastructure that has reached the end of its design life in an operable condition.
If track renewals remain at the current very low levels we would anticipate that maintenance spend will increase further as average track age increases. At the same time the number of track condition related speed restrictions will increase.
We would also anticipate that the number of track related incidents will increase with asset age – e.g. number of rough ride reports, number of wet beds and number of rail breaks will all increase. We would also anticipate an escalating deterioration in track quality with consequential rapid deterioration in track components and underlying formation failure.
The risk of derailment is also likely to increase for assets at the end of their design life due to track geometry defects materialising between maintenance visits and rail breaks (not all rail defects are detectable). To stabilise the railway at the current level the volume of track renewals would need to be returned to the a minimum of 60 km per annum
Even at this level of spending we would anticipate that maintenance would need to be continue at the current enhanced spend of approximately €45m per annum.
Between 2011 and 2016 44km of track has been renewed compared to a steady state requirement of 360km. This gives a renewal shortfall of 316km. As a result the average age of the track infrastructure has increased by more than 4 years over the period 2011 – 2016. To catch up this shortfall over the next 14 years will require an additional 23km of track to be renewed each year and increase the renewal volume from 60 to 83km per annum. In the event that a renewal catch up programme is implemented we would anticipate a gradual reduction in maintenance spend requirement from €45m per annum to the 2011 level of €27m per annum.
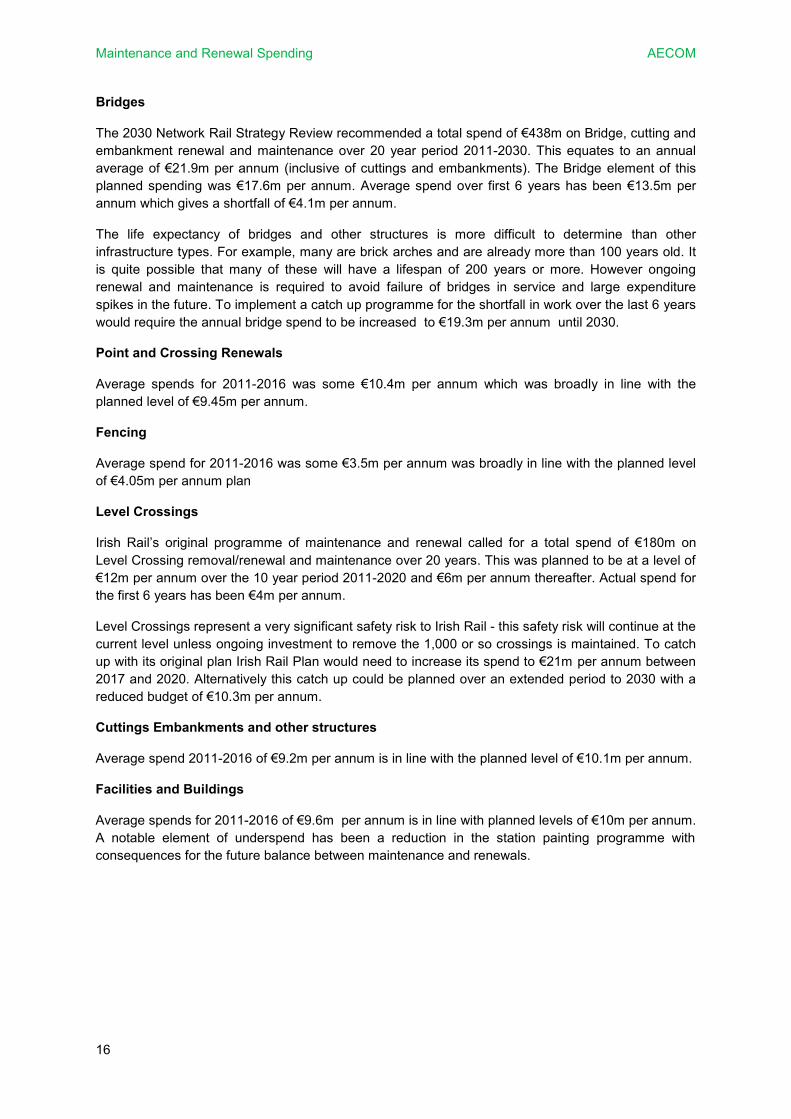
Maintenance and Renewal Spending AECOM
16
Bridges
The 2030 Network Rail Strategy Review recommended a total spend of €438m on Bridge, cutting and embankment renewal and maintenance over 20 year period 2011-2030. This equates to an annual average of €21.9m per annum (inclusive of cuttings and embankments). The Bridge element of this planned spending was €17.6m per annum. Average spend over first 6 years has been €13.5m per annum which gives a shortfall of €4.1m per annum.
The life expectancy of bridges and other structures is more difficult to determine than other infrastructure types. For example, many are brick arches and are already more than 100 years old. It is quite possible that many of these will have a lifespan of 200 years or more. However ongoing renewal and maintenance is required to avoid failure of bridges in service and large expenditure spikes in the future. To implement a catch up programme for the shortfall in work over the last 6 years would require the annual bridge spend to be increased to €19.3m per annum until 2030.
Point and Crossing Renewals
Average spends for 2011-2016 was some €10.4m per annum which was broadly in line with the planned level of €9.45m per annum.
Fencing
Average spend for 2011-2016 was some €3.5m per annum was broadly in line with the planned level of €4.05m per annum plan
Level Crossings
Irish Rail’s original programme of maintenance and renewal called for a total spend of €180m on Level Crossing removal/renewal and maintenance over 20 years. This was planned to be at a level of €12m per annum over the 10 year period 2011-2020 and €6m per annum thereafter. Actual spend for the first 6 years has been €4m per annum.
Level Crossings represent a very significant safety risk to Irish Rail - this safety risk will continue at the current level unless ongoing investment to remove the 1,000 or so crossings is maintained. To catch up with its original plan Irish Rail Plan would need to increase its spend to €21m per annum between 2017 and 2020. Alternatively this catch up could be planned over an extended period to 2030 with a reduced budget of €10.3m per annum.
Cuttings Embankments and other structures
Average spend 2011-2016 of €9.2m per annum is in line with the planned level of €10.1m per annum.
Facilities and Buildings
Average spends for 2011-2016 of €9.6m per annum is in line with planned levels of €10m per annum. A notable element of underspend has been a reduction in the station painting programme with consequences for the future balance between maintenance and renewals.

Maintenance and Renewal Spending AECOM
17
6. EFFECT OF SHORTFALL ON SET
Based on our review of the data available, and discussions with Irish Rail management, the effects on each area of SET infrastructure will be as outlined below:
Signalling Renewal and Maintenance
The maintenance and renewal programme set out in the 2030 Rail Network Strategy Review recommended an average annual spend, over the 20 year period 2011-2020 €26m per annum. The majority of the Signalling Renewal expenditure was proposed for the Dublin–Cork line, the Dublin–Belfast line and the DART network, all of which will reach the end of their design life in the period.
The actual average spend on renewals between 2011 and 2016 has been €8.2m per annum. Much of this spending has been on the DART network. This represents an average shortfall of €17.8m per annum As a result of this shortfall, the signalling system is ageing. The average age (mileage weighted) has increased from 16 to 21 years in the 6 years between 2011 and 2016. Ageing signalling infrastructure increases the risk of signalling failure and associated operational consequences.
As a possible consequence of this aging asset base, the SET maintenance spend is running slightly over plan at an average of €31.4m per annum compared to €30.4m per annum in the original plan.
To re-establish a steady state at the current average age of signalling equipment, signalling renewals need to be increased. This will require spending at the original planned level of €26m (or ideally €32.5m as advised in the original Network Strategy). To catch up the shortfall and return the signalling asset to an average age equal to its half-life, an increased spend will needed. If this catch up is spread over the next 14 years then the spend will be increased to €34.9m per annum and with the average maintenance budget running at €30.3m per annum.
Telecom
The 2030 Network Rail Strategy Review originally proposed a spend of €8.4m per annum over the 20 year period. Actual average spends during the 2011-2016 period is running at an average of €6.1m per annum, representing a shortfall of €2.3m per annum. The consequences of this 25% shortfall need to be reviewed and if necessary the expenditure increased to ensure that the roll out of GSM-R and replacement of CAWS and ATP equipment is not being unduly delayed. These are safety critical systems. The transmission network is due for renewal from 2017 and if necessary the expenditure may need to be increased to accommodate this as it is needed to support all communication on the entire rail network.
Electrification
Irish Rail’s planned spending in this area was an average of €4.4m per annum. Outturn spending has been running at an average rate of €1.7m per annum. The consequences of this 52% shortfall need to be reviewed and if necessary the expenditure increased. In particular the contact wire was due for renewal from 2015 along with a number of road rail vehicles.
Asset Condition Assessments.
Arising from a recommendation of the 2014 DTTaS Working Group report referred to earlier Irish Rail commissioned Network Rail to undertake separate asset condition assessments of its signalling, electrical and telecommunication assets. These assessments confirmed the need for urgent wide ranging asset replacement throughout the network. Progress on addressing the priority issues

Maintenance and Renewal Spending AECOM
18
identified, with the limited funding currently available through the IMMAC, is reported to the DTTAS at the IMMAC monitoring committee meetings.
More recently the Commission for Railway Regulation has expressed concerns regarding the urgent safety need to replace / upgrade inadequate and obsolete train control and communication systems.

Maintenance and Renewal Spending AECOM
19
7. POTENTIAL RISKS
As described above there is a clear consensus that the levels of spending originally proposed for Irish Rail in the 2030 Rail Network Strategy Review represent the appropriate average annual spending on infrastructure maintenance and renewal over the medium to long term. If levels of spending on maintenance and renewal are reduced below these levels now they will have to be increased in future so that total spending over the longer term can “catch up” with the total amount originally intended. The levels of spending between 2011 and 2013, and the levels of spending included in the IMMAC for the period 2014-2018 merely represent a postponement of essential spending. The cuts in spending involved do not represent a net saving in cost. Irish Rail and DTTAS could be described as borrowing money that will have to be repaid in the form of greater infrastructure maintenance and renewal spending in the future.
It is important to understand the effects that this decision to postpone infrastructure maintenance and renewal spending will have. The three most significant effects are:
Significant reductions in the level of service offered to Irish Rail passengers until the backlog is made up;
Potential increases in the total cost of maintenance and renewal over the lifecycle of the infrastructure.
Greater exposure to safety risks.
Reduced Service
The rail infrastructure managed by Irish Rail consists of an enormous number of individual civil, electronic and telecoms assets. These all generally have a life of more than one year. In normal operating conditions their physical condition will deteriorate over time. The normal “useful life” of an asset is the period over which it can be used to operate rail services safely at Irish Rail’s normal operating speeds and frequencies of service.
When a civil engineering asset goes beyond this “useful life” it does not necessarily immediately become non-functional. Its physical state continues to deteriorate steadily over time. If a component of the railway infrastructure has gone beyond its useful life it is still possible to operate rail services over that part of the network. However in order to ensure safe operation it will be necessary to reduce operating speeds of the rail services. Ultimately it may be necessary to reduce the frequency of rail services over the section of track in question.
A growing back log of overdue renewals in the signalling, electrical and telecom (SET) systems, identified in a series of asset condition assessments by Network Rail, could have particularly severe consequences. Unlike civil engineering type assets that may deteriorate slowly and the consequences of this deterioration can be mitigated against (e.g. imposing TSR’s and bridge weight restrictions), SET assets nearing their useful life may suddenly fail resulting in a total loss of service for a prolonged period e.g. the loss of an interlocking such as Limerick could take up to a year to replace and the loss of a DART substation would put the DART business under serious risk with severely limited services. It is prudent practice both from a safety and commercial viewpoint to systematically address these issues.
The best approach to renewal is to carry out a systematic programme of replacing or renewing all of the components of the rail network before they reach the end of their useful life. This can be planned in such a way that the amount of renewal activity is constant from year to year. This is referred to as a steady state renewal programme. The maintenance and renewal programme proposed by Irish Rail

Maintenance and Renewal Spending AECOM
20
for 2011-2030 consisted of such a steady state renewal programme plus the ongoing inspection, maintenance and repair work that is needed to ensure safe operation of the network.
In any given year or years it is possible to reduce renewal activity to less than what is called for by a steady state programme. However if safety is to be preserved this must mean postponing some renewal activity in favour of an increased level of maintenance. The individual assets whose renewal has been postponed will continue to deteriorate. Eventually assets that have not been renewed will reach a physical state where the speed, or even frequency, of rails services will have to be reduced to preserve safety. The rail network is a complex, integrated system so it is obvious that the deterioration of a relatively small, cheap to renew, asset could have a disproportionate effect on a significant number of rail services and so on a very large number of rail passengers.
Inevitably the deteriorating infrastructure assets will increase the commercial risk for the Train Operator whose business plan is critically dependant on achieving aggressive revenue growth. Funding the IM work programme is in turn critically dependant on the Train Operator meeting its revenue targets given the limitations in exchequer funding.
In summary, if spending on infrastructure maintenance and renewals is reduced below the steady state level, then train speeds and frequencies will inevitably have to be reduced. These reductions will become larger as the cumulative amount of spending avoided increases. These speed and frequency reductions will lead to increased journey times being forced on all rail users. To put this in context, by the end of 2013 Irish Rail had managed to postpone €119m in spending on track renewals. This risked imposing increased journey times on all of the journeys taken on Irish Rail services. These increased journey times could easily have a cost of the order of €17m5 per annum until such time as the backlog in renewal work is made up. This represents a very high price to pay for effectively borrowing €119m.
Increased Cost
So far we have assumed that reducing maintenance and renewal spending below the steady state level represents a postponing of spending. In other words, we have assumed that normal operating conditions can be restored by making additional spending in the future such that the total amount spent over the full term of the programme is preserved.
In reality, reducing spending below the steady state level may actually increase the total amount of spending needed over the life of the maintenance and renewal programme. If individual components of the railway network are kept in use beyond their normal useful life, the eventual cost of renewing them can clearly be greater than it would have been if they had been renewed on a timely basis. As the rail system continues to use the time expired component, the rate at which it deteriorates can clearly increase. In addition other parts of the system that depend on the component in question may start to suffer additional damage. All this means that when the postponed renewal work eventually takes place, it may cost much more than was originally expected.
The DTTaS Working Group Report (January 2014) on the funding of the IMMAC 2014 - 2018 gives a useful, costed, example of this type of effect. Section 4.23 of the report presents an estimate that is costs approximately €1.1m to renew a mile of track. Once such a renewal has taken place the track should be fully usable for 30 years before a further renewal is needed. If the track is not renewed at the end of 30 years, then €400,000 - €500,000 worth of “maintenance” work will be needed to restore it to a condition where it can be used safely at normal levels of operational performance.
The graph below illustrates the lifecycle of a typical track asset and how continual maintenance interventions result in a return of track quality to a lesser quality than previous after each successive 5 In 2013 Irish Passengers completed 1,568m passenger/kilometres. For illustrative purposes we can assume that this travel had an average speed of 100kmh. This implies a total travel time of 15.7m hours. If operating speeds are reduced by 10 per cent, travel time will increase to 17.4m hours. This increase of 1.74m hours represents a cost of €17.4m at an average value of time €10/hour.

Maintenance and Renewal Spending AECOM
21
intervention. This is a well acknowledged representation of the behaviour of track and demonstrates clearly the progressive deterioration of track over time, thus introducing performance and safety challenges as various declining thresholds are reached, but also demonstrates the lack of value in continuous maintenance interventions as the return in track quality is continually declining for the same investment. It shows these interventions becoming more frequent, until such time is reached that ultimately the impact of the maintenance itself is negligible and the renewal requirement can no longer be offset.
The graphic also demonstrates the overall higher cost of multiple maintenance interventions when the renewal cost is still ultimately required and thus attracting a much higher whole life cycle cost to the asset. This representation is typical of a less than steady-state funding scenario and of the cycle within which IÉ is currently confined with respect to its management of the track asset.
Increased safety Risks.
While Irish rail has withstood the underfunding of its infrastructure maintenance and renewal programme, this has not been without incident.
While safety has been broadly maintained during the period of underfunding to date, there are a number of occurrences that have given cause for concern. One of the primary examples of this since 2011 is in the area of embankment failures. The high risk asset category of Cuttings and Embankments has seen a number of serious land slip events over the last number of years, including train collision events. These include major rock fall event at Waterford Station, serious incidents at Leggan in Kilkenny, as well as multiple slip events on the Cobh and Tralee lines.
Another area of concern is around level crossings and with a significant number of user worked crossings on the network this remains one of the key risks. The period of underfunding has coincided with a number of serous collisions at user worked crossings such as at XM250 and XX24 in County Mayo. A number of planned level crossing elimination projects had to be deferred as a result of lack of funding and while the Infrastructure Manager is looking to introduce improved technology to reduce

Maintenance and Renewal Spending AECOM
22
the risk overall, elimination remains the primary preferred method of dealing with these high risk assets.
Other areas of concern include boundary issues in urban and rural areas and an increasing trend in bridge strikes which present specific safety and operational risks to the railway.
The deferment of SET works has resulted in several areas where Irish Rail had to impose restrictions on operational services due to degradation of the signalling systems. Two notable area were Cherryville Junction where a 25mph restriction had to be imposed for over 12 months until the area was re-signalled in October 2015 and a 5mph restriction currently in pace in Limerick. Operating under degraded working poses a considerable safety risk. The renewals are continuing at a reduced pace in signalling, electrification and telecoms. The reduced funding levels manifest themselves in continued deferment of works that is likely to result in further restriction in other areas. It should be noted that signalling systems can completely collapse with immediate consequential affects on services for prolonged periods.
Summary implications of underfunding.
The programme of infrastructure maintenance and renewal for the period 2001-2030 presented by Irish Rail in its 2030 Rail Network Strategy Review (AECOM 2011) is an efficient approach to maintaining and renewing the rail network. Due to funding constraints Irish Rail has not been able to keep to this programme up to the end of 2016. There is a risk that the multiannual funding available from DTTAS will not allow it to fulfil the programme in the years up to 2018. The backlog of spending up to the end of 2016 based on the current IMMAC amounts to €285m. There is a risk that based on current trends the backlog will accumulate to over €370 by the end of 2018.
Three points need to be made about this backlog and the consequences of not addressing the unacceptable funding shortfall:
This is, at best, a postponement of spending and sub-optimal use of funding. Irish Rail has received less funding than anticipated, but this will have to be repaid in the form of more spending than anticipated in the future. Postponing spending will actually lead to net additional costs and call into question value for money due to:.
o an ongoing uneconomic emphasis on reactive maintenance and deferral of timely asset renewal works exacerbating the current backlog.
o the short term shortfall in funding will lead to increased asset whole life costs over the longer term of an order of magnitude greater than any possible saving in financing costs currently being realised.
Postponing spending in this way will ultimately impose large travel time costs on passengers,
and possibly service cancellations, which are completely out of proportion to any possible saving in financing costs. Performance standards will deteriorate to unacceptable standards as inadequate investment in the infrastructure will see additional operational restrictions (e.g. TSRs for level crossings, weight restrictions at some bridges) imposed as the lives of the degraded assets continue to be extended through maintenance rather than renewal.:-
o additional TSRs and delay minutes will contribute to declining punctuality levels. o there will be greater potential for SET system failures contributing to declining
reliability standards and possibly prolonged service cancellations. o there will be greater vulnerability to extreme weather conditions.

Maintenance and Renewal Spending AECOM
23
o there will be reduced permanent way lineside programmes including vegetation clearance and weed spraying
o there will be a reduction in planned electrification, telecoms level crossings, transmission system and station service renewals.
o mandatory technical standards and regulatory supervision may ultimately require certain assets to be withdrawn altogether.
While safety will continue to be managed, safety standards may be compromised due to:-
o the deferral of investment on critical signalling, communication (GSMR) and train protection systems (ATP / CAWS) and level crossing technical solutions.
o delayed replacement of life expired signalling at key locations including Limerick, Kilkenny, Waterford and Cork
o increased reliance on human interventions. o greater vulnerability to severe weather conditions. o reductions in key safety critical programmes including level crossings and fencing.

Maintenance and Renewal Spending AECOM
24
8. CONCLUSIONS AND CATCH UP NEEDED
Irish Rail has been spending significantly less than a sustainable amount on infrastructure maintenance and renewal since 2011. It has been able to maintain the operational performance of the network by carrying out short term repairs that temporarily restore time expired assets to a workable condition. Funds for this extra repair and maintenance work have been secured by postponing planned renewal works. This is reflected in the fact that total planned spending on maintenance and renewal is running €285m behind planned levels at the end of 2016. Spending on maintenance is currently running ahead of planned levels, reflecting short term fixes to keep the network operational
This is strictly a short term, and ultimately an expensive, approach. As time passes and renewal spending is postponed to pay for short term fixes, more and more of the assets that make up the network will reach the end of their useful life and will cease to be fully functional. In order to keep the rail network operating these assets will require short term repairs. The number of assets requiring this type of repair and the cost of carrying out individual repairs will both increase as time passes. In a relatively short time the annual cost of reactive repairs to keep the network operational will exceed the cost of a well-planned predictive approach based on renewing assets as they reach the end of their normal life.
More seriously as the average age of the network assets continues to increase under the current approach there will be an increasing risk of reductions in service as the operating speed of the lines declines and service disruptions / cancellations possibly over prolonged periods in the case of failures associated with SET asset failures. Ultimately the risk of safety being compromised will emerge due to deteriorating assets and the greater need for human interventions.
There is a clear need to increase spending on maintenance and renewal and to return the network to a sustainable state. We have devised a revised estimate of the Irish Rail infrastructure maintenance and renewal annual requirement over the 14 year period 2017 – 2030 assuming track asset lives of 40 years. This takes account of the backlog built up over the last six years, adjusted for a level of avoidable expenditure, and with adjustments for tender price inflation and efficiencies The updated infrastructure annual maintenance and renewal steady state funding requirement is €239.5m over 14 years (2017 prices) compared to the original 2011 funding requirement of €214.0m over 20 years. In order to deliver this increased level of investment across the wide range of infrastructure assets and systems it will be necessary for Iarnród Éireann to address a number of resource constraints.
In addition to infrastructure maintenance and renewal costs, the Irish Rail Infrastructure Manager will have ongoing operating costs. The average of these for the years 2014 to 2016 has been: €23.0m per annum signalling and control operating costs and €9.2m per annum safety management costs. Funding for €37.3m of operating and safety management costs per annum is required for the future including an increased provision (internal transfer cost) for the infrastructure manager EU compliance (4b/c).
The minimum funding requirement of the Infrastructure Manager to meet operating, safety management and steady state maintenance and renewal costs is therefore €276.8m per annum over the 14 year period to 2030. This compares to the original requirement of €244m per annum over 20 years derived in the original 2011 AECOM analysis.
It should be noted that this does not include any provision for works and responsibilities that may be associated with closed and abandoned lines which has been estimated at €3m per annum.
Table 5 below sets out a comparison of the revised steady state annual funding requirement with the original 2011 AECOM annual steady state funding requirement and the annual average spend that was achieved over the six year period 2011 – 2016.

Maintenance and Renewal Spending AECOM
25
Table 5: Renewal, Maintenance and Operational Expenditure Total €m
AECOM Annual Steady State 2011 – 2030
(2011 prices)
Actual Average Annual spend
2011- 2016
Revised Steady State Annual
spend 2017 – 2030
(2017 prices) Track 82.8 68.9 88.6 Bridges 17.6 13.5 19.6 Points and Crossing 9.5 10.4 9.5 Fencing 4.1 3.5 4.5 Level Crossings 10.8 4.0 14.2
Cuttings, Embankments and other Structures 10.1 9.2 11.1 Facilities and Buildings 10.0 9.6 11.2 Total CCE 144.8 119.1 158.7 Signalling 26.0 8.2 34.9 Telecomms 8.4 6.1 9.8 Electrification 4.4 1.7 5.8 SET Maintenance 30.4 31.4 30.3 Total SET 69.2 47.4 80.8 CCE + SET 214.0 166.5 239.5 IM Operations 21.0 23.0 28.3 Safety Management Systems 9.0 9.2 9.0 Total IM 244.0 198.7 276.8
The revised steady state infrastructure maintenance and renewal funding requirement is based on the assumption that key signalling projects will be funded through the IM multi annual contract (IMMAC). These key projects include the completion of the final phase of the GSMR project (€30m) and the roll out of a train protection system (€134m). These two projects, were included in the original AECOM analysis and was based on an estimate of €80m for the train protection system which was derived well in advance of the development of a detailed specification for the project. These projects. cannot be delivered with the annual level of funding that has been available in recent years through the IMMAC. It is assumed that the new NTCC will be funded with an entirely separate source of capital funds.
The key drivers of the cost increase between the 2011 AECOM steady state annual funding requirement (€244m) and the Revised Steady State annual requirement (€276.8m) is summarised in Table 6 below.
Table 6: Variance analysis between original and revised steady state average annual funding requirement excluding the closed and abandoned lines c.€3m per annum funding requirement.
With Backlog Base annual requirement (AECOM 2011 prices) 244.0
Address unavoidable backlog (€272.7m over 14 yrs) 19.5 Subtotal 263.5 IM Operating Costs (additional EU compliance 4b/c) – internal transfer costs 7.3

Maintenance and Renewal Spending AECOM
26
Cost escalations – tender inflation 22.1 Efficiencies -16.2 Average Requirement over 14 years (2017 prices) 276.8
When account is taken of the requirement to address issues that may arise along the closed and abandoned lines the revised annual steady state funding requirement is €279.8m (€280m)
In the context of the theme throughout this report it should be noted that deferral of renewal works will not alone add to the backlog of works but will also contribute to cost escalations through more expensive works at a future date. Deferral will also undermine the potential for greater efficiencies in the delivery of the investment programme and particularly in the context of optimally timed renewal works being replaced by an increased maintenance requirement.


Fleet Strategy
Appendix 5 August 2016

2
1. SUMMARY
The Board is advised that a review has been carried out to determine future capacity
requirements based on varied projected growth figures to 2020. The review has identified that
capacity issues are currently being experienced on Intercity & Commuter services, these issues
are expected to further impact on existing capacity levels in the short term in line with Ireland’s
economic improvement.
2. Background
In 2013 Iarnród Éireann commenced a Fleet Strategy Project aimed at reducing Fuel &
Energy costs by way of reducing train sizes to more economically meet train capacity with
falling passenger demand. This strategy addressed the Intercity & DART fleets, no
alterations to the Diesel Commuter Fleet was considered for this strategy.
The implementation of the Fleet Strategy resulted in the reduction in maximum train sizes
of the Intercity Railcar Fleet and Off Peak DART services, this also allowed for the removal
from service of half of the MKIV Diesel hauled fleet.
Since 2013 there has been steady growth in passenger numbers across all 3 business
categories of Intercity, DART & Commuter services. Overall passenger growth levels since
2013 to the end of 2015 are 6% for Intercity & 8.5% for DART & Commuter services.
These overall growth figures are substantial & are primarily achieved during the morning
& evening peak hours. Taking into account the relatively narrow AM & PM peak periods it
is safe to assume that passenger growth levels during these periods are substantially
higher than the overall growth levels highlighted.
3. Current Position
A sharp upturn in Ireland’s economic conditions since mid-2014 has resulted in significant
increases in passenger numbers. These increases in demand particularly at peak times
coupled with the proposed introduction of new services for the Phoenix Park Tunnel have
resulted in the requirement to re-introduce the previously removed MKIV train fleet. The
operational DART fleet has also been increased by a further 12 vehicles in advance of an
Author: Chris McMorrow / Brian O’Meara
ADVISORY NOTE – Fleet requirements for planned growth
2016-2020
Reviewed by:
Submitted by: Peter Smyth
Approved by: Director TO

3
increased 10 Minute DART frequency timetable planned for 2017.
3.1 Capacity Issues
There are a significant number of outer Commuter and Intercity services which are
currently approaching or exceeding capacity. Following the service developments outlined
above all available rollingstock is now in operation and there are no immediate options
available to increase capacity on heavily loaded services.
The potential for capacity demands to return to 2007 levels is fast becoming a reality
however the fleet currently available to meet this demand is far less than was available in
2007. In 2007 MK2, MK3 & 2700 Class DMU rollingstock were still in operation and were
gradually phased out of service between 2007 & 2009 following the introduction of the ICR
Fleet.
This fleet cascade overlap provided substantial capacity in this interim period and the
initial order of 183 ICR vehicles and subsequent order of 51 ICR vehicles (ordered in
2008) adequately coped in a period of falling passenger demand from 2009 onwards. It
must also be noted that between 2008 & 2009 Midleton, The Western Rail Corridor,
Docklands & increased Sligo Line services were also introduced and account for the use of
9 train sets which would have been utilised on other services during the peak demand
years between 2005 & 2007.
Increased capacity applied to existing DART services in April 2016 and further increases
associated with the future DART 10 minute timetable is expected to adequately cope with
increased DART capacity demands up to 2020 and DART expansion project to cater for
demand beyond this. In order to ascertain capacity requirements for Intercity, Outer
Commuter & Commuter demands over the same period sensitivity analysis has been
carried out to the 2015 National Census data by assuming annual growth levels of 4%,
6% & 8% per annum up to 2020.
A significant capacity issues arise and currently exist in each scenario based on existing
capacity available. The proposals outlined in this paper will allow for higher capacity
commuter vehicles to operate on Phoenix Park Tunnel services & in turn create a cascade
of ICR & DMU vehicles to some Intercity & Commuter services. Finally an order of
individual intermediate ICR (22000 class) vehicles will be required to further increase
capacity on existing Outer Commuter & Intercity services. Also considered is an option to
purchase a new build fleet to cater for this demand.

4
Table 1. 2016 Fleet Disposition
Table 2. Below highlights the number of vehicles which will be required based on the
various growth levels considered.
Table 2.
4. Capacity Options
There are a number of options open to IE to increase additional capacity up to 2020. It is
to be noted that none of these are available within 24 months:
4.1 Class 2700 DMU reintroduction 14 x 2 car DMU class 2700 fleet were withdrawn from service in 2012 as part of the fleet
strategy project to optimise capacity and reduce costs. It is proposed to re-introduce this
fleet into service on a phased basis during 2018/ 2019 and release ICR sets to other
services. Each vehicle requires interior and exterior refurbishment, as well as
modifications and heavy maintenance across a range of systems to bring them to a
condition suitable for service. Initial estimates suggest the cost of the works will be in the
region of €200,000-€300,000 per vehicle depending on the scope chosen.
The most expedient option would be for the work to be offered as a turnkey to a major
contractor. In this scenario, it is envisaged that the procurement timeline for contract
award and critical path material supply would take up to 12 months, followed by an
additional 24 months for the refurbishment program
4.2 ICR new center car vehicles Analysis by IÉ has shown that existing consists will struggle to respond to peaks in

5
passenger demand from 2016. It is therefore proposed to purchase additional
intermediate B cars and reconfigure train sizes to address capacity issues. These vehicles
could be handled by the existing Portlaoise Depot with a small number of additional staff.
This option provides an efficient solution by increasing capacity on existing units and
therefore do not incur additional manpower cost associated with implementing additional
services.
The complexity in achieving systems compatibility would mean the only feasible option to
lengthen existing trains is to procure intermediate cars from Mitsui/ Rotem. It is expected
that an order would be placed under the existing 2004 Mitsui Framework Agreement
(subject to legal confirmation on the validity of the contract term) or alternatively via a
direct order procurement derogation. It should be noted that there is no current provision
in the capital plans for the purchase of additional vehicles.
Exploratory discussions with Mitsui has confirmed that the vehicles could be manufactured
and delivered in 2 years from order at a provisional cost of €1.895m per vehicle assuming
similar specification to 2008 when a similar vehicle cost €1.646m. Note that costs exclude
VAT, excise duty and other project costs which is estimated would result in a cost per
vehicle of €2.4m (not inclusive of project management cost). CRR approval would be
needed however should be relatively straightforward.
As a means of maximising seating capacity, IE could also review options with Mitsui for
these intermediate vehicles to be fitted with air-line seating. Initial estimates show that
this may increase capacity in these vehicles from 72 to 80 seats while also providing the
capacity for additional bike storage which is becoming an increasing requirement from our
customers. This design change, however would necessitate a revisit of the APIS (CRR
Approvals) process from a crash-worthiness, passenger load, and evacuation perspective.
4.3 New build fleet One possible capacity option is to procure a new build fleet. The procurement process for
a new vehicle build from tender commencement, contract award and entry into service
following delivery, commissioning & further CRR safety validation approvals would extend
this period to 5 years. IE would then retain all of the associated operational and
maintenance costs for operating a new variant fleet in service. The estimated purchase
cost of a new build fleet per vehicle inclusive of VAT & Excise cost is €3.1m per vehicle
(not inclusive of project management cost).
5. Discussion
Ø The options for adding additional fleet capacity are as follows:

6
1. The re-introduction of the currently stored 2700 class DMU Fleet coupled
with the purchase of Intermediate ICR (22000 class) vehicles in order to
increase capacity on existing services.
2. The purchase of a new build fleet.
Ø The re-introduction of the 14 x 2 Class 2700 DMU fleet, (11 sets for service and 3
retained for maintenance holdings) would assist in providing additional and a more
suitable Commuter Rolling Stock to Phoenix Park services and would allow the
reallocation of 4 ICR sets to other services.
Ø The 2700 DMU and additional ICR fleet can be maintained by existing depots with
a small number of additional staff. CME would review its DMU maintenance
strategy taking into account the re-introduction of the 2700 DMU, and allocation of
DMU’s to Phoenix Park services.
Ø The purchase of Intermediate vehicles from Mitsui would provide the quickest and
most cost effective solution for adding additional capacity. It is yet to be
determined from a procurement viewpoint whether this is possible. It would not be
recommended from a mechanical viewpoint that the addition of intermediate ICR
vehicles from another manufacturer be considered due to high complexity in
achieving integration and compatibility with existing ICR systems. This would
create a high likelihood of mechanical interface issues and subsequent performance
& customer impacts.
Ø The Purchase of a new build fleet is more costly and has a longer lead in period for
introduction into service. Further operational & maintenance costs will be
associated with this option as it would be a new fleet variant.
6. Next Steps It is recommended to proceed with the option of 2700 class railcar re-introduction and the
purchase of 41 intermediate ICR (22000 Cass) vehicles. This option is substantially more
cost effective than proceeding with a new build and would absorb growth levels of 6%
year on year up to 2020.
Based on funding confirmation in Q4 2016, the anticipated timescales associated with the
preferred option of 2700 Class re-introduction and Intermediate ICR vehicles are as
follows:

7
2700 Class Re-introduction
Subject to IE Procurement process commencing in January 2017 and critical path material
availability, the best possible timeline indicated by the market would be for delivery to
take place in stages from Q2 2018 to Q2 2019, with entry into service from Q4 2018.
These timeframes will be confirmed following tender process and contract award
New Intermediate ICR vehicles
Subject to contract award in Q1 2017, Mitsui have indicated delivery could take place in
phases from Q1 2019 to Q3 2019, with entry into service from Q2 2019. These will be
confirmed on contract award


Route Profitability(Roland Berger Report)
Appendix 6 August 2016

1
ExplanatoryNote
Outlining the Approach for the Development of the Route ProfitabilityModelThe analysis of Route Profitability was undertaken by Roland Berger and Iarnród Éireann. Theanalysisconsidersperformanceatanoverallsystemlevelandatindividualbusinessunitlevels(theTrainOperatorandtheInfrastructureManager).
TheRouteProfitabilityAnalysis:Ø Definedtheroutes;Ø CollatedtheinformationfromallofIarnródÉireannssystems;Ø Allocated revenues and expenditures to routes, which is not possible under current Iarnród
Éireannsystems;Ø Validatedallassumptions,methodologiesandresultswithIarnródÉireann;Ø Developedarouteprofitabilitymodel.
The following four terms are used to define different aspects of the railway: Route,Service,LineandSegment Ø ARoutehasanoriginandadestination,onwhichatrainserviceoperates.ARoutecanconsist
ofoneormoreservices.Ø AServiceisatrainwithaparticularsetofdepartureandarrivaltimes.Ø ALineisaphysicaltrackthatagivenrouteutilises.Ø ASegmentisasectionofaLine.
Routes17RouteswereidentifiedfortheRouteProfitabilityAnalysis:
1. Dublin–Cork;2. Dublin-Galway;3. Dublin–Tralee;4. Dublin-Limerick;5. Dublin–Westport/Ballina;6. Dublin-Waterford;7. Dublin-Sligo;8. Dublin–Belfast;9. Dublin–Rosslare;10. LimerickJunction–Waterford;11. Limerick–Ballybrophy;12. CorkCommuter;13. Limerick–Galway;14. KildareSuburban;15. NorthernSuburban;16. WesternSuburban;17. DART.

2
RevenueIarnród Éireann captures passenger information on a number of systems and has three mainrevenuetypes:
1. Origin/Destinationreporting,whichcapturesthebulkofrevenuefromregularticketsales.2. Annual&MonthlyTaxSaverRevenue.3. FreeTravelSchemeRevenue.
Revenueis,asfaraspossible,determinedonastationtostationbasis(Origin–Destination).RollandBergerandIarnródÉireanndevelopedacompleteOrigin–Destinationmatrixforpassengerjourneypatternsandcorrespondingrevenue.
RevenueAllocationTheOrigin–Destinationrevenue isallocatedtoroutessharingcommoninfrastructure(Line)usingparticularallocationalgorithms.
Themethodology,wheretheOriginandDestinationareknownhasthreeallocationpossibilities:
A. No Interchange – revenue is allocated to routes that operate between the Origin andDestination;
B. InterchangetoDART–revenueisallocatedtointercityroutes;C. Interchangetootherintercityservice–revenueisallocatedproportionatetothedistanceof
thetwojourneySegments.
Themethodology,wheretheOriginand/orDestinationisnotknownhastwoallocationpossibilities:
D. Either Origin or Destination is known – revenue is allocated to the route of the knownstation;
E. OriginandDestinationisnotknown–revenueissplitbetweenSuburbanandDARTroutes(proportionatetothedistanceofeachoftheroutes).
Examplesofhowtherevenueisallocatedbasedonthefirstfourscenariosaboveisdetailedinthefollowingillustration:

3
Revenueisallocatedbasedonthefrequencyofservicesoperatingoneachroute,wheretheOriginandDestinationcanbeattributedtomultipleroutes.AspertheThurles–Heustonexampleabove,passengershavethreerouteoptionsHeustontoCork,TraleeorLimerick.RevenueisallocatedbasedonthefrequencyofserviceoneachrouteattributabletotheOrigin–Destinationpairing(Thurles–Heuston).
There are 36 services available for the Thurles – Dublin journey. The Cork – Dublin route has 27servicesperday,therefore75%oftherevenueisallocatedtotheCork–DublinRoute.TheTralee–Dublinroutehas2servicesperday,therefore7%oftherevenueisallocatedtotheTralee–Dublinroute.TheLimerick–Dublinroutehas7servicesperday,therefore19%oftherevenueisallocatedtotheLimerick–Dublinroute.
Approximately80%ofIarnródÉireannrevenueisgeneratedthroughpassengertransport.Thenon-passengerrevenuerelatestoCarParking,Advertising,Property,TelecomsandThirdPartyRevenue.Revenue is assigned toaparticular station forCarParking,AdvertisingandProperty. The revenueassignedtoastationisallocatedtotheroutesservingthestationbasedonthefrequencyofservicesoperatingoneachroute.Telecomsareallocatedtoallpassengerroutesbasedonservicefrequency.ThirdPartyRevenue (Annual Tax Saver, Free Travel Scheme, Schools andOther) typically have anOrigin–Destinationandareassignedtotheroutesaccordingly.
ExpenditureTrainOperationexpenditureisrecordedasacostelementinanindividualcostcentreontheIarnródÉireannfinancialsystem.Thecostelementsandcostcentreshavenoreferencetoaparticularroute.
AllTrainOperatorcostcentresandcostelementswerereviewedandexpenditurewasallocatedonthefollowingbasis:
Ø Directlytoindividualrouteswherepossible(e.g.guardswhoareresponsibleforaparticularroute);or
Ø To track segments (e.g. clerical and stationoperations)and then to routesusing the tracksegmentbasedonthefrequencyofrouteusage.
ExpenditurerelatingtotheInfrastructureManagerisrecordedunderfourcostcategories:
Ø ChiefCivilEngineer;Ø Signalling,Electrification,Communications;

4
Ø InfrastructureManagerOperations;Ø BuildingsandFacilities.
For each of the cost categories, intermediary cost categories were defined on the basis ofsubdivisions, regional, or track segments. The cost elements in the intermediary cost categorieswereallocatedtotracksegmentsbasedonallocationkeysagreedwiththeInfrastructureManagerOperation. The basis for allocation from a track segment to an individual route is based on theroutes’usageofaparticulartracksegmentandthetracksegmentsexpenditurepermaintrackkm.Similarly to theTrainOperator, there isadistinctionbetweenuniqueandsharedexpenditures fortracksegmentswhichareusedbyoneversusseveralroutes.
Onceallrevenuesandexpenditureswereappropriatelyallocatedtherouteprofitabilitymodelwasdeveloped.
Therouteprofitabilitymodelcanbebrokendownintofourcategories:
Ø Uniquerevenueandexpenditure;Ø Sharedrevenueandexpenditure;Ø CentralandGrouprevenueandexpenditure;Ø BalanceSheetcharges.
Dublin – Cork route profitability analysis per the Route ProfitabilityReport:
UNIQUEE
SHARED
CENTRAL&GROUP
BALANCESHEET

5
Legenddescriptions:Pax Revenue (Passenger Revenue) – relates to ticket purchases and can be unique and shared(detailedundertherevenuesection).
Non farebox pax revenue (Non Ticket Revenue relating to passengers) – relates to Tax SaverTickets,theFreeTravelSchemeandPenalties.Thisrevenuecanbeuniqueandshared.
Freight–relatestofreightrevenueandexpenditureandisallocatedtofreightroutesonly.
Non-railrelated–relatescarparking,property,CAN,Telecomsandthirdpartyrevenuesandcanbeuniqueandshared.
Trainbased–relatestoTrainOperatorexpenditure.
Geographybased–relatestoInfrastructureManagerexpenditure.
BU charges (Business unit) – relates to central charges not directly incurred by the route, theyinclude all support areas such as head office, marketing, accounts, payroll, IT, other supportfunctionsandCIEcosts.
BalanceSheetCharges–relatetodepreciationandcapitalisationofexpenditure.

Mai
n R
epor
t –Fi
nal (
DR
AFT)
Com
mer
cial
ly s
ensi
tive
docu
men
t Ia
rnró
dÉi
rean
nw
ill, if
ne
cess
ary,
requ
est t
he a
pplic
atio
n of
Sec
tion
27(1
) of t
he
Free
dom
of I
nfor
mat
ion
Act.
Not
to b
e gi
ven
to
ANY
OTH
ER P
ARTY
with
out t
he p
rior w
ritte
n pe
rmis
sion
of
Iarn
ród
Éire
ann
9M
ay 2
016
Rou
te P
rofit
abilit
y

220
1605
09_R
PA_T
T_20
15_F
inal
_Rep
ort_
DR
AFT.
pptx
Impo
rtant
not
ice
1.Th
is p
rese
ntat
ion
has
been
com
pile
d fo
r the
exc
lusi
ve, i
nter
nal u
se b
y ou
r clie
nt. W
ithin
the
fram
ewor
k of
the
enga
gem
ent,
Rol
and
Berg
er L
imite
d ("R
B") w
ill ac
t so
lely
in th
e in
tere
st o
f the
clie
nt. P
rope
rty ri
ghts
in fa
vor o
f thi
rd p
artie
s w
ill no
t be
cons
titut
ed a
nd n
o pr
otec
tive
effe
ctsh
all a
rise
for t
he b
enef
it of
third
par
ties.
2.Th
e pr
esen
tatio
n sh
all b
e tre
ated
as
conf
iden
tial a
nd m
ay n
ot b
e pa
ssed
on
and/
or m
ay n
ot b
e m
ade
avai
labl
e to
third
par
ties
with
out p
rior w
ritte
n co
nsen
t fro
m R
B. It
is
not
com
plet
e w
ithou
t the
und
erly
ing
deta
iled
anal
yses
and
the
oral
pre
sent
atio
n.
3.R
B do
es n
ot a
ssum
e an
y re
spon
sibi
lity
for t
he c
ompl
eten
ess
and
accu
racy
of a
ny d
ocum
ents
and
info
rmat
ion
mad
e av
aila
ble
to R
Bin
the
cour
se o
f the
pro
ject
. RB
assu
mes
that
the
data
and
doc
umen
ts p
rovi
ded
are
com
plet
e, c
ompr
ehen
sive
and
that
the
cont
ents
are
trut
hful
and
exa
ct; a
det
aile
d ex
amin
atio
n ha
s on
ly b
een
cond
ucte
d by
RB
if st
ated
so
in th
e pr
esen
tatio
n.
4.R
B's
scop
e of
ser
vice
s in
clud
ed th
e cr
eatio
n of
a ro
ute
prof
itabi
lity
anal
ysis
. The
dec
isio
n ov
er th
e us
e, th
e ev
alua
tion
of th
e ap
plic
abilit
y an
d th
e us
e of
the
pres
enta
tion
by R
B ar
e th
e so
le re
spon
sibi
lity
of th
e cl
ient
. The
con
tent
and
sco
pe o
f the
pre
sent
atio
n is
exc
lusi
vely
at t
hedi
scre
tion
of R
B.
5.Th
is p
rese
ntat
ion
rela
tes
only
to th
e po
sitio
n as
of 8
th o
f Aug
ust 2
014
and
will
be u
pdat
ed. T
his
pres
enta
tion
has
been
com
pile
d ba
sed
on th
e G
ener
al T
erm
s an
d C
ondi
tions
of R
B as
atta
ched
to th
is p
rese
ntat
ion.
Any
use
of t
his
pres
enta
tion
(or e
xcer
pts
of it
) or i
ts c
onte
nt m
ust o
nly
be m
ade
with
in th
e sc
ope
of th
e G
ener
al
Term
s an
d C
ondi
tions
of R
B. It
is e
xplic
itly
stat
ed th
at s
ectio
n 2
no. 2
(no
prot
ectiv
e ef
fect
for t
he b
enef
it of
third
par
ties)
and
sect
ion
9 (li
mita
tion
of li
abilit
y) o
f the
G
ener
al T
erm
s an
d C
ondi
tions
of R
B ap
ply.
If, n
otw
ithst
andi
ng th
e in
tent
ion
of th
e pa
rties
, pro
perty
righ
ts in
favo
r of t
hird
parti
es s
hall
be c
onst
itute
d, s
ectio
n 33
4 BG
B(G
erm
an C
ivil
Cod
e) s
hall
appl
y m
utat
is m
utan
dis.
Any
pos
sibl
e lia
bilit
y to
third
par
ties
is li
mite
d ac
cord
ing
to s
ectio
n 9
of th
e G
ener
al T
erm
s an
d C
ondi
tions
of
RB.
6.Th
is d
ocum
ent s
hall
be tr
eate
d as
con
fiden
tial.
It ha
s be
en c
ompi
led
for t
he e
xclu
sive
, int
erna
l use
by
our c
lient
and
is n
otco
mpl
ete
with
out t
he u
nder
lyin
g de
tail
anal
yses
and
the
oral
pre
sent
atio
n. It
may
not
be
pass
ed o
n an
d/or
may
not
be
mad
e av
aila
ble
to th
ird p
artie
s w
ithou
t prio
r writ
ten
cons
ent f
rom
Rol
and
Berg
er
Stra
tegy
Con
sulta
nts.
RB
does
not
ass
ume
any
resp
onsi
bilit
y fo
r the
com
plet
enes
s an
d ac
cura
cy o
f the
sta
tem
ents
mad
e in
this
doc
umen
t.
© R
olan
d Be
rger
Lim
ited

320
1605
09_R
PA_T
T_20
15_F
inal
_Rep
ort_
DR
AFT.
pptx
Con
tent
sPa
ge
This
doc
umen
t sha
ll be
trea
ted
as c
onfid
entia
l. It
has
been
com
pile
d fo
r the
exc
lusi
ve, i
nter
nal u
se b
y ou
r clie
nt a
nd is
not
com
plet
e w
ithou
t the
und
erly
ing
deta
il an
alys
es a
nd th
e or
al p
rese
ntat
ion.
It
may
not
be
pass
ed o
n an
d/or
may
not
be
mad
e av
aila
ble
to th
ird p
artie
s w
ithou
t prio
r writ
ten
cons
ent f
rom
.
© R
olan
d Be
rger
A.In
trodu
ctio
n4
B.Ap
proa
ch10
C.
Sum
mar
y re
sults
18
D.
Rou
te p
rofit
abilit
y re
sults
Act
uals
201
523
E.R
oute
pro
fitab
ility
resu
lts A
ECO
M 2
015
50
F.Ap
pend
ix: D
etai
ls o
n ap
proa
ch76
1.R
even
ue a
lloca
tion
772.
TO c
ost a
lloca
tion
843.
IM c
ost a
lloca
tion
874.
Valid
atio
n92
5.In
terp
reta
tion
of re
sults
95

420
1605
09_R
PA_T
T_20
15_F
inal
_Rep
ort_
DR
AFT.
pptx
A.In
trodu
ctio
n

520
1605
09_R
PA_T
T_20
15_F
inal
_Rep
ort_
DR
AFT.
pptx
Con
tent
s of
this
sec
tion
Back
grou
nd to
the
proj
ect
Proj
ect c
onte
xt
Def
initi
ons
1 2 3

620
1605
09_R
PA_T
T_20
15_F
inal
_Rep
ort_
DR
AFT.
pptx
>R
olan
d Be
rger
Ltd
. ("R
olan
d Be
rger
") ha
s be
en a
sked
by
Iarn
ród
Éire
ann
("IÉ"
, "Iri
sh R
ail")
to u
nder
take
an
anal
ysis
of
rout
e pr
ofita
bilit
ies
(the
"Rou
te P
rofit
abilit
y Ana
lysi
s", t
he "P
roje
ct")
to p
rovi
de a
n un
ders
tand
ing
of th
e co
ntrib
utio
ns to
pr
ofit
and
loss
of i
ts c
onst
ituen
t ope
ratio
ns
>Th
e R
oute
Pro
fitab
ility
anal
ysis
con
side
rs p
erfo
rman
ce a
t an
over
all s
yste
m le
vel a
nd s
epar
ated
into
the
indi
vidu
al
busi
ness
uni
ts (t
he T
rain
Ope
ratio
ns, "
TO")
and
Infra
stru
ctur
e M
anag
er ("
IM"))
>R
olan
d Be
rger
has
dur
ing
this
pro
ject
, tog
ethe
r with
Iris
h R
ail
–D
efin
ed th
e ro
utes
whi
ch fo
r whi
ch in
divi
dual
P&L
s ne
ed to
be
deve
lope
d,–
Col
late
d th
e re
leva
nt d
ata
from
IÉ's
syst
ems,
–D
istri
bute
d ex
pend
iture
s an
d re
venu
es to
rout
es w
here
the
orig
inal
dat
a fro
m IÉ
did
not
lend
itse
lf to
dire
ct a
lloca
tion
to ro
utes
(bas
ed o
n m
etho
dolo
gies
agr
eed
with
IÉ),
–Va
lidat
ed a
ll as
sum
ptio
ns, m
etho
dolo
gies
and
resu
lts w
ith IÉ
and
–D
evel
oped
a R
oute
Pro
fitab
ility
Mod
el (t
he "M
odel
"), c
onsi
stin
g of
sep
arat
e re
venu
e an
d co
st m
odel
s, to
cal
cula
te th
e P&
Lsof
eac
h ro
ute
>Al
l wor
k ha
s be
en u
nder
take
n in
clo
se in
tera
ctio
ns w
ith IÉ
's pr
ojec
t man
ager
. Sta
keho
lder
s (N
TA a
nd D
TTaS
) wer
e ke
pt
info
rmed
and
hav
e pr
ovid
ed in
put t
hrou
gh S
teer
ing
Com
mitt
ee M
eetin
gs
>Th
is p
rese
ntat
ion
sum
mar
ises
Rol
and
Berg
er's
findi
ngs
and
repr
esen
ts th
e co
mpl
eted
del
iver
able
aga
inst
IÉ's
com
mis
sion
Back
grou
nd –
Rou
te P
rofit
abilit
y
1B
ackg
roun
d

720
1605
09_R
PA_T
T_20
15_F
inal
_Rep
ort_
DR
AFT.
pptx
Back
grou
nd –
Segm
ent a
naly
ses
1B
ackg
roun
d
>In
add
ition
to th
e R
oute
Pro
fitab
ility A
naly
sis,
Rol
and
Berg
er h
as a
lso
unde
rtake
n a
num
ber o
f ana
lyse
s in
ord
er to
un
ders
tand
the
finan
cial
impa
ct o
f cha
nges
in IÉ
'sse
rvic
e pr
ovis
ion
and
infra
stru
ctur
e ne
twor
k–
Thes
e an
alys
es a
re c
olle
ctiv
ely
refe
rred
to a
s Se
gmen
t Ana
lyse
s or
indi
vidu
ally
as
Segm
ent A
naly
sis
–In
tota
l, 4
Segm
ent A
naly
ses
have
bee
n un
derta
ken
>It
shou
ld b
e no
ted
that
the
defin
ition
s of
thes
e Se
gmen
t Ana
lyse
s ha
s le
d to
a s
igni
fican
t inc
reas
e in
com
plex
ity o
f the
or
igin
ally
env
isag
ed re
venu
e an
d co
st m
odel
s si
nce
thes
e ha
d to
be
sub-
divi
ded
and
allo
cate
d to
seg
men
ts o
f the
IÉra
il ne
twor
k ra
ther
than
com
plet
e lin
es–
Whi
le th
is in
crea
ses
the
flexi
bilit
y of
the
Rou
te P
rofit
abilit
y M
odel
, it h
as a
lso
incr
ease
d co
mpl
exity
and
redu
ced
the
ease
of h
andl
ing
>Th
e re
sults
of t
he S
egm
ent A
naly
ses
will
be p
rovi
ded
in a
sep
arat
e re
port

820
1605
09_R
PA_T
T_20
15_F
inal
_Rep
ort_
DR
AFT.
pptx
Segm
ent
Ana
lyse
s
Cor
e R
oute
Pr
ofita
bilit
y Pr
ojec
t
The
Rou
te P
rofit
abilit
y Pr
ojec
t pro
vide
s th
e ba
sis
to d
evel
op
busi
ness
cas
es to
ulti
mat
ely
impr
ove
IÉ's
finan
cial
per
form
ance
Cur
rent
situ
atio
nR
oute
pro
fitab
ility
Segm
ent a
naly
sis
impa
ct o
n IÉ
op
erat
ions
Bus
ines
s ca
se fo
r sc
enar
ios
Wid
er is
sues
>R
even
ues
and
expe
nditu
res
by
busi
ness
uni
t
>Pr
ofit
by ro
ute
by:
–C
ontri
butio
n le
vel
–Bu
sine
ss u
nit
>D
irect
reve
nue
impa
ct>
Esca
pabl
e un
ique
ex
pend
iture
s im
pact
>C
apex
requ
ired
>O
rgan
isat
iona
l cha
nge
>Ex
cept
iona
ls>
Alte
rnat
ive
usag
e of
as
sets
>In
dire
ct re
venu
e im
pact
>Ti
min
g of
sav
ings
qu
antif
ied
>W
ider
eco
nom
ic
impa
ct>
Stak
ehol
der v
iew
s>
Envi
ronm
enta
l im
pact
>…
Con
text
of r
oute
pro
fitab
ility
proj
ect
Sour
ce: R
olan
d Be
rger
2C
onte
xt

920
1605
09_R
PA_T
T_20
15_F
inal
_Rep
ort_
DR
AFT.
pptx
We
have
def
ined
a s
et o
f ter
ms
whi
ch w
e w
ill us
e co
nsis
tent
ly in
our
do
cum
ents
We
have
def
ined
four
term
s to
des
crib
e di
ffere
nt a
spec
ts o
f the
railw
ay:r
oute
, ser
vice
, lin
e an
d tr
ack
segm
ent
>A
rout
eis
a g
iven
OD
pai
r, on
whi
ch s
ervi
ces
are
oper
ated
. A ro
ute
cons
ists
of o
ne o
r mor
e se
rvic
es>
A se
rvic
eis
a tr
ain
with
a p
artic
ular
set
of d
epar
ture
and
arri
val t
imes
>A
line
is th
e ph
ysic
al tr
ack
that
a g
iven
rout
e ut
ilises
>A
trac
k se
gmen
t is
a se
ctio
n of
a li
ne
Serv
ice
view
Geo
grap
hica
l vie
w
Def
initi
ons
of ro
ute,
ser
vice
, lin
e an
d tra
ck s
egm
ent
Orig
in:
Dub
lin H
eust
on
Des
tinat
ion:
Cor
k
07:0
0
08:0
0
09:0
0
10:0
0
11:0
0
Departure time
Dub
lin H
eust
on
Cor
k
Bally
brop
hy
Lim
eric
k Ju
nctio
nLi
neTr
ack
segm
ent
Route Services
Sour
ce: I
arnr
ód É
irean
n, R
olan
d Be
rger
Dublin
–C
ork
–D
irect S
erv
ices
Serv
ice
1Se
rvic
e 2
Serv
ice
3Se
rvic
e 4
Serv
ice
5
…
…
3D
efin
ition
s

1020
1605
09_R
PA_T
T_20
15_F
inal
_Rep
ort_
DR
AFT.
pptx
B.Ap
proa
ch

1120
1605
09_R
PA_T
T_20
15_F
inal
_Rep
ort_
DR
AFT.
pptx
A m
ulti-
step
app
roac
h ha
s be
en fo
llow
ed to
der
ive
indi
vidu
al c
ash
flow
s an
d P&
Ls fo
r eac
h of
IÉ's
rout
es
Appr
oach
to d
eriv
e at
rout
e le
vel f
inan
cial
sta
tem
ents
Rou
te
defin
ition
1
Def
initi
on o
f rou
tes
for p
rofit
abilit
y an
alys
is
Rev
enue
al
loca
tion
2
Allo
cate
d re
venu
e cu
rrent
ly c
olle
cted
as
OD
pai
rs o
nto
rout
es
OD
pai
r rev
enue
s ha
ve b
een
allo
cate
d to
rout
es b
ased
on
serv
ice
frequ
ency
of
thos
e ro
utes
pas
sing
th
roug
h th
e O
D p
air
stat
ions
TO e
xpen
ditu
res
allo
catio
n
3
Re-
stru
ctur
ed
curre
nt c
ost c
entre
lo
gic
to e
nabl
e co
st
allo
catio
n to
rout
es
Diff
eren
tiate
d be
twee
n ex
pend
iture
s w
hich
ca
n be
une
quiv
ocal
ly
allo
cate
d to
a ro
ute
vs. e
xpen
ditu
res
whi
ch c
an b
e al
loca
ted
to m
ultip
le
rout
es, "
uniq
ue" a
nd
"sha
red"
ex
pend
iture
s,
resp
ectiv
ely
IM e
xpen
ditu
res
allo
catio
n
4
Re-
allo
cate
d fro
m
mai
nly
regi
onal
ly
capt
ured
dat
a to
ro
utes
Valid
atio
n
5
Proc
ess
to v
alid
ate
inpu
ts, a
djus
tmen
ts
and
findi
ngs
with
IÉ
Inte
rpre
tatio
n of
resu
lts
6
Cav
eats
aro
und
inte
rpre
tatio
n of
fin
ding
s
Sour
ce: I
arnr
ód É
irean
n, R
olan
d Be
rger

1220
1605
09_R
PA_T
T_20
15_F
inal
_Rep
ort_
DR
AFT.
pptx
Sour
ce: I
arnr
ód É
irean
n, R
olan
d Be
rger
17 ro
utes
hav
e be
en d
efin
ed fo
r the
rout
e pr
ofita
bilit
y an
alys
is
Dub
lin C
onno
lly
Wat
erfo
rd
Dub
linH
eust
on
Cor
k
Tral
ee
Gal
way
Wes
tpor
t
Bal
lina
Slig
o
Ath
lone
Ros
slar
e Eu
ropo
rt
Man
ulla
Jun
ctio
nPa
ssen
ger t
rans
fers
onl
y
Lim
eric
k Ju
nctio
nLim
eric
k
Kild
are
Porta
rling
ton
Bally
brop
hyEn
nis
Athe
nry
Mal
low
Glo
unth
aune
Mid
leto
n
Cob
h
Long
ford
May
noot
hC
lons
illa
Dun
boyn
e/M
3
Dro
ghed
a
Gre
ysto
nes
Wic
klow
Mul
linga
r
Car
low
Kilk
enny
Killa
rney
Gor
ey
Mal
ahid
eO
ranm
ore
Arkl
owHow
th s
pur
Cor
k
Gal
way
Tral
ee
Lim
eric
k
Wes
tpor
t/Bal
lina
Wat
erfo
rd
Slig
o
Bel
fast
Ros
slar
e
Lim
. Jct
–W
ater
ford
Lim
eric
k –
Bal
lybr
ophy
Cor
k co
mm
uter
Lim
eric
k –
Gal
way
Kild
are
Subu
rban
Nor
ther
n Su
burb
an
Wes
tern
Sub
urba
n
DA
RT
a b c d e f g h i j k l m n o p q
IÉro
ute
defin
ition
s fo
r rou
te p
rofit
abilit
y an
alys
is
1R
oute
def
initi
on

1320
1605
09_R
PA_T
T_20
15_F
inal
_Rep
ort_
DR
AFT.
pptx
Rev
enue
has
bee
n al
loca
ted
to ro
utes
to re
flect
act
ual t
rave
l pa
ttern
s
2R
even
ue a
lloca
tion
Appr
oach
to re
venu
e al
loca
tion
to ro
utes
>Ti
cket
reve
nue
at IÉ
is c
urre
ntly
cap
ture
d by
rout
e bu
t allo
cate
d to
a 'm
ain
rout
e' in
eac
h co
rrido
r. R
even
ue d
oes,
ho
wev
er, n
eed
to b
e al
loca
ted
to ro
utes
to re
flect
act
ual u
sage
pat
tern
s–
This
has
bee
n do
ne th
roug
h an
alys
is o
f rev
enue
on
indi
vidu
al O
D p
airs
and
allo
catio
n to
indi
vidu
al ro
utes
or s
hare
d be
twee
n ro
utes
whe
re th
ere
are
mul
tiple
jour
ney
oppo
rtuni
ties
>IÉ
has
a ra
nge
of s
yste
ms
whi
ch c
aptu
re p
asse
nger
info
rmat
ion,
incl
udin
g O
D in
form
atio
n, ti
cket
type
s an
d re
venu
e.
This
info
rmat
ion
is re
gist
ered
at p
oint
of s
ale
and
capt
ured
in a
num
ber o
f dat
abas
es b
efor
e co
nsol
idat
ed in
SAP
. The
re
is a
dis
tinct
ion
betw
een
thre
e m
ain
reve
nue
type
s:–
OD
repo
rting
: cap
turin
g th
e bu
lk o
f rev
enue
from
regu
lar t
icke
t sal
es–
Annu
al T
ax S
aver
(ATS
) and
Mon
thly
Tax
Sav
er (M
TS):
capt
urin
g re
venu
e fro
m ti
cket
sal
es s
uppo
rted
thro
ugh
the
tax
save
r sch
eme
–Fr
ee T
rave
l Sch
eme
(FTS
): ca
ptur
ing
reve
nue
from
tick
et s
ales
sup
porte
d th
roug
h th
e fre
e tra
vel s
chem
e
>R
olan
d Be
rger
has
use
d an
app
roac
h de
velo
ped
toge
ther
with
IÉw
hich
allo
cate
s re
venu
e fo
r whi
ch O
D in
form
atio
n is
kn
own
to in
divi
dual
rout
es o
r gro
ups
of ro
utes
whe
re m
ultip
le o
ppor
tuni
ties
exis
t. Th
is ta
kes
into
acc
ount
sto
ppin
g pa
ttern
s at
sta
tions
–Se
para
te a
ppro
ache
s ha
ve b
een
deve
lope
d fo
r rev
enue
for w
hich
OD
info
rmat
ion
is n
ot k
now
n, e
.g.,
som
e of
the
ATS
and
the
FTS
reve
nue
>Fo
llow
ing
deve
lopm
ent o
f a v
irtua
lly c
ompl
ete
OD
mat
rix fo
r IÉ'
sjo
urne
y pa
ttern
s an
d co
mm
ensu
rate
reve
nue,
an
allo
catio
n to
rout
es h
as b
een
unde
rtake
n. W
here
ther
e ar
e m
ultip
le ro
ute
poss
ibilit
ies
for a
n O
D p
air,
reve
nue
has
been
al
loca
ted
to th
ose
rout
es b
ased
on
serv
ice
frequ
enci
es ("
shar
ed" r
even
ue a
s op
pose
d to
"uni
que"
reve
nue)
Sour
ce: I
arnr
ód É
irean
n, R
olan
d Be
rger

1420
1605
09_R
PA_T
T_20
15_F
inal
_Rep
ort_
DR
AFT.
pptx
The
allo
catio
n of
TO
exp
endi
ture
s to
rout
es re
quire
d si
gnifi
cant
re-
defin
ition
of c
ost c
entre
s an
d co
st e
lem
ents
3TO
cos
t allo
catio
n
Appr
oach
to a
lloca
ting
TO e
xpen
ditu
res
to ro
utes
>TO
exp
endi
ture
s ar
e cu
rrent
ly h
eld
as c
ost e
lem
ents
in in
divi
dual
SAP
cos
t cen
tres
(and
in s
ome
case
s in
indi
vidu
al S
AP
inte
rnal
ord
ers)
. The
se c
ost c
entre
s an
d co
st e
lem
ents
hav
e no
refe
renc
e to
the
rout
es o
pera
ted
on th
e IÉ
netw
ork
>R
olan
d Be
rger
has
ther
efor
e, to
geth
er w
ith IÉ
, rev
iew
ed a
ll co
st c
entre
s an
d co
st e
lem
ents
in T
O's
oper
atio
ns a
nd
deve
lope
d an
app
roac
h to
allo
cate
exp
endi
ture
s–
Eith
er d
irect
ly to
indi
vidu
al ro
utes
whe
re th
is w
as p
ossi
ble
(e.g
., gu
ards
who
are
resp
onsi
ble
for a
spe
cific
rout
e), o
r–
To tr
ack
segm
ents
(e.g
. cle
rical
and
sta
tions
ope
ratio
ns) a
nd th
en a
lloca
ted
to ro
utes
usi
ng th
is tr
ack
segm
ent b
ased
on
freq
uenc
y of
rout
e us
age
>Th
e le
vel o
f req
uire
d di
sagg
rega
tion
and
allo
catio
n ke
ys d
iffer
bet
wee
n ro
utes
and
all
assu
mpt
ions
hav
e be
en v
alid
ated
th
roug
hout
the
proc
ess
of d
evel
opin
g th
e ap
proa
ch
>In
add
ition
, the
re is
a s
mal
l am
ount
of c
entra
l rev
enue
whi
ch is
allo
cate
d to
all
rout
es
Sour
ce: I
arnr
ód É
irean
n, R
olan
d Be
rger

1520
1605
09_R
PA_T
T_20
15_F
inal
_Rep
ort_
DR
AFT.
pptx
A m
ulti-
step
app
roac
h w
as re
quire
d to
allo
cate
IM e
xpen
ditu
res
from
cu
rrent
cos
t cen
tre c
olla
tion
to in
divi
dual
rout
es
4IM
cos
t allo
catio
n
Appr
oach
to a
lloca
ting
IM e
xpen
ditu
res
to ro
utes
>IM
exp
endi
ture
s ar
e cu
rrent
ly c
olle
cted
in fo
ur 'b
ucke
ts':
–C
CE
Chi
ef C
ivil
Engi
neer
–SE
TSi
gnal
ling,
Ele
ctrif
icat
ion,
Com
mun
icat
ions
–IM
OIn
frast
ruct
ure
Man
agem
ent O
pera
tions
–B&
FBu
ildin
gs &
Fac
ilitie
s
>As
a fi
rst s
tep
in th
e al
loca
tion
of th
ose
expe
nditu
res
to ro
utes
, int
erm
edia
ry c
ost b
ucke
ts h
ave
been
def
ined
on
a su
bdiv
isio
n-, r
egio
nal-
or tr
ack-
segm
ent l
evel
>Th
e co
st e
lem
ents
in th
ose
inte
rmed
iary
cos
t buc
kets
hav
e th
en b
een
allo
cate
d to
trac
k se
gmen
ts b
ased
on
a le
vel's
dis
-ag
greg
atio
n an
d al
loca
tion
keys
agr
eed
with
IM
>Th
e ba
sis
for t
he a
lloca
tion
of IM
exp
endi
ture
s fro
m tr
ack
segm
ent t
o in
divi
dual
rout
es is
rout
es' u
sage
of t
he re
spec
tive
track
seg
men
ts a
nd th
e tra
ck s
egm
ent's
exp
endi
ture
per
mai
n tra
ck-k
m–
Sim
ilarly
to T
O, t
here
is a
dis
tinct
ion
betw
een
uniq
ue a
nd s
hare
d ex
pend
iture
s fo
r tra
ck s
egm
ents
whi
ch a
re u
sed
by
one
vs. m
ultip
le ro
utes
Sour
ce: I
arnr
ód É
irean
n, R
olan
d Be
rger

1620
1605
09_R
PA_T
T_20
15_F
inal
_Rep
ort_
DR
AFT.
pptx
Ther
e ha
s be
en in
tens
ive
valid
atio
n of
dat
a, a
ssum
ptio
ns a
nd
findi
ngs
thro
ugho
ut th
e de
velo
pmen
t of r
oute
leve
l P&L
s
Valid
atio
n5 Ap
proa
ch to
val
idat
ion
thro
ugho
ut p
roce
ss
>Th
e co
mpl
exity
of t
he ro
ute
prof
itabi
lity
anal
ysis
, con
cept
ually
, as
it re
pres
ents
a d
ram
atic
cha
nge
in c
omm
erci
al
appr
oach
, and
in th
e de
tail,
with
larg
e am
ount
s of
dat
a al
loca
ted
in m
ulti-
step
app
roac
hes
to ro
utes
, req
uire
d a
thor
ough
ap
proa
ch to
val
idat
ion
thro
ugho
ut th
e de
velo
pmen
t of r
oute
leve
l cas
h flo
w s
tate
men
ts a
nd P
&Ls
>Th
e ke
y el
emen
t of t
he a
ppro
ach
to th
e co
ncep
tual
val
idat
ion
was
Ste
erin
g C
omm
ittee
mee
tings
with
par
ticip
atio
n by
the
IÉEx
ecut
ive
Gro
up a
nd th
e m
ain
stak
ehol
ders
, NTA
and
the
Dep
artm
ent o
f Tra
nspo
rt
>Va
lidat
ion
of d
ata,
allo
catio
n m
etho
dolo
gies
and
resu
lts w
as a
chie
ved
thro
ugh
clos
e in
tera
ctio
n w
ith m
ultip
le
man
agem
ent l
ayer
s w
ithin
IÉ. T
he k
ey s
teps
in th
e va
lidat
ion
proc
ess
wer
e:–
Early
agr
eem
ent o
f the
type
of d
ata
to b
e co
llect
ed fr
om a
nd th
roug
h IÉ
–R
evie
w o
f the
dat
a fo
r con
sist
ency
and
com
preh
ensi
vene
ss–
Join
t dev
elop
men
t of a
ppro
ache
s to
adj
ust o
r com
plem
ent d
ata
whe
re re
quire
d–
Rev
iew
of t
he re
sults
from
dat
a ad
just
ed th
roug
h th
ose
proc
esse
s fo
r con
sist
ency
and
'rea
lism
' and
am
endm
ent o
f the
ap
proa
ch if
requ
ired
–R
egul
ar p
rese
ntat
ion
of a
ssum
ptio
ns a
nd fi
ndin
gs in
the
Stee
ring
Com
mitt
ee fo
r crit
ical
revi
ew, e
xpla
inin
g di
ffere
nces
be
twee
n pe
rcei
ved
and
mod
elle
d re
ality
and
, whe
re re
quire
d, m
akin
g ad
just
men
ts
>Th
e su
cces
sful
runn
ing
of s
egm
ent a
naly
ses
(see
sep
arat
e re
port)
sup
ports
that
val
id a
ssum
ptio
ns h
ave
been
mad
e in
th
e va
rious
ana
lyse
s
Sour
ce: I
arnr
ód É
irean
n, R
olan
d Be
rger

1720
1605
09_R
PA_T
T_20
15_F
inal
_Rep
ort_
DR
AFT.
pptx
The
mod
el in
form
s th
e de
velo
pmen
t of b
ut d
oes
not c
alcu
late
a
busi
ness
cas
e fo
r org
anis
atio
nal o
r tra
in-s
ervi
ce c
hang
es
Inte
rpre
tatio
n of
resu
lts5 Cav
eats
rega
rdin
g in
terp
reta
tion
of re
sults
>Th
e ro
ute
prof
itabi
lity
mod
el h
as b
een
deve
lope
d to
und
erst
and
rout
e-le
vel c
omm
erci
al re
ality
for a
ll ro
utes
at I
É. A
nu
mbe
r of a
ssum
ptio
ns o
n th
e al
loca
tion
of re
venu
e an
d ex
pend
iture
s to
rout
es h
ave
been
mad
e th
roug
hout
this
de
velo
pmen
t pro
cess
:
>R
even
ues
have
, as
far a
s po
ssib
le, b
een
dete
rmin
ed o
n a
stat
ion-
to-s
tatio
n O
D b
asis
, how
ever
,–
The
true
geog
raph
ical
OD
, i.e
., in
clud
ing
thei
r sta
tion
acce
ss a
nd e
gres
s tri
ps, i
s no
t kno
wn,
–O
D re
venu
es h
ave
been
attr
ibut
ed to
rout
es o
n th
e ba
sis
of s
ervi
ce fr
eque
ncy,
ther
eby
negl
ectin
g ot
her f
acto
rs
influ
enci
ng p
asse
nger
s' ro
ute
choi
ces
(e.g
., av
aila
ble
capa
city
, qua
lity
of tr
ains
, spe
ed o
f con
nect
ion)
>Ex
pend
iture
allo
catio
ns h
ave
been
mad
e on
the
basi
s of
regi
onal
, ope
ratio
nal a
nd a
rang
e of
oth
er a
ssum
ptio
ns
>W
hile
the
rout
e le
vel P
&Ls
thus
dev
elop
ed re
pres
ent a
fair
refle
ctio
n of
real
ity fo
r com
paris
on a
nd p
riorit
isat
ion
purp
oses
, an
ana
lysi
s of
cha
nges
to s
ervi
ces
and
the
netw
ork
wou
ld re
quire
a m
uch
mor
e be
spok
e ap
proa
ch to
spe
cific
rout
es to
de
rive
com
mer
cial
impl
icat
ions
Sour
ce: I
arnr
ód É
irean
n, R
olan
d Be
rger

1820
1605
09_R
PA_T
T_20
15_F
inal
_Rep
ort_
DR
AFT.
pptx
C.
Sum
mar
y re
sults

1920
1605
09_R
PA_T
T_20
15_F
inal
_Rep
ort_
DR
AFT.
pptx
Ove
rall
cash
resu
lt pe
r pax
jour
ney
and
net r
esul
t per
pax
jour
ney
are
in li
ne w
ith la
st y
ear's
rout
e pr
ofita
bilit
y ex
erci
se
Sour
ce: I
arnr
ód É
irean
n, R
olan
d Be
rger
-7.6 -6.9
-8.7 -7
.6
Ove
rall
net r
esul
t / p
ax jo
urne
y [E
UR
]-5
.8-5.5
Ove
rall
cash
resu
lt / p
ax jo
urne
y [E
UR
]
Actu
als
2014
Actu
als
2015
AEC
OM
201
5
Actu
als
2014
vs
Actu
als
2015
vs
AEC
OM
201
5 re
sults
1)/ p
axjo
urne
y
>Th
e ov
eral
l cas
h re
sult
per p
asse
nger
jour
ney
impr
oved
from
EU
R -7
.6 to
EU
R -6
.9 fr
om 2
014
to
2015
aris
ing
prim
arily
from
a s
trong
reve
nue
perfo
rman
ce a
nd a
full
year
effe
ct o
f the
pay
de
al2)
>Th
e ov
eral
l net
resu
lt pe
r pas
seng
er jo
urne
y de
crea
sed
from
EU
R -5
.5 to
EU
R -5
.8 fr
om 2
014
to 2
015
aris
ing
from
a re
duce
d le
vel o
f ca
pita
lisat
ion
of c
osts
from
one
yea
r to
the
next
>Th
e im
pact
of t
he re
quire
d le
vel o
f IM
spe
nd to
re
tain
the
infra
stru
ctur
e in
a s
tead
y-st
ate
(AEC
OM
) add
s c.
EU
R 2
per
pax
jour
ney
to th
e Ac
tual
s 20
15 re
sults
–an
incr
ease
of 2
5-30
%
1) P
asse
nger
rout
e to
tal e
xclu
ding
any
gov
ernm
ent s
ubsi
dies
(e.g
. Pub
lic S
ervi
ce O
blig
atio
n (P
SO),
Mul
ti-An
nual
Con
tract
(MAC
)); 2
) Red
uctio
nin
gro
ss p
ay

2020
1605
09_R
PA_T
T_20
15_F
inal
_Rep
ort_
DR
AFT.
pptx
Som
e of
IÉ’s
rout
e re
quire
ver
y hi
gh le
vels
of c
ash
per p
asse
nger
jo
urne
y to
bre
akev
en a
t cur
rent
mai
nten
ance
leve
ls
Cas
h re
sult
per p
asse
nger
jour
ney
by ro
ute
[EU
R /
pax
jour
ney]
Sour
ce: I
arnr
ód É
irean
n, R
olan
d Be
rger
DART-0.9
-1.1
Western Suburban-3.2
-4.7
Northern Suburban-4.8
-4.8
Kildare Suburban-4.9
-4.6
Limerick -Galway-44.0
-55.0
Cork commuter-9.6
-10.5
Limerick -Ballybrophy-551.9
-417.2
Lim. Jct -Waterford-362.4
-18.4
-25.0
Tralee-15.6
-17.9
Galway-8.5
-10.4
Cork-22.1
-24.1
-360.2
Rosslare-29.1
-30.8
Belfast-9.4
-15.1
Sligo-20.0
-21.9
Waterford-10.8
-12.7
Westport/Ballina-26.9
-25.7
Limerick
ab
cd
ef
gh
ij
kl
mn
op
q
Cas
h re
sult
-Act
uals
201
5C
ash
resu
lt -A
ctua
ls 2
014
1) C
ash
resu
lt is
afte
r far
ebox
and
befo
re e
xcep
tiona
l item
s, d
epre
ciat
ion,
am
ortis
atio
nan
d ca
pita
lisat
ion;
2) A
ll re
sults
exc
lude
any
gov
ernm
ent f
undi
ng (e
.g. P
SO, M
AC)
NB:
The
leve
l of a
ctua
l exp
endi
ture
incu
rred
in 2
015
does
not
refle
ct th
e AE
CO
M s
pend
requ
ired
for s
tead
y-st
ate
oper
atio
n

2120
1605
09_R
PA_T
T_20
15_F
inal
_Rep
ort_
DR
AFT.
pptx
Som
e of
IÉ’s
rout
e re
quire
ver
y hi
gh le
vels
of c
ash
per p
asse
nger
jo
urne
y to
bre
akev
en a
t cur
rent
mai
nten
ance
leve
ls
Cas
h re
sult
per p
asse
nger
jour
ney
by ro
ute
[EU
R /
pax
jour
ney]
Sour
ce: I
arnr
ód É
irean
n, R
olan
d Be
rger
-1.1
Western Suburban
-3.2-4.7
Northern Suburban
-4.8-4.8
Kildare Suburban
-4.9-4.6
Limerick -Galway
-44.0-55.0
Cork commuter
-9.6-10.5
Limerick -Ballybrophy
-551.9-417.2
Lim. Jct -Waterford
-362.4-360.2
Rosslare-29.1-30.8
Belfast
-9.4-15.1
Sligo
-20.0-21.9
Waterford
-10.8-12.7
Westport/Ballina
-26.9-25.7
Limerick
-18.4-25.0
Tralee
-15.6-17.9
Galway
-8.5-10.4
Cork-0.9
-24.1
-25.3
-11.3
-24.8
-26.0
-33.7
-13.8
-28.4
-8.7
-22.1
-491.5
-761.6
-12.2
-68.1
-5.1
-5.3
-5.5
-0.7 DART
-39.6
ab
cd
ef
gh
ij
kl
mn
op
q
Cas
h re
sult
-Act
uals
201
4C
ash
resu
lt -A
ctua
ls 2
015
Cas
h re
sult
-AEC
OM
201
5
1) C
ash
resu
lt is
afte
r far
ebox
and
befo
re e
xcep
tiona
l item
s, d
epre
ciat
ion,
am
ortis
atio
nan
d ca
pita
lisat
ion;
2) A
ll re
sults
exc
lude
any
gov
ernm
ent f
undi
ng (e
.g. P
SO, M
AC)

2220
1605
09_R
PA_T
T_20
15_F
inal
_Rep
ort_
DR
AFT.
pptx
Com
pare
d to
Act
uals
201
4, ro
ute
perfo
rman
ce h
as b
een
cons
iste
nt
in te
rms
of n
et re
sult
/ pax
jour
ney
Net
resu
lt / p
ax jo
urne
y (a
scen
ding
ord
er) c
ompa
rison
A20
15vs
A20
14vs
AEC
OM
2015
Ban
d
EUR
-200
to -3
00
Sour
ce: I
arnr
ód É
irean
n, R
olan
d Be
rger
≤EU
R -1
EUR
-1 to
-5
EUR
-6 to
-10
EUR
-11
to -2
0
EUR
-21
to -7
0
EUR
-301
to -5
00
Act
uals
201
4
>Li
mer
ick
Junc
tion
–W
ater
ford
>D
ART
>N
orth
ern
subu
rban
>W
este
rn s
ubur
ban
>Ki
ldar
e su
burb
an
>D
ublin
–G
alw
ay>
Dub
lin –
Wat
erfo
rd>
Cor
k co
mm
uter
>D
ublin
–Tr
alee
>D
ublin
–Sl
igo
>D
ublin
–Be
lfast
>D
ublin
–Li
mer
ick
>D
ublin
–W
estp
ort/B
allin
a>
Dub
lin –
Cor
k>
Dub
lin –
Ros
slar
e>
Lim
eric
k –
Gal
way
>Li
mer
ick
–Ba
llybr
ophy
AEC
OM
201
5
>D
ART
>D
ublin
–Be
lfast
>D
ublin
–G
alw
ay>
Cor
k co
mm
uter
>D
ublin
–W
ater
ford
>D
ublin
–Tr
alee
>D
ublin
–Sl
igo
>D
ublin
–Li
mer
ick
>D
ublin
–C
ork
>D
ublin
–W
estp
ort/B
allin
a>
Dub
lin –
Ros
slar
e>
Lim
eric
k -G
alw
ay
>Li
mer
ick
–Ba
llybr
ophy
EUR
-501
to -8
00
Act
uals
201
5
>D
ART
>W
este
rn s
ubur
ban
>Ki
ldar
e su
burb
an>
Nor
ther
n su
burb
an
>D
ublin
–G
alw
ay>
Cor
k co
mm
uter
>D
ublin
–W
ater
ford
>D
ublin
–Be
lfast
>D
ublin
–Tr
alee
>D
ublin
–Li
mer
ick
>D
ublin
–C
ork
>D
ublin
–Sl
igo
>D
ublin
–W
estp
ort/B
allin
a>
Dub
lin –
Ros
slar
e>
Lim
eric
k –
Gal
way
>Li
mer
ick
Junc
tion
–W
ater
ford
>
Lim
eric
k –
Bally
brop
hy>
Lim
eric
k Ju
nctio
n –
Wat
erfo
rd
>Ki
ldar
e su
burb
an>
Nor
ther
n su
burb
an>
Wes
tern
sub
urba
n

2320
1605
09_R
PA_T
T_20
15_F
inal
_Rep
ort_
DR
AFT.
pptx
D.
Rou
te p
rofit
abilit
y re
sults
Act
uals
201
5

2420
1605
09_R
PA_T
T_20
15_F
inal
_Rep
ort_
DR
AFT.
pptx
Con
tent
s of
this
sec
tion
IÉov
eral
l P&L
Sum
mar
y ro
ute-
leve
l P&L
s
Rou
te fi
nanc
ial p
erfo
rman
ce c
ompa
rison
1 2 3
Indi
vidu
al ro
ute
P&Ls
4

2520
1605
09_R
PA_T
T_20
15_F
inal
_Rep
ort_
DR
AFT.
pptx
IÉ s
how
s a
cont
ribut
ion
to c
entra
l exp
endi
ture
s of
EU
R (1
12)m
and
ca
sh re
sult
of E
UR
(296
)m a
fter a
ttrib
utio
n of
cen
tral e
xpen
ditu
res
Ove
rall
Iarn
ród
Éire
ann
resu
lt [E
UR
m] –
Actu
als
2015
, tim
etab
le 2
015
Sour
ce: I
arnr
ód É
irean
n, R
olan
d Be
rger
31
4
111
2
188
204
Cash result
-332
Central revenues
Revenues
-296
220
53916
5
Exceptionals
Central expenditures
-221
11
128
2
-112
Financing
Net depreciation
Contrib. to central exp.1)
Capitalisation
Expenditures
Amortisation
Net result
Non
-rail
rela
ted
Frei
ght
Non
-fare
box
pax
reve
nue
Pax
reve
nue
Inte
rest
Tota
l
Trai
n-ba
sed
Bala
nce
shee
t cha
nges
Cen
tral g
roup
cha
rges
BU c
harg
es
Geo
grap
hy-b
ased
1IÉ
over
all P
&L
1) C
ontri
butio
n to
cen
tral e
xpen
ditu
res

2620
1605
09_R
PA_T
T_20
15_F
inal
_Rep
ort_
DR
AFT.
pptx
Sour
ce: I
arnr
ód É
irean
n, R
olan
d Be
rger
17 ro
utes
hav
e be
en d
efin
ed fo
r the
rout
e pr
ofita
bilit
y an
alys
is
Dub
lin C
onno
lly
Wat
erfo
rd
Dub
linH
eust
on
Cor
k
Tral
ee
Gal
way
Wes
tpor
t
Bal
lina
Slig
o
Ath
lone
Ros
slar
e Eu
ropo
rt
Man
ulla
Jun
ctio
nPa
ssen
ger t
rans
fers
onl
y
Lim
eric
k Ju
nctio
nLim
eric
k
Kild
are
Porta
rling
ton
Bally
brop
hyEn
nis
Athe
nry
Mal
low
Glo
unth
aune
Mid
leto
n
Cob
h
Long
ford
May
noot
hC
lons
illa
Dun
boyn
e/M
3
Dro
ghed
a
Gre
ysto
nes
Wic
klow
Mul
linga
r
Car
low
Kilk
enny
Killa
rney
Gor
ey
Mal
ahid
eO
ranm
ore
Arkl
owHow
th s
pur
Cor
k
Gal
way
Tral
ee
Lim
eric
k
Wes
tpor
t/Bal
lina
Wat
erfo
rd
Slig
o
Belfa
st
Ros
slar
e
a b c d e f g h i
Lim
. Jct
–W
ater
ford
Lim
eric
k –
Bally
brop
hy
Cor
k co
mm
uter
Lim
eric
k –
Gal
way
Kild
are
Subu
rban
Nor
ther
n Su
burb
an
Wes
tern
Sub
urba
n
DAR
T
j k l m n o p q
IÉro
ute
defin
ition
s fo
r rou
te p
rofit
abilit
y an
alys
is
2Su
mm
ary
rout
e-le
vel P
&Ls

2720
1605
09_R
PA_T
T_20
15_F
inal
_Rep
ort_
DR
AFT.
pptx
Sum
mar
y ro
ute
leve
l P&L
s –
2015
act
uals
Cor
kG
alw
ayTr
alee
Lim
eric
kW
estp
ort/B
allin
aW
ater
ford
Slig
oB
elfa
stR
ossl
are
Lim
. Jct
–W
ater
ford
Lim
eric
k –
Bal
lybr
ophy
Cor
k co
mm
uter
Lim
eric
k –
Gal
way
Kild
are
Subu
rban
Nor
ther
n Su
burb
anW
este
rn S
ubur
ban
Rou
te le
vel P
&L (A
ctua
ls 2
015)
[EU
R '0
00]
Sour
ce: I
arnr
ód É
irean
n, R
olan
d Be
rger
2
Rev
enue
15,8
978,
793
8,24
75,
074
5,74
86,
443
6,05
49,
162
1,52
310
6 382,
598
505 77
5,64
798
9
-22,
061
-9,4
72-4
,536
-6,3
83-7
,658
-6,5
49-1
2,27
4-6
,073
-7,8
71-5
,084
-4,9
88-7
,653
-3,1
12-6
,231
-16,
147
-9,4
46
-6,1
64-6
793,
711
-1,3
08-1
,910
-106
-6,2
193,
088
-6,3
48-4
,978
-4,9
50-5
,054
-2,6
07-6
,154
-10,
500
-8,4
58
Cos
tN
et re
sult
Uni
que
Rev
enue
Cos
tN
et re
sult
11,8
498,
053
2,82
53,
760
4,11
25,
063
4,15
51,
314
2,86
711
210
92,
722
925
10,1
6612
,764
12,3
23
-26,
712
-12,
757
-8,5
56-1
2,02
0-1
2,53
1-1
1,94
5-7
,643
-4,1
29-6
,497
-781
-913
-6,5
08-3
,980
-10,
407
-10,
269
-9,4
90
-14,
863
-4,7
05-5
,731
-8,2
60-8
,419
-6,8
82-3
,488
-2,8
15-3
,630
-669
-804
-3,7
86-3
,055
-241
2,49
52,
833
Shar
ed
EBIT
DA
C1)
-21,
027
-5,3
84-2
,020
-9,5
69-1
0,32
9-6
,988
-9,7
07 274
-9,9
78-5
,647
-5,7
54-8
,840
-5,6
61-6
,395
-8,0
04-5
,625
Cas
h re
sult
-48,
512
-16,
143
-9,5
63-1
7,74
2-2
1,00
1-1
4,94
0-2
2,43
8-8
,037
-16,
986
-9,1
64-8
,456
-11,
922
-8,5
74-1
0,96
7-2
0,87
9-1
2,33
7
Net
resu
lt
-38,
547
-11,
981
-8,0
82-1
4,81
0-1
7,84
5-1
1,34
4-2
0,53
1-9
,418
-15,
901
-9,0
47-7
,880
-9,4
80-8
,516
-6,7
68-1
5,60
9-1
0,08
0D
AR
T16
,007
-33,
155
-17,
148
26,6
85-1
1,63
715
,049
-2,0
99-1
5,12
4-1
2,30
9
Prof
itabi
lity
Sum
mar
y ro
ute-
leve
l P&
Ls
1) E
BITD
AC=
Earn
ings
Bef
ore
Inte
rest
, Tax
, Dep
reci
atio
n, A
mor
tisat
ion
and
Cap
italis
atio
n; w
hich
is th
e re
sult
befo
re c
entra
l exp
endi
ture
s; 2
) Pas
seng
er ro
ute
tota
l onl
y (i.
e. e
xclu
ding
fre
ight
resu
lts a
nd n
on-ra
il re
late
d re
sults
)
Pass
enge
r rou
te to
tal2)
92,9
09-1
68,6
92-7
5,78
310
9,80
4-1
56,7
74-4
6,96
9-1
22,7
52-2
72,7
84-2
28,1
47

2820
1605
09_R
PA_T
T_20
15_F
inal
_Rep
ort_
DR
AFT.
pptx
Rou
te c
ash
retu
rn o
n sa
les
varie
s w
idel
y w
ith s
ome
rout
es
expe
rienc
ing
very
sig
nific
ant n
egat
ive
cash
flow
Rou
te re
turn
on
sale
s (c
ash
resu
lt ov
er re
venu
e) [%
]
-35%
-93%
-113
%-1
07%
-600
%
-224
%-3
87%
-77%
-220
%-1
30%
-213
%-2
01%
-86%
-96%
-175
%
Sligo
Waterford
Westport/Ballina
Limerick
Tralee
Galway
Cork
Limerick -Galway
Cork commuter
Limerick -Ballybrophy
-5,7
37%
Lim. Jct -Waterford
-4,2
14%
Rosslare
Belfast
DART
Western Suburban
Northern Suburban
Kildare Suburban
Sour
ce: I
arnr
ód É
irean
n, R
olan
d Be
rger
ab
cd
ef
gh
ij
kl
mn
op
q
3R
oute
fina
ncia
l per
form
ance
com
paris
on

2920
1605
09_R
PA_T
T_20
15_F
inal
_Rep
ort_
DR
AFT.
pptx
Rou
te n
et re
turn
on
sale
s di
ffers
wid
ely
with
som
e ro
utes
ex
perie
ncin
g ve
ry s
igni
fican
t los
ses
Rou
te re
turn
on
sale
s (n
et re
sult
over
reve
nue)
[%]
Sour
ce: I
arnr
ód É
irean
n, R
olan
d Be
rger
3
DART
29%
Western Suburban
76%
Northern Suburban
85%
Kildare Suburban
66%
Limerick -Galway
596%
Cork commuter
178%
Limerick -Ballybrophy
5,34
6%
Lim. Jct -Waterford
4,16
0%
Rosslare
362%
Belfast
90%
Sligo
201%
Waterford
99%
Westport/Ballina
181%
Limerick
168%
Tralee
73%
Galway
71%
Cork
139%
Rou
te fi
nanc
ial p
erfo
rman
ce c
ompa
rison
ab
cd
ef
gh
ij
kl
mn
op
q

3020
1605
09_R
PA_T
T_20
15_F
inal
_Rep
ort_
DR
AFT.
pptx
Som
e of
IÉ's
rout
es e
xper
ienc
e ve
ry h
igh
leve
ls o
f neg
ativ
e ca
shflo
wpe
r pas
seng
er jo
urne
y
Cas
h re
sult
per p
asse
nger
jour
ney
by ro
ute
[EU
R /
pax
jour
ney]
Sour
ce: I
arnr
ód É
irean
n, R
olan
d Be
rger
3
-0.9
-3.2
-4.8
-4.9
-44.
0
-9.6
-29.
1-9
.4-2
0.0
-10.
8-2
6.9
-18.
4-1
5.6
-8.5
-22.
1
DART
Western Suburban
Northern Suburban
Kildare Suburban
Limerick -Galway
Cork commuter
Limerick -Ballybrophy
-551
.9
Lim. Jct -Waterford
-362
.4
Rosslare
Belfast
Sligo
Waterford
Westport/Ballina
Limerick
Tralee
Galway
CorkRou
te fi
nanc
ial p
erfo
rman
ce c
ompa
rison
ab
cd
ef
gh
ij
kl
mn
op
q

3120
1605
09_R
PA_T
T_20
15_F
inal
_Rep
ort_
DR
AFT.
pptx
Som
e of
IÉ's
rout
es e
xper
ienc
e ve
ry h
igh
leve
ls o
f net
loss
es p
er
pass
enge
r jou
rney
Net
resu
lt pe
r pas
seng
er jo
urne
y by
rout
e [E
UR
/ pa
x jo
urne
y]
Sour
ce: I
arnr
ód É
irean
n, R
olan
d Be
rger
3
-0.7
-2.6
-3.6
-3.0
-43.
7
-7.6
-27.
2-1
1.0
-18.
3-8
.2-2
2.8
-15.
4-1
3.2
-6.3
-17.
5
DART
Western Suburban
Northern Suburban
Kildare Suburban
Limerick -Galway
Cork commuter
Limerick -Ballybrophy
-514
.3
Lim. Jct -Waterford
-357
.7
Rosslare
Belfast
Sligo
Waterford
Westport/Ballina
Limerick
Tralee
Galway
CorkRou
te fi
nanc
ial p
erfo
rman
ce c
ompa
rison
ab
cd
ef
gh
ij
kl
mn
op
q

3220
1605
09_R
PA_T
T_20
15_F
inal
_Rep
ort_
DR
AFT.
pptx
Dub
lin –
Cor
k ha
s a
nega
tive
EUR
(21)
m c
ashf
low
befo
re a
nd E
UR
(4
9)m
afte
r allo
catio
n of
cen
tral e
xpen
ditu
res,
resp
ectiv
ely
Dub
lin-C
ork
resu
lt [E
UR
m]–
Actu
als
2015
Sour
ce: I
arnr
ód É
irean
n, R
olan
d Be
rger
1) S
hare
d re
venu
es in
clud
e O
D-p
air r
even
ues
for H
eust
on -
Cor
k, c
ar p
ark
and
prop
erty
& re
tail
reve
nues
; 2) S
hare
d ex
pend
iture
s in
clud
e sh
ared
sta
tion
expe
nditu
res
and
shar
ed IM
ex
pend
iture
s fo
r the
trac
k se
gmen
ts b
etw
een
Heu
ston
and
Cor
k
16.4
Cash result
26.7
Central expenditures0.
0
Net result
Capitalisation
-48.
5
Net Depreciation
6.4
27.3
Central revenues
Unique + sharedEBITDAC
-21.
2
Shared expenditures2)
Shared revenues1)
11.8
Unique EBITDAC
-6.4
Unique expenditures
-22.
3
1.9
Unique revenues
15.9
Exceptionals
-38.
5To
tal
Bala
nce
shee
t cha
nges
Cen
tral g
roup
cha
rges
BU c
harg
es
Geo
grap
hy-b
ased
Trai
n-ba
sed
Non
-rail
rela
ted
Frei
ght
Non
-fare
box
pax
reve
nue
Pax
reve
nue
aC
ork
4

3320
1605
09_R
PA_T
T_20
15_F
inal
_Rep
ort_
DR
AFT.
pptx
Dub
lin –
Gal
way
has
a ne
gativ
e EU
R (6
)m c
ashf
low
befo
re a
nd
EUR
(16)
m a
fter a
lloca
tion
of c
entra
l exp
endi
ture
s, re
spec
tivel
y
Dub
lin-G
alw
ay re
sult
[EU
R m
]–Ac
tual
s 20
15
Sour
ce: I
arnr
ód É
irean
n, R
olan
d Be
rger
1) S
hare
d re
venu
es in
clud
e O
D-p
air r
even
ues
for H
eust
on -
Gal
way
, car
par
k an
d pr
oper
ty &
reta
il re
venu
es; 2
) Sha
red
expe
nditu
res
incl
ude
shar
ed s
tatio
n ex
pend
iture
s an
d sh
ared
IM
expe
nditu
res
for t
he tr
ack
segm
ents
bet
wee
n H
eust
on a
nd G
alw
ay
bG
alw
ay4
Unique revenues
-5.5
Unique expenditures
Central revenues10
.6
Shared expenditures2)12
.8
Shared revenues1)
Net result
Unique EBITDAC
8.1
-9.6
-0.8
1.2
-12.
0
Capitalisation
6.1
Net Depreciation
1.9
Exceptionals
Unique + sharedEBITDAC
0.1
Cash result
-16.
1Central expenditures
8.8
Non
-rail
rela
ted
Frei
ght
Bala
nce
shee
t cha
nges
Tota
l
Cen
tral g
roup
cha
rges
BU c
harg
es
Geo
grap
hy-b
ased
Trai
n-ba
sed
Pax
reve
nue
Non
-fare
box
pax
reve
nue

3420
1605
09_R
PA_T
T_20
15_F
inal
_Rep
ort_
DR
AFT.
pptx
Dub
lin –
Tral
ee h
as a
neg
ativ
e EU
R (2
)m c
ashf
low
befo
re a
nd E
UR
(1
0)m
afte
r allo
catio
n of
cen
tral e
xpen
ditu
res,
resp
ectiv
ely
Dub
lin-T
rale
e re
sult
[EU
R m
]–Ac
tual
s 20
15
Sour
ce: I
arnr
ód É
irean
n, R
olan
d Be
rger
1) S
hare
d re
venu
es in
clud
e O
D-p
air r
even
ues
for H
eust
on -
Tral
ee, c
ar p
ark
and
prop
erty
& re
tail
reve
nues
; 2) S
hare
d ex
pend
iture
s in
clud
e sh
ared
sta
tion
expe
nditu
res
and
shar
ed IM
ex
pend
iture
s fo
r the
trac
k se
gmen
ts b
etw
een
Heu
ston
and
Tra
lee
cTr
alee
4
Unique expenditures
3.6
2.8
-2.2
Shared expenditures2)8.
6
Shared revenues1)
Unique EBITDAC
Unique + sharedEBITDAC
Central revenues7.
4 Central expenditures1.
2
Exceptionals
0.0
0.0
-9.6
-4.7
Net result
-8.1
Cash result
2.7
Net Depreciation
Unique revenues
8.2
Capitalisation
Tota
l
Bala
nce
shee
t cha
nges
Cen
tral g
roup
cha
rges
BU c
harg
es
Geo
grap
hy-b
ased
Trai
n-ba
sed
Non
-rail
rela
ted
Frei
ght
Non
-fare
box
pax
reve
nue
Pax
reve
nue

3520
1605
09_R
PA_T
T_20
15_F
inal
_Rep
ort_
DR
AFT.
pptx
Dub
lin –
Lim
eric
k ha
s a
nega
tive
EUR
(10)
m c
ashf
low
befo
re a
nd
EUR
(18)
m a
fter a
lloca
tion
of c
entra
l exp
endi
ture
s, re
spec
tivel
y
Dub
lin-L
imer
ick
resu
lt [E
UR
m]–
Actu
als
2015
Sour
ce: I
arnr
ód É
irean
n, R
olan
d Be
rger
1) S
hare
d re
venu
es in
clud
e O
D-p
air r
even
ues
for H
eust
on -
Lim
eric
k, c
ar p
ark
and
prop
erty
& re
tail
reve
nues
; 2) S
hare
d ex
pend
iture
s in
clud
e sh
ared
sta
tion
expe
nditu
res
and
shar
ed IM
ex
pend
iture
s fo
r the
trac
k se
gmen
ts b
etw
een
Heu
ston
and
Lim
eric
k
dLi
mer
ick
4
-1.4
Unique expenditures
-6.5
1.4
Unique revenues
5.1
Net result
-14.
8
0.0
Capitalisation
4.4
Net Depreciation
Exceptionals
0.0
Cash result
-17.
7
Central expenditures
8.1
Central revenues
Unique + sharedEBITDAC
3.8
-9.7
Shared expenditures2)
12.0
Shared revenues1)
Unique EBITDAC
Bala
nce
shee
t cha
nges
Cen
tral g
roup
cha
rges
Tota
l
BU c
harg
es
Geo
grap
hy-b
ased
Trai
n-ba
sed
Non
-rail
rela
ted
Frei
ght
Non
-fare
box
pax
reve
nue
Pax
reve
nue

3620
1605
09_R
PA_T
T_20
15_F
inal
_Rep
ort_
DR
AFT.
pptx
Dub
lin –
Wes
tpor
t/Bal
lina
has
a ne
gativ
e EU
R (1
1)m
cas
hflo
wbe
fore
and
EU
R (2
1)m
afte
r allo
catio
n of
cen
tral e
xpen
ditu
res
Dub
lin-W
estp
ort/B
allin
are
sult
[EU
R m
]–Ac
tual
s 20
15
Sour
ce: I
arnr
ód É
irean
n, R
olan
d Be
rger
1) S
hare
d re
venu
es in
clud
e O
D-p
air r
even
ues
for H
eust
on –
Wes
tpor
t/Bal
lina,
car
par
k an
d pr
oper
ty &
reta
il re
venu
es; 2
) Sha
red
expe
nditu
res
incl
ude
shar
ed s
tatio
n ex
pend
iture
s an
d sh
ared
IM e
xpen
ditu
res
for t
he tr
ack
segm
ents
bet
wee
n H
eust
on a
nd W
estp
ort/B
allin
a
eW
estp
ort/B
allin
a4
Capitalisation
5.0
Net Depreciation
1.7
Exceptionals
0.1
Cash result
-21.
0Central expenditures
10.5
Central revenues
Unique + sharedEBITDAC
-10.
5
Shared expenditures2)
12.5
Net result
4.1
Unique EBITDAC
-2.1
Unique expenditures
Shared revenues1)
0.8
Unique revenues
5.7
-17.
8
-7.9
Bala
nce
shee
t cha
nges
BU c
harg
es
Tota
l
Cen
tral g
roup
cha
rges
Geo
grap
hy-b
ased
Trai
n-ba
sed
Non
-rail
rela
ted
Frei
ght
Non
-fare
box
pax
reve
nue
Pax
reve
nue

3720
1605
09_R
PA_T
T_20
15_F
inal
_Rep
ort_
DR
AFT.
pptx
Dub
lin –
Wat
erfo
rd h
as a
neg
ativ
e EU
R (7
)m c
ashf
low
befo
re a
nd
EUR
(15)
m a
fter a
lloca
tion
of c
entra
l exp
endi
ture
s, re
spec
tivel
y
Dub
lin-W
ater
ford
resu
lt [E
UR
m]–
Actu
als
2015
Sour
ce: I
arnr
ód É
irean
n, R
olan
d Be
rger
1) S
hare
d re
venu
es in
clud
e O
D-p
air r
even
ues
for H
eust
on –
Wat
erfo
rd, c
ar p
ark
and
prop
erty
& re
tail
reve
nues
; 2) S
hare
d ex
pend
iture
s in
clud
e sh
ared
sta
tion
expe
nditu
res
and
shar
ed
IM e
xpen
ditu
res
for t
he tr
ack
segm
ents
bet
wee
n H
eust
on a
nd W
ater
ford
fW
ater
ford
4
0.1
Cash result
Central expenditures
11.9
7.8
Central revenues
Unique + sharedEBITDAC
-7.1
-14.
9
Shared expenditures2)
Shared revenues1)
5.1
Net result
-11.
3
Capitalisation
5.1
Net Depreciation
1.3
Exceptionals
0.6
Unique revenues
6.4
Unique EBITDAC
-0.2
Unique expenditures
-6.7
Bala
nce
shee
t cha
nges
Tota
l
Cen
tral g
roup
cha
rges
BU c
harg
es
Geo
grap
hy-b
ased
Trai
n-ba
sed
Non
-rail
rela
ted
Frei
ght
Non
-fare
box
pax
reve
nue
Pax
reve
nue

3820
1605
09_R
PA_T
T_20
15_F
inal
_Rep
ort_
DR
AFT.
pptx
Dub
lin –
Slig
o ha
s a
nega
tive
EUR
(10)
m c
ashf
low
befo
re a
nd E
UR
(2
2)m
afte
r allo
catio
n of
cen
tral e
xpen
ditu
res,
resp
ectiv
ely
Dub
lin-S
ligo
resu
lt [E
UR
m]–
Actu
als
2015
Sour
ce: I
arnr
ód É
irean
n, R
olan
d Be
rger
1) S
hare
d re
venu
es in
clud
e O
D-p
air r
even
ues
for C
onno
lly –
Slig
o, c
ar p
ark
and
prop
erty
& re
tail
reve
nues
; 2) S
hare
d ex
pend
iture
s in
clud
e sh
ared
sta
tion
expe
nditu
res
and
shar
ed IM
ex
pend
iture
s fo
r the
trac
k se
gmen
ts b
etw
een
Con
nolly
and
Slig
o
gSl
igo
4
-12.
5
3.1
Unique revenues
6.1
Net result
-20.
5
Capitalisation
4.5
Central revenues
Unique + sharedEBITDAC
-9.9
Shared expenditures2)
7.6
Shared revenues1)
4.2
Unique EBITDAC
-6.4
Unique expenditures
Central expenditures-2
2.4 Cash result
0.3
12.5
Exceptionals
2.3 Net Depreciation
Tota
l
Bala
nce
shee
t cha
nges
Cen
tral g
roup
cha
rges
BU c
harg
es
Geo
grap
hy-b
ased
Trai
n-ba
sed
Non
-rail
rela
ted
Frei
ght
Non
-fare
box
pax
reve
nue
Pax
reve
nue

3920
1605
09_R
PA_T
T_20
15_F
inal
_Rep
ort_
DR
AFT.
pptx
Dub
lin –
Belfa
st h
as a
pos
itive
EU
R 0
.2m
cash
flow
befo
re a
nd
nega
tive
EUR
(8)m
cas
hflo
waf
ter a
lloca
tion
of c
entra
l exp
endi
ture
s
Dub
lin-B
elfa
st re
sult
[EU
R m
]–Ac
tual
s 20
15
Sour
ce: I
arnr
ód É
irean
n, R
olan
d Be
rger
1) S
hare
d re
venu
es in
clud
e O
D-p
air r
even
ues
for C
onno
lly –
Belfa
st, c
ar p
ark
and
prop
erty
& re
tail
reve
nues
; 2) S
hare
d ex
pend
iture
s in
clud
e sh
ared
sta
tion
expe
nditu
res
and
shar
ed IM
ex
pend
iture
s fo
r the
trac
k se
gmen
ts b
etw
een
Con
nolly
and
Bel
fast
hB
elfa
st4
-9.4
Capitalisation
1.3
Net Depreciation
2.6
Exceptionals
0.1
Cash result
-8.0
Central expenditures
8.3
Central revenues
Unique + sharedEBITDAC
0.2
Shared expenditures2)
Net result
Shared revenues1)
1.3
Unique EBITDAC
3.1
4.1
-6.1
0.9
Unique revenues
9.2
Unique expenditures
Bala
nce
shee
t cha
nges
Tota
l
Cen
tral g
roup
cha
rges
BU c
harg
es
Geo
grap
hy-b
ased
Trai
n-ba
sed
Non
-rail
rela
ted
Frei
ght
Non
-fare
box
pax
reve
nue
Pax
reve
nue

4020
1605
09_R
PA_T
T_20
15_F
inal
_Rep
ort_
DR
AFT.
pptx
Dub
lin –
Ros
slar
eha
s a
nega
tive
EUR
(10)
m c
ashf
low
befo
re a
nd
EUR
(17)
m a
fter a
lloca
tion
of c
entra
l exp
endi
ture
s, re
spec
tivel
y
Dub
lin-R
ossl
are
resu
lt [E
UR
m]–
Actu
als
2015
Sour
ce: I
arnr
ód É
irean
n, R
olan
d Be
rger
iR
ossl
are
1) S
hare
d re
venu
es in
clud
e O
D-p
air r
even
ues
for C
onno
lly -
Ros
slar
e, c
ar p
ark
and
prop
erty
& re
tail
reve
nues
; 2) S
hare
d ex
pend
iture
s in
clud
e sh
ared
sta
tion
expe
nditu
res
and
shar
ed IM
ex
pend
iture
s fo
r the
trac
k se
gmen
ts b
etw
een
Con
nolly
and
Ros
slar
e
4
2.9
Unique EBITDAC
-6.6
Unique expenditures
1.0
4.3
Unique revenues
1.5
Net result
-8.1
-15.
9
Capitalisation
2.1
Net Depreciation
Exceptionals
0.0
Cash result
-17.
0
Central expenditures
6.8
Shared revenues1)
Central revenues
Unique + sharedEBITDAC
-10.
2
Shared expenditures2)
6.5
Tota
l
Bala
nce
shee
t cha
nges
Cen
tral g
roup
cha
rges
BU c
harg
es
Geo
grap
hy-b
ased
Trai
n-ba
sed
Non
-rail
rela
ted
Frei
ght
Non
-fare
box
pax
reve
nue
Pax
reve
nue

4120
1605
09_R
PA_T
T_20
15_F
inal
_Rep
ort_
DR
AFT.
pptx
Lim
eric
k Jc
t–W
ater
ford
has
a n
egat
ive
EUR
(6)m
cas
hflo
wbe
fore
an
d EU
R (9
)m a
fter a
lloca
tion
of c
entra
l exp
endi
ture
s, re
spec
tivel
y
Lim
eric
k Ju
nctio
n-W
ater
ford
resu
lt [E
UR
m]–
Actu
als
2015
Sour
ce: I
arnr
ód É
irean
n, R
olan
d Be
rger
1) S
hare
d re
venu
es in
clud
e ca
r par
k an
d pr
oper
ty &
reta
il re
venu
es fo
r sta
tions
Lim
eric
k Ju
nctio
n an
d W
ater
ford
; 2) S
hare
d ex
pend
iture
s in
clud
e st
atio
n ex
pend
iture
s fo
r Lim
eric
k Ju
nctio
n an
d W
ater
ford
jLi
mer
ick
Jct–
Wat
erfo
rd4
4.6
-5.2
Unique revenues
0.1
Net Depreciation
Net result
-9.0
Capitalisation
0.5
0.4
Exceptionals
0.1
Cash result
Central expenditures
3.4
-9.2
Unique + sharedEBITDAC
-5.8
Shared expenditures2)
0.8
Central revenues
0.1
Unique EBITDAC
-5.1
Unique expenditures
Shared revenues1)
Bala
nce
shee
t cha
nges
Tota
l
BU c
harg
es
Cen
tral g
roup
cha
rges
Geo
grap
hy-b
ased
Trai
n-ba
sed
Non
-rail
rela
ted
Frei
ght
Non
-fare
box
pax
reve
nue
Pax
reve
nue

4220
1605
09_R
PA_T
T_20
15_F
inal
_Rep
ort_
DR
AFT.
pptx
Lim
eric
k –
Bally
brop
hyha
s a
nega
tive
EUR
(6)m
cas
hflo
wbe
fore
an
d EU
R (9
)m a
fter a
lloca
tion
of c
entra
l exp
endi
ture
s, re
spec
tivel
y
Lim
eric
k-Ba
llybr
ophy
resu
lt [E
UR
m] –
Actu
als
2015
Sour
ce: I
arnr
ód É
irean
n, R
olan
d Be
rger
1) S
hare
d re
venu
es in
clud
e O
D-p
air r
even
ues
Lim
eric
k –
Bally
brop
hy a
nd c
ar p
ark
and
prop
erty
& re
tail
reve
nues
for s
tatio
ns L
imer
ick
and
Bally
brop
hy; 2
) Sha
red
expe
nditu
res
incl
ude
stat
ion
expe
nditu
res
for L
imer
ick
and
Bally
brop
hy a
nd IM
exp
endi
ture
s fo
r the
trac
k se
gmen
t Kilo
nan
Junc
tion
-Lim
eric
k
Lim
eric
k –
Bal
lybr
ophy
k4
0.0
Cash result
-8.5
Central expenditures
Unique EBITDAC
Central revenues
Unique + sharedEBITDAC
-5.9
Shared expenditures2)
2.6
0.9
Shared revenues1)
0.1
-5.1
Unique expenditures
-5.1
4.3
Unique revenues
Net result
-7.9
Exceptionals
Capitalisation
0.9
Net Depreciation
0.3
0.0
Tota
l
Bala
nce
shee
t cha
nges
Cen
tral g
roup
cha
rges
BU c
harg
es
Geo
grap
hy-b
ased
Trai
n-ba
sed
Non
-rail
rela
ted
Frei
ght
Non
-fare
box
pax
reve
nue
Pax
reve
nue

4320
1605
09_R
PA_T
T_20
15_F
inal
_Rep
ort_
DR
AFT.
pptx
Cor
k co
mm
uter
has
a n
egat
ive
EUR
(9)m
cas
hflo
wbe
fore
and
EU
R
(12)
m a
fter a
lloca
tion
of c
entra
l exp
endi
ture
s, re
spec
tivel
y
Cor
k co
mm
uter
resu
lt [E
UR
m] –
Actu
als
2015
Sour
ce: I
arnr
ód É
irean
n, R
olan
d Be
rger
Cor
k co
mm
uter
l
1) S
hare
d re
venu
es in
clud
e O
D-p
air r
even
ues
for C
ork
com
mut
er, c
ar p
ark
and
prop
erty
& re
tail
reve
nues
; 2) S
hare
d ex
pend
iture
s in
clud
e sh
ared
sta
tion
expe
nditu
res
and
shar
ed IM
ex
pend
iture
s fo
r the
trac
k se
gmen
ts u
sed
by C
ork
Com
mut
er
4
2.7
Unique EBITDAC
-5.1
Unique expenditures
-7.7
4.5
Unique revenues
2.6
Net result
-9.5
Capitalisation
3.0
Net Depreciation
0.6
Exceptionals
0.0
Cash result
-11.
9
Central expenditures3.
0
Central revenues
Unique + sharedEBITDAC
-8.9
Shared expenditures2)
6.5
Shared revenues1)
Tota
l
Bala
nce
shee
t cha
nges
Cen
tral g
roup
cha
rges
BU c
harg
es
Geo
grap
hy-b
ased
Trai
n-ba
sed
Non
-rail
rela
ted
Frei
ght
Non
-fare
box
pax
reve
nue
Pax
reve
nue

4420
1605
09_R
PA_T
T_20
15_F
inal
_Rep
ort_
DR
AFT.
pptx
Lim
eric
k –
Gal
way
has
a n
egat
ive
EUR
(6)m
cas
hflo
wbe
fore
and
EU
R (9
)m a
fter a
lloca
tion
of c
entra
l exp
endi
ture
s, re
spec
tivel
y
Lim
eric
k-G
alw
ay re
sult
[EU
R m
]–Ac
tual
s 20
15
Sour
ce: I
arnr
ód É
irean
n, R
olan
d Be
rger
1) S
hare
d re
venu
es in
clud
e O
D-p
air r
even
ues
for L
imer
ick
–En
nis
and
Athe
nry
–G
alw
ay, c
ar p
ark
and
prop
erty
& re
tail
reve
nues
; 2) S
hare
d ex
pend
iture
s in
clud
e sh
ared
sta
tion
expe
nditu
res
and
shar
ed IM
exp
endi
ture
s fo
r the
trac
k se
gmen
ts L
imer
ick
–En
nis
and
Athe
nry
–G
alw
ay
mLi
mer
ick
–G
alw
ay4
-3.2
1.2
Unique revenues
0.5
Net result
-8.5
Capitalisation
0.5
Net Depreciation
0.4
Exceptionals
0.0
Cash result
-8.6
Central expenditures
2.8
Central revenues
Unique + sharedEBITDAC
-5.8
Shared expenditures2)
4.0
Shared revenues1)
0.9
Unique EBITDAC
-2.7
Unique expenditures
Tota
l
Bala
nce
shee
t cha
nges
Cen
tral g
roup
cha
rges
BU c
harg
es
Geo
grap
hy-b
ased
Trai
n-ba
sed
Non
-rail
rela
ted
Frei
ght
Non
-fare
box
pax
reve
nue
Pax
reve
nue
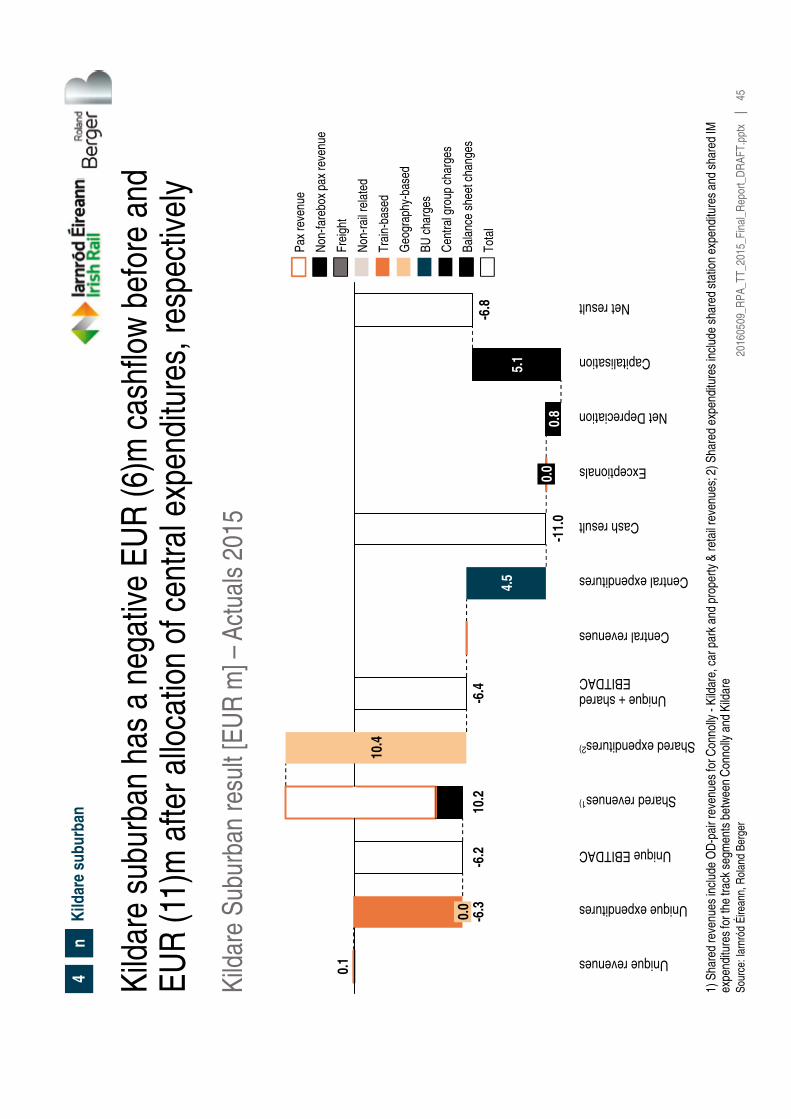
4520
1605
09_R
PA_T
T_20
15_F
inal
_Rep
ort_
DR
AFT.
pptx
Kild
are
subu
rban
has
a n
egat
ive
EUR
(6)m
cas
hflo
wbe
fore
and
EU
R (1
1)m
afte
r allo
catio
n of
cen
tral e
xpen
ditu
res,
resp
ectiv
ely
Kild
are
Subu
rban
resu
lt [E
UR
m]–
Actu
als
2015
Sour
ce: I
arnr
ód É
irean
n, R
olan
d Be
rger
1) S
hare
d re
venu
es in
clud
e O
D-p
air r
even
ues
for C
onno
lly -
Kild
are,
car
par
k an
d pr
oper
ty &
reta
il re
venu
es; 2
) Sha
red
expe
nditu
res
incl
ude
shar
ed s
tatio
n ex
pend
iture
s an
d sh
ared
IM
expe
nditu
res
for t
he tr
ack
segm
ents
bet
wee
n C
onno
lly a
nd K
ildar
e
nK
ildar
e su
burb
an4
-6.3
0.0
Unique revenues
0.1
0.0
Cash result
-11.
0
Central expenditures
4.5
Central revenues
Unique + sharedEBITDAC
-6.4
Shared expenditures2)10
.4
Shared revenues1)
0.8
Unique EBITDAC
-6.2
Unique expenditures
Net Depreciation
Exceptionals
5.1 Capitalisation
-6.8 Net result
10.2
Tota
l
Bala
nce
shee
t cha
nges
Cen
tral g
roup
cha
rges
BU c
harg
es
Geo
grap
hy-b
ased
Trai
n-ba
sed
Non
-rail
rela
ted
Frei
ght
Non
-fare
box
pax
reve
nue
Pax
reve
nue

4620
1605
09_R
PA_T
T_20
15_F
inal
_Rep
ort_
DR
AFT.
pptx
Nor
ther
n su
burb
an h
as a
neg
ativ
e EU
R (8
)m c
ashf
low
befo
re a
nd
EUR
(21)
m a
fter a
lloca
tion
of c
entra
l exp
endi
ture
s, re
spec
tivel
y
Nor
ther
n Su
burb
an re
sult
[EU
R m
]–Ac
tual
s 20
15
Sour
ce: I
arnr
ód É
irean
n, R
olan
d Be
rger
1) S
hare
d re
venu
es in
clud
e O
D-p
air r
even
ues
for C
onno
lly -
Dun
dalk
, car
par
k an
d pr
oper
ty &
reta
il re
venu
es; 2
) Sha
red
expe
nditu
res
incl
ude
shar
ed s
tatio
n ex
pend
iture
s an
d sh
ared
IM
expe
nditu
res
for t
he tr
ack
segm
ents
bet
wee
n C
onno
lly a
nd D
unda
lk
oN
orth
ern
subu
rban
4
-16.
21.
1
Unique revenues
5.6
Net result
-15.
6
Capitalisation
8.8
Net Depreciation
3.2
Exceptionals
0.3
Cash result
-20.
9Central expenditures
12.8
Central revenues
Unique + sharedEBITDAC
-8.1
Shared expenditures2)10
.3
Shared revenues1)
12.8
Unique EBITDAC
-10.
6
Unique expenditures
Tota
l
Bala
nce
shee
t cha
nges
Cen
tral g
roup
cha
rges
BU c
harg
es
Geo
grap
hy-b
ased
Trai
n-ba
sed
Non
-rail
rela
ted
Frei
ght
Non
-fare
box
pax
reve
nue
Pax
reve
nue

4720
1605
09_R
PA_T
T_20
15_F
inal
_Rep
ort_
DR
AFT.
pptx
Wes
tern
sub
urba
n ha
s a
nega
tive
EUR
(6)m
cas
hflo
wbe
fore
and
EU
R (1
2)m
afte
r allo
catio
n of
cen
tral e
xpen
ditu
res,
resp
ectiv
ely
Wes
tern
Sub
urba
n re
sult
[EU
R m
]–Ac
tual
s 20
15
Sour
ce: I
arnr
ód É
irean
n, R
olan
d Be
rger
1) S
hare
d re
venu
es in
clud
e O
D-p
air r
even
ues
for C
onno
lly -
Long
ford
, car
par
k an
d pr
oper
ty &
reta
il re
venu
es; 2
) Sha
red
expe
nditu
res
incl
ude
shar
ed s
tatio
n ex
pend
iture
s an
d sh
ared
IM
expe
nditu
res
for t
he tr
ack
segm
ents
bet
wee
n C
onno
lly a
nd L
ongf
ord
pW
este
rn s
ubur
ban
4
Shared expenditures2)9.
5
Shared revenues1)
-10.
1
Unique EBITDAC
-8.5
Unique expenditures
-9.5
12.3
0.8
Unique revenues
1.0
Net result
Capitalisation
4.1
Net Depreciation
1.7
Exceptionals
0.1
Cash result
Unique + sharedEBITDAC
-12.
3Central expenditures
6.7
Central revenues
-5.7
Tota
l
Bala
nce
shee
t cha
nges
Cen
tral g
roup
cha
rges
BU c
harg
es
Geo
grap
hy-b
ased
Trai
n-ba
sed
Non
-rail
rela
ted
Frei
ght
Non
-fare
box
pax
reve
nue
Pax
reve
nue

4820
1605
09_R
PA_T
T_20
15_F
inal
_Rep
ort_
DR
AFT.
pptx
DAR
T ha
s a
nega
tive
EUR
(2)m
cas
hflo
wbe
fore
cen
tral
expe
nditu
res
and
EUR
(15)
m a
fter a
lloca
tion
of c
entra
l exp
endi
ture
s
DAR
T re
sult
[EU
R m
]–Ac
tual
s 20
15
Sour
ce: I
arnr
ód É
irean
n, R
olan
d Be
rger
1) S
hare
d re
venu
es in
clud
e O
D-p
air r
even
ues
for D
ART,
car
par
k an
d pr
oper
ty &
reta
il re
venu
es; 2
) Sha
red
expe
nditu
res
incl
ude
shar
ed s
tatio
n ex
pend
iture
s an
d sh
ared
IM e
xpen
ditu
res
for t
he tr
ack
segm
ents
use
d by
DAR
T
qD
AR
T4
Net result
-12.
3
Capitalisation
13.0
Net Depreciation
4.0
Exceptionals
-15.
17.
00.
2Central expenditures
Cash result
Central revenues
Unique + sharedEBITDAC
-2.2
Shared expenditures2)
Shared revenues1)
11.6
26.7
Unique EBITDAC
-17.
2
Unique expenditures
-33.
2
16.2
Unique revenues
16.0
Cen
tral g
roup
cha
rges
Bala
nce
shee
t cha
nges
Tota
l
Non
-rail
rela
ted
Frei
ght
Non
-fare
box
pax
reve
nue
Pax
reve
nue
BU c
harg
es
Geo
grap
hy-b
ased
Trai
n-ba
sed

4920
1605
09_R
PA_T
T_20
15_F
inal
_Rep
ort_
DR
AFT.
pptx
Whe
n al
loca
ting
mar
gina
l exp
endi
ture
s on
ly, F
reig
ht h
as a
pos
itive
EU
R 0
.4m
cash
flow
befo
re c
entra
l exp
endi
ture
s an
d EU
R 0
maf
ter
Frei
ght r
esul
t –m
argi
nal e
xpen
ditu
re a
ppro
ach
[EU
R m
]–Ac
tual
s 20
15
Sour
ce: I
arnr
ód É
irean
n, R
olan
d Be
rger
1) S
hare
d ex
pend
iture
s in
clud
e sh
ared
sta
tion
expe
nditu
res
and
shar
ed IM
exp
endi
ture
s fo
r the
trac
k se
gmen
ts u
sed
by fr
eigh
t rou
tes:
Tar
a m
ines
–D
ublin
Por
t, W
estp
ort –
Wat
erfo
rd,
Ballin
a –
Wat
erfo
rd, B
allin
a -D
ublin
4
Unique expenditures
-4.4
1.6
Unique revenues
3.8
0.5
Cash result
0.0
Central expenditures
0.4
Central revenues
Unique + sharedEBITDAC
0.4
Shared expenditures2)
0.1
Shared revenues1)
Net Depreciation
Unique EBITDAC
-0.5
0.0 Capitalisation
0.0
Exceptionals
-0.5 Net result
0.9
Tota
l
Bala
nce
shee
t cha
nges
Cen
tral g
roup
cha
rges
BU c
harg
es
Geo
grap
hy-b
ased
Trai
n-ba
sed
Non
-rail
rela
ted
Frei
ght
Non
-fare
box
pax
reve
nue
Pax
reve
nue

5020
1605
09_R
PA_T
T_20
15_F
inal
_Rep
ort_
DR
AFT.
pptx
E.R
oute
pro
fitab
ility
resu
lts A
ECO
M 2
015

5120
1605
09_R
PA_T
T_20
15_F
inal
_Rep
ort_
DR
AFT.
pptx
Con
tent
s of
this
sec
tion 1 2 3
IÉov
eral
l P&L
Sum
mar
y ro
ute-
leve
l P&L
s
Rou
te fi
nanc
ial p
erfo
rman
ce c
ompa
rison
Indi
vidu
al ro
ute
P&Ls
4

5220
1605
09_R
PA_T
T_20
15_F
inal
_Rep
ort_
DR
AFT.
pptx
Acco
rdin
g to
the
AEC
OM
201
5 re
port,
IÉIM
shou
ld h
ave
spen
t EU
R
75 m
mor
e in
201
5 to
sus
tain
a s
tead
y-st
ate
infra
stru
ctur
e
Sour
ce: I
arnr
ód É
irean
n, R
olan
d Be
rger
Infra
stru
ctur
e M
anag
emen
t exp
endi
ture
s1)–
Actu
als
2015
vs
AEC
OM
201
5 [E
UR
m]
AEC
OM
20
15280
AEC
OM
de
lta75 75
Actu
als
201520
5
BU m
gmt.
61
B&F
10
SET
58
1213
CC
E
90 6822
IMO18 15
4
BU m
gmt.
66
B&F4
21
SET
4315
CC
E
127
258542
IMO25 17
8
Cen
tral
Shar
edU
niqu
e
AC
TUA
LS 2
015
1IÉ
over
all P
&L
AEC
OM
201
5
1) E
xclu
ding
New
Wor
ks

5320
1605
09_R
PA_T
T_20
15_F
inal
_Rep
ort_
DR
AFT.
pptx
IÉ s
how
s a
cont
ribut
ion
to c
entra
l exp
endi
ture
s of
EU
R (1
81)m
and
ca
sh re
sult
of E
UR
(371
)m a
fter a
ttrib
utio
n of
cen
tral e
xpen
ditu
res
Ove
rall
Iarn
ród
Éire
ann
resu
lt [E
UR
m] –
AEC
OM
201
5, ti
met
able
201
5
Sour
ce: I
arnr
ód É
irean
n, R
olan
d Be
rger
539
Net result
-296
Financing
194
3111
1
165
-181
Central expenditures
Central revenues
2
Capitalisation
Amortisation
Depreciation
Expenditures
-402
4
128
Exceptionals
2
Cash result
273
Contrib. to central exp.1)
Revenues
220
11
-371
Non
-fare
box
pax
reve
nue
Pax
reve
nue
Frei
ght
Non
-rail
rela
ted
Trai
n-ba
sed
BU c
harg
es
Geo
grap
hy-b
ased
Inte
rest
Bala
nce
shee
t cha
nges
Cen
tral g
roup
cha
rges
Tota
l
1IÉ
over
all P
&L
1) C
ontri
butio
n to
cen
tral e
xpen
ditu
res

5420
1605
09_R
PA_T
T_20
15_F
inal
_Rep
ort_
DR
AFT.
pptx
Sour
ce: I
arnr
ód É
irean
n, R
olan
d Be
rger
The
AEC
OM
201
5 sp
end
has
been
dis
tribu
ted
over
the
17 ro
utes
de
fined
for t
he ro
ute
prof
itabi
lity
anal
ysis
Dub
lin C
onno
lly
Wat
erfo
rd
Dub
linH
eust
on
Cor
k
Tral
ee
Gal
way
Wes
tpor
t
Bal
lina
Slig
o
Ath
lone
Ros
slar
e Eu
ropo
rt
Man
ulla
Jun
ctio
nPa
ssen
ger t
rans
fers
onl
y
Lim
eric
k Ju
nctio
nLim
eric
k
Kild
are
Porta
rling
ton
Bally
brop
hyEn
nis
Athe
nry
Mal
low
Glo
unth
aune
Mid
leto
n
Cob
h
Long
ford
May
noot
hC
lons
illa
Dun
boyn
e/M
3
Dro
ghed
a
Gre
ysto
nes
Wic
klow
Mul
linga
r
Car
low
Kilk
enny
Killa
rney
Gor
ey
Mal
ahid
eO
ranm
ore
Arkl
owHow
th s
pur
Cor
k
Gal
way
Tral
ee
Lim
eric
k
Wes
tpor
t/Bal
lina
Wat
erfo
rd
Slig
o
Belfa
st
Ros
slar
e
a b c d e f g h i
Lim
. Jct
–W
ater
ford
Lim
eric
k –
Bally
brop
hy
Cor
k co
mm
uter
Lim
eric
k –
Gal
way
Kild
are
Subu
rban
Nor
ther
n Su
burb
an
Wes
tern
Sub
urba
n
DAR
T
j k l m n o p q
IÉro
ute
defin
ition
s fo
r rou
te p
rofit
abilit
y an
alys
is
2Su
mm
ary
rout
e-le
vel P
&Ls

5520
1605
09_R
PA_T
T_20
15_F
inal
_Rep
ort_
DR
AFT.
pptx
Sum
mar
y ro
ute
leve
l P&L
s –
2015
AEC
OM
Cor
kG
alw
ayTr
alee
Lim
eric
kW
estp
ort/B
allin
aW
ater
ford
Slig
oB
elfa
stR
ossl
are
Lim
. Jct
–W
ater
ford
Lim
eric
k –
Bal
lybr
ophy
Cor
k co
mm
uter
Lim
eric
k –
Gal
way
Kild
are
Subu
rban
Nor
ther
n Su
burb
anW
este
rn S
ubur
ban
Rou
te le
vel P
&L(A
ECO
M 2
015)
[EU
R '0
00]
Sour
ce: I
arnr
ód É
irean
n, R
olan
d Be
rger
2
Rev
enue
15,8
978,
793
8,24
75,
074
5,74
86,
443
6,05
49,
162
1,52
310
6 382,
598
505 77
5,64
798
9
-23,
758
-11,
374
-4,5
83-6
,432
-7,7
00-6
,582
-16,
180
-7,0
46-1
0,88
7-8
,739
-8,2
57-1
0,86
2-6
,565
-5,7
09-1
6,15
1-1
0,18
7
-7,8
61-2
,582
3,66
4-1
,357
-1,9
52-1
39-1
0,12
62,
116
-9,3
64-8
,633
-8,2
19-8
,263
-6,0
60-5
,632
-10,
504
-9,1
98
Cos
tN
et re
sult
Uni
que
Rev
enue
Cos
tN
et re
sult
11,8
498,
053
2,82
53,
760
4,11
25,
063
4,15
51,
314
2,86
711
210
92,
722
925
10,1
6612
,764
12,3
23
-31,
774
-15,
842
-13,
996
-18,
090
-17,
690
-15,
740
-12,
947
-3,8
82-9
,121
-355
-833
-6,1
41-4
,700
-11,
244
-11,
990
-16,
851
-19,
924
-7,7
89-1
1,17
2-1
4,33
1-1
3,57
8-1
0,67
7-8
,792
-2,5
68-6
,254
-244
-724
-3,4
19-3
,775
-1,0
78 775
-4,5
28
Shar
ed
EBIT
DA
C1)
-27,
786
-10,
371
-7,5
08-1
5,68
8-1
5,53
0-1
0,81
6-1
8,91
8-4
52-1
5,61
7-8
,876
-8,9
43-1
1,68
2-9
,835
-6,7
10-9
,729
-13,
726
Cas
h re
sult
-55,
575
-21,
394
-15,
198
-25,
032
-26,
339
-19,
156
-31,
847
-7,4
97-2
3,10
7-1
2,43
1-1
1,66
9-1
5,15
8-1
3,26
6-1
1,45
8-2
2,96
5-2
0,98
3
Net
resu
lt
-45,
610
-17,
232
-13,
717
-22,
100
-23,
183
-15,
560
-29,
941
-8,8
78-2
2,02
2-1
2,31
4-1
1,09
3-1
2,71
5-1
3,20
9-7
,259
-17,
695
-18,
727
DA
RT
16,0
07-3
3,17
7-1
7,17
026
,685
-7,7
6818
,917
1,74
7-1
2,18
9-9
,374
Prof
itabi
lity
Sum
mar
y ro
ute-
leve
l P&
Ls
1) E
BITD
AC=
Earn
ings
Bef
ore
Inte
rest
, Tax
, Dep
reci
atio
n, A
mor
tisat
ion
and
Cap
italis
atio
n; w
hich
is th
e re
sult
befo
re c
entra
l exp
endi
ture
s; 2
) Pas
seng
er ro
ute
tota
l onl
y (i.
e. e
xclu
ding
fre
ight
resu
lts a
nd n
on-ra
il re
late
d re
sults
)
Pass
enge
r rou
te to
tal2)
92,9
09-1
94,1
88-1
01,2
8010
9,80
4-1
98,9
65-8
9,16
1-1
90,4
40-3
45,2
66-3
00,6
29

5620
1605
09_R
PA_T
T_20
15_F
inal
_Rep
ort_
DR
AFT.
pptx
Som
e of
IÉ's
rout
es e
xper
ienc
e hi
gh le
vels
of n
egat
ive
cash
flow
per
pass
enge
r jou
rney
AEC
OM
sce
nario
cas
h re
sult
per p
asse
nger
jour
ney
by ro
ute
[EU
R /
pax
jour
ney]
Sour
ce: I
arnr
ód É
irean
n, R
olan
d Be
rger
3
-0.7
-5.5
-5.3
-5.1
-68.
1
-12.
2-3
9.6
-8.7
-28.
4-1
3.8
-33.
7-2
6.0
-24.
8-1
1.3
-25.
3
Limerick -Galway
Cork commuter
Limerick -Ballybrophy
-761
.6
Lim. Jct -Waterford
-491
.5
Rosslare
Belfast
Sligo
Waterford
Westport/Ballina
Limerick
Tralee
DART
Western Suburban
Northern Suburban
Kildare Suburban
Galway
CorkRou
te fi
nanc
ial p
erfo
rman
ce c
ompa
rison
ab
cd
ef
gh
ij
kl
mn
op
q

5720
1605
09_R
PA_T
T_20
15_F
inal
_Rep
ort_
DR
AFT.
pptx
Cas
h re
quire
men
ts p
er p
asse
nger
jour
ney
are
incr
ease
d in
the
AEC
OM
sce
nario
AEC
OM
sce
nario
cas
h re
sult
per p
asse
nger
jour
ney
by ro
ute
[EU
R /
pax
jour
ney]
Sour
ce: I
arnr
ód É
irean
n, R
olan
d Be
rger
-39.6
Belfast-9.4
-8.7
Sligo-20.0
-28.4
Waterford-10.8
-13.8
Westport/Ballina-26.9
-33.7
Limerick-18.4
-26.0
Tralee-15.6
-4.9
-5.3
Kildare Suburban
-362.4
-491.5
Rosslare
-5.1
Limerick -Galway-44.0
-68.1
Cork commuter-9.6
-12.2
Limerick -Ballybrophy-551.9
-761.6
Lim. Jct -Waterford
DART-0.9
-0.7
-3.2 Western Suburban
-4.8 Northern Suburban
-5.5
-22.1
-25.3
-29.1
-24.8
Galway-8.5
-11.3
Cork ab
cd
ef
gh
ij
kl
mn
op
q
Cas
h re
sult
-Act
uals
201
5C
ash
resu
lt -A
ECO
M 2
015
1) C
ash
resu
lt is
afte
r far
ebox
and
befo
re e
xcep
tiona
l item
s, d
epre
ciat
ion,
am
ortis
atio
nan
d ca
pita
lisat
ion;
2) A
ll re
sults
exc
lude
any
gov
ernm
ent f
undi
ng (e
.g. P
SO, M
AC)
3R
oute
fina
ncia
l per
form
ance
com
paris
on

5820
1605
09_R
PA_T
T_20
15_F
inal
_Rep
ort_
DR
AFT.
pptx
Dub
lin –
Cor
k ha
s a
nega
tive
EUR
(28)
m c
ashf
low
befo
re a
nd E
UR
(5
6)m
afte
r allo
catio
n of
cen
tral e
xpen
ditu
res,
resp
ectiv
ely
Dub
lin-C
ork
resu
lt [E
UR
m]–
AEC
OM
201
5
Sour
ce: I
arnr
ód É
irean
n, R
olan
d Be
rger
1) S
hare
d re
venu
es in
clud
e O
D-p
air r
even
ues
for H
eust
on -
Cor
k, c
ar p
ark
and
prop
erty
& re
tail
reve
nues
; 2) S
hare
d ex
pend
iture
s in
clud
e sh
ared
sta
tion
expe
nditu
res
and
shar
ed IM
ex
pend
iture
s fo
r the
trac
k se
gmen
ts b
etw
een
Heu
ston
and
Cor
k
-45.
6
Capitalisation
15.9
-24.
0
Unique revenues
Unique expenditures
-8.1 Unique EBITDAC
Shared revenues1)
Shared expenditures2)
-28.
0
Unique + sharedEBITDAC
Central revenues
Central expenditures-5
5.6 Cash result
Exceptionals
Net Depreciation
11.8
Net result
Non
-rail
rela
ted
Frei
ght
Non
-fare
box
pax
reve
nue
Pax
reve
nue
Trai
n-ba
sed
Geo
grap
hy-b
ased
Tota
l
Bala
nce
shee
t cha
nges
Cen
tral g
roup
cha
rges
BU c
harg
es
aC
ork
4

5920
1605
09_R
PA_T
T_20
15_F
inal
_Rep
ort_
DR
AFT.
pptx
Dub
lin –
Gal
way
has
a ne
gativ
e EU
R (1
1)m
cas
hflo
wbe
fore
and
EU
R (2
1)m
afte
r allo
catio
n of
cen
tral e
xpen
ditu
res,
resp
ectiv
ely
Dub
lin-G
alw
ay re
sult
[EU
R m
]–AE
CO
M 2
015
Sour
ce: I
arnr
ód É
irean
n, R
olan
d Be
rger
1) S
hare
d re
venu
es in
clud
e O
D-p
air r
even
ues
for H
eust
on -
Gal
way
, car
par
k an
d pr
oper
ty &
reta
il re
venu
es; 2
) Sha
red
expe
nditu
res
incl
ude
shar
ed s
tatio
n ex
pend
iture
s an
d sh
ared
IM
expe
nditu
res
for t
he tr
ack
segm
ents
bet
wee
n H
eust
on a
nd G
alw
ay
bG
alw
ay
Net result
Capitalisation
6.1
Net Depreciation
1.9
15.8 Shared expenditures2)
Unique + sharedEBITDAC
-10.
5Central revenues
10.9 Central expenditures
Shared revenues1)
-21.
4 Cash result
0.1
8.1
Unique EBITDAC
-2.7
Unique expenditures
-17.
2
3.1
Unique revenues
8.8
Exceptionals
-11.
5
BU c
harg
es
Cen
tral g
roup
cha
rges
Bala
nce
shee
t cha
nges
Tota
l
Geo
grap
hy-b
ased
Trai
n-ba
sed
Non
-rail
rela
ted
Frei
ght
Non
-fare
box
pax
reve
nue
Pax
reve
nue
4

6020
1605
09_R
PA_T
T_20
15_F
inal
_Rep
ort_
DR
AFT.
pptx
Dub
lin –
Tral
ee h
as a
neg
ativ
e EU
R (8
)m c
ashf
low
befo
re a
nd E
UR
(1
5)m
afte
r allo
catio
n of
cen
tral e
xpen
ditu
res,
resp
ectiv
ely
Dub
lin-T
rale
e re
sult
[EU
R m
]–AE
CO
M 2
015
Sour
ce: I
arnr
ód É
irean
n, R
olan
d Be
rger
1) S
hare
d re
venu
es in
clud
e O
D-p
air r
even
ues
for H
eust
on -
Tral
ee, c
ar p
ark
and
prop
erty
& re
tail
reve
nues
; 2) S
hare
d ex
pend
iture
s in
clud
e sh
ared
sta
tion
expe
nditu
res
and
shar
ed IM
ex
pend
iture
s fo
r the
trac
k se
gmen
ts b
etw
een
Heu
ston
and
Tra
lee
cTr
alee
Net Depreciation
1.2
Exceptionals
0.0
Cash result
-15.
2
Central expenditures
7.6
Central revenues
Unique + sharedEBITDAC
-7.6
Shared expenditures2)
14.0
Shared revenues1)
2.8
Net result
3.5
Unique expenditures
-4.7
0.0
Unique EBITDAC8.
2
-13.
7
Capitalisation
2.7
Unique revenues
BU c
harg
es
Cen
tral g
roup
cha
rges
Bala
nce
shee
t cha
nges
Tota
l
Geo
grap
hy-b
ased
Trai
n-ba
sed
Non
-rail
rela
ted
Frei
ght
Non
-fare
box
pax
reve
nue
Pax
reve
nue
4

6120
1605
09_R
PA_T
T_20
15_F
inal
_Rep
ort_
DR
AFT.
pptx
Dub
lin –
Lim
eric
k ha
s a
nega
tive
EUR
(16)
m c
ashf
low
befo
re a
nd
EUR
(25)
m a
fter a
lloca
tion
of c
entra
l exp
endi
ture
s, re
spec
tivel
y
Dub
lin-L
imer
ick
resu
lt [E
UR
m]–
AEC
OM
201
5
Sour
ce: I
arnr
ód É
irean
n, R
olan
d Be
rger
1) S
hare
d re
venu
es in
clud
e O
D-p
air r
even
ues
for H
eust
on -
Lim
eric
k, c
ar p
ark
and
prop
erty
& re
tail
reve
nues
; 2) S
hare
d ex
pend
iture
s in
clud
e sh
ared
sta
tion
expe
nditu
res
and
shar
ed IM
ex
pend
iture
s fo
r the
trac
k se
gmen
ts b
etw
een
Heu
ston
and
Lim
eric
k
dLi
mer
ick
Net result
-22.
1
Capitalisation
4.4
Net Depreciation
1.4
9.2
Central revenues
Unique + sharedEBITDAC
-15.
8
Shared expenditures2)
18.1
Shared revenues1)3.
8
Unique EBITDAC
-1.5
Cash result
-6.5
0.0
Unique revenues
5.1
-25.
00.
0 Exceptionals
Central expenditures
Unique expenditures
BU c
harg
es
Cen
tral g
roup
cha
rges
Bala
nce
shee
t cha
nges
Tota
l
Geo
grap
hy-b
ased
Trai
n-ba
sed
Non
-rail
rela
ted
Frei
ght
Non
-fare
box
pax
reve
nue
Pax
reve
nue
4

6220
1605
09_R
PA_T
T_20
15_F
inal
_Rep
ort_
DR
AFT.
pptx
Dub
lin –
Wes
tpor
t/Bal
lina
has
a ne
gativ
e EU
R (1
6)m
cas
hflo
wbe
fore
and
EU
R (2
6)m
afte
r allo
catio
n of
cen
tral e
xpen
ditu
res
Dub
lin-W
estp
ort/B
allin
are
sult
[EU
R m
]–AE
CO
M 2
015
Sour
ce: I
arnr
ód É
irean
n, R
olan
d Be
rger
1) S
hare
d re
venu
es in
clud
e O
D-p
air r
even
ues
for H
eust
on –
Wes
tpor
t/Bal
lina,
car
par
k an
d pr
oper
ty &
reta
il re
venu
es; 2
) Sha
red
expe
nditu
res
incl
ude
shar
ed s
tatio
n ex
pend
iture
s an
d sh
ared
IM e
xpen
ditu
res
for t
he tr
ack
segm
ents
bet
wee
n H
eust
on a
nd W
estp
ort/B
allin
a
eW
estp
ort/B
allin
a
-23.
2
Capitalisation
5.0
Net Depreciation
Net result
1.7
Exceptionals
0.1
Cash result
-26.
3
Central expenditures
10.6
Central revenues
Unique + sharedEBITDAC
-15.
7
Shared expenditures2)
17.7
Shared revenues1)
4.1
Unique EBITDAC
-2.2
Unique expenditures
-7.9
0.8
Unique revenues
5.7
BU c
harg
es
Cen
tral g
roup
cha
rges
Bala
nce
shee
t cha
nges
Tota
l
Geo
grap
hy-b
ased
Trai
n-ba
sed
Non
-rail
rela
ted
Frei
ght
Non
-fare
box
pax
reve
nue
Pax
reve
nue
4

6320
1605
09_R
PA_T
T_20
15_F
inal
_Rep
ort_
DR
AFT.
pptx
Dub
lin –
Wat
erfo
rd h
as a
neg
ativ
e EU
R (1
1)m
cas
hflo
wbe
fore
and
EU
R (1
9)m
afte
r allo
catio
n of
cen
tral e
xpen
ditu
res,
resp
ectiv
ely
Dub
lin-W
ater
ford
resu
lt [E
UR
m]–
AEC
OM
201
5
Sour
ce: I
arnr
ód É
irean
n, R
olan
d Be
rger
1) S
hare
d re
venu
es in
clud
e O
D-p
air r
even
ues
for H
eust
on –
Wat
erfo
rd, c
ar p
ark
and
prop
erty
& re
tail
reve
nues
; 2) S
hare
d ex
pend
iture
s in
clud
e sh
ared
sta
tion
expe
nditu
res
and
shar
ed
IM e
xpen
ditu
res
for t
he tr
ack
segm
ents
bet
wee
n H
eust
on a
nd W
ater
ford
fW
ater
ford
Net result
-15.
6
Capitalisation
5.1
Net Depreciation
1.3
Exceptionals
0.1
Cash result
-19.
2
Central expenditures
8.2
Central revenues
Unique + sharedEBITDAC
-10.
9
Shared expenditures2)
15.7
Shared revenues1)
5.1
Unique EBITDAC
-0.3
Unique expenditures
-6.7
0.7
Unique revenues
6.4
BU c
harg
es
Cen
tral g
roup
cha
rges
Bala
nce
shee
t cha
nges
Tota
l
Geo
grap
hy-b
ased
Trai
n-ba
sed
Non
-rail
rela
ted
Frei
ght
Non
-fare
box
pax
reve
nue
Pax
reve
nue
4

6420
1605
09_R
PA_T
T_20
15_F
inal
_Rep
ort_
DR
AFT.
pptx
Dub
lin –
Slig
o ha
s a
nega
tive
EUR
(19)
m c
ashf
low
befo
re a
nd E
UR
(3
2)m
afte
r allo
catio
n of
cen
tral e
xpen
ditu
res,
resp
ectiv
ely
Dub
lin-S
ligo
resu
lt [E
UR
m]–
AEC
OM
201
5
Sour
ce: I
arnr
ód É
irean
n, R
olan
d Be
rger
1) S
hare
d re
venu
es in
clud
e O
D-p
air r
even
ues
for C
onno
lly –
Slig
o, c
ar p
ark
and
prop
erty
& re
tail
reve
nues
; 2) S
hare
d ex
pend
iture
s in
clud
e sh
ared
sta
tion
expe
nditu
res
and
shar
ed IM
ex
pend
iture
s fo
r the
trac
k se
gmen
ts b
etw
een
Con
nolly
and
Slig
o
gSl
igo
Shared expenditures2)
12.9
Shared revenues1)
4.2
4.5
-10.
3
Unique expenditures
-16.
4
7.0
Unique revenues
6.1
Net result
-29.
9
Capitalisation
Net Depreciation
2.3
Exceptionals
0.3
Cash result
-31.
8
Unique EBITDAC
Central expenditures
12.7
Central revenues
Unique + sharedEBITDAC
-19.
1
BU c
harg
es
Cen
tral g
roup
cha
rges
Bala
nce
shee
t cha
nges
Tota
l
Geo
grap
hy-b
ased
Trai
n-ba
sed
Non
-rail
rela
ted
Frei
ght
Non
-fare
box
pax
reve
nue
Pax
reve
nue
4

6520
1605
09_R
PA_T
T_20
15_F
inal
_Rep
ort_
DR
AFT.
pptx
Dub
lin –
Belfa
st h
as a
neg
ativ
e EU
R (1
)m c
ashf
low
befo
re a
nd
nega
tive
EUR
(8)m
cas
hflo
waf
ter a
lloca
tion
of c
entra
l exp
endi
ture
s
Dub
lin-B
elfa
st re
sult
[EU
R m
]–AE
CO
M 2
015
Sour
ce: I
arnr
ód É
irean
n, R
olan
d Be
rger
1) S
hare
d re
venu
es in
clud
e O
D-p
air r
even
ues
for C
onno
lly –
Belfa
st, c
ar p
ark
and
prop
erty
& re
tail
reve
nues
; 2) S
hare
d ex
pend
iture
s in
clud
e sh
ared
sta
tion
expe
nditu
res
and
shar
ed IM
ex
pend
iture
s fo
r the
trac
k se
gmen
ts b
etw
een
Con
nolly
and
Bel
fast
hB
elfa
st
Net result
-8.9
Capitalisation
1.3
Net Depreciation
2.6
Exceptionals
0.1
Cash result
-7.5
Central expenditures
7.0
Central revenues
Unique + sharedEBITDAC
-0.5
Shared expenditures2)
3.9
Shared revenues1)
1.3
Unique EBITDAC
2.1
Unique expenditures
-7.1
1.8
Unique revenues
9.2
Bala
nce
shee
t cha
nges
Tota
l
Cen
tral g
roup
cha
rges
BU c
harg
es
Geo
grap
hy-b
ased
Trai
n-ba
sed
Non
-rail
rela
ted
Frei
ght
Non
-fare
box
pax
reve
nue
Pax
reve
nue
4

6620
1605
09_R
PA_T
T_20
15_F
inal
_Rep
ort_
DR
AFT.
pptx
Dub
lin –
Ros
slar
eha
s a
nega
tive
EUR
(16)
m c
ashf
low
befo
re a
nd
EUR
(23)
m a
fter a
lloca
tion
of c
entra
l exp
endi
ture
s, re
spec
tivel
y
Dub
lin-R
ossl
are
resu
lt [E
UR
m]–
AEC
OM
201
5
Sour
ce: I
arnr
ód É
irean
n, R
olan
d Be
rger
iR
ossl
are
1) S
hare
d re
venu
es in
clud
e O
D-p
air r
even
ues
for C
onno
lly -
Ros
slar
e, c
ar p
ark
and
prop
erty
& re
tail
reve
nues
; 2) S
hare
d ex
pend
iture
s in
clud
e sh
ared
sta
tion
expe
nditu
res
and
shar
ed IM
ex
pend
iture
s fo
r the
trac
k se
gmen
ts b
etw
een
Con
nolly
and
Ros
slar
e
Net result
-22.
0
Capitalisation
2.1
Net Depreciation
1.0
Exceptionals
0.0
Cash result
-23.
1
Central expenditures
7.3
Central revenues
Unique + sharedEBITDAC
-15.
8
Shared expenditures2)
9.1
Shared revenues1)
2.9
Unique EBITDAC
-9.6
Unique expenditures
-11.
1
7.3
Unique revenues
1.5
BU c
harg
es
Cen
tral g
roup
cha
rges
Bala
nce
shee
t cha
nges
Tota
l
Geo
grap
hy-b
ased
Trai
n-ba
sed
Non
-rail
rela
ted
Frei
ght
Non
-fare
box
pax
reve
nue
Pax
reve
nue
4

6720
1605
09_R
PA_T
T_20
15_F
inal
_Rep
ort_
DR
AFT.
pptx
Lim
eric
k Jc
t–W
ater
ford
has
a n
egat
ive
EUR
(9)m
cas
hflo
wbe
fore
an
d EU
R (1
2)m
afte
r allo
catio
n of
cen
tral e
xpen
ditu
res,
resp
ectiv
ely
Lim
eric
k Ju
nctio
n-W
ater
ford
resu
lt [E
UR
m]–
AEC
OM
201
5
Sour
ce: I
arnr
ód É
irean
n, R
olan
d Be
rger
1) S
hare
d re
venu
es in
clud
e ca
r par
k an
d pr
oper
ty &
reta
il re
venu
es fo
r sta
tions
Lim
eric
k Ju
nctio
n an
d W
ater
ford
; 2) S
hare
d ex
pend
iture
s in
clud
e st
atio
n ex
pend
iture
s fo
r Lim
eric
k Ju
nctio
n an
d W
ater
ford
jLi
mer
ick
Jct–
Wat
erfo
rd
Net Depreciation
0.4
Exceptionals
0.1
Cash result
-12.
4
Central expenditures3.
4
Central revenues
Unique + sharedEBITDAC
-9.0
Net result
-12.
3
Capitalisation
0.5
Shared expenditures2)
0.4
Shared revenues1)
0.1
Unique EBITDAC
-8.8
Unique expenditures
-8.9
8.2
Unique revenues
0.1
BU c
harg
es
Cen
tral g
roup
cha
rges
Bala
nce
shee
t cha
nges
Tota
l
Geo
grap
hy-b
ased
Trai
n-ba
sed
Non
-rail
rela
ted
Frei
ght
Non
-fare
box
pax
reve
nue
Pax
reve
nue
4

6820
1605
09_R
PA_T
T_20
15_F
inal
_Rep
ort_
DR
AFT.
pptx
Lim
eric
k –
Bally
brop
hyha
s a
nega
tive
EUR
(9)m
cas
hflo
wbe
fore
an
d EU
R (1
2)m
afte
r allo
catio
n of
cen
tral e
xpen
ditu
res,
resp
ectiv
ely
Lim
eric
k-Ba
llybr
ophy
resu
lt [E
UR
m] –
AEC
OM
201
5
Sour
ce: I
arnr
ód É
irean
n, R
olan
d Be
rger
1) S
hare
d re
venu
es in
clud
e O
D-p
air r
even
ues
Lim
eric
k –
Bally
brop
hy a
nd c
ar p
ark
and
prop
erty
& re
tail
reve
nues
for s
tatio
ns L
imer
ick
and
Bally
brop
hy; 2
) Sha
red
expe
nditu
res
incl
ude
stat
ion
expe
nditu
res
for L
imer
ick
and
Bally
brop
hy a
nd IM
exp
endi
ture
s fo
r the
trac
k se
gmen
t Kilo
nan
Junc
tion
-Lim
eric
k
Lim
eric
k –
Bal
lybr
ophy
k
Net result
-11.
1
Capitalisation
0.9
Net Depreciation
0.3
Exceptionals
0.0
Cash result
-11.
7
Central expenditures2.
6
Central revenues
Unique + sharedEBITDAC
-9.1
Shared expenditures2)
0.8
Shared revenues1)
0.1
Unique EBITDAC
-8.3
Unique expenditures
-8.4
7.6
Unique revenues
0.0
BU c
harg
es
Cen
tral g
roup
cha
rges
Bala
nce
shee
t cha
nges
Tota
l
Geo
grap
hy-b
ased
Trai
n-ba
sed
Non
-rail
rela
ted
Frei
ght
Non
-fare
box
pax
reve
nue
Pax
reve
nue
4

6920
1605
09_R
PA_T
T_20
15_F
inal
_Rep
ort_
DR
AFT.
pptx
Cor
k co
mm
uter
has
a n
egat
ive
EUR
(12)
m c
ashf
low
befo
re a
nd
EUR
(15)
m a
fter a
lloca
tion
of c
entra
l exp
endi
ture
s, re
spec
tivel
y
Cor
k co
mm
uter
resu
lt [E
UR
m] –
AEC
OM
201
5
Sour
ce: I
arnr
ód É
irean
n, R
olan
d Be
rger
Cor
k co
mm
uter
l
1) S
hare
d re
venu
es in
clud
e O
D-p
air r
even
ues
for C
ork
com
mut
er, c
ar p
ark
and
prop
erty
& re
tail
reve
nues
; 2) S
hare
d ex
pend
iture
s in
clud
e sh
ared
sta
tion
expe
nditu
res
and
shar
ed IM
ex
pend
iture
s fo
r the
trac
k se
gmen
ts u
sed
by C
ork
Com
mut
er
Capitalisation
3.0
Net Depreciation
0.6
Exceptionals
0.0
Cash result
-15.
2
Central expenditures3.
4
Central revenues
Unique + sharedEBITDAC
-11.
8
Shared expenditures2)
6.1
Net result
2.7
Unique EBITDAC
-8.3
Unique expenditures
Shared revenues1)
7.7
Unique revenues
2.6
-12.
7
-10.
9
BU c
harg
es
Cen
tral g
roup
cha
rges
Bala
nce
shee
t cha
nges
Tota
l
Geo
grap
hy-b
ased
Trai
n-ba
sed
Non
-rail
rela
ted
Frei
ght
Non
-fare
box
pax
reve
nue
Pax
reve
nue
4

7020
1605
09_R
PA_T
T_20
15_F
inal
_Rep
ort_
DR
AFT.
pptx
Lim
eric
k –
Gal
way
has
a n
egat
ive
EUR
(10)
m c
ashf
low
befo
re a
nd
EUR
(13)
m a
fter a
lloca
tion
of c
entra
l exp
endi
ture
s, re
spec
tivel
y
Lim
eric
k-G
alw
ay re
sult
[EU
R m
]–AE
CO
M 2
015
Sour
ce: I
arnr
ód É
irean
n, R
olan
d Be
rger
1) S
hare
d re
venu
es in
clud
e O
D-p
air r
even
ues
for L
imer
ick
–En
nis
and
Athe
nry
–G
alw
ay, c
ar p
ark
and
prop
erty
& re
tail
reve
nues
; 2) S
hare
d ex
pend
iture
s in
clud
e sh
ared
sta
tion
expe
nditu
res
and
shar
ed IM
exp
endi
ture
s fo
r the
trac
k se
gmen
ts L
imer
ick
–En
nis
and
Athe
nry
–G
alw
ay
mLi
mer
ick
–G
alw
ay
Net result
-13.
2
Capitalisation
0.5
Net Depreciation
0.4
Exceptionals
0.0
Cash result
-13.
3
Central expenditures3.
3
Central revenues
Unique + sharedEBITDAC
-9.9
Shared expenditures2)
4.7
Shared revenues1)
0.9
Unique EBITDAC
-6.2
Unique expenditures
-6.7
4.7
Unique revenues
0.5
BU c
harg
es
Cen
tral g
roup
cha
rges
Bala
nce
shee
t cha
nges
Tota
l
Geo
grap
hy-b
ased
Trai
n-ba
sed
Non
-rail
rela
ted
Frei
ght
Non
-fare
box
pax
reve
nue
Pax
reve
nue
4

7120
1605
09_R
PA_T
T_20
15_F
inal
_Rep
ort_
DR
AFT.
pptx
Kild
are
subu
rban
has
a n
egat
ive
EUR
(7)m
cas
hflo
wbe
fore
and
EU
R (1
2)m
afte
r allo
catio
n of
cen
tral e
xpen
ditu
res,
resp
ectiv
ely
Kild
are
Subu
rban
resu
lt [E
UR
m]–
AEC
OM
201
5
Sour
ce: I
arnr
ód É
irean
n, R
olan
d Be
rger
1) S
hare
d re
venu
es in
clud
e O
D-p
air r
even
ues
for C
onno
lly -
Kild
are,
car
par
k an
d pr
oper
ty &
reta
il re
venu
es; 2
) Sha
red
expe
nditu
res
incl
ude
shar
ed s
tatio
n ex
pend
iture
s an
d sh
ared
IM
expe
nditu
res
for t
he tr
ack
segm
ents
bet
wee
n C
onno
lly a
nd K
ildar
e
nK
ildar
e su
burb
an
Net result
-7.3
Capitalisation
5.1
Net Depreciation
0.8
Exceptionals
Shared revenues1)
10.2
Unique EBITDAC
-5.7
Unique expenditures
-5.7
0.5
Unique revenues
0.1
-6.7 Unique + shared
EBITDAC
Central revenues
4.7 Central expenditures
-11.
5
Shared expenditures2)
Cash result
0.0
11.2
BU c
harg
es
Cen
tral g
roup
cha
rges
Bala
nce
shee
t cha
nges
Tota
l
Geo
grap
hy-b
ased
Trai
n-ba
sed
Non
-rail
rela
ted
Frei
ght
Non
-fare
box
pax
reve
nue
Pax
reve
nue
4

7220
1605
09_R
PA_T
T_20
15_F
inal
_Rep
ort_
DR
AFT.
pptx
Nor
ther
n su
burb
an h
as a
neg
ativ
e EU
R (1
0)m
cas
hflo
wbe
fore
and
EU
R (2
3)m
afte
r allo
catio
n of
cen
tral e
xpen
ditu
res,
resp
ectiv
ely
Nor
ther
n Su
burb
an re
sult
[EU
R m
]–AE
CO
M 2
015
Sour
ce: I
arnr
ód É
irean
n, R
olan
d Be
rger
1) S
hare
d re
venu
es in
clud
e O
D-p
air r
even
ues
for C
onno
lly -
Dun
dalk
, car
par
k an
d pr
oper
ty &
reta
il re
venu
es; 2
) Sha
red
expe
nditu
res
incl
ude
shar
ed s
tatio
n ex
pend
iture
s an
d sh
ared
IM
expe
nditu
res
for t
he tr
ack
segm
ents
bet
wee
n C
onno
lly a
nd D
unda
lk
oN
orth
ern
subu
rban
Unique EBITDAC
-10.
6
Unique expenditures
3.2
1.1
Unique revenues
Net result
-17.
7
-16.
2
Capitalisation
8.8
Net Depreciation
Exceptionals
0.3
Cash result
-23.
0Central expenditures
13.2
Central revenues
Unique + sharedEBITDAC
Shared revenues1)
-9.8
Shared expenditures2)12
.0
12.8
5.6
BU c
harg
es
Cen
tral g
roup
cha
rges
Bala
nce
shee
t cha
nges
Tota
l
Geo
grap
hy-b
ased
Trai
n-ba
sed
Non
-rail
rela
ted
Frei
ght
Non
-fare
box
pax
reve
nue
Pax
reve
nue
4

7320
1605
09_R
PA_T
T_20
15_F
inal
_Rep
ort_
DR
AFT.
pptx
Wes
tern
sub
urba
n ha
s a
nega
tive
EUR
(14)
m c
ashf
low
befo
re a
nd
EUR
(21)
m a
fter a
lloca
tion
of c
entra
l exp
endi
ture
s, re
spec
tivel
y
Wes
tern
Sub
urba
n re
sult
[EU
R m
]–AE
CO
M 2
015
Sour
ce: I
arnr
ód É
irean
n, R
olan
d Be
rger
1) S
hare
d re
venu
es in
clud
e O
D-p
air r
even
ues
for C
onno
lly -
Long
ford
, car
par
k an
d pr
oper
ty &
reta
il re
venu
es; 2
) Sha
red
expe
nditu
res
incl
ude
shar
ed s
tatio
n ex
pend
iture
s an
d sh
ared
IM
expe
nditu
res
for t
he tr
ack
segm
ents
bet
wee
n C
onno
lly a
nd L
ongf
ord
pW
este
rn s
ubur
ban
Net result
-18.
7
Capitalisation
4.1
Net Depreciation
1.7
Exceptionals
0.1
Cash result
-21.
0Central expenditures
7.2
Central revenues
Unique + sharedEBITDAC
-13.
8
Shared expenditures2)16
.9
Shared revenues1)
12.3
Unique EBITDAC
-9.3
Unique expenditures
-10.
21.
5
Unique revenues
1.0
BU c
harg
es
Cen
tral g
roup
cha
rges
Bala
nce
shee
t cha
nges
Tota
l
Geo
grap
hy-b
ased
Trai
n-ba
sed
Non
-rail
rela
ted
Frei
ght
Non
-fare
box
pax
reve
nue
Pax
reve
nue
4

7420
1605
09_R
PA_T
T_20
15_F
inal
_Rep
ort_
DR
AFT.
pptx
DAR
T ha
s a
posi
tive
EUR
2m
cash
flow
befo
re c
entra
l exp
endi
ture
s an
d EU
R (1
2)m
afte
r allo
catio
n of
cen
tral e
xpen
ditu
res
DAR
T re
sult
[EU
R m
]–AE
CO
M 2
015
Sour
ce: I
arnr
ód É
irean
n, R
olan
d Be
rger
1) S
hare
d re
venu
es in
clud
e O
D-p
air r
even
ues
for D
ART,
car
par
k an
d pr
oper
ty &
reta
il re
venu
es; 2
) Sha
red
expe
nditu
res
incl
ude
shar
ed s
tatio
n ex
pend
iture
s an
d sh
ared
IM e
xpen
ditu
res
for t
he tr
ack
segm
ents
use
d by
DAR
T
qD
AR
T
4.0
Exceptionals
0.2
Cash result
-12.
2Central expenditures
13.9
Central revenues
Unique + sharedEBITDAC
1.7
Shared expenditures2)7.
8
Shared revenues1)
26.7
Unique EBITDAC
Net result
Unique expenditures
-33.
2
16.2
Unique revenues
-17.
2
-9.4
Capitalisation
7.0
Net Depreciation
16.0
BU c
harg
es
Cen
tral g
roup
cha
rges
Bala
nce
shee
t cha
nges
Tota
l
Geo
grap
hy-b
ased
Trai
n-ba
sed
Non
-rail
rela
ted
Frei
ght
Non
-fare
box
pax
reve
nue
Pax
reve
nue
4

7520
1605
09_R
PA_T
T_20
15_F
inal
_Rep
ort_
DR
AFT.
pptx
Whe
n al
loca
ting
mar
gina
l exp
endi
ture
s on
ly, F
reig
ht h
as a
neg
ativ
e EU
R (2
)m c
ashf
low
befo
re c
entra
l exp
endi
ture
s an
d EU
R (2
)m a
fter
Frei
ght r
esul
t –m
argi
nal e
xpen
ditu
re a
ppro
ach
[EU
R m
]–AE
CO
M 2
015
Sour
ce: I
arnr
ód É
irean
n, R
olan
d Be
rger
1) S
hare
d ex
pend
iture
s in
clud
e sh
ared
sta
tion
expe
nditu
res
and
shar
ed IM
exp
endi
ture
s fo
r the
trac
k se
gmen
ts u
sed
by fr
eigh
t rou
tes:
Tar
a m
ines
–D
ublin
Por
t, W
estp
ort –
Wat
erfo
rd,
Ballin
a –
Wat
erfo
rd, B
allin
a -D
ublin
-1.8
-2.4
-6.1
0.0
Unique revenues
3.8
0.4
Central revenues3.
4
Unique + sharedEBITDAC
-1.5
Shared expenditures2)
Shared revenues1)
0.9
Unique EBITDAC
-2.3
Unique expenditures
0.5
Net Depreciation
Net result
Capitalisation
Exceptionals
Cash result
0.0
0.0
Central expenditures
Geo
grap
hy-b
ased
Cen
tral g
roup
cha
rges
Bala
nce
shee
t cha
nges
Frei
ght
BU c
harg
es
Tota
l
Non
-fare
box
pax
reve
nue
Pax
reve
nue
Non
-rail
rela
ted
Trai
n-ba
sed
Inte
rest
4

7620
1605
09_R
PA_T
T_20
15_F
inal
_Rep
ort_
DR
AFT.
pptx
F.Ap
pend
ix: D
etai
ls
on a
ppro
ach

7720
1605
09_R
PA_T
T_20
15_F
inal
_Rep
ort_
DR
AFT.
pptx
F.1
Rev
enue
allo
catio
n

7820
1605
09_R
PA_T
T_20
15_F
inal
_Rep
ort_
DR
AFT.
pptx
IÉha
s a
rang
e of
sys
tem
s fro
m w
hich
dat
a fo
r the
reve
nue
anal
ysis
ha
s be
en s
ourc
ed
1) R
ecor
ded
at z
ero
fare
(onl
y pa
xjo
urne
ys a
re re
cord
ed);
reve
nues
are
lum
p su
m fr
om M
inis
try; 2
) Usi
ng C
rouz
etbo
okin
g sy
stem
; 3) O
D-p
airs
unk
now
n; 4
) Tra
nsac
tion
fee
regi
ster
ed in
VA
X, n
ot in
SAP
; 5) O
D-p
airs
unk
now
n (V
AX ro
utes
0 a
nd 9
9); 6
) ful
l far
e in
VAX
, rev
enue
cap
ped
in S
AP;
7) E
-pur
se re
venu
e +
fulfi
llmen
t of m
onth
ly ta
x-sa
ver t
icke
ts
Sour
ce: I
arnr
ód É
irean
n, R
olan
d Be
rger
Tick
et ty
pePo
int o
f sal
eSo
urce
dat
abas
ePr
oces
sing
Bus
ines
s us
e
Nor
mal
tick
et
Old
Age
Pen
sion
er1)
Com
bina
tion
ticke
t6)
Mon
thly
tax-
save
r
Shor
t-hop
zon
e5)
Annu
al ta
x-sa
ver
X-bo
rder
soc
.wel
f.
CO
TIF/
Int'l
Scho
ols
& ot
hers
TVM
Tick
et o
ffice
2)
Onl
ine4)
Leap
sm
artc
ard7)
Third
par
ty
VAX
RM
S
BIK
Con
tract
tick
ets3)
ProC
larit
yR
even
ue a
naly
sis
SAP
Rev
enue
repo
rting
:O
D re
venu
eFT
Sre
venu
eAT
Sre
venu
e
Net
ting
>O
nlin
e>
Com
bi
OAP

7920
1605
09_R
PA_T
T_20
15_F
inal
_Rep
ort_
DR
AFT.
pptx
Build
ing
the
OD
-mat
rix re
quire
s ad
just
men
t of F
TSan
d AT
Sda
ta
whe
re IÉ
'sda
ta is
inco
mpl
ete
AFT
S re
venu
eEU
R 1
4.6m
BAT
S re
venu
eEU
R 2
4.1m
OD
-pai
r rev
enue
EUR
117
m
Adju
stm
ent
Adju
stm
ent
OD
-mat
rix
Jour
ney
num
bers
by
OD
-pai
r onl
y –
no re
venu
e
No
OD
-info
rmat
ion
for
EUR
1.4
m re
venu
e
Sour
ce: I
arnr
ód É
irean
n, R
olan
d Be
rger
Rev
enue
allo
catio
n m
etho
dolo
gy –
2014
exa
mpl
e

8020
1605
09_R
PA_T
T_20
15_F
inal
_Rep
ort_
DR
AFT.
pptx
ATS
and
FTS
OD
-reve
nue
was
cal
cula
ted
usin
g ot
her e
xist
ing
IÉin
form
atio
n
Free
Tra
vel S
chem
e (F
TS)
OD
-pai
r FTS
jour
neys
B
Inpu
t
Met
hodo
l-og
y to
al
loca
te
diffe
renc
e
OD
-pai
r non
-FTS
jo
urne
ys a
nd re
venu
e
Tota
l FTS
reve
nue
EUR
14.
6m
FTS
reve
nue
by O
D-
pair
(pro
form
a)
"Cor
rect
" FTS
reve
nue
by O
D-p
air
Ann
ual T
ax S
aver
(ATS
)A AT
S to
tal r
even
ueEU
R 2
4.1m
ATS
OD
-pai
r rev
enue
EUR
23.
8m
Diff
eren
ceEU
R 0
.3m
Diff
eren
ce is
driv
en b
y sa
les
timin
g di
ffere
nce,
ther
efor
e AT
S O
D-p
air
reve
nue
has
been
sca
led
up to
mat
ch
tota
l ATS
reve
nue
# jo
urne
ys b
y O
D-p
air
OD
-reve
nue
per
jour
ney
Met
hodo
logy
to c
alcu
late
FTS
/ATS
OD
reve
nues
–20
14 e
xam
ple
Sour
ce: I
arnr
ód É
irean
n, R
olan
d Be
rger

8120
1605
09_R
PA_T
T_20
15_F
inal
_Rep
ort_
DR
AFT.
pptx
The
OD
-reve
nue
is a
lloca
ted
to ro
utes
sha
ring
com
mon
in
frast
ruct
ure
usin
g pa
rticu
lar a
lloca
tion
algo
rithm
s
OD
-pai
r cha
ract
eris
tics
Allo
catio
n to
rout
e
Allo
catio
n to
in
divi
dual
ro
utes
Met
hodo
logy
to a
lloca
te O
D-re
venu
e to
rout
es s
harin
g co
mm
on in
frast
ruct
ure
O a
nd D
kn
own
No
inte
rcha
nge
To ro
utes
that
ope
rate
bet
wee
n th
e O
D p
air
A
Inte
rcha
nge
To D
ART
To IC
rout
esB
To o
ther
ICPr
opor
tiona
te to
dis
tanc
e of
the
two
jour
ney
segm
ents
C
O a
nd D
not
kn
own
Split
bet
wee
n su
burb
an a
nd D
ART
(pro
rate
d ba
sed
on a
bove
)
O o
r D
not k
now
nEi
ther
O o
r D
kno
wn
To ro
ute
of k
now
n st
atio
nD
Sour
ce: I
arnr
ód É
irean
n, R
olan
d Be
rger

8220
1605
09_R
PA_T
T_20
15_F
inal
_Rep
ort_
DR
AFT.
pptx
The
first
ste
p in
the
allo
catio
n of
OD
pai
rs to
rout
es is
the
iden
tific
atio
n of
resp
ectiv
e ro
ute
poss
ibilit
ies
No
inte
rcha
nge
A OD
-pai
r
Allo
cate
d to
rout
es
Cor
k –
Heu
ston
Thur
les
–H
eust
onC
ork
–La
nsdo
wne
Roa
dM
allo
w –
Wat
erfo
rdC
ork
–U
nkno
wn
Inte
rcha
nge
to
DA
RT
B
Inte
rcha
nge
to
othe
r IC
C
Eith
er O
or D
not
kn
own
D
Cor
k –
Heu
ston
Cor
k –
Heu
ston
Cor
k –
Heu
ston
Mal
low
–Li
mer
ick
Junc
tion:
>C
ork
–H
eust
on>
Tral
ee –
Heu
ston
Lim
eric
k Ju
nctio
n –
Wat
erfo
rd:
>Li
mer
ick
Junc
tion
–W
ater
ford
Cor
k –
Heu
ston
Tral
ee –
Heu
ston
Lim
eric
k –
Heu
ston
Cor
k –
Cob
h
Cor
k –
Mid
leto
n
Cor
k –
Mal
low
Exam
ples
of a
lloca
tions
of O
D-re
venu
e to
rout
e gr
oups
Sour
ce: I
arnr
ód É
irean
n, R
olan
d Be
rger

8320
1605
09_R
PA_T
T_20
15_F
inal
_Rep
ort_
DR
AFT.
pptx
OD
-reve
nue
whi
ch c
an b
e at
tribu
ted
to m
ultip
le ro
utes
has
then
be
en a
lloca
ted
by th
e re
leva
nt ro
utes
' ser
vice
freq
uenc
ies
Exam
ple
for a
lloca
tion
of O
D-re
venu
e in
cas
es o
f rou
te a
mbi
guity
>Pa
ssen
gers
trav
ellin
g fro
m T
hurle
s to
Dub
lin
Heu
ston
hav
e th
ree
rout
e ch
oice
s:–
Cor
k –
Dub
lin H
eust
on–
Tral
ee –
Dub
lin H
eust
on–
Lim
eric
k –
Dub
lin H
eust
on>
Rev
enue
of t
he T
hurle
s –
Dub
lin H
eust
on O
D-p
air
has
been
allo
cate
d pr
o-ra
ta b
y th
e fre
quen
cy o
f th
ese
rout
es o
n th
e O
D-p
air
–Th
is ro
ughl
y ap
prox
imat
es to
a p
asse
nger
taki
ng
the
next
trai
n co
min
g (n
egle
ctin
g tim
es o
f tra
vel)
>Th
urle
s –
Dub
lin H
eust
on O
D-re
venu
e th
eref
ore
split
s be
twee
n ro
utes
as
follo
ws:
–C
ork
–D
ublin
Heu
ston
EU
R 1
.31
m
75%
, 27/
36tp
d–
Tral
ee –
Dub
lin H
eust
onEU
R 0
.09
m
6%, 2
/36t
pd–
Lim
eric
k –
Dub
lin H
eust
onEU
R 0
.34
m
19%
, 7/3
6tpd
Dub
lin H
eust
on
Cor
k
Tral
eeLi
mer
ick
Junc
tion
Lim
eric
k
Mal
low
Thur
les
Sour
ce: I
arnr
ód É
irean
n, R
olan
d Be
rger

8420
1605
09_R
PA_T
T_20
15_F
inal
_Rep
ort_
DR
AFT.
pptx
F.2
TO c
ost a
lloca
tion

8520
1605
09_R
PA_T
T_20
15_F
inal
_Rep
ort_
DR
AFT.
pptx
IÉ c
olle
cts
expe
nditu
res
in S
AP c
ost c
entre
s w
hich
are
di
sagg
rega
ted
and
allo
cate
d to
rout
e
SAP
cost
cen
tre
Cos
t cen
tre: C
arlo
w s
tatio
n
Dis
aggr
egat
ed c
ost b
ucke
tA
lloca
tion
Exam
ple
for c
ost d
isag
greg
atio
n an
d al
loca
tion
to ro
ute
[EU
R]
Cos
t ele
men
ts:
>Ex
ec &
cle
rical
pay
>G
uard
s/TT
Cs
pay
>St
atio
n O
ps p
ay
>O
verh
eads
2)
>M
aint
enan
ce &
repa
ir
>M
ater
ials
>D
epre
ciat
ion
EUR
AAA
59,8
31
EUR
CC
C
EUR
DD
D
EUR
EEE
EUR
FFF
EUR
GG
G
>G
uard
s/TT
Cs
pay
EUR
BBB
Gua
rds/
TTC
s
E
UR
BBB
Car
low
sta
tion,
cos
t ele
men
ts:
>Ex
ec &
cle
rical
pay
>St
atio
n O
ps p
ay
>O
verh
eads
2)
>M
aint
enan
ce &
repa
ir
>M
ater
ials
>D
epre
ciat
ion
EUR
AAA
EUR
CC
C
EUR
DD
D
EUR
EEE
EUR
FFF
EUR
GG
G
Kild
are
–C
arlo
w tr
ack
segm
ent
Heu
ston
–W
ater
ford
rout
e1)
1) B
ased
on
Gua
rds/
TTC
rost
er; 2
) Prim
arily
con
tain
s ut
ility
expe
nditu
res
Sour
ce: I
arnr
ód É
irean
n, R
olan
d Be
rger
∑ ∑∑∑EU
R X
XX∑ ∑∑∑
EUR
XXX
∑ ∑∑∑EU
R X
XX

8620
1605
09_R
PA_T
T_20
15_F
inal
_Rep
ort_
DR
AFT.
pptx
We
have
val
idat
ed a
ll TO
cos
t ele
men
ts, c
ost c
entre
s an
d al
loca
tion
met
hodo
logi
es w
ith IÉ
TO
man
agem
ent
Prop
osed
cos
t allo
catio
n m
etho
dolo
gy –
Trai
n O
pera
tions
Sour
ce: I
arnr
ód É
irean
n, R
olan
d Be
rger
Dis
aggr
egat
ed c
ost c
entr
e ty
peLe
vel o
f dis
aggr
egat
ion
Allo
catio
n ke
y to
rout
eVa
lidat
ed w
ith
Pax
Ops
sta
tion
Sing
le s
tatio
nSt
atio
n to
trac
k se
gmen
t, tra
ck s
egm
ent t
o ro
ute
base
d on
ser
vice
freq
uenc
yJo
hn S
tack
Pax
Ops
dis
trict
Pax
ops
geog
raph
ical
di
stric
tD
istri
ct to
rout
es b
ased
on
serv
ice
frequ
ency
John
Sta
ck
Pax
Ops
ove
rhea
dAl
l rou
tes
Ove
rhea
d to
rout
e by
trai
n km
John
Sta
ck
Pax
Ops
trai
n cr
ewAl
l rou
tes
Trai
n cr
ew to
rout
e by
rost
erJo
hn S
tack
Pax
Ops
frei
ght
Frei
ght r
oute
sFr
eigh
t exp
endi
ture
s to
frei
ght r
oute
by
train
km
John
Sta
ck
CM
E m
aint
enan
ce d
epot
CM
E ge
ogra
phic
al d
istri
ctC
ME
mai
nten
ance
dep
ot to
flee
t, fle
et to
rout
es b
y tra
in k
mJo
hn S
tack
CM
E he
avy
mai
nten
ance
All f
leet
Hea
vy m
aint
enan
ce to
flee
t bas
ed o
n m
aint
enan
ce s
ched
ule,
flee
t to
rout
es b
y tra
in k
mJo
hn S
tack
CM
E de
partm
ent w
orks
hop
All f
leet
Wor
ksho
p to
flee
t, fle
et to
rout
e by
trai
n km
John
Sta
ck
CM
E de
partm
ent o
verh
ead
All f
leet
Ove
rhea
d to
flee
t, fle
et to
rout
e by
trai
n km
John
Sta
ck
Fuel
All f
leet
Fuel
to fl
eet,
fleet
to ro
ute
by tr
ain
kmJo
hn S
tack
Pax
Ops
driv
ers
All r
oute
sD
river
she
d to
rout
e by
rost
erJo
hn S
tack
Com
mer
cial
dep
artm
ent o
verh
ead
All p
ax ro
utes
Ove
rhea
d to
rout
e by
trai
n km
John
Sta
ck

8720
1605
09_R
PA_T
T_20
15_F
inal
_Rep
ort_
DR
AFT.
pptx
F.3
IM c
ost a
lloca
tion

8820
1605
09_R
PA_T
T_20
15_F
inal
_Rep
ort_
DR
AFT.
pptx
IM e
xpen
ditu
res
are
allo
cate
d to
rout
es v
ia in
term
edia
ry c
ost
buck
ets
and
track
seg
men
ts
Cos
t allo
catio
n to
rout
es: I
M
∑An
nual
IM
expe
nditu
res
for r
oute
Rou
te
expe
nditu
res
Sour
ce: I
arnr
ód É
irean
n, R
olan
d Be
rger
1) C
hief
Civ
il En
gine
er; 2
) Sig
nallin
g, E
lect
rific
atio
n, T
elec
omm
unic
atio
ns; 3
) Inf
rast
ruct
ure
Man
agem
ent O
pera
tions
; 4) B
uild
ings
& F
acilit
ies;
5) O
ut o
f sco
pe
Inte
rmed
iary
cost
buc
ket
Allo
catio
n
Oth
er e
xpen
ditu
res
(e.g
., IM
ove
rhea
d) a
lloca
ted
to
track
seg
men
t on
basi
s of
sha
re o
f tot
al tr
ack
km
New
wor
ks5)
Ope
ratio
nal
expe
nditu
res
Cur
rent
cos
tco
llect
ion
Car
e &
m
aint
enan
ce
expe
nditu
res
Cos
t ele
men
ts
CC
E1)IM su
bdiv
isio
nTr
ack
segm
ent
On/
off
EUR
/km
x tr
ack
kmEn
gine
ers
Mat
eria
lsO
verh
eads
SET2)
IM subd
ivis
ion
Trac
k se
gmen
tO
n/of
fEU
R/k
m x
trac
k km
Engi
neer
sM
ater
ials
Ove
rhea
ds
IMO
3)IM tra
ck s
egm
ent
Trac
k se
gmen
tO
n/of
fEU
R/k
m x
trac
k km
Gat
ekee
pers
Sign
al s
taff
Ove
rhea
ds
B&F4)
IM regi
onTr
ack
segm
ent
On/
off
EUR
/km
x tr
ack
kmEn
gine
ers
Mat
eria
lsO
verh
eads
Segm
ent a
djus
tmen
ts

8920
1605
09_R
PA_T
T_20
15_F
inal
_Rep
ort_
DR
AFT.
pptx
We
have
val
idat
ed a
ll IM
cos
t ele
men
ts, c
ost c
entre
s an
d al
loca
tion
met
hodo
logi
es w
ith IÉ
man
agem
ent (
1/2)
Prop
osed
cos
t allo
catio
n m
etho
dolo
gy –
Infra
stru
ctur
e M
anag
emen
t1) (1
/2)
1) T
he N
ew W
orks
dep
artm
ent i
s no
t inc
lude
d in
the
rout
e pr
ofita
bilit
y an
alys
is; 2
) PW
I= P
erm
anen
t Way
Insp
ecto
r; 3)
Allo
catio
n ke
ys d
evel
oped
and
pro
vide
d by
Eric
Nol
an
Sour
ce: I
arnr
ód É
irean
n, R
olan
d Be
rger
Dis
aggr
egat
ed c
ost c
entr
e ty
pe
Cat
hy M
cVic
ker
IM B
usin
ess
Uni
tO
verh
ead
to tr
ack
segm
ent b
ased
on
track
km
, to
rout
e ba
sed
on s
ervi
ce fr
eque
ncy
Full
netw
ork
Cat
hy M
cVic
ker
CC
E de
partm
ent o
verh
ead
Ove
rhea
d to
trac
k se
gmen
t bas
ed o
n tra
ck k
m, t
o ro
ute
base
d on
ser
vice
freq
uenc
yFu
ll ne
twor
k
Cat
hy M
cVic
ker
PWI2)
subd
ivis
ion
PWI s
ubdi
visi
on to
trac
k se
gmen
t bas
ed o
n tra
ck k
m,
to ro
ute
base
d on
ser
vice
freq
uenc
yPW
I geo
grap
hica
l sub
divi
sion
Cat
hy M
cVic
ker
PWI d
ivis
ion
PWI d
ivis
ion
to P
WI s
ubdi
visi
on b
ased
on
geog
rahp
y,
PWI s
ubdi
visi
on to
trac
k se
gmen
t bas
ed o
n tra
ck k
m,
to ro
ute
base
d on
ser
vice
freq
uenc
y
PWI g
eogr
aphi
cal d
ivis
ion
Cat
hy M
cVic
ker
SET
depa
rtmen
t ove
rhea
dO
verh
ead
to tr
ack
segm
ent b
ased
on
track
km
, to
rout
e ba
sed
on s
ervi
ce fr
eque
ncy
Full
netw
ork
track
km
Cat
hy M
cVic
ker
SET
divi
sion
SET
divi
sion
to tr
ack
segm
ent b
ased
on
sign
allin
g co
mpl
exity
3), t
o ro
ute
base
d on
ser
vice
freq
uenc
ySE
T ge
ogra
phic
al d
ivis
ion
Cat
hy M
cVic
ker
Rou
te ty
peR
oute
type
to tr
ack
segm
ent b
ased
on
track
km
, to
rout
e ba
sed
on s
ervi
ce fr
eque
ncy
Rou
te ty
pe (I
C, c
omm
., D
ART)
Cat
hy M
cVic
ker
Tele
com
s di
visi
ons
Tele
com
div
isio
n to
trac
k se
gmen
t bas
ed o
n te
lco
com
plex
ity3)
, to
rout
e ba
sed
on s
ervi
ce fr
eque
ncy
Telc
o ge
ogra
phic
al d
ivis
ion
Leve
l of d
isag
greg
atio
nA
lloca
tion
key
to ro
ute
Valid
ated
with

9020
1605
09_R
PA_T
T_20
15_F
inal
_Rep
ort_
DR
AFT.
pptx
We
have
val
idat
ed a
ll IM
cos
t ele
men
ts, c
ost c
entre
s an
d al
loca
tion
met
hodo
logi
es w
ith IÉ
man
agem
ent (
2/2)
Prop
osed
cos
t allo
catio
n m
etho
dolo
gy –
Infra
stru
ctur
e M
anag
emen
t1)(2
/2)
1) T
he N
ew W
orks
dep
artm
ent i
s no
t inc
lude
d in
the
rout
e pr
ofita
bilit
y an
alys
is; 2
) LXC
C=
Leve
l Cro
ssin
g C
ontro
l Cen
tre; 3
) CTC
= C
entra
l Tra
ffic
Con
trol
Sour
ce: I
arnr
ód É
irean
n, R
olan
d Be
rger
Cat
hy M
cVic
ker
B&F
divi
sion
B&F
geog
raph
ical
div
isio
nB&
F di
visi
on to
sta
tions
bas
ed o
n pa
ssen
ger f
ootfa
ll,
stat
ions
to tr
ack
segm
ent b
ased
on
geog
raph
y, to
ro
utes
bas
ed o
n se
rvic
e fre
quen
cy
Cat
hy M
cVic
ker
B&F
depa
rtmen
t ove
rhea
dB&
F di
visi
onB&
F ov
erhe
ad to
B&F
div
isio
n ba
sed
on B
&F d
ivis
ion
spen
d, B
&F d
ivis
ion
to s
tatio
ns b
ased
on
pass
enge
r fo
otfa
ll, s
tatio
ns to
trac
k se
gmen
t bas
ed o
n ge
ogra
phy,
to ro
utes
bas
ed o
n se
rvic
e fre
quen
cy
Cat
hy M
cVic
ker
IMO
dep
artm
ent o
verh
ead
Full
netw
ork
Ove
rhea
d to
trac
k se
gmen
t bas
ed o
n tra
ck k
m, t
o ro
ute
base
d on
ser
vice
freq
uenc
y
Cat
hy M
cVic
ker
IMO
sig
nalp
erso
n di
visi
onIM
O g
eogr
aphi
cal d
ivis
ion
Sign
alpe
rson
div
isio
n to
trac
k se
gmen
t bas
ed o
n lo
catio
n an
d he
adco
unt,
to ro
ute
base
d on
ser
vice
fre
quen
cy
Cat
hy M
cVic
ker
IMO
gat
ekee
pers
div
isio
nIM
O g
eogr
aphi
cal d
ivis
ion
Gat
ekee
per d
ivis
ion
to tr
ack
segm
ent b
ased
on
loca
tion
and
head
coun
t, to
rout
e ba
sed
on s
ervi
ce
frequ
ency
IMO
LXC
C2)
IMO
LXC
C d
ivis
ion
LXC
C to
trac
k se
gmen
t bas
ed o
n LX
geo
grap
hy, t
o ro
ute
base
d on
ser
vice
freq
uenc
yC
athy
McV
icke
r
IMO
CTC
3)IM
O C
TC d
ivis
ion
CTC
to tr
ack
segm
ent b
ased
on
geog
raph
y, to
rout
e ba
sed
on s
ervi
ce fr
eque
ncy
Cat
hy M
cVic
ker
Dis
aggr
egat
ed c
ost c
entr
e ty
peLe
vel o
f dis
aggr
egat
ion
Allo
catio
n ke
y to
rout
eVa
lidat
ed w
ith

9120
1605
09_R
PA_T
T_20
15_F
inal
_Rep
ort_
DR
AFT.
pptx
We
have
val
idat
ed a
ll fre
ight
cos
t ele
men
ts, c
ost c
entre
s an
d al
loca
tion
met
hodo
logi
es w
ith IÉ
freig
ht m
anag
emen
t
Prop
osed
cos
t allo
catio
n m
etho
dolo
gy –
Frei
ght1)
1) M
any
of th
e op
erat
iona
l fre
ight
exp
endi
ture
s ar
e bo
oked
in T
rain
Ope
ratio
ns c
ost c
entre
s an
d ha
ve b
een
dise
ntan
gled
from
thos
e co
st c
entre
s an
d al
loca
ted
to fr
eigh
t rou
tes
Sour
ce: I
arnr
ód É
irean
n, R
olan
d Be
rger
Frei
ght d
epar
tmen
t ove
rhea
dAl
l fre
ight
rout
esO
verh
ead
to ro
ute
by tr
ain
kmJo
hn S
tack
Fast
rack
All p
asse
nger
rout
esFa
sttra
ck to
rout
e by
trai
n km
John
Sta
ck
Dis
aggr
egat
ed c
ost c
entr
e ty
peLe
vel o
f dis
aggr
egat
ion
Allo
catio
n ke
y to
rout
eVa
lidat
ed w
ith

9220
1605
09_R
PA_T
T_20
15_F
inal
_Rep
ort_
DR
AFT.
pptx
F.4
Valid
atio
n

9320
1605
09_R
PA_T
T_20
15_F
inal
_Rep
ort_
DR
AFT.
pptx
All e
lem
ents
with
in th
e ro
ute
prof
itabi
lity
mod
el h
ave
been
val
idat
ed
with
the
resp
onsi
ble
coun
terp
arts
with
in Ia
rnró
d Éi
rean
n
Col
lect
dat
aD
iscu
ss d
ata
Dis
cuss
al
loca
tion
met
hodo
logy
Dis
cuss
fo
llow
-up
ques
tions
in
cas
e ne
eded
Valid
ate
allo
catio
n re
sult
on
elem
ent l
evel
Valid
ate
allo
catio
n re
sult
on
rout
e P&
L le
vel
Valid
atio
n pr
oces
s ro
ute
prof
itabi
lity
anal
ysis
Sour
ce: I
arnr
ód É
irean
n, R
olan
d Be
rger

9420
1605
09_R
PA_T
T_20
15_F
inal
_Rep
ort_
DR
AFT.
pptx
All d
ata
and
allo
catio
n pr
oces
ses
used
hav
e be
en v
alid
ated
by
IÉm
anag
emen
t
Valid
atio
n pr
ogre
ss a
t pro
ject
fina
lisat
ion
Sour
ce: I
arnr
ód É
irean
n, R
olan
d Be
rger
Trai
n O
pera
tions
John
Sta
ck
Ros
ter-r
oute
(ser
vice
freq
uenc
y)Tr
ain
host
s
Stat
ion-
rout
e (s
ervi
ce fr
eque
ncy)
Stat
ions
# st
atio
n m
grs/
stat
ion-
TS-ro
ute
Stat
ion
man
ager
s
Vario
usO
ther
Trai
n km
Pass
enge
r O
pera
tions
1) T
rack
seg
men
t
Gen
eral
allo
catio
n m
etho
dolo
gyPr
imar
y co
st ty
pes
Valid
atio
nD
ivis
ion
IÉ v
alid
atio
n ow
ners
hip
Trai
n km
Mat
eria
ls, l
abou
r, m
aint
enan
ce,
over
head
CM
EJo
hn S
tack
Infr
astr
uctu
re
Man
agem
ent
Subd
ivis
ion-
TS-ro
ute
SET
Labo
ur, m
ater
ials
Cat
hy M
cVic
ker
Don
eN
ot d
iscu
ssed
yet
CC
ESu
bdiv
isio
n-TS
-rout
eLa
bour
, mat
eria
ls
Hea
dcou
nt-T
S-ro
ute
IMO
Labo
ur, o
verh
ead
B&F
Hea
dcou
nt/re
gion
-TS-
rout
e La
bour
, ove
rhea
d
Driv
ers
Ros
ter-r
oute
(ser
vice
freq
uenc
y)
Com
mer
cial
Mar
ia F
inne
gan
Rev
enue
sSe
rvic
e fre
quen
cy

9520
1605
09_R
PA_T
T_20
15_F
inal
_Rep
ort_
DR
AFT.
pptx
F.5
Inte
rpre
tatio
n of
resu
lts
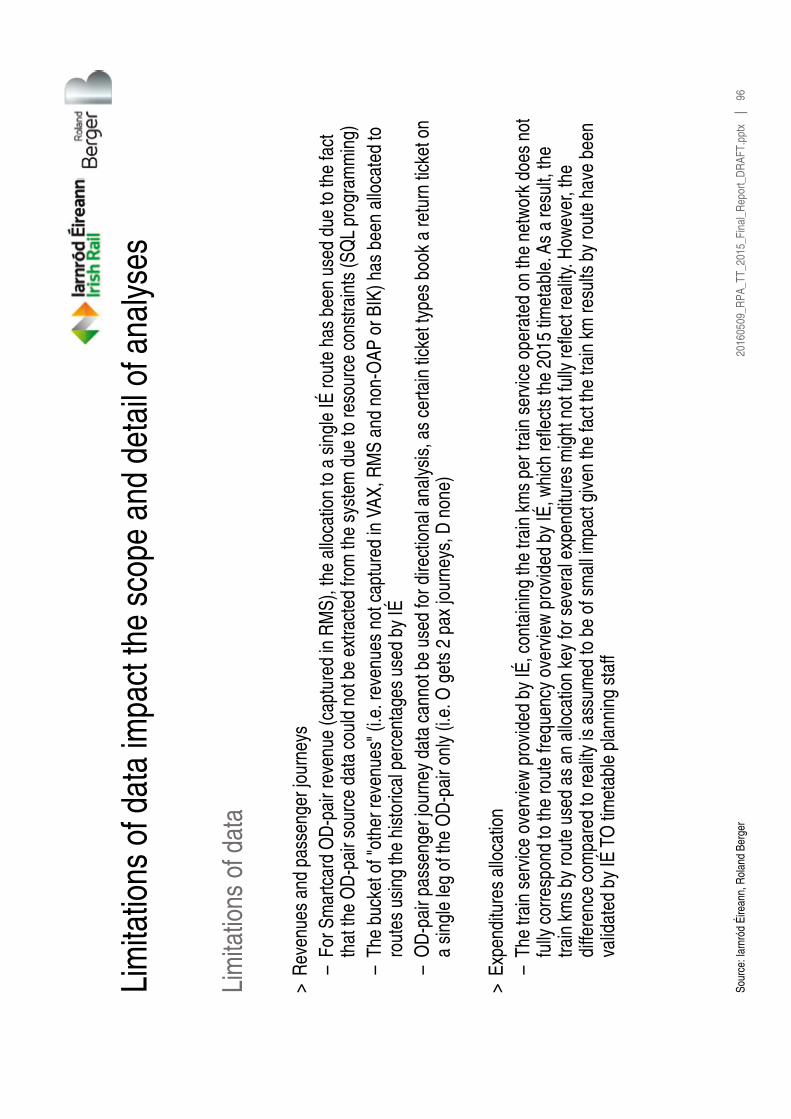
9620
1605
09_R
PA_T
T_20
15_F
inal
_Rep
ort_
DR
AFT.
pptx
Lim
itatio
ns o
f dat
a im
pact
the
scop
e an
d de
tail
of a
naly
ses
Sour
ce: I
arnr
ód É
irean
n, R
olan
d Be
rger
Lim
itatio
ns o
f dat
a
>R
even
ues
and
pass
enge
r jou
rney
s–
For S
mar
tcar
d O
D-p
air r
even
ue (c
aptu
red
in R
MS)
, the
allo
catio
n to
a s
ingl
e IÉ
rout
e ha
s be
en u
sed
due
to th
e fa
ct
that
the
OD
-pai
r sou
rce
data
cou
ld n
ot b
e ex
tract
ed fr
om th
e sy
stem
due
to re
sour
ce c
onst
rain
ts (S
QL
prog
ram
min
g)–
The
buck
et o
f "ot
her r
even
ues"
(i.e
. rev
enue
s no
t cap
ture
d in
VAX
, RM
San
d no
n-O
AP o
r BIK
) has
bee
n al
loca
ted
to
rout
es u
sing
the
hist
oric
al p
erce
ntag
es u
sed
by IÉ
–O
D-p
air p
asse
nger
jour
ney
data
can
not b
e us
ed fo
r dire
ctio
nal a
naly
sis,
as
certa
in ti
cket
type
s bo
ok a
retu
rn ti
cket
on
a si
ngle
leg
of th
e O
D-p
air o
nly
(i.e.
O g
ets
2 pa
x jo
urne
ys, D
non
e)
>Ex
pend
iture
s al
loca
tion
–Th
e tra
in s
ervi
ce o
verv
iew
pro
vide
d by
IÉ, c
onta
inin
g th
e tra
in k
ms
per t
rain
ser
vice
ope
rate
d on
the
netw
ork
does
not
fu
lly c
orre
spon
d to
the
rout
e fre
quen
cy o
verv
iew
pro
vide
d by
IÉ, w
hich
refle
cts
the
2015
tim
etab
le. A
s a
resu
lt, th
e tra
in k
ms
by ro
ute
used
as
an a
lloca
tion
key
for s
ever
al e
xpen
ditu
res
mig
ht n
ot fu
lly re
flect
real
ity. H
owev
er, t
he
diffe
renc
e co
mpa
red
to re
ality
is a
ssum
ed to
be
of s
mal
l im
pact
giv
en th
e fa
ct th
e tra
in k
m re
sults
by
rout
e ha
ve b
een
valid
ated
by
IÉ T
O ti
met
able
pla
nnin
g st
aff

9720
1605
09_R
PA_T
T_20
15_F
inal
_Rep
ort_
DR
AFT.
pptx
Lim
itatio
ns o
f dat
a im
pact
the
exte
nt to
whi
ch th
e m
odel
resu
lts
refle
ct re
ality
Sour
ce: I
arnr
ód É
irean
n, R
olan
d Be
rger
Lim
itatio
ns o
f app
roac
h
>Th
e re
venu
e al
loca
tion
met
hodo
logy
use
d re
flect
s pa
ssen
ger b
ehav
iour
to a
cer
tain
ext
ent b
ut h
as it
s lim
itatio
ns:
–If
both
O a
nd D
are
on
DAR
T it
is a
lloca
ted
dire
ctly
to D
ART
–If
both
O a
nd D
are
bot
h on
a ro
ute
they
are
allo
cate
d to
it. I
f the
y ar
e bo
th o
n m
ore
than
one
rout
e, it
is s
plit
betw
een
the
rout
es a
ccor
ding
to th
eir f
requ
ency
.–
If O
or D
are
"unk
now
n" o
r "Al
l Sta
tions
" the
n th
e re
venu
e is
spl
it ac
cord
ing
by fr
eque
ncy
of th
e ro
utes
thro
ugh
the
othe
r sta
tion
in th
e O
D-p
air
–If
O o
r D a
re o
n D
ART
then
the
reve
nue
is s
plit
acco
rdin
g by
freq
uenc
y of
the
rout
es th
roug
h th
e ot
her s
tatio
n in
the
OD
-pai
r–
Split
by
inte
rcha
nge
algo
rithm
–Th
e "U
nkno
wn"
-"Unk
now
n" a
nd "A
ll St
atio
ns"-"
All S
tatio
ns" O
D-p
air r
even
ue is
spl
it be
twee
n Su
burb
an D
ublin
and
D
ART
rout
es a
ccor
ding
thei
r sub
-tota
l rev
enue
frac
tion

9820
1605
09_R
PA_T
T_20
15_F
inal
_Rep
ort_
DR
AFT.
pptx
The
natu
re o
f the
dat
a an
d th
e an
alys
is in
the
mod
el n
eces
sita
tes
care
ful i
nter
pret
atio
n of
resu
lts
Star
ting
poin
ts fo
r mod
el re
sult
inte
rpre
tatio
n
Sour
ce: I
arnr
ód É
irean
n, R
olan
d Be
rger
The
resu
lting
cal
cula
tion
give
s an
allo
catio
n of
the
tota
l pro
fitab
ility
acr
oss
each
rout
e >
This
is a
n al
loca
tion
of th
e Ac
tual
s 20
15 p
rofit
abilit
y>
The
mod
el d
oes
not c
alcu
late
a b
usin
ess
case
for o
rgan
isat
iona
l or t
rain
-ser
vice
cha
nges
(oth
er th
an th
e in
tend
ed
switc
h to
'ste
ady-
stat
e' IM
exp
endi
ture
s by
rout
e)
Rev
enue
s
>R
even
ues
have
, as
far a
s po
ssib
le, b
een
dete
rmin
ed o
n a
stat
ion-
to-s
tatio
n O
D b
asis
–H
owev
er, w
e do
not
kno
w th
e tru
e ge
ogra
phic
al O
D
of th
e pa
ssen
gers
' tot
al jo
urne
y (i.
e., i
nclu
ding
thei
r st
atio
n ac
cess
and
egr
ess
trips
)>
OD
reve
nues
hav
e be
en a
ttrib
uted
to ro
utes
on
the
basi
s of
ser
vice
freq
uenc
y (a
sig
nific
ant c
hang
e to
pr
evio
us p
ract
ice)
Expe
nditu
res
>C
ost c
entre
s ha
ve b
een
disa
ggre
gate
d to
a le
vel w
here
a
sing
le a
lloca
tion
key
is re
ason
able
to a
lloca
te th
e ex
pend
iture
s ac
ross
rout
es>
Expe
nditu
res
have
then
bee
n id
entif
ied
as b
eing
uni
que
to a
rout
e, o
r sha
red
with
oth
er ro
utes
>20
15 a
ctua
ls IM
exp
endi
ture
s ar
e bi
ased
tow
ards
the
mai
n ro
utes
(due
to h
avin
g re
ceiv
ed le
ss a
ttent
ion
in
prev
ious
yea
rs)
>U
nder
-inve
stm
ent h
as b
een
addr
esse
d th
roug
h in
cor-
pora
tion
of th
e AE
CO
M re
port
resu
lts

9920
1605
09_R
PA_T
T_20
15_F
inal
_Rep
ort_
DR
AFT.
pptx
In c
onsi
derin
g po
ssib
le c
hang
es to
a ro
ute,
add
ition
al a
naly
sis
wou
ld b
e re
quire
d to
bui
ld a
full
busi
ness
cas
e
Addi
tiona
l con
side
ratio
ns fo
r bus
ines
s ca
se d
evel
opm
ent
Sour
ce: I
arnr
ód É
irean
n, R
olan
d Be
rger
Rev
enue
s>
To w
hat e
xten
t can
reve
nues
be
reca
ptur
ed, t
hrou
gh ra
il-he
adin
g an
d im
prov
ed b
us s
ervi
ces
to s
tatio
ns s
till
serv
ed?
>To
wha
t ext
ent w
ould
jour
neys
be
lost
due
to re
duce
d fre
quen
cy a
nd/o
r inc
reas
ed jo
urne
y tim
e or
inte
rcha
nge
requ
irem
ents
?
Trai
n-ba
sed
expe
nditu
res
>H
ow q
uick
ly c
ould
exp
endi
ture
s be
redu
ced
in li
ne w
ith
redu
ced
serv
ices
, and
at w
hat c
ost?
>Ef
ficie
ncie
s of
rost
erin
g an
d di
agra
mm
ing
>N
o sh
ared
trai
n-ba
sed
expe
nditu
res
Geo
grap
hy-
base
d ex
pend
iture
s
>H
ow q
uick
ly c
ould
exp
endi
ture
s be
redu
ced
in li
ne w
ith
redu
ced
serv
ices
, and
at w
hat c
ost?
>Va
lidat
ion
of e
stim
ated
hig
h-le
vel c
are
and
mai
nten
ance
co
st re
quire
men
ts
>W
ith w
hat e
xten
t wou
ld re
duce
d/ex
pand
ed s
ervi
ces
allo
w re
duct
ions
/requ
ire in
crea
ses
in s
tatio
n or
IM
expe
nditu
res?
>N
o ce
ntra
l uni
que
expe
nditu
res
>W
ith a
redu
ced/
expa
nded
ser
vice
, wha
t cha
nges
co
uld/
wou
ld n
eed
to b
e m
ade
to th
e ce
ntra
l fun
ctio
ns?
Cen
tral
ex
pend
iture
s
Uni
que
to a
rout
eSh
ared
bet
wee
n ro
utes


Appendix 7 August 2016
Line Segment Analysis(Roland Berger Report)

Segm
ent a
naly
ses
–(D
RAF
T)C
omm
erci
ally
sen
sitiv
e do
cum
ent
Iarn
ród
Éire
ann
will,
if
nece
ssar
y, re
ques
t the
app
licat
ion
of S
ectio
n 27
(1) o
f the
Fr
eedo
m o
f Inf
orm
atio
n Ac
t. N
ot to
be
give
n to
AN
Y O
THER
PAR
TY w
ithou
t the
prio
r writ
ten
perm
issi
on o
f Ia
rnró
dÉi
rean
n
9M
ay 2
016
Rou
te P
rofit
abilit
y

220
1605
09_R
PA_s
egm
ent_
anal
yses
_Fin
al_R
epor
t_D
RAF
T.pp
tx
Impo
rtant
not
ice
1.Th
is p
rese
ntat
ion
has
been
com
pile
d fo
r the
exc
lusi
ve, i
nter
nal u
se b
y ou
r clie
nt. W
ithin
the
fram
ewor
k of
the
enga
gem
ent,
Rol
and
Berg
er L
imite
d ("R
B") w
ill ac
t so
lely
in th
e in
tere
st o
f the
clie
nt. P
rope
rty ri
ghts
in fa
vor o
f thi
rd p
artie
s w
ill no
t be
cons
titut
ed a
nd n
o pr
otec
tive
effe
ctsh
all a
rise
for t
he b
enef
it of
third
par
ties.
2.Th
e pr
esen
tatio
n sh
all b
e tre
ated
as
conf
iden
tial a
nd m
ay n
ot b
e pa
ssed
on
and/
or m
ay n
ot b
e m
ade
avai
labl
e to
third
par
ties
with
out p
rior w
ritte
n co
nsen
t fro
m R
B. It
is
not
com
plet
e w
ithou
t the
und
erly
ing
deta
iled
anal
yses
and
the
oral
pre
sent
atio
n.
3.R
B do
es n
ot a
ssum
e an
y re
spon
sibi
lity
for t
he c
ompl
eten
ess
and
accu
racy
of a
ny d
ocum
ents
and
info
rmat
ion
mad
e av
aila
ble
to R
Bin
the
cour
se o
f the
pro
ject
. RB
assu
mes
that
the
data
and
doc
umen
ts p
rovi
ded
are
com
plet
e, c
ompr
ehen
sive
and
that
the
cont
ents
are
trut
hful
and
exa
ct; a
det
aile
d ex
amin
atio
n ha
s on
ly b
een
cond
ucte
d by
RB
if st
ated
so
in th
e pr
esen
tatio
n.
4.R
B's
scop
e of
ser
vice
s in
clud
ed th
e cr
eatio
n of
a ro
ute
prof
itabi
lity
anal
ysis
. The
dec
isio
n ov
er th
e us
e, th
e ev
alua
tion
of th
e ap
plic
abilit
y an
d th
e us
e of
the
pres
enta
tion
by R
B ar
e th
e so
le re
spon
sibi
lity
of th
e cl
ient
. The
con
tent
and
sco
pe o
f the
pre
sent
atio
n is
exc
lusi
vely
at t
hedi
scre
tion
of R
B.
5.Th
is p
rese
ntat
ion
has
been
com
pile
d ba
sed
on th
e G
ener
al T
erm
s an
d C
ondi
tions
of R
B as
atta
ched
to th
is p
rese
ntat
ion.
Any
use
of t
his
pres
enta
tion
(or e
xcer
pts
of
it) o
r its
con
tent
mus
t onl
y be
mad
e w
ithin
the
scop
e of
the
Gen
eral
Ter
ms
and
Con
ditio
ns o
f RB.
It is
exp
licitl
y st
ated
that
sect
ion
2 no
. 2 (n
o pr
otec
tive
effe
ct fo
r the
be
nefit
of t
hird
par
ties)
and
sec
tion
9 (li
mita
tion
of li
abilit
y) o
f the
Gen
eral
Ter
ms
and
Con
ditio
ns o
f RB
appl
y. If
, not
with
stan
ding
the
inte
ntio
n of
the
parti
es, p
rope
rty
right
s in
favo
r of t
hird
par
ties
shal
l be
cons
titut
ed, s
ectio
n 33
4 BG
B(G
erm
an C
ivil
Cod
e) s
hall
appl
y m
utat
is m
utan
dis.
Any
pos
sibl
e lia
bilit
y to
third
par
ties
is li
mite
d ac
cord
ing
to s
ectio
n 9
of th
e G
ener
al T
erm
s an
d C
ondi
tions
of R
B.
6.Th
is d
ocum
ent s
hall
be tr
eate
d as
con
fiden
tial.
It ha
s be
en c
ompi
led
for t
he e
xclu
sive
, int
erna
l use
by
our c
lient
and
is n
otco
mpl
ete
with
out t
he u
nder
lyin
g de
tail
anal
yses
and
the
oral
pre
sent
atio
n. It
may
not
be
pass
ed o
n an
d/or
may
not
be
mad
e av
aila
ble
to th
ird p
artie
s w
ithou
t prio
r writ
ten
cons
ent f
rom
Rol
and
Berg
er
Stra
tegy
Con
sulta
nts.
RB
does
not
ass
ume
any
resp
onsi
bilit
y fo
r the
com
plet
enes
s an
d ac
cura
cy o
f the
sta
tem
ents
mad
e in
this
doc
umen
t.
© R
olan
d Be
rger
Lim
ited

320
1605
09_R
PA_s
egm
ent_
anal
yses
_Fin
al_R
epor
t_D
RAF
T.pp
tx
Con
tent
sPa
ge
This
doc
umen
t sha
ll be
trea
ted
as c
onfid
entia
l. It
has
been
com
pile
d fo
r the
exc
lusi
ve, i
nter
nal u
se b
y ou
r clie
nt a
nd is
not
com
plet
e w
ithou
t the
und
erly
ing
deta
il an
alys
es a
nd th
e or
al p
rese
ntat
ion.
It
may
not
be
pass
ed o
n an
d/or
may
not
be
mad
e av
aila
ble
to th
ird p
artie
s w
ithou
t prio
r writ
ten
cons
ent f
rom
.
© R
olan
d Be
rger
A.In
trodu
ctio
n4
B.Se
gmen
t def
initi
on7
C.
Segm
ent a
naly
sis
resu
lts11

420
1605
09_R
PA_s
egm
ent_
anal
yses
_Fin
al_R
epor
t_D
RAF
T.pp
tx
A.In
trodu
ctio
n

520
1605
09_R
PA_s
egm
ent_
anal
yses
_Fin
al_R
epor
t_D
RAF
T.pp
tx
Segm
ent
Ana
lyse
s
Cor
e R
oute
Pr
ofita
bilit
y Pr
ojec
t
The
Segm
ent A
naly
ses
repr
esen
t the
firs
t ste
p to
war
ds d
evel
opin
g bu
sine
ss c
ases
for n
etw
ork/
serv
ice
chan
ges
Cur
rent
situ
atio
nR
oute
pro
fitab
ility
Segm
ent a
naly
sis
impa
ct o
n IÉ
op
erat
ions
Bus
ines
s ca
se fo
r se
gmen
t ana
lyse
sW
ider
issu
es
>R
even
ues
and
cost
s by
bus
ines
s un
it>
Prof
it by
rout
e by
:–
Con
tribu
tion
leve
l–
Busi
ness
uni
t
>D
irect
reve
nue
impa
ct>
Esca
pabl
e un
ique
ex
pend
iture
s im
pact
>C
apex
requ
ired
>O
rgan
isat
iona
l cha
nge
>Ex
cept
iona
ls>
Alte
rnat
ive
usag
e of
as
sets
>In
dire
ct re
venu
e im
pact
>Ti
min
g of
sav
ings
qu
antif
ied
>W
ider
eco
nom
ic
impa
ct>
Stak
ehol
der v
iew
s>
Envi
ronm
enta
l im
pact
>…
Con
text
of r
oute
pro
fitab
ility
proj
ect
Sour
ce: R
olan
d Be
rger
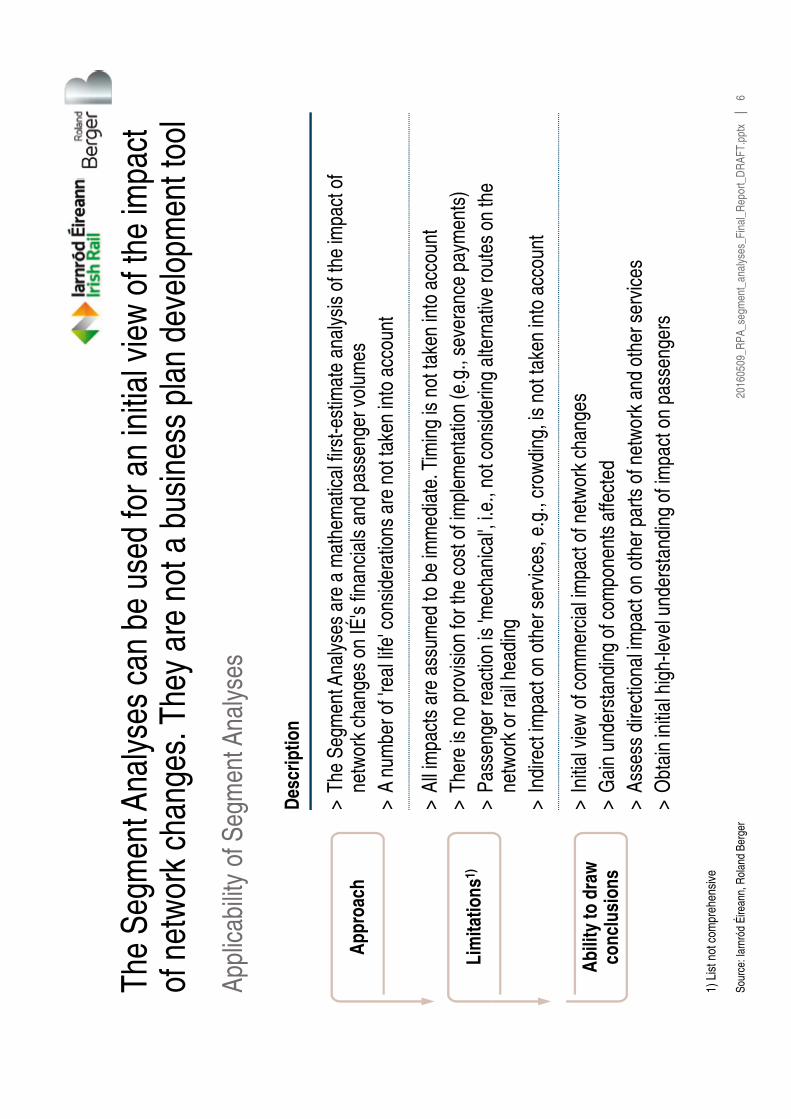
620
1605
09_R
PA_s
egm
ent_
anal
yses
_Fin
al_R
epor
t_D
RAF
T.pp
tx
The
Segm
ent A
naly
ses
can
be u
sed
for a
n in
itial
vie
w o
f the
impa
ct
of n
etw
ork
chan
ges.
The
y ar
e no
t a b
usin
ess
plan
dev
elop
men
t too
l
Des
crip
tion
Appl
icab
ility
of S
egm
ent A
naly
ses
Sour
ce: I
arnr
ód É
irean
n, R
olan
d Be
rger
1) L
ist n
ot c
ompr
ehen
sive
App
roac
h
Lim
itatio
ns1)
Abi
lity
to d
raw
co
nclu
sion
s
>Th
e Se
gmen
t Ana
lyse
s ar
e a
mat
hem
atic
al fi
rst-e
stim
ate
anal
ysis
of t
he im
pact
of
netw
ork
chan
ges
on IÉ
's fin
anci
als
and
pass
enge
r vol
umes
>A
num
ber o
f 're
al li
fe' c
onsi
dera
tions
are
not
take
n in
to a
ccou
nt
>Al
l im
pact
s ar
e as
sum
ed to
be
imm
edia
te. T
imin
g is
not
take
n in
to a
ccou
nt>
Ther
e is
no
prov
isio
n fo
r the
cos
t of i
mpl
emen
tatio
n (e
.g.,
seve
ranc
e pa
ymen
ts)
>Pa
ssen
ger r
eact
ion
is 'm
echa
nica
l', i.e
., no
t con
side
ring
alte
rnat
ive
rout
es o
n th
e ne
twor
k or
rail
head
ing
>In
dire
ct im
pact
on
othe
r ser
vice
s, e
.g.,
crow
ding
, is
not t
aken
into
acc
ount
>In
itial
vie
w o
f com
mer
cial
impa
ct o
f net
wor
k ch
ange
s>
Gai
n un
ders
tand
ing
of c
ompo
nent
s af
fect
ed>
Asse
ss d
irect
iona
l impa
ct o
n ot
her p
arts
of n
etw
ork
and
othe
r ser
vice
s>
Obt
ain
initi
al h
igh-
leve
l und
erst
andi
ng o
f im
pact
on
pass
enge
rs

720
1605
09_R
PA_s
egm
ent_
anal
yses
_Fin
al_R
epor
t_D
RAF
T.pp
tx
B.Se
gmen
t def
initi
on

820
1605
09_R
PA_s
egm
ent_
anal
yses
_Fin
al_R
epor
t_D
RAF
T.pp
txSo
urce
: Iar
nród
Éire
ann,
Rol
and
Berg
er
Segm
ent a
naly
ses
have
bee
n de
fined
alo
ng fo
ur ro
utes
Dub
lin C
onno
lly
Wat
erfo
rd
Dub
linH
eust
on
Cor
k
Tral
ee
Gal
way
Wes
tpor
t
Bal
lina
Slig
o
Bel
fast
Ath
lone
Ros
slar
e Eu
ropo
rt
Man
ulla
Jun
ctio
nPa
ssen
ger t
rans
fers
onl
y
Lim
eric
k Ju
nctio
nLim
eric
k
Kild
are
Porta
rling
ton
Bally
brop
hyEn
nis
Athe
nry
Mal
low
Glo
unth
aune
Mid
leto
n
Cob
h
Long
ford
May
noot
hC
lons
illa
Dun
boyn
e/M
3
Dro
ghed
a
Gre
ysto
nes
Wic
klow
Mul
linga
r
Car
low
Kilk
enny
Killa
rney
Gor
ey
Mal
ahid
eO
ranm
ore
Arkl
owHow
th s
pur
i
iii
Rou
tes
with
seg
men
t ana
lysi
s
i ii iii iv
Affe
cted
by
disc
ontin
ued
serv
ices
in s
egm
ent a
naly
ses
iv
Lim
eric
k –
Gal
way
Lim
eric
k –
Bally
brop
hy(v
ia N
enag
h)
Dub
lin –
Ros
slar
e
Lim
eric
k Ju
nctio
n –
Wat
erfo
rd
ii

920
1605
09_R
PA_s
egm
ent_
anal
yses
_Fin
al_R
epor
t_D
RAF
T.pp
tx
The
segm
ent a
naly
sis
is o
nly
the
first
ste
p in
the
deve
lopm
ent o
f a
busi
ness
cas
e; fu
rther
con
side
ratio
ns n
eed
to b
e as
sess
ed
Addi
tiona
l con
side
ratio
ns to
dev
elop
bus
ines
s ca
se fr
om s
egm
ent a
naly
sis
Sour
ce: I
arnr
ód É
irean
n, R
olan
d Be
rger
Rev
enue
s>
To w
hat e
xten
t can
reve
nues
be
reca
ptur
ed, t
hrou
gh ra
il-he
adin
g an
d im
prov
ed b
us s
ervi
ces
to s
tatio
ns s
till
serv
ed?
>To
wha
t ext
ent w
ould
jour
neys
be
lost
due
to re
duce
d fre
quen
cy a
nd/o
r inc
reas
ed jo
urne
y tim
e or
inte
rcha
nge
requ
irem
ents
?
Trai
n-ba
sed
cost
s>
How
qui
ckly
cou
ld c
osts
be
redu
ced
in li
ne w
ith re
duce
d se
rvic
es, a
nd a
t wha
t cos
t?>
Effic
ienc
ies
of ro
ster
ing
and
diag
ram
min
g
>N
o sh
ared
trai
n-ba
sed
cost
s
Geo
grap
hy-
base
d co
sts
>H
ow q
uick
ly c
ould
cos
ts b
e re
duce
d in
line
with
redu
ced
serv
ices
, and
at w
hat c
ost?
>Va
lidat
ion
of e
stim
ated
hig
h-le
vel c
are
and
mai
nten
ance
co
st re
quire
men
ts
>W
ith w
hat e
xten
t wou
ld re
duce
d/ex
pand
ed s
ervi
ces
allo
w re
duct
ions
/requ
ire in
crea
ses
in s
tatio
n or
IM c
osts
>N
o ce
ntra
l uni
que
cost
s>
With
a re
duce
d/ex
pand
ed s
ervi
ce, w
hat c
hang
es
coul
d/w
ould
nee
d to
be
mad
e to
the
cent
ral f
unct
ions
Cen
tral
cos
ts
Uni
que
to a
rout
eSh
ared
bet
wee
n ro
utes

1020
1605
09_R
PA_s
egm
ent_
anal
yses
_Fin
al_R
epor
t_D
RAF
T.pp
txSo
urce
: Iar
nród
Éire
ann,
Rol
and
Berg
er
Exam
ple
of a
ppro
ach:
impa
ct o
f hyp
othe
tical
seg
men
t ana
lysi
s H
eust
on-K
ildar
e (n
ot in
clud
ed in
this
yea
r's e
xerc
ise)
Dub
lin C
onno
lly
Wat
erfo
rd
Dub
linH
eust
on
Cor
k
Tral
ee
Gal
way
Wes
tpor
t
Bal
lina
Slig
o
Bel
fast
Ath
lone
Ros
slar
e Eu
ropo
rt
Man
ulla
Jun
ctio
nPa
ssen
ger t
rans
fers
onl
y
Lim
eric
k Ju
nctio
nLim
eric
k
Kild
are
Porta
rling
ton
Bally
brop
hyEn
nis
Athe
nry
Mal
low
Glo
unth
aune
Mid
leto
n
Cob
h
Long
ford
May
noot
hC
lons
illa
Dun
boyn
e/M
3
Dro
ghed
a
Gre
ysto
nes
Wic
klow
Mul
linga
r
Car
low
Kilk
enny
Killa
rney
Gor
ey
Mal
ahid
eO
ranm
ore
Cra
ughw
ell
Exam
ple:
Wat
erfo
rd-K
ildar
e se
gmen
t>
Prev
ious
ly u
niqu
e re
venu
e fro
m O
D-p
airs
th
at c
onta
in a
sta
tion
betw
een
Kild
are
and
Wat
erfo
rd (o
ther
than
Kild
are
and
Wat
erfo
rd) a
re e
xclu
ded
>R
even
ue p
revi
ousl
y al
loca
ted
to th
e H
eust
on-W
ater
ford
rout
e fro
m O
D-p
airs
th
at c
onta
in W
ater
ford
are
real
loca
ted
to
Lim
eric
k-Li
mer
ick
Junc
tion
and
inte
rcha
nge
rout
es fr
om L
imer
ick
Junc
tion
>C
osts
bet
wee
n Ki
ldar
e an
d W
ater
ford
(o
ther
than
Kild
are
and
Wat
erfo
rd
stat
ions
) are
exc
lude
d, e
xcep
t for
car
e an
d m
aint
enan
ce`
Thes
e id
entif
ied
chan
ges
can
then
pro
vide
th
e in
puts
to a
bus
ines
s ca
se a
naly
sis
Arkl
owHow
th s
pur
Take
nin
to C
are
& M
aint
enan
ce

1120
1605
09_R
PA_s
egm
ent_
anal
yses
_Fin
al_R
epor
t_D
RAF
T.pp
tx
C.
Segm
ent a
naly
sis
resu
lts

1220
1605
09_R
PA_s
egm
ent_
anal
yses
_Fin
al_R
epor
t_D
RAF
T.pp
txSo
urce
: Iar
nród
Éire
ann,
Rol
and
Berg
er
The
segm
ent a
naly
ses
have
net
fina
ncia
l im
pact
s ra
ngin
g fro
m c
. EU
R 3
-5m
and
pax
jour
ney
impa
cts
rang
ing
from
c. 2
0-18
0k
Rev
enue
lost
Trai
n-ba
sed
expe
nditu
re
savi
ng
Geo
grap
hy-b
ased
ex
pend
iture
sav
ing
Tota
l exp
endi
ture
sav
ing
Pax
jour
neys
lost
1)
Savi
ng p
er p
axjo
urne
y
Impa
ct o
f seg
men
t ana
lyse
s
Cas
h re
sult
impr
ovem
ent
(159
)
751
4,55
9
5,31
0
22,8
56
225.
4
Lim
eric
k-B
ally
brop
hy
5,15
1
(253
)
638
4,73
8
5,37
6
35,0
18
146.
3
Lim
eric
k Jc
t. -W
ater
ford
5,12
3
(1,6
21)
1,61
7
4,48
0
6,09
7
177,
326
25.2
Gor
ey-
Ros
slar
e
4,47
6
(128
)
1,28
4
2,07
5
3,35
9
19,7
69
163.
5
Enni
s-A
then
ry 3,23
1
[EU
R '0
00]
Uni
t
[EU
R '0
00]
[EU
R '0
00]
[EU
R '0
00]
[EU
R '0
00]
[#]
[EU
R/jr
ny]
iii
iiiiv
1) F
or L
imer
ick
–Ba
llybr
ophy
and
Lim
eric
k Ju
nctio
n –
Wat
erfo
rd, t
he p
axjo
urne
ys lo
st e
xcee
d th
e pa
xjo
urne
ys a
lloca
ted
to th
e ro
ute,
this
is d
ue to
pax
jour
neys
trav
elin
g O
D-p
airs
with
O
or D
on
thos
e ro
utes
but
D o
r O o
n an
othe
r rou
te –
thes
e pa
xjo
urne
ys a
re p
artia
lly a
lloca
ted
to o
ther
rout
es b
ut w
ill be
lost
as
soon
as
the
O o
r D s
tatio
n w
ill be
clo
sed

1320
1605
09_R
PA_s
egm
ent_
anal
yses
_Fin
al_R
epor
t_D
RAF
T.pp
tx
The
finan
cial
ben
efits
from
the
Lim
eric
k –
Bally
brop
hyse
gmen
t an
alys
is a
re m
ainl
y dr
iven
by
CC
E an
d IM
O s
avin
gs
Fina
ncia
l im
pact
of L
imer
ick
–Ba
llybr
ophy
seg
men
t ana
lysi
s [E
UR
'000
]
5,15
1
1,29
0
1,14
0
1,76
911
2
24
0
CM
E1)26
6
Trai
n op
erat
ion
IMO
1,16
5
Stat
ions
484
Rev
enue
-159
31
Fast
rack
Cas
h re
sult
B&F2)
1
SET2)
191
CC
E2)3,
171
Tota
lFu
elO
verh
ead
Mat
eria
lsLa
bour
Non
-pax
Pax
Sour
ce: I
arnr
ód É
irean
n, R
olan
d Be
rger
3,08
01,
891
Expe
nditu
re d
elta
sum
mar
y5,
310
194145
Lim
eric
k –
Bal
lybr
ophy
Del
ta c
ompa
red
to b
ase
case
Driv
ers
of d
elta
Geo
grap
hy-
base
d
Trai
n-ba
sed
58%
1) C
ME
= C
hief
Mec
hani
cal E
ngin
eer;
IMO
= In
frast
ruct
ure
Man
agem
ent O
pera
tions
; CC
E=
Chi
ef C
ivil
Engi
neer
; SET
= S
igna
lling,
Ele
ctrif
icat
ion,
Tel
ecom
s; B
&F=
Build
ings
& F
acilit
ies;
2)
Incl
udes
mai
nten
ance
and
rene
wal
exp
endi
ture
s
>Pa
x: O
D-p
airs
con
tain
ing
Cas
tleco
nnel
l, Bi
rdhi
ll, N
enag
h, C
loug
hjor
dan,
R
oscr
ea; n
on-p
ax: c
ar p
ark,
pro
perty
& re
tail
>D
river
s, D
TEs,
Tra
in c
rew
, tra
in h
osts
on
rout
e
>Fu
el/D
ART
tract
ion,
mai
nten
ance
for f
leet
use
d on
rout
e
>Fa
stra
ck tr
ansp
ort o
n ro
ute
>St
atio
n m
anag
ers,
sta
tion
staf
f, C
AN &
pro
perty
>Si
gnal
per
sons
, gat
ekee
pers
, cen
tral t
raffi
c co
ntro
l, le
vel c
ross
ing
cont
rol c
entre
on
trac
k se
gmen
t Lim
eric
k -B
ally
brop
hy>
Perm
anen
t way
insp
ecto
rs, b
alla
st d
river
s on
trac
k se
gmen
t Lim
eric
k -
Bally
brop
hy>
Sign
allin
g, e
lect
rific
atio
n, te
leco
ms
wor
kers
on
track
seg
men
t Lim
eric
k -
Bally
brop
hy>
Build
ings
& fa
cilit
ies
wor
kers
on
track
seg
men
t Lim
eric
k -B
ally
brop
hy
i

1420
1605
09_R
PA_s
egm
ent_
anal
yses
_Fin
al_R
epor
t_D
RAF
T.pp
tx
The
impa
ct o
n re
venu
e by
rout
e of
the
Lim
eric
k –
Bally
brop
hyse
gmen
t ana
lysi
s is
lim
ited
Net
reve
nue
chan
ge w
ith s
egm
ent a
naly
sis
LRS-
2 (L
imer
ick-
Bally
brop
hy)[
EUR
m]
Sour
ce: I
arnr
ód É
irean
n, R
olan
d Be
rger
3.8
Belfa
st10.2
10.2
Slig
o
8.1
Tral
ee10.6
10.6
Gal
way15
.715
.7
Cor
k26.3
26.4
9.7
9.7
Wat
erfo
rd10.5
10.5
Ros
slar
e3.8
Wes
tpor
t/Bal
lina
9.4
9.4
Lim
eric
k8.0
Heu
ston
rout
esC
onno
lly ro
utes
Segm
ent a
naly
ses
Base
cas
e
Lim
eric
k-G
alw
ay
1.1
1.1
Cor
k re
gion
al
3.8
3.8
Wes
tern
Sub
urba
n
11.0
11.0
Nor
ther
n Su
burb
an
16.8
0.0
0.1
Lim
eric
k Ju
nctio
n-W
ater
ford
0.1
0.1
16.8
Kild
are
Subu
rban
9.0
9.0
Lim
eric
k-Ba
llybr
ophy
Reg
iona
l rou
tes
Subu
rban
rout
es
Lim
eric
k –
Bal
lybr
ophy
i

1520
1605
09_R
PA_s
egm
ent_
anal
yses
_Fin
al_R
epor
t_D
RAF
T.pp
tx
Ros
slar
eBe
lfast
-0.1
Wes
tpor
t/Bal
lina
-0.4
Lim
eric
k
-26.
3
Tral
ee
-14.
3
Gal
way
-0.6
Cor
k
-27.
2-0
.4
Wat
erfo
rdSl
igo
-0.4
-0.2
The
Lim
eric
k –
Bally
brop
hyse
gmen
t ana
lysi
s al
so h
as a
min
or
nega
tive
reve
nue
impa
ct o
n th
e C
ork,
Tra
lee
and
Lim
eric
k ro
utes
Heu
ston
rout
esC
onno
lly ro
utes
Net
impa
ct o
f Lim
eric
k-Ba
llybr
ophy
segm
ent a
naly
sis
on ro
ute
reve
nues
[EU
R'0
00]
-0.2
Kild
are
Subu
rban
-0.2
-0.3
Lim
eric
k-Ba
llybr
ophy
-74.
6
Lim
eric
k Ju
nctio
n-W
ater
ford0.
00.
0
Lim
eric
k-G
alw
ayC
ork
regi
onal
-0.2
Nor
ther
n Su
burb
anW
este
rn S
ubur
ban
Sour
ce: I
arnr
ód É
irean
n, R
olan
d Be
rger
Reg
iona
l rou
tes
Subu
rban
rout
es
Lim
eric
k –
Bal
lybr
ophy
i

1620
1605
09_R
PA_s
egm
ent_
anal
yses
_Fin
al_R
epor
t_D
RAF
T.pp
tx
The
pote
ntia
l exp
endi
ture
ben
efits
from
the
Lim
eric
k –
Bally
brop
hyse
gmen
t ana
lysi
s ar
e m
ainl
y dr
iven
by
CC
Ean
d IM
O
Lim
eric
k –
Bally
brop
hyco
st b
enef
it (s
aved
vs.
reta
ined
) [EU
R '0
00]
Sour
ce: I
arnr
ód É
irean
n, R
olan
d Be
rger
Lim
eric
k –
Bal
lybr
ophy
i
1) D
TE=
Dis
trict
Tra
ctio
n Ex
ecut
ive;
CM
E =
Chi
ef M
echa
nica
l Eng
inee
r; C
AN =
Com
mut
er A
dver
tisin
g N
etw
ork;
IMO
= In
frast
ruct
ure
Man
agem
ent O
pera
tions
; CC
E=
Chi
ef C
ivil
Engi
neer
; PW
I= P
erm
anen
t Way
Insp
ecto
r; IM
= In
frast
ruct
ure
Man
ager
; SET
= S
igna
lling,
Ele
ctrif
icat
ion,
Tel
ecom
s; B
&F=
Build
ings
& F
acilit
ies
Line
item
Rout
e un
ique
&
shar
ed c
osts
Bene
fit fr
om
Segm
ent A
naly
sis
Cost
from
rout
e re
mai
ning
Cos
ts6,
009
5,31
069
9Tr
ain-
base
d co
sts75
275
12
Trai
n op
erat
ion
486
484
2D
TEs
00
0D
river
s31
431
22
Dist
rict I
M b
alla
st dr
iver
s ar
e re
allo
cate
d to
oth
er ro
utes
Trai
n cr
ew17
217
20
Trai
n ho
sts0
00
Adm
inist
rativ
e0
00
CM
E26
626
60
Fuel
/ D
ART
Trac
tion
141
141
0D
river
s1
10
Mai
nten
ance
labo
ur42
420
Mai
nten
ance
mat
eria
ls48
480
Mai
nten
ance
ove
rhea
d35
350
Fastr
ack
00
0G
eogr
aphy
-bas
ed5,
256
4,55
969
7St
atio
ns37
531
344
Stat
ion
man
ager
s0
00
Stat
ion
oper
atio
n36
124
336
Shar
ed s
tatio
n op
erat
ion
costs
Lim
erick
Jun
ction
and
Wat
erfo
rd re
allo
cate
d to
oth
er ro
utes
CAN
& P
rope
rty14
77
Shar
ed C
AN &
Pro
perty
cos
ts Li
mer
ick J
uncti
on a
nd W
ater
ford
real
loca
ted
to o
ther
rout
esIM
O1,
338
1,16
517
3Si
gnal
per
sons
219
213
6Sh
ared
sig
nal p
erso
ns K
ilona
n Ju
nctio
n - L
imer
ick re
allo
cate
d to
oth
er ro
utes
Gat
ekee
pers
923
857
65Sh
ared
gat
ekee
pers
Kilo
nan
Junc
tion
- Lim
erick
real
loca
ted
to o
ther
rout
esC
entra
l traf
fic c
ontro
l10
20
102
Shar
ed c
entra
l traf
fic c
ontro
l Kilo
nan
Junc
tion
- Lim
erick
real
loca
ted
to o
ther
rout
esLe
vel c
ross
ing
cont
rol c
entre
9595
0Ad
min
istra
tive
00
0C
CE
3,26
83,
171
97PW
I mai
nten
ance
3,26
83,
171
97C
are
& m
aint
enan
ce c
osts
for t
rack
seg
men
t Bal
lybr
ophy
- Ki
lona
n Ju
nctio
n (v
ia N
enag
h)IM
Bal
last
driv
ers
00
0Ad
min
istra
tive
00
0SE
T22
219
130
Sign
allin
g m
aint
enan
ce12
910
325
Shar
ed s
igna
lling
mai
nten
ance
cos
ts Ki
lona
n Ju
nctio
n - L
imer
ick re
allo
cate
d to
oth
er ro
utes
Elec
trific
atio
n m
aint
enan
ce0
00
Tele
com
s m
aint
enan
ce93
885
Shar
ed te
leco
ms
mai
nten
ance
cos
ts Ki
lona
n Ju
nctio
n - L
imer
ick re
allo
cate
d to
oth
er ro
utes
Adm
inist
rativ
e0
00
B&F
531
52M
aint
enan
ce53
152
Shar
ed b
uild
ing
& fa
cilitie
s m
aint
enan
ce c
osts
Lim
erick
and
Bal
lybr
ophy
real
loca
ted
to o
ther
rout
esAd
min
istra
tive
00
0
Ratio
nale
for c
osts
not
sav
ed

1720
1605
09_R
PA_s
egm
ent_
anal
yses
_Fin
al_R
epor
t_D
RAF
T.pp
tx
The
finan
cial
ben
efit
from
the
Lim
eric
k Ju
nctio
n –
Wat
erfo
rd
segm
ent a
naly
sis
is m
ainl
y dr
iven
by
CC
E an
d IM
O s
avin
gs
Fina
ncia
l im
pact
of L
imer
ick
Junc
tion
–W
ater
ford
seg
men
t ana
lysi
s [E
UR
'000
]
5,12
3
1,06
5
1,63
9
1,58
1
57
CC
E2)2,
788
IMO
1,70
0
Stat
ions
29
Fast
rack
0
CM
E1)25
5
Trai
n op
erat
ion
383
Rev
enue
-253
Cas
h re
sult
SET2)
220
B&F2)
1
Tota
lFu
elM
ater
ials
Labo
urO
verh
ead
Non
-pax
Pax
Sour
ce: I
arnr
ód É
irean
n, R
olan
d Be
rger
3,26
01,
684
5,37
6Ex
pend
iture
del
ta
su
mm
ary
25817
5
Lim
eric
k Ju
nctio
n –
Wat
erfo
rd
Del
ta c
ompa
red
to b
ase
case
Driv
ers
of d
elta
Geo
grap
hy-
base
d
Trai
n-ba
sed
61%
>Pa
x: O
D-p
airs
con
tain
ing
Car
rick
on S
uir,
Clo
nmel
, Cah
ir, T
ippe
rary
; non
-pax
: ca
r par
k, p
rope
rty &
reta
il
>D
river
s, D
TEs,
Tra
in c
rew
, tra
in h
osts
on
rout
e
>Fu
el/D
ART
tract
ion,
mai
nten
ance
on
rout
e
>Fa
stra
ck tr
ansp
ort o
n ro
ute
>St
atio
n m
anag
ers,
sta
tion
staf
f, C
AN &
pro
perty
>Si
gnal
per
sons
, gat
ekee
pers
, cen
tral t
raffi
c co
ntro
l, le
vel c
ross
ing
cont
rol c
entre
on
trac
k se
gmen
t Lim
. Jct
. –W
ater
ford
>Pe
rman
ent w
ay in
spec
tors
, bal
last
driv
ers
on tr
ack
segm
ent L
im. J
ct. –
Wat
erfo
rd>
Sign
allin
g, e
lect
rific
atio
n, te
leco
ms
wor
kers
on
track
seg
men
t Lim
. Jct
. –W
ater
ford
>Bu
ildin
gs &
faci
litie
s w
orke
rson
trac
k se
gmen
t Lim
. Jct
. –W
ater
ford
ii
1) C
ME
= C
hief
Mec
hani
cal E
ngin
eer;
IMO
= In
frast
ruct
ure
Man
agem
ent O
pera
tions
; CC
E=
Chi
ef C
ivil
Engi
neer
; SET
= S
igna
lling,
Ele
ctrif
icat
ion,
Tel
ecom
s; B
&F=
Build
ings
& F
acilit
ies;
2)
Incl
udes
mai
nten
ance
and
rene
wal
exp
endi
ture
s

1820
1605
09_R
PA_s
egm
ent_
anal
yses
_Fin
al_R
epor
t_D
RAF
T.pp
tx
8.1
8.0
3.8 Ros
slar
e3.8
Slig
o
10.2
10.2
Wat
erfo
rd
9.7
10.5
10.5
9.7
Belfa
stW
estp
ort/B
allin
a
9.4
Lim
eric
k
9.4
Tral
ee10.6
10.6
Gal
way15
.715
.7
Cor
k26.3
26.4
The
impa
ct o
n re
venu
e by
rout
e of
the
Lim
eric
k Ju
nctio
n –
Wat
erfo
rd s
egm
ent a
naly
sis
is li
mite
d
Heu
ston
rout
esC
onno
lly ro
utes
Net
reve
nue
chan
ge w
ith s
egm
ent a
naly
sis
LJW
-1 (L
im. J
unct
ion-
Wat
erfo
rd)[
EUR
m]
Base
cas
eSe
gmen
t ana
lyse
s
Cor
k re
gion
al
3.8
1.1
3.8
Wes
tern
Sub
urba
n
11.0
11.0
Nor
ther
n Su
burb
an
16.8
16.8
Kild
are
Subu
rban
9.0
9.0
Lim
eric
k-Ba
llybr
ophy
0.1
0.1
Lim
eric
k Ju
nctio
n-W
ater
ford
0.0
0.1
Lim
eric
k-G
alw
ay
1.1
Sour
ce: I
arnr
ód É
irean
n, R
olan
d Be
rger
Reg
iona
l rou
tes
Subu
rban
rout
es
Lim
eric
k Ju
nctio
n –
Wat
erfo
rdii
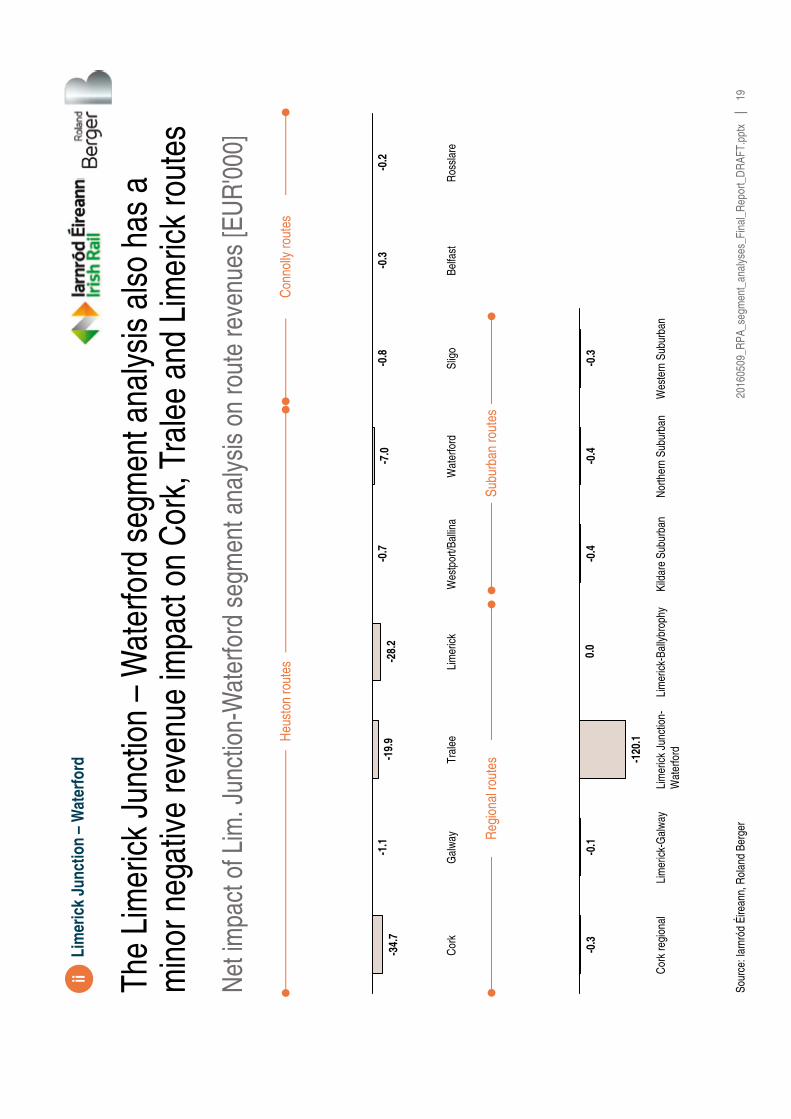
1920
1605
09_R
PA_s
egm
ent_
anal
yses
_Fin
al_R
epor
t_D
RAF
T.pp
tx
Ros
slar
e
-0.2
Belfa
st
-0.3
Slig
o
-0.8
Wat
erfo
rd
-7.0
Wes
tpor
t/Bal
lina
-0.7
Lim
eric
k
-28.
2
Tral
ee
-19.
9
Gal
way
-1.1
Cor
k
-34.
7
The
Lim
eric
k Ju
nctio
n –
Wat
erfo
rd s
egm
ent a
naly
sis
also
has
a
min
or n
egat
ive
reve
nue
impa
ct o
n C
ork,
Tra
lee
and
Lim
eric
k ro
utes
Heu
ston
rout
esC
onno
lly ro
utes
Net
impa
ct o
f Lim
. Jun
ctio
n-W
ater
ford
seg
men
t ana
lysi
s on
rout
e re
venu
es[E
UR
'000
]
-120
.1
Lim
eric
k Ju
nctio
n-W
ater
ford
Wes
tern
Sub
urba
n
-0.3
Nor
ther
n Su
burb
anLi
mer
ick-
Gal
way
-0.1
Cor
k re
gion
al
-0.3
Kild
are
Subu
rban
-0.4
-0.4
Lim
eric
k-Ba
llybr
ophy
0.0
Sour
ce: I
arnr
ód É
irean
n, R
olan
d Be
rger
Reg
iona
l rou
tes
Lim
eric
k Ju
nctio
n –
Wat
erfo
rdii
Subu
rban
rout
es

2020
1605
09_R
PA_s
egm
ent_
anal
yses
_Fin
al_R
epor
t_D
RAF
T.pp
tx
The
pote
ntia
l exp
endi
ture
ben
efit
from
the
Lim
eric
k Ju
nctio
n –
Wat
erfo
rd s
egm
ent a
naly
sis
is d
riven
by
CC
Ean
d IM
O s
avin
gs
Lim
eric
k Ju
nctio
n –
Wat
erfo
rd e
xpen
ditu
re b
enef
it (s
aved
vs.
reta
ined
) [EU
R '0
00]
Sour
ce: I
arnr
ód É
irean
n, R
olan
d Be
rger
Lim
eric
k Ju
nctio
n –
Wat
erfo
rdii
1) D
TE=
Dis
trict
Tra
ctio
n Ex
ecut
ive;
CM
E =
Chi
ef M
echa
nica
l Eng
inee
r; C
AN =
Com
mut
er A
dver
tisin
g N
etw
ork;
IMO
= In
frast
ruct
ure
Man
agem
ent O
pera
tions
; CC
E=
Chi
ef C
ivil
Engi
neer
; PW
I= P
erm
anen
t Way
Insp
ecto
r; IM
= In
frast
ruct
ure
Man
ager
; SET
= S
igna
lling,
Ele
ctrif
icat
ion,
Tel
ecom
s; B
&F=
Build
ings
& F
acilit
ies
Line
item
Rout
e un
ique
&
shar
ed c
osts
Bene
fit fr
om
Segm
ent A
naly
sis
Cost
from
rout
e re
mai
ning
Cos
ts6,
007
5,37
663
0Tr
ain-
base
d co
sts63
863
80
Trai
n op
erat
ion
384
383
0D
TEs
00
0D
river
s24
324
30
Trai
n cr
ew14
114
10
Trai
n ho
sts0
00
Adm
inist
rativ
e0
00
CM
E25
525
50
Fuel
/ D
ART
Trac
tion
170
170
0D
river
s0
00
Mai
nten
ance
labo
ur32
320
Mai
nten
ance
mat
eria
ls10
100
Mai
nten
ance
ove
rhea
d43
430
Fastr
ack
00
0G
eogr
aphy
-bas
ed5,
368
4,73
863
0St
atio
ns35
929
330
Stat
ion
man
ager
s0
00
Stat
ion
oper
atio
n33
914
325
Shar
ed s
tatio
n op
erat
ion
costs
Lim
erick
Jun
ction
and
Wat
erfo
rd re
allo
cate
d to
oth
er ro
utes
CAN
& P
rope
rty20
155
CAN
& P
rope
rty c
osts
Lim
erick
Jun
ction
and
Wat
erfo
rd re
allo
cate
d to
oth
er ro
utes
IMO
1,83
51,
700
135
Sign
al p
erso
ns56
956
90
Gat
ekee
pers
875
875
0C
entra
l traf
fic c
ontro
l11
42
112
Shar
ed C
TC d
istric
t cos
ts re
allo
cate
d to
oth
er ro
utes
Leve
l cro
ssin
g co
ntro
l cen
tre25
325
30
Adm
inist
rativ
e24
023
Shar
ed IM
O a
dmin
istra
tive
distr
ict c
osts
real
loca
ted
to o
ther
rout
esC
CE
2,90
72,
788
119
PWI m
aint
enan
ce2,
907
2,78
811
9C
are
& m
aint
enan
ce c
osts
for t
rack
seg
men
t Lim
erick
Jun
ction
- W
ater
ford
IM B
alla
st dr
iver
s0
00
Adm
inist
rativ
e0
00
SET
220
220
0Si
gnal
ling
mai
nten
ance
111
111
0El
ectri
ficat
ion
mai
nten
ance
00
0Te
leco
ms
mai
nten
ance
109
109
0Ad
min
istra
tive
00
0B&
F47
145
Mai
nten
ance
471
45Sh
ared
bui
ldin
gs &
facil
ities
mai
ntea
nce
costs
Lim
erick
Jun
ction
and
Wat
erfo
rd re
allo
cate
d to
oth
er ro
utes
Adm
inist
rativ
e0
00
Ratio
nale
for c
osts
not
sav
ed

2120
1605
09_R
PA_s
egm
ent_
anal
yses
_Fin
al_R
epor
t_D
RAF
T.pp
tx
The
finan
cial
ben
efit
from
the
Gor
ey –
Ros
slar
ese
gmen
t ana
lysi
s is
pr
edom
inan
tly d
riven
by
CC
E, s
tatio
ns, C
ME
and
SET
savi
ngs
Fina
ncia
l im
pact
of G
orey
–R
ossl
are
segm
ent a
naly
sis
[EU
R '0
00]
4,47
6
944
Cas
h re
sult
B&F2)
2
SET2)
764
CC
E2)2,
219
71
IMO
325
30320
Stat
ions
1,17
1
Fast
rack
0
CM
E1)1,
048
Trai
n op
erat
ion
569
Rev
enue
-1,6
21
1,20
3
Tota
lFu
elO
verh
ead
Mat
eria
lsLa
bour
Non
-pax
Pax
Sour
ce: I
arnr
ód É
irean
n, R
olan
d Be
rger
3,44
51,
685
Expe
nditu
re d
elta
sum
mar
y6,
097
44452
4
Gor
ey –
Ros
slar
e
Del
ta c
ompa
red
to b
ase
case
Driv
ers
of d
elta
Geo
grap
hy-
base
d
Trai
n-ba
sed
56%
>Pa
x: O
D-p
airs
con
tain
ing
Enni
scor
thy,
Wex
ford
, Ros
slar
eSt
rand
, Ros
slar
eEu
ropo
rt; n
on-p
ax: c
ar p
ark,
pro
perty
& re
tail
>D
river
s, D
TEs,
Tra
in c
rew
, tra
in h
osts
on
Gor
ey –
Ros
slar
e
>Fu
el/D
ART
tract
ion,
mai
nten
ance
on G
orey
–R
ossl
are
>Fa
stra
ck tr
ansp
orto
n G
orey
–R
ossl
are
>St
atio
n m
anag
ers,
sta
tion
staf
f, C
AN &
pro
perty
3)
>Si
gnal
per
sons
, gat
ekee
pers
, cen
tral t
raffi
c co
ntro
l, le
vel c
ross
ing
cont
rol c
entre
on
trac
k se
gmen
t Gor
ey –
Ros
slar
e
>Pe
rman
ent w
ay in
spec
tors
, bal
last
driv
ers
on tr
ack
segm
ent G
orey
–R
ossl
are
>Si
gnal
ling,
ele
ctrif
icat
ion,
tele
com
s w
orke
rson
trac
k se
gmen
t Gor
ey –
Ros
slar
e
>Bu
ildin
gs &
faci
litie
s w
orke
rson
trac
k se
gmen
t Gor
ey –
Ros
slar
e
iii
1) C
ME
= C
hief
Mec
hani
cal E
ngin
eer;
IMO
= In
frast
ruct
ure
Man
agem
ent O
pera
tions
; CC
E=
Chi
ef C
ivil
Engi
neer
; SET
= S
igna
lling,
Ele
ctrif
icat
ion,
Tel
ecom
s; B
&F=
Build
ings
& F
acilit
ies;
2)
Incl
udes
mai
nten
ance
and
rene
wal
exp
endi
ture
s; 3
) Ros
slar
eH
arbo
ur (a
.k.a
. Ros
slar
eEu
ropo
rt–
part
of R
ossl
are
Euro
port
Busi
ness
Uni
t) no
t inc
lude
d in
sta
tion
expe
nditu
res

2220
1605
09_R
PA_s
egm
ent_
anal
yses
_Fin
al_R
epor
t_D
RAF
T.pp
tx
15.7
Cor
k26.4
26.4
Ros
slar
eW
estp
ort/B
allin
a
9.4
9.4
Lim
eric
k8.1
8.1
Tral
ee10.6
10.6
Gal
way15
.7
2.3
3.8
Belfa
st10.2
10.2
Slig
o9.7
9.7
Wat
erfo
rd10.5
10.5
The
impa
ct o
n re
venu
e by
rout
e of
the
Gor
ey –
Ros
slar
ese
gmen
t an
alys
is is
lim
ited
Heu
ston
rout
esC
onno
lly ro
utes
Rev
enue
cha
nge
with
seg
men
t ana
lysi
s C
RE-
1 (G
orey
-Ros
slar
e)[E
UR
m]
Segm
ent a
naly
ses
Base
cas
e
Wes
tern
Sub
urba
n
11.0
11.0
Nor
ther
n Su
burb
anLi
mer
ick-
Bally
brop
hy
0.1
0.1
Lim
eric
k Ju
nctio
n-W
ater
ford
0.1
0.1
Lim
eric
k-G
alw
ay
1.1
1.1
Cor
k re
gion
al
3.8
3.8
16.8
16.8
Kild
are
Subu
rban
9.0
9.0
Sour
ce: I
arnr
ód É
irean
n, R
olan
d Be
rger
Reg
iona
l rou
tes
Subu
rban
rout
es
Gor
ey –
Ros
slar
eiii

2320
1605
09_R
PA_s
egm
ent_
anal
yses
_Fin
al_R
epor
t_D
RAF
T.pp
tx
Ros
slar
e
-1,5
29.5
Belfa
st
-2.3
Slig
o
-5.2
Wat
erfo
rd
-1.9
Wes
tpor
t/Bal
lina
-3.3
Lim
eric
k
-2.7
Tral
ee
-2.2
Gal
way
-6.2
Cor
k
-5.4
The
reve
nue
lost
in th
e G
orey
–R
ossl
are
segm
ent a
naly
sis
is
virtu
ally
all
tied
to th
e R
ossl
are
rout
e
Heu
ston
rout
esC
onno
lly ro
utes
Impa
ct o
f Gor
ey-R
ossl
are
segm
ent a
naly
sis
on ro
ute
reve
nues
1)[E
UR
'000
]
Lim
eric
k-G
alw
ay
-0.4
Cor
k re
gion
al
-3.5
Wes
tern
Sub
urba
n
-7.9
Nor
ther
n Su
burb
an
-3.7
Kild
are
Subu
rban
-2.1
Lim
eric
k-Ba
llybr
ophy
-0.2
Lim
eric
k Ju
nctio
n-W
ater
ford-0
.1
Sour
ce: I
arnr
ód É
irean
n, R
olan
d Be
rger
Reg
iona
l rou
tes
Subu
rban
rout
es
Gor
ey –
Ros
slar
eiii

2420
1605
09_R
PA_s
egm
ent_
anal
yses
_Fin
al_R
epor
t_D
RAF
T.pp
tx
The
pote
ntia
l exp
endi
ture
ben
efit
from
the
Gor
ey –
Ros
slar
ese
gmen
t ana
lysi
s is
mai
nly
driv
en b
y C
CE,
sta
tions
, CM
E an
d SE
T
Gor
ey –
Ros
slar
eco
st b
enef
it (s
aved
vs.
reta
ined
) [EU
R '0
00]
Sour
ce: I
arnr
ód É
irean
n, R
olan
d Be
rger
Gor
ey –
Ros
slar
eiii
1) D
TE=
Dis
trict
Tra
ctio
n Ex
ecut
ive;
CM
E =
Chi
ef M
echa
nica
l Eng
inee
r; C
AN =
Com
mut
er A
dver
tisin
g N
etw
ork;
IMO
= In
frast
ruct
ure
Man
agem
ent O
pera
tions
; CC
E=
Chi
ef C
ivil
Engi
neer
; PW
I= P
erm
anen
t Way
Insp
ecto
r; IM
= In
frast
ruct
ure
Man
ager
; SET
= S
igna
lling,
Ele
ctrif
icat
ion,
Tel
ecom
s; B
&F=
Build
ings
& F
acilit
ies
Line
item
Rout
e un
ique
&
shar
ed c
osts
Bene
fit fr
om
Segm
ent A
naly
sis
Cost
from
rout
e re
mai
ning
Cos
ts14
,369
6,09
78,
271
Trai
n-ba
sed
costs
3,76
11,
617
2,14
4Tr
ain
oper
atio
n1,
190
569
621
DTE
s0
00
Driv
ers
953
456
498
Trun
catio
n of
rout
e fro
m D
ublin
- R
ossla
re to
Dub
lin -
Gor
eyTr
ain
crew
237
113
123
Trun
catio
n of
rout
e fro
m D
ublin
- R
ossla
re to
Dub
lin -
Gor
eyTr
ain
hosts
00
0Ad
min
istra
tive
00
0C
ME
2,57
11,
048
1,52
3Fu
el /
DAR
T Tr
actio
n1,
131
498
633
Trun
catio
n of
rout
e fro
m D
ublin
- R
ossla
re to
Dub
lin -
Gor
eyD
river
s9
35
Trun
catio
n of
rout
e fro
m D
ublin
- R
ossla
re to
Dub
lin -
Gor
eyM
aint
enan
ce la
bour
496
191
305
Trun
catio
n of
rout
e fro
m D
ublin
- R
ossla
re to
Dub
lin -
Gor
eyM
aint
enan
ce m
ater
ials
378
137
241
Trun
catio
n of
rout
e fro
m D
ublin
- R
ossla
re to
Dub
lin -
Gor
eyM
aint
enan
ce o
verh
ead
558
220
339
Trun
catio
n of
rout
e fro
m D
ublin
- R
ossla
re to
Dub
lin -
Gor
eyFa
strac
k0
00
Geo
grap
hy-b
ased
10,6
074,
480
6,12
7St
atio
ns2,
185
1,17
11,
014
Stat
ion
man
ager
s0
00
Stat
ion
oper
atio
n1,
922
1,06
985
3Sh
ared
sta
tion
oper
atio
n co
sts fo
r sta
tion
betw
een
Dub
lin a
nd G
orey
rem
ain
CAN
& P
rope
rty26
410
216
2Sh
ared
CAN
& P
rope
rty c
osts
for s
tatio
n be
twee
n D
ublin
and
Gor
ey re
mai
nIM
O72
332
539
8Si
gnal
per
sons
360
194
166
Shar
ed s
igna
l per
son
costs
for t
rack
seg
men
ts be
twee
n D
ublin
and
Gor
ey re
mai
nG
atek
eepe
rs34
340
Cen
tral tr
affic
con
trol
143
214
1Sh
ared
CTC
cos
ts fo
r tra
ck s
egm
ents
betw
een
Dub
lin a
nd G
orey
rem
ain
Leve
l cro
ssin
g co
ntro
l cen
tre12
893
35Sh
ared
LXC
C c
osts
for t
rack
seg
men
ts be
twee
n D
ublin
and
Gor
ey re
mai
nAd
min
istra
tive
571
56Sh
ared
CTC
cos
ts fo
r tra
ck s
egm
ents
betw
een
Dub
lin a
nd G
orey
rem
ain
CC
E5,
896
2,21
93,
677
PWI m
aint
enan
ce6,
112
2,21
93,
677
C&M
cos
ts fo
r tra
ck s
egm
ent G
orey
- R
ossla
re +
sha
red
PWI m
aint
enan
ce c
osts
for D
ublin
- G
orey
IM B
alla
st dr
iver
s0
00
Adm
inist
rativ
e0
00
SET
1,62
176
485
7Si
gnal
ling
mai
nten
ance
1,03
555
348
2Sh
ared
sig
nallin
g m
aint
enan
ce c
osts
for t
rack
seg
men
ts be
twee
n D
ublin
and
Gor
ey re
mai
nEl
ectri
ficat
ion
mai
nten
ance
00
0Te
leco
ms
mai
nten
ance
586
211
375
Shar
ed te
leco
ms
mai
nten
ance
cos
ts fo
r tra
ck s
egm
ents
betw
een
Dub
lin a
nd G
orey
rem
ain
Adm
inist
rativ
e0
00
B&F
182
218
0M
aint
enan
ce18
22
180
Shar
ed b
uild
ings
& fa
cilitie
s m
aint
enan
ce c
osts
for s
tatio
ns b
etw
een
Dub
lin a
nd G
orey
rem
ain
Adm
inist
rativ
e0
00
Ratio
nale
for c
osts
not
sav
ed

2520
1605
09_R
PA_s
egm
ent_
anal
yses
_Fin
al_R
epor
t_D
RAF
T.pp
tx
The
finan
cial
ben
efit
from
the
Enni
s –
Athe
nry
segm
ent a
naly
sis
is
pred
omin
antly
driv
en b
y C
CE,
trai
n op
erat
ion
and
CM
E sa
ving
s
Fina
ncia
l im
pact
of E
nnis
–At
henr
yse
gmen
t ana
lysi
s [E
UR
'000
]
3,23
1
865
676
792
Rev
enue
-128
Fast
rack
1
Cas
h re
sult
IMO
72
Stat
ions
29
1,68
1C
CE2)
292
SET2)
Trai
n op
erat
ion
492
CM
E1)
0
B&F2)
Fuel
Ove
rhea
dM
ater
ials
Labo
urN
on-p
axPa
xTo
tal
Sour
ce: I
arnr
ód É
irean
n, R
olan
d Be
rger
2,00
289
0Ex
pend
iture
del
ta
su
mm
ary
3,35
924
4223
Enni
s –
Ath
enry
Del
ta c
ompa
red
to b
ase
case
Driv
ers
of d
elta
Geo
grap
hy-
base
d
Trai
n-ba
sed
60%
>Pa
x: O
D-p
airs
con
tain
ing
Gor
t, Ar
drah
an, C
raug
hwel
l; no
n-pa
x: c
ar p
ark,
pr
oper
ty &
reta
il fo
r tho
se s
tatio
ns
>D
river
s, D
TEs,
Tra
in c
rew
, tra
in h
osts
on
Enni
s -G
alw
ay
>Fu
el/D
ART
tract
ion,
mai
nten
ance
on
Enni
s –
Gal
way
>Fa
stra
ck tr
ansp
ort o
n En
nis
–G
alw
ay
>St
atio
n m
anag
ers,
sta
tion
staf
f, C
AN &
pro
perty
>Si
gnal
per
sons
, gat
ekee
pers
, cen
tral t
raffi
c co
ntro
l, le
vel c
ross
ing
cont
rol c
entre
on
trac
k se
gmen
t Enn
is –
Athe
nry
>Pe
rman
ent w
ay in
spec
tors
, bal
last
driv
ers
on tr
ack
segm
ent E
nnis
–At
henr
y
>Si
gnal
ling,
ele
ctrif
icat
ion,
tele
com
s w
orke
rson
trac
k se
gmen
t Enn
is –
Athe
nry
>Bu
ildin
gs &
faci
litie
s w
orke
rson
trac
k se
gmen
t Enn
is –
Athe
nry
iv
1) C
ME
= C
hief
Mec
hani
cal E
ngin
eer;
IMO
= In
frast
ruct
ure
Man
agem
ent O
pera
tions
; CC
E=
Chi
ef C
ivil
Engi
neer
; SET
= S
igna
lling,
Ele
ctrif
icat
ion,
Tel
ecom
s; B
&F=
Build
ings
& F
acilit
ies;
2)
Incl
udes
mai
nten
ance
and
rene
wal
exp
endi
ture
s

2620
1605
09_R
PA_s
egm
ent_
anal
yses
_Fin
al_R
epor
t_D
RAF
T.pp
tx
Ros
slar
e3.8
3.8
Belfa
stLi
mer
ick8.
18.
1
Tral
ee10.6
10.6
Gal
way15
.715
.7
Cor
k26.4
10.2
10.2
Slig
o9.7
9.7
Wat
erfo
rd10.5
10.5
Wes
tpor
t/Bal
lina
9.4
9.4
26.4
The
impa
ct o
n ne
t rev
enue
by
rout
e of
the
Enni
s –
Athe
nry
segm
ent
anal
ysis
is li
mite
d
Heu
ston
rout
esC
onno
lly ro
utes
Net
reve
nue
chan
ge w
ith s
egm
ent a
naly
sis
LRS-
1(En
nis-
Athe
nry)
[EU
R m
]
Segm
ent a
naly
ses
Base
cas
e
0.1
0.1
Kild
are
Subu
rban
9.0
Lim
eric
k Ju
nctio
n-W
ater
ford
0.1
0.1
Lim
eric
k-Ba
llybr
ophy
9.0
Lim
eric
k-G
alw
ayW
este
rn S
ubur
ban
11.0
Nor
ther
n Su
burb
an
11.0
16.8
16.8
1.0
1.1
Cor
k re
gion
al
3.8
3.8
Sour
ce: I
arnr
ód É
irean
n, R
olan
d Be
rger
Reg
iona
l rou
tes
Subu
rban
rout
es
Enni
s –
Ath
enry
iv

2720
1605
09_R
PA_s
egm
ent_
anal
yses
_Fin
al_R
epor
t_D
RAF
T.pp
tx
Ros
slar
e
-0.4
Belfa
st
-0.7
Slig
o
-1.0
Wat
erfo
rd
-1.2
Wes
tpor
t/Bal
lina
-1.0
Lim
eric
k
-0.9
Tral
ee
-1.1
Gal
way
-23.
0
Cor
k
-2.8
The
net i
mpa
ct o
n re
venu
es is
low
due
to a
larg
e sh
are
of th
e 'lo
st'
reve
nue
bein
g re
tain
ed o
n th
e G
alw
ay ro
ute
Heu
ston
rout
esC
onno
lly ro
utes
Net
Impa
ct o
f Enn
is-A
then
ryse
gmen
t ana
lysi
s on
rout
e re
venu
es[E
UR
'000
]
Wes
tern
Sub
urba
n
-0.6
Nor
ther
n Su
burb
an
-1.1
Kild
are
Subu
rban
-1.0
Lim
eric
k-Ba
llybr
ophy
0.0
Lim
eric
k Ju
nctio
n-W
ater
ford0.
0
Lim
eric
k-G
alw
ay
-84.
6
Cor
k re
gion
al
-0.4
Sour
ce: I
arnr
ód É
irean
n, R
olan
d Be
rger
Reg
iona
l rou
tes
Subu
rban
rout
es
Enni
s –
Ath
enry
iv

2820
1605
09_R
PA_s
egm
ent_
anal
yses
_Fin
al_R
epor
t_D
RAF
T.pp
tx
The
pote
ntia
l exp
endi
ture
s be
nefit
from
the
Enni
s –
Athe
nry
segm
ent a
naly
sis
is d
riven
by
CC
E, tr
ain
oper
atio
n an
d C
ME
Enni
s –
Athe
nry
expe
nditu
re b
enef
it (s
aved
vs.
reta
ined
) [EU
R]
Sour
ce: I
arnr
ód É
irean
n, R
olan
d Be
rger
Enni
s –
Ath
enry
iv
1) D
TE=
Dis
trict
Tra
ctio
n Ex
ecut
ive;
CM
E =
Chi
ef M
echa
nica
l Eng
inee
r; C
AN =
Com
mut
er A
dver
tisin
g N
etw
ork;
IMO
= In
frast
ruct
ure
Man
agem
ent O
pera
tions
; CC
E=
Chi
ef C
ivil
Engi
neer
; PW
I= P
erm
anen
t Way
Insp
ecto
r; IM
= In
frast
ruct
ure
Man
ager
; SET
= S
igna
lling,
Ele
ctrif
icat
ion,
Tel
ecom
s; B
&F=
Build
ings
& F
acilit
ies
Line
item
Rout
e uni
que &
sh
ared
costs
Bene
fit fr
om
Segm
ent A
nalys
isCo
st fro
m ro
ute
rem
ainin
g
Costs
7,09
13,
359
3,73
2Tr
ain-b
ased
costs
2,01
41,
284
730
Train
ope
ratio
n1,
244
792
451
DTEs
00
0Dr
ivers
1,23
078
444
7Tr
unca
tion
of ro
ute fr
om L
imer
ick to
Enn
isTr
ain cr
ew13
85
Trun
catio
n of
route
from
Lim
erick
to E
nnis
Train
hos
ts0
00
Admi
nistra
tive
00
0CM
E77
049
227
8Fu
el / D
ART
Trac
tion
334
213
121
Trun
catio
n of
route
from
Lim
erick
to E
nnis
Drive
rs3
21
Trun
catio
n of
route
from
Lim
erick
to E
nnis
Main
tenan
ce la
bour
147
9453
Trun
catio
n of
route
from
Lim
erick
to E
nnis
Main
tenan
ce m
ateria
ls15
610
056
Trun
catio
n of
route
from
Lim
erick
to E
nnis
Main
tenan
ce o
verh
ead
130
8347
Trun
catio
n of
route
from
Lim
erick
to E
nnis
Fastr
ack
00
0Ge
ogra
phy-
base
d5,
077
2,07
53,
002
Stati
ons
1,50
229
1,47
3St
ation
man
ager
s0
00
Stati
on o
pera
tion
1,45
325
1,42
8Sh
ared
stati
on o
pera
tion
costs
for s
tation
betw
een
Limer
ick a
nd E
nnis
rema
inCA
N &
Prop
erty
494
45Sh
ared
CAN
& P
rope
rty co
sts fo
r stat
ion b
etwee
n Lim
erick
and
Enn
is re
main
IMO
463
7239
2Si
gnal
pers
ons
430
43Sh
ared
sign
al pe
rson
costs
for t
rack
segm
ents
betw
een
Limer
ick a
nd E
nnis
rema
inGa
tekee
pers
263
026
3Sh
ared
gate
keep
er co
sts fo
r tra
ck se
gmen
ts be
twee
n Lim
erick
and
Enn
is re
main
Centr
al tra
ffic co
ntrol
710
70Sh
ared
CTC
costs
for t
rack
segm
ents
betw
een
Limer
ick a
nd E
nnis
rema
inLe
vel c
ross
ing co
ntrol
centr
e81
7110
Shar
ed L
XCC
costs
for t
rack
segm
ents
betw
een
Limer
ick a
nd E
nnis
rema
inAd
minis
trativ
e6
06
Shar
ed C
TC co
sts fo
r tra
ck se
gmen
ts be
twee
n Lim
erick
and
Enn
is re
main
CCE
2,40
51,
681
724
PWI m
ainten
ance
2,50
91,
681
724
C&M
costs
for t
rack
segm
ent E
nnis
- Athe
nry
+ sh
ared
PW
I main
tenan
ce co
sts fo
r Lim
erick
-Enn
isIM
Ball
ast d
river
s0
00
Admi
nistra
tive
00
0SE
T46
029
216
7Si
gnall
ing m
ainten
ance
175
110
65Sh
ared
sign
alling
main
tenan
ce co
sts fo
r tra
ck se
gmen
ts be
twee
n Lim
erick
and
Enn
is re
main
Elec
trifica
tion
maint
enan
ce0
00
Telec
oms m
ainten
ance
285
182
103
Shar
ed te
lecom
s main
tenan
ce co
sts fo
r tra
ck se
gmen
ts be
twee
n Lim
erick
and
Enn
is re
main
Admi
nistra
tive
00
0B&
F24
71
245
Main
tenan
ce24
71
245
Shar
ed b
uildin
gs &
facil
ities m
ainten
ance
costs
for s
tation
s betw
een
Limer
ick a
nd E
nnis
rema
inAd
minis
trativ
e0
00
Ratio
nale
for c
osts
not s
aved


Potential Alternative Service Provision
Appendix 8 August 2016

2
Contents1.0BusServiceimplicationsrelatingtosuspensionofrailservicesGorey-Rosslare.........................1
1.1Existingrailserviceprovision..........................................................................................................1
1.2Potentialreplacementbusservices................................................................................................2
2.0BusServiceimplicationsrelatingtosuspensionofrailservicesEnnis-Athenry..........................6
2.1Existingrailserviceprovision..........................................................................................................6
2.2Potentialreplacementbusservices................................................................................................7
3.0BusServiceimplicationsrelatingtosuspensionofrailservicesLimerickJunction-Waterford.12
3.1Existingrailserviceprovision........................................................................................................12
3.2Potentialreplacementbusservices..............................................................................................12
4.0BusServiceimplicationsrelatingtosuspensionofrailservicesLimerick-Ballybrophy.............17
4.1Existingrailserviceprovision.........................................................................................................17
4.2Potentialreplacementbusservices..............................................................................................17

1
1.0Bus Service implications relating to suspensionof rail servicesGorey-Rosslare
The following isahigh level considerationof theneed toprovide replacementbus services in the
event of the suspension of rail services currently operating between Gorey and Rosslare on the
DublintoRosslareLine(SouthernLine)lineasconsideredunderscenarioCRE-1oftheRailReview.
UnderthisscenariooperationswouldremainasfarasGoreybutbesuspendedbeyonditmeaning
serviceswouldno longer operate at Enniscorthy,Wexford, Rosslare Strand andRosslare Europort
stations.
1.1Existingrailserviceprovision
Atpresent servicesoperatingat these stationsareDublin/Rosslareand return,Dublin toWexford
andGoreytoDublinservices.
Inthesouthbounddirectionthecurrenttimetableprovidesfor4servicesperdayeachway,Monday
toFridaybetweenDublinandRosslareand1Dublin-Wexfordservice.OnSaturdayandSundaythere
are 3Dublin-Rosslare services. Services operate between the hours of 09.40 and 18.38 for arrival
intoRosslareEuroportbetween12.26and21.28MondaytoSaturday.
Inthenorthbounddirectionthereare41servicesoperatingbetweenRosslareandDublinMonday-Fri
with 1 additional Gorey-Dublin service. There are 3 services operated fromRosslare toDublin on
Saturday and Sunday.An additional earlymorningGorey toDublin service is also in operationon
Saturday.HoursofoperationfromRosslarearebetween05.35and18.35MondaytoFriproviding
forarrivalintoDublinbetween08.46and21.44.
Thequantumofserviceateachstationonthissectionofthenetworkissummarisedbelow
Table1Quantumofrailservice
StationSouthbound Northbound
M-F Sat Sun M-F Sat SunEnniscorthy 5 3 3 4 3 3
Wexford 5 3 3 4 3 3
RosslareStrand 4 3 3 4 3 3
RosslareEuroport 4 3 3 4 3 3
12ofwhichextendtoDundalk

2
1.2Potentialreplacementbusservices
There are a number of existing bus services operating in this region – both PSO and private
commercialservices.TheservicesarelistedinTable2.
The following points provide a high-level summary of the potential need for public transport
replacementservicesintheeventoftheremovalofrail:
• WexfordandEnniscorthyarewellservedbyasignificantvolumeofexistingbusservices,for
traveltoArklow,DublinCityandAirport
• Rosslare Europort is reasonably well served by Bus Éireann Route 40 to Wexford where
interchangeisrequiredforonwardtravel.Theconnectionsarenotseamless,however.Bus
ÉireannalsoprovidesalimitedserviceonRoute370toRosslareStrandandWexford
• RosslareStrandhasalocalservicetoWexfordprovidedbyWexfordBusandalimitedservice
providedbyBusÉireannonRoute370toRosslareEuroportandWexford
BasedontheaboveapotentialbusreplacementserviceissetoutinFigures1and2.Theservicehas
beendesignatedasRoute340inthetableswhichalsoshowtherailservicestobesuspended,the
remaining rail services and connections to and from Dublin and other relevant bus services and
connections.Theproposedservicewillprovidethefollowing:
FromRosslareEuroport
• AMondaytoSaturdaypeakservicefromRosslareEuroportconnectingwiththecurrenttrain
servicedeparturefromGorey
• AnearlySundaymorningservicefromRosslareEuroportconnectingwiththecurrenttrain
servicedeparturefromGorey
• AMondaytoSaturdaymiddayservicefromRosslareEuroportconnectingwiththecurrent
trainservicedeparturefromGorey
• AnearlyafternoonSundayservicefromRosslareEuroportconnectingwiththecurrenttrain
servicedeparturefromGorey
• AlateafternoonSundayservicefromRosslareEuroportconnectingwiththecurrenttrain
servicedeparturefromGorey
• AlateafternoonMondaytoFridayservicefromWexfordconnectingwiththecurrenttrain
service departure at Gorey. Passengers from Rosslare Europort use Bus Éireann Route 40
andchangeatWexford.Passengers fromRosslareStranduseWexfordBusRoute878and
changeatWexford• AlateafternoonSaturdayservicefromRosslareEuroportconnectingwiththecurrenttrain
service departure at Gorey. Passengers from Rosslare Strand useWexford Bus Route 878
andchangeatWexford• NoserviceisproposedfortheearlymorningdeparturefromRosslareEuroportandRosslare
Strandastherearenoorveryfewpassengerstravellingonthisservice.Connectionsfrom
WexfordareprovidedbyBusÉireannRoute40connectingwiththecurrenttrainservice
departurefromGorey

3
FromGorey• A late morningMonday to Saturday service from Gorey toWexford connecting with the
currenttrainservicearrivalatGorey.PassengersforRosslareStranduseWexfordBusRoute
878andpassengersforRosslareEuroportuseBusÉireannRoute40
• AlatemorningSundayservicefromGoreytoRosslareEuroportconnectingwiththecurrent
trainservicearrivalatGorey
• Amid-afternoonMonday to Saturday service fromGorey toRosslareEuroport connecting
withthecurrenttrainservicearrivalatGorey.PassengersforRosslareStranduseWexford
BusRoute878
• A mid-afternoon Sunday service from Gorey to Rosslare Europort connecting with the
currenttrainservicearrivalatGorey
• AMondaytoFridayeveningpeakservicefromGoreytoRosslareEuroportconnectingwith
thecurrenttrainservicearrivalatGorey
• AMondaytoFriday lateeveningpeakservice fromGoreytoWexfordconnectingwiththe
currenttrainservicearrivalatGorey.
• Adailymid-eveningserviceGoreytoRosslareEuroportconnectingwiththecurrenttrain
servicearrivalatGorey
Itisestimatedthatthegrossannualcostofprovidingthisservicewillbecirca€325,000.
Table2ExistingBusservicesinthearea
Operator No ServiceLocationsonRailLineServed
BE 2/X2 WEXFORD–ENNISCORTHY–GOREY–DUBLIN-AIRPORT
Wexford,Enniscorthy,
Gorey,Arklow,Dublin
BE 40
ROSSLAREEUROPORT–WEXFORD–WATERFORD–CORK-
TRALEE
RosslareEuroport,
Wexford
BE 370 ROSSLAREEURPORT–WEXFORD–NEWROSS-WATERFORD
RosslareEuroport,
RosslareStrand,
Wexford
WexfordBus 740 WEXFORD–ENNISCORTHY–GOREY–DUBLIN-AIRPORT
Wexford,Enniscorthy,
Gorey,Arklow,Dublin
WexfordBus 878 WEXFORD–ROSSLARESTRAND
RosslareStrand,
Wexford

4
Figu
re1Poten
tialrep
lacemen
tbusse
rviceRo
sslareEurop
orttoGo
rey
Rail
BEX2
Rail
Rail
WEX
WEX
BE38
4WEX
BE2
BE40
WEX
RailBus340
BE2
Rail
WEX
BE2
BE2
M-F
Daily
M-F
SAT
M-F
SM-F
M-F
M-S
DAILY
DAILY
M-S
M-S
DAILY
SuDA
ILYSu
DAILY
DAILY
RosslareEuroport
05:35
07:00
07:20
06:45
09:40
09:05
RosslareStrand
05:40
07:24
07:00
09:44
09:20
Wexford
05:50
05:59
06:15
06:15
07:00
07:25
07:30
07:43
07:20
08:00
10:03
10:3009:40
10:00
13:00
Enniscorthy
06:10
06:23
06:40
06:40
07:20
07:55
08:04
07:45
08:20
10:24
10:5510:05
10:20
13:20
Gorey
arr
06:45
08:24
08:15
10:44
10:35
Gorey
dep
05:5506:40
06:45
06:45
07:05
06:50
07:05
07:50
08:25
08:24
08:50
10:44
11:30
10:50
13:50
Arklow
06:08
07:00
07:00
07:20
07:15
07:20
08:10
08:40
08:37
09:10
10:57
11:45
11:10
14:10
Rathdrum
06:26
07:18
07:18
08:53
11:13
Wicklow
06:38
07:33
07:33
09:04
11:24
Dublin
07:4608:06
08:46
08:47
08:40
08:40
08:55
08:40
09:25
09:55
10:15
10:25
12:30
12:55
12:25
15:25
Bus340
Rail
WEX
BE40
BE2
BE37
0Rail
Bus340
BE40
BE40
WEX
WEX
Bus340Bus340Bus340
Rail
Rail
BE2
BE40
M-S
M-S
DAILY
DAILY
DAILY
M-S
SuSu
DAILY
M-F&Su
DAILY
M-S
SuM-F
SSu
M-S
DAILY
DAILY
RosslareEuroport
12:2012:55
13:00
13:45
14:20
13:50
14:40
17:00
17:10
17:3017:40
17:55
19:00
RosslareStrand
12:3513:01
13:55
14:26
14:05
17:10
17:25
17:45
18:01
Wexford
12:5513:20
13:30
13:25
14:00
14:15
14:45
14:25
15:05
17:20
17:30
17:45
17:45
17:55
17:5518:05
18:20
18:30
19:25
Enniscorthy
13:2013:41
13:55
14:20
15:06
14:50
17:55
18:10
18:20
18:2018:27
18:44
18:50
Gorey
arr
13:5014:01
15:28
15:20
18:40
18:50
18:5018:47
19:03
Gorey
dep
14:01
14:30
14:50
15:28
18:25
18:47
19:03
19:20
Arklow
14:13
14:45
15:10
15:40
18:40
19:00
19:15
19:35
Rathdrum
14:30
15:57
19:17
19:31
Wicklow
14:41
16:08
19:28
19:42
Dublin
15:45
15:55
16:25
17:10
19:50
20:35
20:44
20:45
Appendix2PotentialBusReplacementServiceRosslareEuroporttoGorey

5
Figu
re2Poten
tialrep
lacemen
tbusse
rviceRo
sslareEurop
orttoGo
rey
BE370
Rail
Bus3
40BE40
WEX
BE2
Rail
Bus3
40WEX
BE40
BE2
WEX
Rail
Bus3
40WEX
Rail
Bus3
40M-S
M-S
M-S
M-S
M-S
DAILY
SuSu
DAILY
SuM-S
M-S
M-S
M-S
M-S
SuSu
Dubl
in09:40
10:30
10:25
10:50
13:3014:00
13:36
13:45
Wickl
ow10:40
11:26
14:41
14:46
Rath
drum
10:53
11:38
14:54
14:58
Arkl
ow11:08
11:45
11:54
12:05
14:4515:05
15:10
15:14
Gor
eyar
r11:21
12:06
15:22
15:27
Gor
eyde
p11:21
11:3
012:05
12:06
12:2
012:20
15:0515:20
15:22
15:3
015:27
15:3
0En
nisc
orth
y11:42
12:0
012:35
12:25
12:5
012:45
15:3515:45
15:41
16:0
015:46
16:0
0W
exfo
rd11:45
12:02
12:2
512:30
12:30
12:55
12:48
13:1
513:1514:1515:5516:20
16:04
16:2
516:45
16:08
16:2
5Ro
ssla
reStran
d12:05
12:19
12:58
13:04
13:3
516:21
17:10
16:25
16:4
5Ro
ssla
reEur
opor
t12:15
12:26
12:55
13:10
13:4
514:40
16:26
16:5
016:32
16:5
5
BE2
BE2
WEX
Rail
Bus3
40BEX2
WEX
Rail
Bus3
40BE40
WEX
Rail
BE2
Rail
Bus3
40BE2
DAILY
DAILY
DAILY
M-F
M-F
DAILY
DAILY
M-F
M-F
M-S
M-S
SuDA
ILYM-S
DAILY
DAILY
Dubl
in14:30
16:30
16:5016:37
17:30
17:50
17:36
18:5018:30
18:30
18:38
20:30
Wickl
ow17:42
18:44
19:29
19:42
Rath
drum
17:56
18:59
19:41
19:54
Arkl
ow15:45
17:45
18:0518:11
19:00
19:16
19:5019:57
19:45
20:10
20:45
Gor
eyar
r18:24
19:45
20:10
20:23
Gor
eyde
p16:05
18:10
18:2018:24
18:3
018:55
19:15
19:45
19:5
520:0520:10
20:10
20:23
20:3
021:05
Enni
scor
thy
16:35
18:40
18:4518:44
19:0
019:25
19:40
20:06
20:2
520:3520:29
20:40
20:42
21:0
021:35
Wex
ford
16:55
19:00
19:1519:05
19:2
519:45
20:15
20:27
20:5
020:3020:5520:51
21:00
21:04
21:2
521:55
Ross
lare
Stran
d19:19
19:4
521:08
21:21
21:4
5Ro
ssla
reEur
opor
t19:25
19:5
520:50
21:15
21:28
21:5
5
Appe
ndix
3P
oten
tialB
usR
epla
cem
entS
ervi
ceG
orey
toR
osslar
eEu
ropo
rt

6
2.0 Bus Service implications relating to suspensionof rail servicesEnnis-Athenry
The following isahigh level considerationof theneed toprovide replacementbus services in the
event of the suspension of rail services currently operating between Ennis and Athenry on the
Galway-Limerickline.
2.1Existingrailserviceprovision
TheGalway-LimericklinebranchesoffthemainDublin/GalwaylineatAthenrywith5otherstations
enroutetoLimerickColbertnamelyCraughwell,Ardrahan,Gort,EnnisandSixmilebridge.
Thisscenario involvesconsiderationoftheremovalofall railservicescurrentlyoperatingbetween
Galway and Limerick/Limerick Junction – a number of short working services between Ennis and
LimerickandAthenryandGalwaywouldremaininplace.
Thecoreservicecomprises5trainsperdayfromLimericktoGalwayoperatingatirregularintervals
ofbetween1hr15minsand5hoursapproximatelywhilefromGalwaytoLimerickthereare4daily
servicesat3-4hour intervals.Servicesrunbetweenthehoursof6amand8pmapproximatelyand
stopatallstationsbetweenGalwayandLimerickwiththeexceptionoftherecentlyopenedstation
atOranmorewhichisservedbyonelesstrainintheLimerick-Galwaydirection.
Two of the services (13.45 and 17.50) departing Galway run through to Limerick Junction – it is
possible to connectwith a services to Cork/Mallowat Limerick Junctionhowever the interchange
timeforthe13.45is1hourand34minutesresultinginahighlyunrealisticanduncompetitiveoverall
journey time. The similar is evident in the return direction although to a lesser extent. Both the
07.00andthe12.20departuresfromCorkserveLimerickJunctionwhereconnectionstoGalwayare
availablewithinterchangewaitingtimeof42and24minutesrespectively.
In addition to the above there is an 18.40 Galway to Ennis service stopping at all intermediate
stations.Anonwardconnection toLimerick ispossiblehowever theexcessive interchange timeof
1hrand17minsmakesthisunattractive.

7
2.2Potentialreplacementbusservices
There are a number of existing bus services operating in this region – both PSO and private
commercialservices.ThemainservicesarelistedinTable5.
Tables3&4belowsummarisetheexistingserviceoffering(bothbusandrail)fromthesettlements
alongtheraillineinbothdirections.
Table3Summaryofbus/railservicelevelstosoutherndestinations
From ToLimerick/ShannonAirport/Dublin/DublinAirport M-F Sa SuCrusheen 14ofwhich0aretrains 14ofwhich0aretrains 14ofwhich0aretrains
Gort 20ofwhich5aretrains 19ofwhich5aretrains 14ofwhich4aretrains
Ardrahan 20ofwhich5aretrains 19ofwhich5aretrains 19ofwhich4aretrains
Craughwell 26)ofwhich5aretrains 23ofwhich5aretrains 19ofwhich4aretrains
Table4Summaryofbus/railservicelevelstonortherndestinations
From ToGalway/DublinAirport/Dublin/Athlone M-F Sa SuCrusheen 12ofwhich0aretrains 12ofwhich0aretrains 12ofwhich0aretrains
Gort 18ofwhich5aretrains 17ofwhich5aretrains 16ofwhich4aretrains
Ardrahan 18ofwhich5aretrains 17ofwhich5aretrains 16ofwhich4aretrains
Craughwell 23ofwhich5aretrains 23ofwhich5aretrains 18ofwhich4aretrains
The following points provide a high-level summary of the potential need for public transport
replacementservicesintheeventoftheremovalofrail
• Craughwell inparticular is servedbyasignificantvolumeofexistingbusservices,given its
population2, fortraveltoLimerickcity(andconnectionswithShannon),Galwaycityandto
Dublin.
• ThereisnocurrentbusservicelinkingCraughwellwiththeothersettlementsontherailline
(Gort, Ardrahan, Ennis). In the absence of rail these connections would be lost, however
given the size of the settlements and the relationship between Craughwell and Galway
demand is likely to be low. Data from IE (2012 O/D PassengerMatrix) showed only 317
passengersannuallytravelledbetweenCraughwellandtheotherstations.Suchlowlevelsof
demandareunlikelytowarrantthedevelopmentofafixedreplacementbusservice.
• Theremovaloftherailwouldimpactmoreonlocalpublictransportconnections.Therailis
currently theonly direct service linking Ennis,Gort andArdrahanwithAthenry. Itmaybe
possibletoamendexistingbusservicestofacilitateconnectivitybetweentheselocationsin
theabsenceofrail.
2665peoplewithinthesettlementboundary(Census2012)howeveralsosignificantdispersedpopulationin
thesurroundingruralarea

8
• An hourly bus offering is available between Ennis and Galway, also serving Gort and
ArdrahanbutnotAthenry.Thefirstof theseservicesdepartsEnnisat10.25.Railcurrently
provides an earlier option for this journeywith arrival in Athenry at 07.43 andGalway at
08.10.ItislikelythatareplacementbusservicewouldberequiredtofacilitatetravelEnnis-
Athenry/Galwayservingtheintermediatestationsforpre9amarrivalintheabsenceofrail
BasedontheaboveapotentialbusreplacementserviceissetoutinFigures3and4.Theservicehas
beendesignatedasRoute351inthetableswhichalsoshowtherailservicestobesuspended,the
remaining rail servicesandconnections toand fromDublin.Theproposedservicewillprovide the
following:
FromEnnis• AMondaytoSaturdaypeakserviceextendingtoGalwayforacomparablearrivaltimetothe
currenttrainservicewithaconnectiontoDublinfromAthenry• AdailymorningservicetoAthenryprovidingonwardconnectionstowardsDublin(daily)and
Galway(MondaytoSaturday)• AnearlyafternoonSundayservicetoAthenryprovidingonwardconnectionstowardsDublin• A mid-afternoon Monday to Saturday service to Athenry providing onward connections
towardsGalway• Amid-afternoonSundayservicetoAthenryprovidingonwardconnectionstowardsDublin
• AdailyearlyeveningservicetoAthenryprovidinganonwardconnectiontowardsGalway• Amid-eveningMonday toSaturdayserviceprovidingonwardconnections towardsGalway
andAthlone• DeparturesfromEnnishavebeenco-ordinatedwherepossiblewithBusÉireannExpressway
Route51andoperateattheoppositehalfhouroverthecommonsectionofroute(Gortand
Ardrahan)
FromAthenry• AMondaytoSaturdaypeakserviceextendingtoLimerick foracomparablearrival timeto
thecurrenttrainservice.• Amid-morningSundayservicetoEnnis
• Amid-morningMonday to Saturday service to Ennis offering a connection fromDublin at
Athenry
• Amid-morningSundayservicetoEnnis
• AnearlyafternoonMondaytoSaturdayservicetoEnnisofferingaconnectionfromDublinat
Athenry
• AdailyafternoonpeakservicetoEnnis
• AMondaytoSaturdayearlyeveningservicetoEnnis offeringaconnectionfromDublinat
Athenry
• ArrivalsatEnnishavebeenco-ordinatedwherepossiblewithBusÉireannExpresswayRoute
51andgenerallyoperateattheoppositehalfhouroverthecommonsectionofroute(Gort
andArdrahan)

9
Table5ExistingBusservicesinthearea
Operator No ServiceLocationsonRailLineServed
BE 51 CORK−LIMERICK−SHANNONAIRPORT−GALWAY Ennis,Gort,Ardrahan
BE 343 LIMERICK–SHANNONAIRPORT-ENNIS Ennis,Sixmilebridge
BE 434 GALWAY−GORT Ardrahan,Gort
BE 20/X20 DUBLIN−AIRPORT−ATHLONE−BALLINASLOE−GALWAY Craughwell
BE 70 GALWAY−ATHLONE−MULLINGAR−DUNDALK Craughwell
Citylink 763 Galway-Athlone-Dublin-DublinAirport Craughwell
HealyBus 920 Loughrea/GalwayDailyServices Craughwell

10
Figu
re3Poten
tialrep
lacemen
tbusse
rviceEn
nistoAthe
nry
Rail
Rail
351
Rail
351
Rail
Rail
Rail
Rail
Rail
351
Rail
351
Rail
351
Rail
Rail
Rail
351
Rail
Rail
Rail
Rail
351
Rail
Rail
M-S
M-S
M-S
SuM
-Su
SuM-S
M-S
M-S
SuSu
SuM
-SM-S
SuSu
SuM-S
M-S
uSu
M-S
SuM-S
M-S
SuM-S
Limer
ick05:55
09:00
09:20
12:20
14:20
15:55
18:00
18:15
19:45
Enni
s(ar
r)06:34
09:37
09:57
12:57
14:57
16:35
18:37
18:57
20:23
Enni
s(de
p)06:49
06:2
509:41
09:5
509:58
13:04
13:5
515
:0514:58
16:0
516:35
19:05
19:0
518:57
20:25
20:5
5Go
rt07:12
06:5
510:03
10:2
510:20
13:26
14:2
515
:3515:20
16:3
517:01
19:32
19:3
519:24
20:47
21:2
5Ar
drah
an07:22
07:0
510:12
10:3
510:30
13:35
14:3
515
:4515:29
16:4
517:10
19:42
19:4
519:33
20:56
21:3
5Cr
augh
wel
l07:31
07:2
010:21
10:5
010:39
13:43
14:5
016
:0015:37
17:0
017:18
19:51
20:0
019:41
21:04
21:5
0At
henr
y(ar
r)07:43
07:3
510:34
11:0
510:53
13:57
15:0
516
:1515:53
17:1
517:32
19:57
20:1
519:51
21:15
22:0
5
Athe
nry(
dep)
07:4307:47
10:34
11:1810:5311:2511:2613:57
15:22
15:53
17:3217:3820:04
19:5520:2920:5821:18
22:2722:31
Galw
ay
08:10
08:0
510:55
11:13
11:4714:17
16:12
17:52
20:25
20:1520:5021:1821:40
22:46
Dubl
in09:47
13:25
13:40
17:40
19:50
Athl
one
23:10

11
Figu
re4Poten
tialR
eplacemen
tBusServiceAthen
ryto
Enn
is
Rail
351
Rail
Rail
351
Rail
Rail
351
Rail
351
Rail
Rail
351
Rail
Rail
Rail
Rail
351
Rail
Rail
Rail
351
Rail
Rail
M-S
M-S
SuM-S
SuSu
M-S
M-S
M-S
SuSu
M-S
M-S
M-S
SuSu
M-S
M-S
uM-S
SuM-S
M-S
M-S
M-S
Dubl
in07:35
11:25
14:35
16:30
Galw
ay
06:20
05:5
008:3008:40
10:30
11:55
13:4516:10
16:30
17:5018:30
18:40
Athe
nry(
arr)
09:00
09:48
13:23
16:4016:50
18:28
Athe
nry(
dep)
06:41
06:2
008:52
09:2
010
:2010:55
11:3
513
:3514:0616:33
17:2
018:1518:53
18:3
519:06
Crau
ghw
ell
06:50
06:3
509:00
09:3
510
:3511:03
11:5
012:23
13:5
014:1416:41
17:3
518:2319:01
18:5
019:14
Ardr
ahan
06:59
06:5
009:09
09:5
010
:5011:11
12:0
512:32
14:0
514:2316:50
17:5
018:3119:10
19:0
519:22
Gort
07:16
07:0
009:18
10:0
011
:0011:21
12:1
512:41
14:1
514:3217:01
18:0
018:4019:23
19:1
519:31
Enni
s(ar
r)07:40
07:3
509:40
10:3
511
:3511:43
12:5
013:03
14:5
014:5517:23
18:3
518:5819:45
19:5
019:53
Enni
s(de
p)07:45
07:4
009:40
11:35
11:43
13:03
15:0017:23
19:0219:45
21:40
Limer
ick(a
rr)
08:25
08:2
510:20
12:14
12:22
13:42
15:3918:03
19:4320:23
22:19

12
3.0Bus Service implications relating to suspensionof rail servicesLimerickJunction-Waterford
The following isahigh level considerationof theneed toprovide replacementbus services in the
event of the suspension of rail services currently operating between Waterford and Limerick
Junction.
3.1Existingrailserviceprovision
The Waterford-Limerick Junction route currently operates two services a day on Modays to
Saturdays ineachdirectionservingCarrick-On-Suir,Clonmel,CahirandTipperarybeforearriving in
LimerickJunction.Thisisareductionfrom3servicesadayeachwayin2012.Therailjourneytimeis
approximately 1 hour and 40 minutes to Limerick Junction where it is possible to connect with
servicestoCork,LimerickandDublin.
In termsof travelbetweenWaterfordand Limerick Junction, servicesoperateone in themorning
and one in the late afternoon each way. The removal in 2013 of themid-day each way services
resultedcreatedaservicegapofbetween8and9hoursalongthecorridor.
TotaljourneytimesbetweenWaterfordandLimerickandWaterfordandCorkvarysignificantlydue
largelytointerchangedelaysatLimerickJunction.
ThereisnoSundayservice.
3.2Potentialreplacementbusservices
There are a number of existing bus services operating in this region – both PSO and private
commercialservices.ThemainservicesarelistedinTable6.
The following points provide a high-level summary of the potential need for public transport
replacementservicesintheeventoftheremovalofrail:
• Alllocationsontheraillinearewellservedbyasignificantvolumeofexistingbusservices,
fortraveltoLimerickcity,WaterfordcityandtoDublin
• In particular Bus Éireann Expressway Route 55 replicates the rail line and operates on a
regularfrequency3.Assuchtheneedforadditionalreplacementservices isminimal.Route
55hasrecentlybeenaugmentedbyadditionaljourneysbeingprovidedonBusÉireannPSO
Route 355 betweenWaterford and Clonmel via Carrick-on-Suir. Additional local journeys
betweenLimerickandTipperaryareprovidedbyBusÉireannPSORoute347
• BothBusÉireannandJJKavanaghprovidecommercialserviceslinkingClonmeltoDublinCity
andAirport
39/10servicesadayeachwayMondaytoSaturday

13
• BusÉireannprovidescommercialserviceslinkingCahirtoDublinCityandAirportandtoCork
Basedontheabovethere is limitedpotentialorneedforadditionalbusreplacementservices,but
thereisscopetomakesomeminoradditionstoimprovethenetworkofpublictransportservicesin
theareaasawhole.ThedetailsaresetoutinFigures5and6andincorporateadditionaldepartures
onRoute355.Thetablesalsoshowtherailservicestobesuspended,theremainingrailservicesand
connectionstoandfromDublin,CorkandLimerick.Theproposedservicewillprovidethefollowing:
FromWaterford• AnearlymorningMondaytoFridayconnectingservicebycommencingthecurrentTipperary
to Limerick PSO service 347 atWaterford and operating via Carrick-on-Suir, Clonmel and
Cahir. This service will provide connections at Limerick Junction for onward rail travel to
DublinandCork
• AMondaytoSaturdayrail replacementservice (Route355)atsimilar times to thecurrent
railservice,maintainingconnectionsatLimerickJunctionforonwardrailtraveltoDublinand
CorkandextendingtoLimerickCity
• Extensionofthecurrent1340Route355departurefromWaterfordtoClonmeltocontinue
toLimerickviaCahir,TipperaryandLimerickJunction
• Extensionofthecurrent1610Route355departurefromWaterfordtoClonmeltocontinue
toLimerickviaCahir,TipperaryandLimerickJunctionprovidingconnectionsatLimerick
JunctionforonwardrailtraveltoDublinandCork.
•
FromLimerickCity/Junction• Introductionofanearlyafternoon service (Route355)operatingat1325 fromLimerick to
Waterford providing connections at Limerick Junction with rail services from Cork and
Dublin.ItshouldbenotedthatBusÉireannExpresswayRoute55operatesat1225and1425
fromLimerick.
• A Monday to Saturday rail replacement service at 1805 from Limerick to Waterford
providingconnectionsatLimerickJunctionwithrailservicesfromCorkandDublin
• It should also be noted that as Bus Éireann operates Expressway Route 55 at 0925 from
Limerick toWaterford, which provides connections at Limerick Junction with rail services
fromCorkandDublin.Assuchthereisnorequirementforanyadditionalserviceatthistime

14
Table6ExistingBusservicesinthearea
OperatorRouteNo Service LocationsonRailLineServed
BE 55LIMERICK−TIPPERARY–CAHIR-CLONMEL–CARRICK-WATERFORD
LimerickJunction,Tipperary,Cahir,Clonmel,Carrick-on-Suir
BE 347 LIMERICK–LIMERICKJUNCTION-TIPPERARY LimerickJunction,Tipperary
BE 355WATERFORD–CARRICK-ON-SUIR–CLONMEL-CAHIR Carrick-on-Suir,Clonmel,Cahir
BE 7 AIRPORT–DUBLIN–KILKENNY–CLONMEL Clonmel
BE X8 AIRPORT–DUBLIN–CASHEL–CAHIR-CORK Cahir
JJKavanagh 717 AIRPORT–DUBLIN–KILKENNY–CLONMEL Clonmel

15
Figu
re5Poten
tialrep
lacemen
tbusse
rviceWaterfordto
Limerick
M-F
M-S
M-S
M-S
M-S
M-S
M-S
M-S
M-S
M-S
M-S
M-S
BE34
7Rail
Rail
355
Rail
Rail
Rail
355
355
Rail
Rail
Rail
Wat
erfo
rd05
:40
07:1
007
:20
13:4
016
:10
16:2
5Ca
rrick
-on-
Suir
06:1
007
:40
07:4
514
:10
16:4
016
:50
Clon
mel
ar
r06
:35
14:3
517
:05
Clon
mel
dep
06:4
508
:05
08:0
815
:05
17:0
517
:13
Cahi
r07
:05
08:2
508
:25
15:2
517
:25
17:3
0Ti
pper
ary
07:35
08:5
508
:47
15:5
517
:55
17:5
1Lim
erick
Junc
tion
07:40
09:0
009
:00
16:0
018
:00
18:0
507:56
08:34
09:15
09:33
18:17
18:26
Limer
ickC
olbe
rt08:35
09:3
516
:40
18:4
0Du
blin
Heu
ston
09:30
10:47
20:00
Cork
09:35
10:35
19:30

16
Figu
re6Poten
tialrep
lacemen
tbusse
rviceLimericktoW
aterford
M-S
M-S
M-S
M-S
M-S
M-S
M-S
M-S
M-S
M-S
M-S
M-S
M-S
355
355
Rail
Rail
Rail
BE55
Rail
Rail
355
Rail
Rail
Rail
355
Cork
08:00
12:20
17:20
DublinHeu
ston
08:00
12:00
17:00
Limerick
Colbe
rt09:25
13:25
18:05
Limerick
Junctio
n09:15
09:33
09:45
09:55
13:16
13:34
13:55
18:16
18:26
18:40
18:35
Tipp
erary
09:57
10:00
14:00
18:52
18:40
Cahir
07:10
08:30
10:20
10:30
14:30
19:15
19:10
Clon
melar
r14:50
Clon
mel
07:30
08:50
10:37
10:50
14:50
19:32
19:30
Carrick-on-Su
ir07:50
09:10
11:01
11:10
15:10
19:56
19:50
Waterford
08:30
09:50
11:26
11:50
15:50
20:20
20:30

17
4.0Bus Service implications relating to suspensionof rail servicesLimerick-Ballybrophy
The following isahigh level considerationof theneed toprovide replacementbus services in theeventofthesuspensionofrailservicescurrentlyoperatingontheLimerick-Ballybrophyline.
4.1Existingrailserviceprovision
The Nenagh line branches from the Dublin/Cork mainline at Ballybrophy serving Roscrea,Cloughjordan,Nenagh,Birdhill,CastleconnellandthenontoLimerickColbert.
Allstationsonthelineareservedtwicedaily(MondaytoSaturday)withservicesoperatingeachwaybetween Ballybrophy and Limerick Colbert with onwards connections to Dublin at Ballybrophy. Inaddition to this there is an early morning services operating from Nenagh (serving Birdhill andCastleconnell)toLimerickforarrivalat08.45.
OnSundaysthereisonlyoneserviceineachdirection–again,thenorthboundtrainconnectstoamainlinetrainforonwardtraveltoDublin.
The current serviceofferingprovides for local travelbetween the settlementson the rail lineandfacilitatesconnectionsforlongerdistanceinter-urbanandinter-regionaltraveldemandbetweenthenorthTipperaryareaandotherareasincludingGalway,Dublin,Shannonetc.albeitataverylimitedfrequency.
4.2Potentialreplacementbusservices
There are a number of existing bus services operating in this region – both PSO and privatecommercial services. The main services are listed in Table 9. Tables 7 & 9 below summarise theexisting service offering (both bus and rail) from the settlements along the rail line in bothdirections.

18
Table7Summaryofbus/railservicelevelstosoutherndestinations
From ToLimerick/ShannonAirport/Galway M-F Sat Sun
Castleconnell 7ofwhich3aretrains 4ofwhich2aretrains 1ofwhich1istrain
Birdhill 18ofwhich3aretrains 17ofwhich2aretrains 14ofwhich1istrain
Nenagh 25ofwhich3aretrains 24ofwhich2aretrains 24ofwhich1istrain
Cloughjordan 2ofwhich2aretrains 2ofwhich2aretrains 1ofwhich1istrain
Roscrea 18ofwhich3aretrains 18ofwhich2aretrains 18ofwhich1istrain
Table8Summaryofbus/railservicelevelstonortherndestinations
From ToDublin/DublinAirport/Carlow/Athlone/Birr M-F Sat Sun
Castleconnell 3ofwhich2aretrains 2ofwhich2aretrains 1ofwhich1istrains
Birdhill 15ofwhich2aretrains 15ofwhich2aretrains 15ofwhich1istrains
Nenagh 23(1BusMo-Th)ofwhich2aretrains 22ofwhich2aretrains 21ofwhich1istrains
Cloughjordan 2ofwhich2aretrains 2ofwhich2aretrains 1ofwhich1istrains
Roscrea 19(1BusFO)ofwhich2aretrains 18ofwhich2aretrains 18ofwhich1istrains
The following points provide a high-level summary of the potential need for public transportreplacementservicesintheeventoftheremovalofrail:
• Thecurrent levelof serviceprovidedby rail is lowand thereareanumberofexistingbusservicesthatprovideasimilarfunctiontotherailline
• Nenagh,RoscreaandBirdhillinparticularhavesignificantlevelsofbusserviceprovisionfortravel to/from Limerick and Dublin (and intermediate locations i.e. Portlaoise). Existingservice levelsaregoodgiventhe levelsofpopulation4 intheseareasand incomparisontoprovisioninotherareasofthecountry.- Roscreahasaserviceatleastevery2hoursintoLimerickbybus,fromNenaghthereare
approximately2busesperhourintoLimerickwithadditionalservicesinthepeaks- InthedirectionofDublin2-3busservicesperhourareinoperationfromNenaghand1-
2fromRoscrea- Birdhillalsohasagoodlevelofbusservicewitha2hourlyservicetowardsDublin.Into
Limericktheofferingismoreirregularwithhourlyor2hourlyservicesandanumberofadditionalpeaktimeservices
• For some of the existing rail services there are also bus services currently in operation atsimilartimesfortraveltoLimerickandDublin
4Nenaghisthelargestsettlementonthisrailline,populationcirca8,400(Census2011)

19
• Thereare2areasinparticularwheretheremovaloftherailservicewouldhaveanimpactontheabilitytoaccesspublictransportandwherereplacementbusservicesarelikelytoberequired- TheexistingrailserviceisthesolepublictransportoptionavailableatCloughjordan(pop
511,Census2011).AreplacementbusservicelinkingCloughjordantothelargerservicecentresofNenagh,RoscreaandLimerickaswellastothewidertransportnetworkforregionalconnectionswouldberequired(tooperate7daysaweek)
- The removal of the existing rail service would reduce the public transport servicefrequencyatCastleconnell(pop1917,Census2011)fortravelintoLimerick(andaccesstoanytoonwardconnections)buttherearepeaktimebusconnectionsavailableandnorail replacement bus service is, therefore, proposed. There are no such suitably timedbusservicesfortraveltonortherndestinationsincludingDublin.Thisshortfallshouldbeaddressedwithreplacementservices.
Based on the above there is limited need for additional bus replacement services other than therequirementtoserveCloughjordanwhichwillhavenopublictransportserviceandalsotoprovidenorthboundlinksfromCastleconnell.Thereisscopetoprovideareplacementservicethatoperatesalong the entire length of the rail corridor that would serve the needs of Cloughjordan andCastleconnell and additionally continue to provide connections currently available by rail. ThedetailsaresetoutinFigures7and8.Thetablesalsoshowtherailservicestobesuspended,therailconnectionstoandfromDublinandrelevantbusoptionsalongtherail line. Theproposedservicewouldprovidethefollowing:
FromBallybrophy • Amid-morningMondaytoSaturdayrailreplacementservicethatwillconnectwiththe0958
trainarrivalfromDublin,provideonwardconnectionstoallcurrentdestinationsontherailline,maintainaserviceforCloughjordanandalsocontinuetoprovideanoffpeakmorningservicefromCastleconnellintoLimerick
• Anadditionalmid-afternoonMondaytoSaturdayservicethatwillconnectwiththe1458trainarrivalfromDublin,provideonwardconnectionstoallcurrentdestinationsontherailline,provideanadditionalserviceforCloughjordanandalsocontinuetoprovideanafternoonservicefromCastleconnellintoLimerick
• Aneveningdailyrailreplacementservicethatwillconnectwiththe1854(1933onSundays)trainarrivalfromDublin,provideonwardconnectionstoallcurrentdestinationsontherailline, maintain a service for Cloughjordan and also continue to provide an evening servicefromCastleconnellintoLimerick
FromLimerick
• An early morning Monday to Saturday rail replacement service that will connect with the0845traindeparturetoDublinandmaintainaserviceforCloughjordan
• Anadditionalmid-morningMondaytoSaturdayservicethatwillconnectwiththe1255traindepartureforDublin
• AnafternoonpeakMondaytoSaturdayrailreplacementservicethatwillconnectwiththe1855(1927onSundays)traindeparturetoDublinandmaintainaserviceforCloughjordan

20
Table9ExistingBusservicesinthearea
Operator No Service LocationsonRailLineServed
BE X12 AIRPORT − DUBLIN − PORTLAOISE – ROSCREA - NENAGH −LIMERICK
Roscrea, Nenagh,Limerick
JJKavanagh
735 AIRPORT - DUBLIN – PORTLAOISE – ROSCREA – NENAGH –LIMERICK–SHANNON
Roscrea, Nenagh,Birdhill,Limerick
BE 323 LIMERICK−KILLALOE−NEWPORT−NENAGH−BORRISOKANE−BIRR
Limerick,Castleconnell,Birdhill,Nenagh
BE 341 SHANNON−LIMERICK−NEWPORT−CAPPAMORE Castleconnell,Limerick
BE 72 TRALEE−LIMERICK−BIRR−ATHLONE Limerick, Birdhill,Nenagh

21
Figure7PotentialreplacementbusserviceBallybrophytoLimerick
Figure8PotentialreplacementbusserviceLimericktoBallybrophy
BE323JJK735 BE323 Rail Rail Rail Bus Rail Bus Rail Rail Bus Rail Rail Bus
M-S M-S M-F M-F M-S M-S M-S M-S M-S M-S M-S M-S Su Su SuDublin 09:00 14:00 18:00 18:25Ballybrophy(arr) 09:58 14:58 18:54 19:33Ballybrophy(dep) 10:05 10:05 15:05 19:00 19:00 19:40 19:40Roscrea 10:25 10:25 15:25 19:21 19:20 20:01 20:00Cloughjordan 10:46 10:55 15:55 19:43 19:50 20:22 20:30Nenagh 07:30 07:45 07:45 11:05 11:20 16:20 20:02 20:15 20:40 20:55Birdhill 07:25 07:50 08:00 08:13 11:33 11:35 16:35 20:29 20:30 21:08 21:10Castleconnell 07:40 08:22 11:43 11:50 16:50 20:38 20:45 21:17 21:25Limerick 08:10 08:30 08:35 08:45 12:04 12:15 17:15 21:00 21:10 21:39 21:50
Bus Rail Rail Bus Rail Bus Rail Rail Bus Rail RailM-S M-S M-S M-S M-S M-S M-S M-S Su Su Su
Limerick 06:25 06:30 10:25 16:35 16:55 17:05 17:25Castleconnell 06:50 06:53 10:50 17:00 17:15 17:30 17:46Birdhill 07:05 07:03 11:05 17:15 17:24 17:45 17:55Nenagh 07:20 07:39 11:20 17:30 17:50 18:00 18:22Cloughjordan 07:45 07:57 11:45 17:55 18:08 18:25 18:40Roscrea 08:15 08:17 12:15 18:25 18:28 18:55 19:01Ballybrophy(arr) 08:35 08:41 12:35 18:45 18:51 19:15 19:24Ballybrophy(dep) 08:45 12:55 18:55 19:27Dublin 09:55 14:00 20:00 20:42


Financial Reconciliation to the Five Year Plan(redacted due to presence of commercial data of Iarnród Éireann)
Appendix 9 August 2016

Further Information:
National Transport Authority
Dún Scéine
Harcourt Lane, Dublin 2
t: +353 1 879 8300
f: +353 1 879 8333
www.nationaltransport.ie
Rail Review 2016 REPORT