rail service performance - agricultural marketing service
TRANSCRIPT

Chap
ter
8
RailService
Performance

277
Chapter 8: Rail Service Performance Rail services are particularly important to agricultural shippers, who move low-value bulk commodities long distances, and who often must depend on rail as the only cost-effective means of reaching their market. Grains and oilseeds, as well as other agricultural products and farm inputs, depend on rail. As discussed in other chapters of this report, rail moves 40–50 percent of grains and oilseeds—up to 95 percent in some corridors (see Chapter 2: Importance of Freight Transportation to Agriculture).
Rail’s share of the grain market has been decreasing, causing concern because rail is the least costly mode of transportation in many cases, and this change in market share increases the burden on highways and the infrastructure serving other modes of transportation.
Railroad service itself has several aspects. It can be viewed as the outcome of capacity, competition, regulatory reform, and private railroad business decisions. It also can be viewed as a tool that a railroad can use in determining price as it strives to maximize its profits. In the current deregulated environment, providing the quality of service required by agriculture remains largely at the discretion of the railroads.
Capacity constraints from 2003 through 2006 and declining rail-to-rail competition have resulted in railroads becoming more selective in accepting traffic. In an effort to maximize profits and efficiency, railroads have eliminated service in some lanes and promoted shuttle train shipments over single car or manifest shipments.* They also promote intermodal hubs in major metropolitan areas such as Chicago, Memphis, Atlanta, Dallas, and New York, and shut down or eliminate service to small intermodal yards in rural areas. Although the Common Carrier Obligation still exists, it is more difficult to enforce when rail capacity is constrained. Furthermore, shippers contend that rail carriers often price traffic they do not want well beyond the value of service, thereby driving unwanted traffic to other modes.
Due to railroad policies, agricultural shippers in rural areas often haul their commodities long distances by truck to reach rail service, resulting in increased transportation costs and wear on rural highways. In addition, many farmers shipping commodities in intermodal containers have lost rail service at local intermodal yards and find it difficult to acquire empty containers. As a result, they are often forced to haul empty containers by truck long distances from urban intermodal yards and then haul the loaded containers back to those urban yards for shipment.
* AAR defines single car movements as one to five carloads. Some railroads define manifest shipments as those
less than 27 railcars.

278
Figure 8-1: An intermodal terminal at the Port of Los Angeles. Railroads promote the use of major intermodal hubs because of their efficiency.
Source: ©Port of Los Angeles
For example, in 2006, cotton shippers in Lubbock, TX, paid nearly $1,100 per container in extra transportation costs. They had to pick up containers in Dallas, load them in Lubbock, and deliver the loaded containers back to Dallas where they could be put on trains to a West Coast destination. The increased cost of trucking due to the lack of rail service hinders the ability of agricultural producers to compete in domestic and international markets (see Chapter 14: Ocean Transportation for more information on ocean and intermodal transportation).
Consequently, although railroads have made great strides in improving their efficiency, many agricultural shippers believe this efficiency has come at the cost of effectiveness in serving the needs of the shipper. Agricultural shippers contend that railroads have become less attentive to their needs as railroad competition has decreased, railroads have grown larger, and rail markets have become more concentrated.
This chapter examines specific concerns of the agricultural industry about the service offered by railroads. It also looks at general service issues, including on-time delivery performance, the value of reliability, closures of service nodes, rail line abandonment, rail car shortages, consumer complaints, and paper barriers.

279
Concerns from the Agricultural Industry A review of many documents (studies, shipper comments in STB proceedings, etc.) dealing with service, capacity, and rates reveals a list of concerns from the agriculture industry, some specific to service in a technical sense and some relating to service policy.
Large versus Small Shippers Allocation of service between smaller and larger shippers may be unduly discriminatory, to the detriment of smaller shippers. Small shippers complain that shuttle-train shippers receive preferential treatment, particularly when the demand is high for empty railcars. Railroads counter that shuttle-trains make more efficient use of assets since they make 2.5 to 3 cycles in the time it takes non-shuttle trains to make 1 cycle. In addition, one railroad states that only 40 percent of its grain car fleet is allocated to shuttle trains, but that those cars handle 60 percent of their grain shipments.
Service Disruptions Agricultural shippers often appear to bear the brunt of rail service disruptions, as in the case of a soybean processor that has to either cut back crush volumes or shut down the plant when a rail disruption occurs. Such plants often operate 24 hours a day and 7 days a week, but cannot operate without rail service. Both cutting back crush volumes and shutting the plant down are expensive to the processor, but a total shutdown is the most onerous, threatening contracts and jeopardizing customers who depend on receiving their product on time. Expensive truck transportation may have to be used to accommodate and keep those customers, but is not always available during the rail service disruption. In addition, some customers who have contracted for delivery by rail are not set up to receive truck shipments. The excessive cost of trucking agricultural products long distances means less risk to the railroad of losing the transportation of agricultural products even in a service disruption.
Many shippers are captive to one railroad; only about 5 percent of grain elevators are served by more than one railroad. Captive shippers claim they receive inadequate service relative to areas where railroads compete for the traffic. Even shippers served by two railroads sometimes complain that the railroad not currently being used refuses to offer service or quote a rate since “it is no longer one of our facilities to serve.”
Studies have shown that agricultural shippers with more limited transportation options are less responsive to rail price changes. This inability to respond to prices becomes especially evident at times of service disruption when service is restored more quickly to those shippers that do have transportation alternatives.

280
De-marketing A common shipper charge against the railroads is that, by favoring the more lucrative long hauls to export terminals, the railroads have effectively de-marketed rail for some crops, some shorter hauls, hauls to markets located on competing lines, and to closer domestic markets. The concept of service to all customers required by the Common Carrier Obligation is strained, even though it remains part of the transportation law.
Miscommunication on Delivery of Empty Railcars Agricultural shippers report ordering several lots of 5–10 empty railcars to be delivered weekly (based on their capacity to load the railcars within loading time limits without being charged demurrage), only to receive all of the empty railcars at one time, affecting internal efficiency and demurrage charges. Some lumber shippers also have stated that they are told empty railcars are not available at critical times, even though market information reveals the railroad has cars of the desired type in storage.
Forced to Truck Transportation Decreased service at local elevators due to abandonment of rail lines or the efficiency-driven push towards shuttle facilities causes grain to be trucked longer distances over State and county highway systems, increasing time of shipment and expense to the shipper. Greater traffic also causes higher maintenance and repair costs on local roads.
Longer Wait Times for Specialty Crops Producers of certain specialty crops, such as dry beans, barley, and peas and lentils, experience longer waits for rail service, possibly because of limited volumes, resulting in truck movements of even longer distances than those for wheat.
Demurrage and Railcar Storage Fees Demurrage, which is a charge for failure to load or unload cars within the time allowed, has risen steadily. In addition, carriers now charge storage fees for empty private cars stored on railroad-owned lines. Third parties own over 60 percent of all railcars due to lack of railroad investment in them, but carriers still assess this storage charge. Because carrier ownership of railcars has decreased, this additional storage charge affects the cost of service provided by the railroads.

281
On-time Delivery Shippers and carriers do not define reliability in the same way. For example, a carrier is obligated to provide service to a shipper upon reasonable request. The statute does not dictate “service reliability” or frequency of service, leaving the carriers to determine what is reasonable and reliable. Service is not guaranteed in this setting.
Data obtained from Argus Media reveals shipper ratings of the on-time performance of Class I railroads and provides a customer service index, both for trains carrying grain.167 The following graphs provide a picture of performance from September 1997 to December 2008. As Figure 8-2 shows, there has been an improvement in on-time arrivals, but with substantial variation. Performance had been increasing until mid-2003, when railroad capacity constraints and personnel shortages due to early retirements began to appear. Consequently, the index fell below 3 in some instances and certainly below the average experience over the time frame. Since the low points in 2003 and 2005, a general improvement in on-time arrivals has been achieved, with arrivals in 2008 matching those of 2002.
Figure 8-2: Average on-time delivery index for all Class I Railroads for grain
Source: Argus Media

282
An index of customer service, also compiled by the Argus Media group and shown in Figure 8-3 indicates that Class I railroads were consistent in customer service over that time period. The index is remarkably stable, around 3.5, with little variation throughout the period. This index, however, may reflect the effectiveness and courtesy of the customer service staff in resolving shipping issues more than rail service policies.
Figure 8-3: Customer service index for Class I Railroads for grain
Source: Argus Media The data are also available for specific railroads. For the sake of comparison, they are presented in railroad pairs from the same regions. In Figure 8-4, BNSF is rated slightly higher than Union Pacific, and both have been rated somewhat higher than the Class I railroad average performance. The personnel and congestion issues mentioned earlier resulted in UP’s lower on-time performance during 2002–2005. UP recovered after 2005 and more closely matches the performance of BNSF.

283
Figure 8-4: Average on-time delivery index for grain—BNSF & UP
Source: Argus Media UP varied more in the customer service index than BNSF, but in the earlier and later years were rated better than BNSF. Figure 8-5: Customer service index for grain—BNSF & UP
Source: Argus Media

284
Comparison of CSXT and Norfolk Southern indicates two railroads with similar performance, both in on-time delivery and customer service indices (see Figures 8-6 and 8-7). The two railroads track each other closely, indicating that market and management issues affect them the same way. In the last two years reported, Norfolk Southern has been rated marginally better than CSXT in on-time performance but slightly lower in customer service. Figure 8-6: Average on-time delivery index for grain – CSXT & Norfolk Southern
Source: Argus Media

285
Figure 8-7: Customer service index for grain—CSXT & Norfolk Southern
Source: Argus Media Comparison of Canadian National with Canadian Pacific shows more variation in customer service than in the analyses above (Figure 8-8). They performed similarly in earlier years but in the four most recent years Canadian Pacific consistently and significantly was rated better than Canadian National. Figure 8-8: Customer service index for grain—CN & CP
Source: Argus Media
286
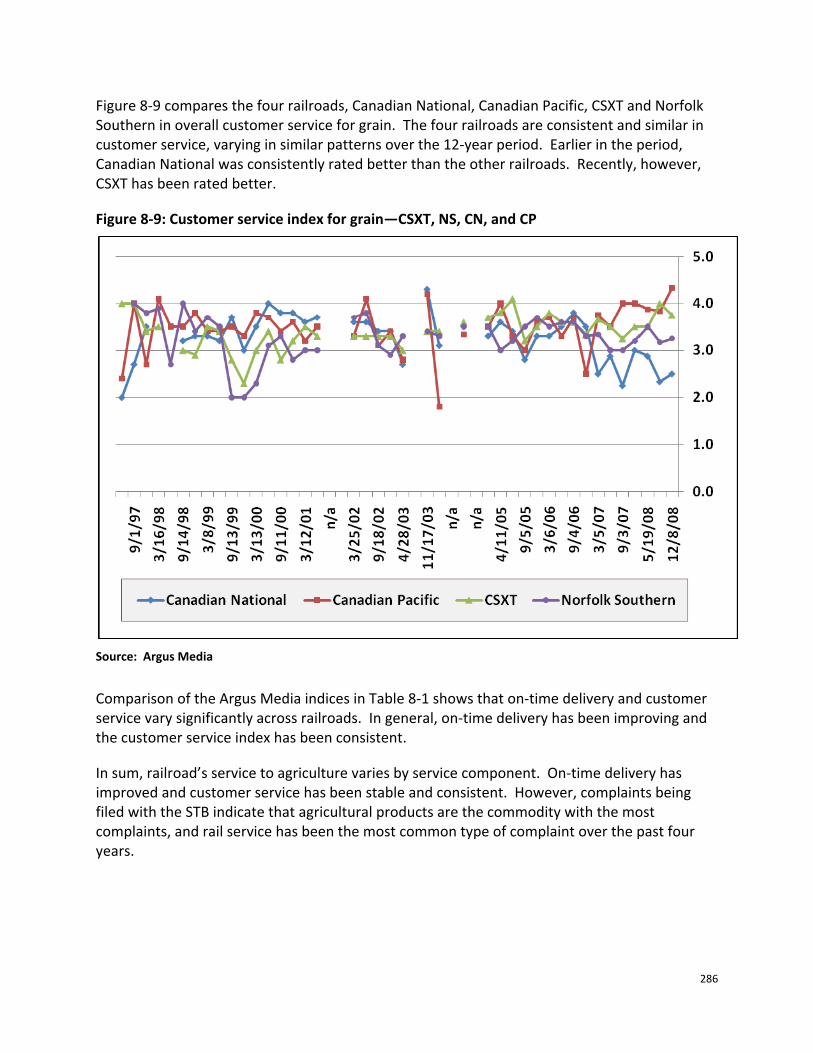
Figure 8-9 compares the four railroads, Canadian National, Canadian Pacific, CSXT and Norfolk Southern in overall customer service for grain. The four railroads are consistent and similar in customer service, varying in similar patterns over the 12-year period. Earlier in the period, Canadian National was consistently rated better than the other railroads. Recently, however, CSXT has been rated better.
Figure 8-9: Customer service index for grain—CSXT, NS, CN, and CP
Source: Argus Media
Comparison of the Argus Media indices in Table 8-1 shows that on-time delivery and customer service vary significantly across railroads. In general, on-time delivery has been improving and the customer service index has been consistent.
In sum, railroad’s service to agriculture varies by service component. On-time delivery has improved and customer service has been stable and consistent. However, complaints being filed with the STB indicate that agricultural products are the commodity with the most complaints, and rail service has been the most common type of complaint over the past four years.

287
Table 8-1: On-time delivery and customer service indices by Class I railroads, June 2, 1997 through December 8, 2008
Source: Argus Media
288
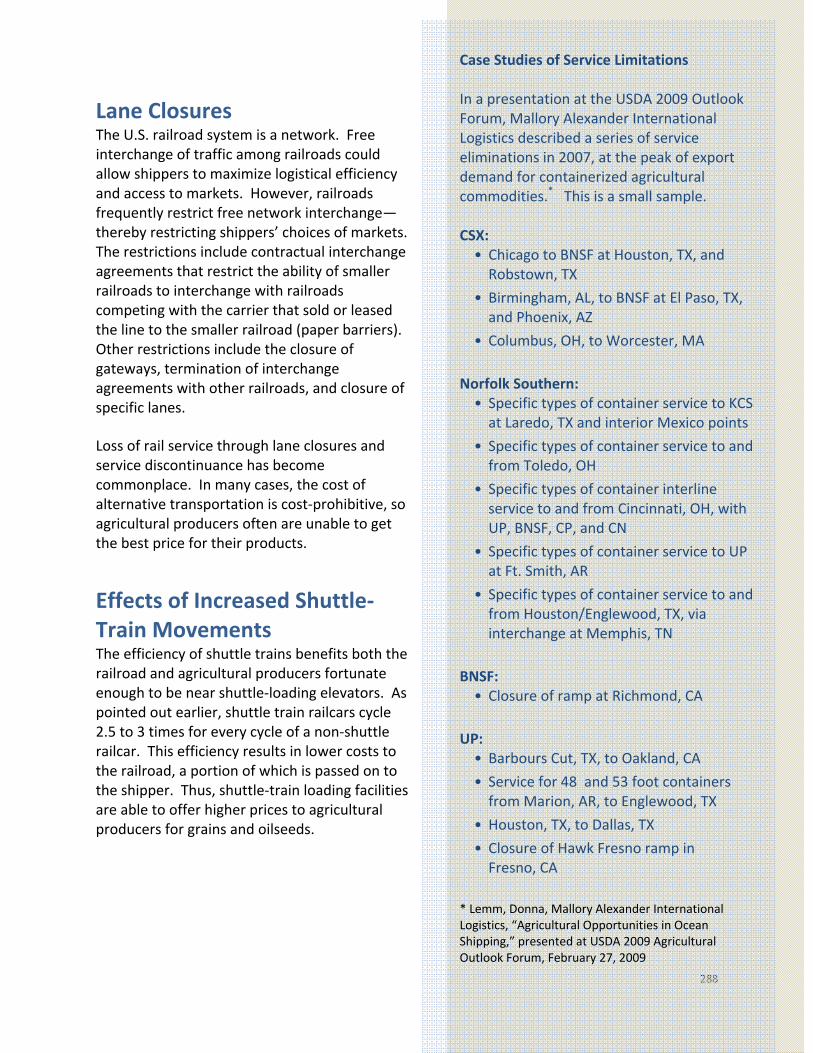
Lane Closures The U.S. railroad system is a network. Free interchange of traffic among railroads could allow shippers to maximize logistical efficiency and access to markets. However, railroads frequently restrict free network interchange—thereby restricting shippers’ choices of markets. The restrictions include contractual interchange agreements that restrict the ability of smaller railroads to interchange with railroads competing with the carrier that sold or leased the line to the smaller railroad (paper barriers). Other restrictions include the closure of gateways, termination of interchange agreements with other railroads, and closure of specific lanes.
Loss of rail service through lane closures and service discontinuance has become commonplace. In many cases, the cost of alternative transportation is cost-prohibitive, so agricultural producers often are unable to get the best price for their products.
Effects of Increased Shuttle-Train Movements The efficiency of shuttle trains benefits both the railroad and agricultural producers fortunate enough to be near shuttle-loading elevators. As pointed out earlier, shuttle train railcars cycle 2.5 to 3 times for every cycle of a non-shuttle railcar. This efficiency results in lower costs to the railroad, a portion of which is passed on to the shipper. Thus, shuttle-train loading facilities are able to offer higher prices to agricultural producers for grains and oilseeds.
Case Studies of Service Limitations In a presentation at the USDA 2009 Outlook Forum, Mallory Alexander International Logistics described a series of service eliminations in 2007, at the peak of export demand for containerized agricultural commodities.* This is a small sample. CSX:
• Chicago to BNSF at Houston, TX, and Robstown, TX
• Birmingham, AL, to BNSF at El Paso, TX, and Phoenix, AZ
• Columbus, OH, to Worcester, MA
Norfolk Southern: • Specific types of container service to KCS
at Laredo, TX and interior Mexico points
• Specific types of container service to and from Toledo, OH
• Specific types of container interline service to and from Cincinnati, OH, with UP, BNSF, CP, and CN
• Specific types of container service to UP at Ft. Smith, AR
• Specific types of container service to and from Houston/Englewood, TX, via interchange at Memphis, TN
BNSF: • Closure of ramp at Richmond, CA
UP: • Barbours Cut, TX, to Oakland, CA
• Service for 48 and 53 foot containers from Marion, AR, to Englewood, TX
• Houston, TX, to Dallas, TX
• Closure of Hawk Fresno ramp in Fresno, CA
* Lemm, Donna, Mallory Alexander International Logistics, “Agricultural Opportunities in Ocean Shipping,” presented at USDA 2009 Agricultural Outlook Forum, February 27, 2009

289
The benefits of shuttle trains, however, are not shared evenly by agricultural producers. Producers located closer to a shuttle-train loading facility benefit because the higher prices received are greater than any increased cost of transporting their commodity longer distances. However, transportation costs for producers distant from shuttle-train service are too high for them to benefit. If the smaller grain elevators those producers normally use go out of business, then they must transport their commodity to a more distant shuttle-train loading elevator. Furthermore, rail service for less-than-shuttle-train shippers frequently is inferior to that received by shuttle shippers.
The movement of grains and oilseeds by unit-train has increased rapidly since 1985. The percentage of grains and oilseeds (by tonnage) moved by unit trains has increased from 34 percent in 1985 to 63 percent in 2006 (see Figure 8-10). Meanwhile, the movement of grains and oilseeds by single-car shipments has decreased from 36 percent in 1985 to only 10 percent in 2006.
Shipment Types for Grain Railroads classify shipment types as single car, multiple car, unit train, and shuttle train.
• Single car movements are one to five carloads that originate at a single origin and go to one or more destinations.
• Multiple car movements are 6 to 49 cars that originate at a single origin and go to one or more destinations.
• Unit trains have more than 50 cars that originate at a single origin and go to a single destination.
• Shuttle trains have more than 75 cars that originate at a single origin and go to a single destination. Shuttle trains differ from unit trains in that the locomotive is never detached from the cars and the cars must be loaded and unloaded within a short time.

290
Figure 8-10: Percentage of grain and oilseeds by type of movement*
Source: Association of American Railroads, Rail Transportation of Grain The loss of local elevators, combined with the growing dominance of shuttle-loading elevators has forced much grain and oilseed traffic to trucks, resulting in increased road wear, and affecting rural counties much more than urban counties; the former have a more limited tax base to pay for road construction and repairs. Although the user fees (fuel taxes, registration and license fees, etc.) assessed on heavy trucks appear at first glance to be adequate, the damage to roads increases exponentially, rather than linearly, with increased weight. The 1997 Federal Highway Cost Allocation Study concluded that user fees collected from 5-axle tractor-semitrailer trucks registered at 80,000 pounds pay for only 90 percent of the costs they impose on the Federal Highway System.168 However, since Federal-aid highways comprise only about 25 percent of the total road infrastructure, they do not include most of the rural road system used by these heavier trucks. Because heavy truck traffic does more damage to rural roads, which were not designed for it, those user fees probably pay for only 60 to 67 percent of the costs tractor-semitrailer trucks impose on the road system.
* Although included as unit trains in the data, shuttle trains differ in that the locomotive is never separated from
the railcars, and they are at least 75 cars long. Shuttle trains also have loading and unloading efficiency requirements.

291
The Shift to Larger Railcars A shift to larger grain cars (C-114 covered hoppers) has occurred quite rapidly. In 1995, 6.8 million tons (4.4 percent) of grain and oilseeds moved in C-114 railcars. By 2007, 86.4 million tons (55.7 percent) moved in the larger railcars (Figures 8-11 and 8-12). The tonnages and percentages hauled in the larger cars peaked in 2002, declined until 2004, then rapidly increased until 2007.
The dip in C-114 tonnages during 2003 and 2004 shown in Figure 8-11 is probably due to rail congestion. Rail congestion affects the quickly turning C-114 cars, which are more often used in shuttle movements, more than C-113 cars, which are used in carload movements.
Figure 8-11: Grain tonnages moved by type of covered hopper car
Source: Surface Transportation Board, Confidential Waybill Samples
Truck Damage to Rural Highways The damage a loaded semitrailer truck does to major rural collector highways is 13.5 times the amount of damage the same truck does to a rural interstate highway. The truck does 21 times the damage to minor collector highways.* *DOT, Federal Highway Administration, 1997 Federal Highway Cost Allocation Study, Washington, DC, 1998.

292
Figure 8-12: Percentage of grain moved by type of covered hopper car
Source: Surface Transportation Board, Confidential Waybill Samples The shift to larger railcars hurts the short line and regional railroads that serve grain producers because they do not have the financial resources to upgrade their rail lines. In 2007, short line and regional railroads operated nearly 46,000 miles of the U.S. rail network and had $3.9 billion in revenue.
The major railroads averaged more than $560,000 in revenue per route mile in 2007, but short line and regional railroads averaged only a little more than $85,000.169 The cost to upgrade the lines of smaller railroads to handle larger railcars varies. In a study completed in 2000, the estimated cost of upgrading railroad tracks and bridges was estimated at $6.8 billion—more than $137,000 per mile.170 A Washington State study estimated that upgrading branch lines to handle heavier railcars would cost $250,000 to $300,000 per mile, exclusive of bridge rehabilitation costs.171 An Iowa report concluded it would cost $250,000 per mile to upgrade branch lines to handle larger railcars.172
Several studies have concluded that the shift to larger railcars will result in abandonment of some route miles by short line railroads.173 The effects of short line abandonment are expected to lower the grain prices received by farmers, raise their transportation costs, lose economic opportunities for rural communities, reduce the local tax base needed to fund basic government services, increase highway traffic accidents due to increased truck traffic, increase road damage costs, and increase energy use and emissions.174 The risk to rail lines in many of the less-populated rural states is high; smaller railroads operate 54 percent of the route miles in South Dakota, 50 percent in Oregon, 43 percent in Michigan, 42 percent in Idaho, 40 percent in North Dakota and Washington, and 37 percent in Montana.175

293
Rail Line Abandonment The bankruptcies of several Class I railroads during the 1970's and Class I railroad abandonment of unprofitable rail lines have resulted in the loss of rail service to many communities. Many of these abandoned lines were purchased or leased by short line and regional railroads, shippers, States, or quasi-governmental entities to preserve rail service. Most of the short line and regional railroads operating on these lines have been successful, but a few have failed.* The ability of shortline railroads to provide service is constrained by the rate agreements and paper barriers affecting local alternatives. Since 1995, an increasing proportion of rail abandonments have been by short line and regional railroads, usually low-traffic branch lines that did not generate enough income to pay for the maintenance of the track. In these cases, the lines did not pay for themselves. In other cases, discounts offered by Class I railroads for unit-train loading or C-114 railcars have contributed to track abandonment. Since most short line and regional railroads do not have the capital needed to upgrade their lines and usually serve small grain elevators unable to load unit trains, these incentives often result in traffic handled by smaller railroads moving to elevators located on the Class I railroad. Rail line abandonment, or rationalization, causes shippers to haul traffic longer distances. Consequently, the abandonment of rail lines and the increased use of shuttle trains result in increased road maintenance costs in rural areas as traffic is shifted to trucks. The damage caused by the loss of rail service and shuttle-train shipments affects rural counties more than urban counties because they have fewer residents to pay for road upkeep. Studies undertaken by Kansas State University and the University of Iowa indicate that in these States, State investment in rail branch lines may be a lower-cost alternative to improving local roads.176 Equipping rail branch lines and country elevators to handle larger quantities of grains and
* Short line railroads include line haul railroads as well as switching and terminal railroads. Line haul railroads may
be local or regional in size.
Agricultural States Lost the Most Rail Mileage The route miles operated by all railroads in the United States have decreased from 211,925 in 1965 to 140,695 in 2007, a drop of nearly 34 percent.* Many of the Great Plains and Midwest States have lost a much larger proportion of their railroad networks. The States that lost the most rail service between 1965 and 1997 are Iowa (49 percent), Minnesota (40 percent), and South Dakota (46 percent). A third of the rail networks in Missouri, Montana, and Nebraska have disappeared since 1965, Kansas and Illinois have each lost 30 percent, and North Dakota has lost 20 percent of its network.† All these States are major agricultural producers. *AAR, Railroad Facts, various years. †Tolliver, Denver, presentation at the National Agricultural Transportation Summit, Kansas City, MO, July 27-28, 1998.

294
heavier C-114 cars can give farmers an economically attractive alternative to trucking grain long distances, and can produce sufficient volumes of rail traffic to support the operation of shuttle trains. Due to the high costs of maintaining light-duty asphalt roads, rural counties facing such large-scale diversions of rail grain to trucks will likely be forced to allow many roads to revert to gravel.
Paper Barriers Since the Staggers Rail Act of 1980, large railroads have reduced the size of their networks, often by selling or leasing unprofitable or marginally profitable lines. Many of these lines were sold or leased to small, newly created, short line or regional railroads that could operate them profitably in circumstances where the larger railroads could not. These line sales or leases have preserved rail service, especially in rural areas, and have kept lines from being abandoned, benefiting both the communities and the shippers. Short line and regional railroads now operate nearly 30 percent of the national railroad network and originate about 25 percent of the carloads.
While it is generally agreed that the emergence of smaller railroads to fill the void left from rail abandonment has been a positive development, shippers have raised concerns about the interchange commitments, or paper barriers, included in many line sale and lease contracts. They question whether such agreements serve the public interest, or if they unduly restrict trade, keeping rates higher through restrictions on competition. Although these interchange commitments have been agreed upon by the smaller railroads, typically as part of the sale or lease of a branch line to a newly formed railroad company, they restrict the flow of interstate commerce and reduce the benefits arising from the rail network as a whole. Railroads are a network industry; rail carriers not only compete with, but also complement, one another. Unnecessary restrictions on interchange may be in the interests of a railroad, but are not in the interest of the network as a whole.
Case Studies of Road Maintenance Cost Increases When Ottawa County, KS, with a population of only 6,000, lost rail service, the county’s annual road maintenance bill increased from $1 million to nearly $7 million.* Similarly, it will cost Harper County, KS, which has a population of 6,400, $27 million to rebuild the county’s roads and bridges to a standard that will withstand the increased truck traffic caused by the loss of rail service in 1997.† * Baccus, Steve, “Economic Future of Rail Dependent Industries Under Status Quo Rail Policies,” presentation at the 2nd Annual Rail Customer Forum, Washington, DC, March 1, 2000. † Griekspoor, Phyllis Jacobs, “Rural Roads Suffer When Trains Go Away,” The Wichita Eagle, Wichita, KS, July 30, 2000.

295
A paper barrier typically prevents a newly formed short line railroad from interchanging traffic with a railroad that competes with the larger railroad that is selling or leasing the line to the short line railroad. In Figure 8-13 below, because of a paper barrier, railroad 1 is either prohibited from interchanging traffic with railroad 3 or is penalized for doing so. The paper barrier is between railroad 1 and railroad 2.
Figure 8-13: Schematic of a paper barrier
Source: Government Accountability Office Paper barriers that limit the ability to interchange traffic with other railroads restrict the access of shippers and producers to markets and rates. Limited market access interferes with the ability of agricultural shippers to obtain the best price for their products and increases their transportation costs, resulting in reduced income for farmers and damage to the economic well-being of industries and communities. Restrictions to market access also result in inefficient transportation when distant producers serve nearby markets.
Since 1980, many rail lines were sold or leased at a low price that was based on the inclusion of interchange commitments. The low selling price was required because most independent small railroads were under-capitalized and unable to finance the line acquisition at market value. Small independent railroads often were able to borrow only the salvage value of a rail line. Class I railroads had a choice of selling at less than the market value, but with interchange commitments to recover whatever remaining value they could extract from the sale or lease, or abandoning these lines.
It appears to some shippers, however, that what began as a reasonable mechanism for small railroads to acquire divested rail lines has evolved into restraints on competition that would be prohibited by antitrust law except for the exemption gained by STB approval of the contract. Without an exemption, paper barriers would be subject to the ancillary restraints doctrine

296
under the antitrust laws, which allows post-sale restraints only if they are reasonable in scope and duration. Such restraints must be reasonable, no broader than necessary, and have public benefits that outweigh the anticompetitive effects.
When the STB initiated a review of railroad access and competition issues in 1998, shippers discussed the conflict between the public interests and the anti-competitive nature of some of these paper barriers. As a result of the STB review, the Association of American Railroads (AAR) and the American Short Line and Regional Railroad Association executed a Railroad Industry Agreement (RIA) that addressed paper barriers and other issues. On March 21, 2005, the Western Coal Traffic League renewed its 1998 request for a rulemaking on the paper barrier issue because it asserted that the RIA did not adequately deal with these barriers.
On October 29, 2007, STB ruled that the propriety of such paper barriers would be best considered on an individual, case-by-case basis. In addition, STB proposed new disclosure requirements to assure regulatory scrutiny of such agreements in connection with future line sales or leases. Finally, STB proposed expedited discovery procedures for obtaining a copy of an existing paper barrier as soon as a regulatory challenge is brought.
Shippers contend that some existing paper barriers appear to be anti-competitive because they limit market access for shippers, restrict rail-to-rail competition, and are unreasonable restraints to trade. Shippers have indicated that some of the unreasonable aspects include:
• Excessive penalties for interchanging with a competing railroad.
• Lack of shipper involvement in negotiating the terms of the barriers to interchange and a lack of shipper recourse.
• Unreasonably long terms for contracts.
• Line values set unreasonably high.
Excessive Penalties for Interchanging with a Competing Railroad Shippers argue that many paper barriers appear to fail the reasonableness test because of excessive penalties for interchange with a competing railroad. In the 2007 decision referenced above, the STB stated that the revenue stream resulting from a paper barrier should be no more than the carrier would have received had it not divested or leased the rail facilities in question.177
Prior court rulings for other industries have allowed contractual barriers designed to protect the reasonable value of the assets being leased or sold, but not be so excessive they could be construed as a restraint of trade. Court rulings for other industries also have required that the societal benefits exceed the societal costs of the anti-competitive practices.
An example of a paper barrier that has been challenged is that between UP and Missouri & Northern Arkansas Railroad (M&NA). Entergy Arkansas, Inc. challenged this paper barrier as overcompensating Union Pacific for the pre-transaction value of the line. The UP/M&NA interchange agreement imposes up to a $90 million annual rental obligation (the amount is

297
adjusted annually for inflation) should M&NA interchange nearly all of its traffic with UP’s competitors. Table 8-2 provides the details of the annual rent due from M&NA:178 Table 8-2: Summary of UP/M&NA lease contract
Percentage of Total Traffic Interchanged with Union Pacific
Annual Base Rent due Union Pacific (adjusted annually for inflation)
100 – 95 percent $ -0-
94 – 85 percent $10,000,000
84 – 65 percent $20,000,000
64 – 55 percent $30,000,000
54 – 45 percent $40,000,000
. . . . . .
0 – 4 percent $90,000,000
Source: Entergy Arkansas, Inc. complaint to the STB M&NA is a regional railroad with revenues between $28.8 and $359.6 million.179* Clearly, even a $10 million annual lease payment, based on a loss of only up to 15 percent of the traffic by the UP, could exceed the entire net profit of M&NA. Entergy Arkansas, Inc. and other shippers believe such a lease payment schedule is excessive and appears to be designed to inhibit interchange with competing railroads. At this time, there has been no ruling by the STB.
Lack of Shipper Involvement and Recourse Shippers are troubled by their lack of involvement in the negotiation of these interchange commitments. Many of the terms of sale or lease tie a shipper’s traffic to the railroad that sold or leased the line, without any input or consideration for the shippers’ interests.
Since these interchange commitments are part of confidential contracts, shippers often are not aware of their existence until they attempt to ship products using the connection the smaller railroad has to a competing railroad. Even then, shippers generally cannot gain access to the interchange commitments because they are not publicly available at the STB or elsewhere. Shippers discover when they attempt to ship on a competing rail line that the penalties in the paper barrier make it impossible. Due to the public interest of shippers and affected communities, shippers believe the contents of sale and lease agreements containing these barriers should be made a matter of public record as soon as possible.
Railroads contend that shippers do not need separate standing† to challenge interchange commitments because their interests are fully represented by the short lines serving them. Shippers contend that their interests are not represented for existing traffic because the short * This level of revenue is part of the definition of a regional railroad. † Separate standing is the right of a person to initiate a legal action challenging the terms of a paper barrier.

298
line would earn its revenues whether it routed through the seller or through one of its competitors. For most traffic, the short line railroad has no incentive to act in the interests of the shipper regarding paper barriers. Even for new traffic, the short line railroad may perceive its interests as aligned with those of the larger railroad with which it has an agreement. Consequently, many shippers do not perceive the short lines as “fully representing” their interests. In fact, in many cases the short line railroad gives the larger railroad—the seller or lessor of the line—the right to establish a joint rail rate for itself and the short line railroad. In that instance, the shippers’ interests are not protected by either railroad.
Unreasonably Long Contract Terms Many line sale and lease agreements contain paper barriers that continue into perpetuity or for extremely long terms. Courts have ruled that constraints to competition that endure for long periods of time are unreasonable. Consequently, shippers believe that, if paper barriers are permitted, the term of paper barriers should be limited to the minimum duration necessary to recover the fair market value of the line.
Shippers assert that, although the public interest may tolerate temporary restrictions to a buyer’s ability to compete freely, these restrictions should not be tolerated indefinitely. If allowed to continue indefinitely, shippers contend the harm to competition would soon outweigh the public benefits of preserving rail service. As long as these competitive constraints exist, agricultural shippers maintain they cause artificially high rail rates that reduce the income of agricultural producers.
Unreasonable Line Values Many shippers believe the selling or leasing railroad should be allowed to recover no more than the fair market value of the lines. They believe this value should not include the value of traffic that will travel over the selling railroad’s lines after the short line tenders traffic to the selling or leasing railroad. The value of the traffic moving over the selling railroad’s lines should not be included because the selling or leasing railroad would have sought STB approval to abandon the line if the line was unprofitable or not sufficiently profitable to continue operating it.
The STB, in setting the fair market value of the abandoned line, would presumably not include the value of the traffic that might move over the line. The railroad abandoning the line would not know when seeking approval if another railroad would purchase the line and provide rail service. Further, shippers also believe railroads should not be allowed to inflate this value to tie traffic to the selling railroad. When the fair market value of the line is inflated, shippers and producers pay tariff rates higher than warranted.
Railroad Industry Position The railroad industry states that the competitive position of shippers is not changed by an interchange agreement because there is nothing in the agreement that would cause a shipper on the smaller railroad to pay higher rates or receive poorer service than if they were served by

299
the original railroad. The railroad industry states that, if anything, the shippers will receive better service because the smaller railroad has more flexibility and closer ties to the community than the original railroad.
In addition, railroads believe that if interchange agreements were banned, many sale or lease transactions that have preserved service would not have taken place. They argue the buying railroad would often be unable to afford the line if it had to pay more. In addition, the deal might no longer make sense for the selling railroad, since it would no longer receive adequate compensation. If the sale or lease did not occur, the rail lines would become even more marginalized as their owners concentrated their resources on more viable and lucrative lines. They argue that many of these lines would ultimately be abandoned.
Railroads also argue that if interchange commitments are banned retroactively, the original transaction would have to be renegotiated so that the selling railroad could receive a higher cash payment to compensate for the loss of the paper barrier. 180
Consumer Complaints One way to understand shipper problems is to examine the consumer complaints filed with the STB. The following tables show four years of complaints, organized by category of complaint and by the commodity identified in the complaints.
More detail is available for 2008 than for previous years. If the technical and information assistance requests are eliminated, complaints about abandonment, real estate, rail-to-trails* and motor carrier service problems, in that order, are most common. The commodity most often involved was agricultural products, followed by chemicals. In 2007, less detail is available but rail service and rates are by far the most common complaints. Agricultural products, chemicals, and minerals—in that order—are the commodities cited. In 2006, complaints about rail service, then rates, are most common. Paper products lead the commodities, followed by agricultural products and chemicals. In 2005, rail service accounted for almost 50 percent of the complaints, followed by rates, as in most years. Paper and agricultural products were tied for the most common commodities, followed by metals. Over the 4 years from 2005 through 2008, rail service was consistently the primary source of complaints. Similarly, agricultural products were the most commonly cited commodity, although paper products shippers also had many complaints in the first two years of the time period.
* Abandoned rail lines converted by STB to biking and hiking trails for public use.

300
Table 8-3: Complaint cases by category and region, 2008
Category All
Regions* Northeast South Midwest West
Not Specified
Abandonment/Loss of Service 98 13 7 22 18 38Acquisition and Operation Exemption 1 0 0 0 0 1Amtrak Issue 3 2 0 0 1 0Arrange Meeting 1 0 0 0 0 1Blocked Crossings 17 0 5 2 7 3Car Repair 1 0 1 0 0 0Car Supply 4 0 0 1 0 3Claims 8 1 1 2 2 2Common Carrier Obligation 4 1 0 0 0 3Competition Issues 5 0 2 1 1 1Demurrage 3 0 0 0 0 3Demurrage Charges 5 0 2 2 1 0Denial of Rail Service 5 0 3 2 0 0Embargo 18 3 6 2 7 0Environmental Issues 7 0 0 2 2 3Fuel Surcharge 1 1 0 0 0 0Grade Crossing Issues 6 0 1 4 1 0Grade Crossing Maintenance 3 0 1 2 0 0Household Movers 8 0 2 0 1 5Idling Engines/Parked Trains 1 1 0 0 0 0Information Request 193 28 14 25 17 109Information-Economic Data 9 0 0 0 0 9Issues on Notes Feedback 1 0 0 0 0 1Labor Issues 5 0 0 2 0 3Locomotive Issue 1 0 0 0 1 0Motor Carriers (trucks) 24 3 3 2 3 13Noise-Airhorn, etc 7 4 0 1 1 1Noise-Airhorn, Safety, etc 10 2 1 2 2 3Paper Barriers 1 0 0 0 0 1Preemption 9 1 0 3 2 3Rail Service 10 1 1 3 2 3Railroad Credit Terms 2 0 0 0 2 0Rails to Trails 32 5 0 13 2 12Rate Levels/Increases 27 2 1 7 4 13Real Estate Matter 39 3 5 4 9 18Service Problems 25 2 3 9 1 9STB Jurisdictional Question 24 2 4 4 3 11STB Procedural Assistance 205 9 3 140 20 33STB Webpage/Downloading Assist. 26 0 1 1 4 20Water Carrier 6 2 0 0 1 3Other 5 3 0 1 1 0Total 867 89 67 259 116 336
*U.S. Census Regions. See <http://www.census.gov/geo/www/us_regdiv.pdf> Source: Surface Transportation Board.

301
Table 8-4: Complaint cases by category and region, 2006
*U.S. Census Regions. See <http://www.census.gov/geo/www/us_regdiv.pdf> Source: Surface Transportation Board. Table 8-5: Complaint cases by category and region, 2005
Category All
Regions* Northeast South Midwest West
Not Specified
Car Supply 9 1 2 2 4
Demurrage 3 1 2
Fuel Surcharges 2 1 1
Information Request 27 2 6 1 3 15
Rail Service 56 6 17 22 10 1
Rates 16 2 3 7 3 1
Other 8 1 2 4 1
Total 121 12 32 37 23 17
*U.S. Census Regions. See <http://www.census.gov/geo/www/us_regdiv.pdf> Source: Surface Transportation Board.
Category All
Regions* Northeast South Midwest West
Not Specified
Car Supply 5 1 1 3 5
Demurrage 7 1 1 2 3
Fuel Surcharges 2 1 1 2
Information Request 14 1 3 2 2 14
Rail Service 39 1 12 15 10 1
Rates 19 1 5 7 4 19
Other 14 2 4 3 2 3
Total 100 6 27 29 23 15

302
Table 8-6: Complaint cases by commodity group, 2005, 2006, and 2008
Commodity Group Number per Year
2005 2006 2008
Aggregates 3
Agricultural Products 17 13 23
Automobile 2
Chemicals 5 10 21
Coal 2 1 5
Construction Debris 2
Forest Products 17 17 8
Hazardous Waste/Radioactive Waste 1
High/Wide Loads 1
Industrial Products 3
Intermodal 2 5 5
Metals and Minerals 11 9 4
Municipal Waste 1
N/A 711
Other 29
TIH 4
Total* 121* 100* 867*
*In many cases, the commodity is not specified, so the total may not equal the total for the quarter. Source: Surface Transportation Board.
Conclusions Rail is the least costly mode of transportation for many farmers, but railroads are carrying a smaller share of America’s grain than they used to, shifting the burden to trucks. The heavy truck traffic places an extra burden on rural roads. When met with a shortage of capacity from 2003 through 2006, railroads began to favor the more profitable longer trains and longer hauls. They increased the number of unit and shuttle trains, favoring them over carload shipments, resulting in agricultural shippers hauling their goods farther by truck to reach the nearest rail service. In effect, shippers are now consolidating loads for railroads, a job railroads used to do themselves.

303
There has been a general trend of slightly improving on-time arrivals, but with substantial variation from period to period. Performance had been increasing for the Class I railroads until mid-2003, when railroad capacity constraints began to appear and personnel shortages due to early retirements became evident. In many cases, railroads restrict free network interchange, restricting shipper choices of markets, in an effort to maximize their efficiency and profits. The restrictions to free interchange in the railway network include contractual interchange agreements (paper barriers) that restrict the ability of smaller railroads to interchange with railroads competing with the carrier that sold or leased the line to the smaller railroad. Other railroad restrictions to free interchange include the closure of gateways, termination of interchange agreements with other railroads, and closure of specific lanes. Loss of rail service through lane closures and service discontinuance has become a common occurrence. In many cases, the cost of alternative transportation to these specific markets is prohibitively costly. As these closures and service discontinuances restrict the ability of agricultural shippers to ship to markets, agricultural producers often are unable to get the best price for their products due to increased transportation and logistical costs. In the last few years, railroads have begun using larger grain cars (C-114 covered hoppers). In 1995, only 4.4 percent of grain and oilseeds moved in C-114 railcars, but by 2007, they moved 55.7 percent. While efficient for the line haul segment of the move, several studies have concluded that the shift to larger railcars will result in abandonment of some route miles by short line railroads. This means farmers will receive lower grain prices and pay higher transportation costs. Rural communities will lose economic opportunities, highway traffic accidents will increase due to increased truck traffic, road maintenance costs will rise, and energy use and emissions will increase. The risk to the rail lines in many of the less populated rural States is high; smaller railroads operate 54 percent of the route miles in South Dakota, 50 percent in Oregon, 43 percent in Michigan, 42 percent in Idaho, 40 percent in North Dakota and Washington, and 37 percent in Montana. The net effect of these restrictions is that farmers must truck their commodities farther to reach rail lines. This not only increases costs for farmers, but increases the upkeep on rural roads, which affects rural counties more than urban counties because they have fewer residents to pay for the increased road damages. From 2005 through 2008, concerns about rail service were consistently the largest source of complaints to the STB, and agricultural products were the category most commonly complained about.

304