railroad valley playa for use in vicarious calibration of...
TRANSCRIPT

Railroad Valley Playa for use invicarious calibration of large
footprint sensorsK. Thome, J. Czapla-Myers, S. Biggar
Remote Sensing Group Optical Sciences Center
University of Arizona

P Background!Reflectance-based vicarious calibration!Test sites
P Results from Terra, EO-1, and Landsat
P Issues with current methodology!Temporal sampling!Noise/errors!Railroad Valley test site
P Calibration without ground-personnel!LED radiometers and atmospheric monitoring!Results from early measurements
P Vicarious calibration test site modeling
P Intercomparison possibilities
P Conclusions and future work
Introduction

Reflectance-based ApproachCombine surface reflectance and atmospheric
transmittance data to predict at-sensor radiance
RadiativeTransfer Code

RSG Test Sites
Rely on dry lakesand gypsum saltflats in California,
Nevada, andNew Mexico
(USA)
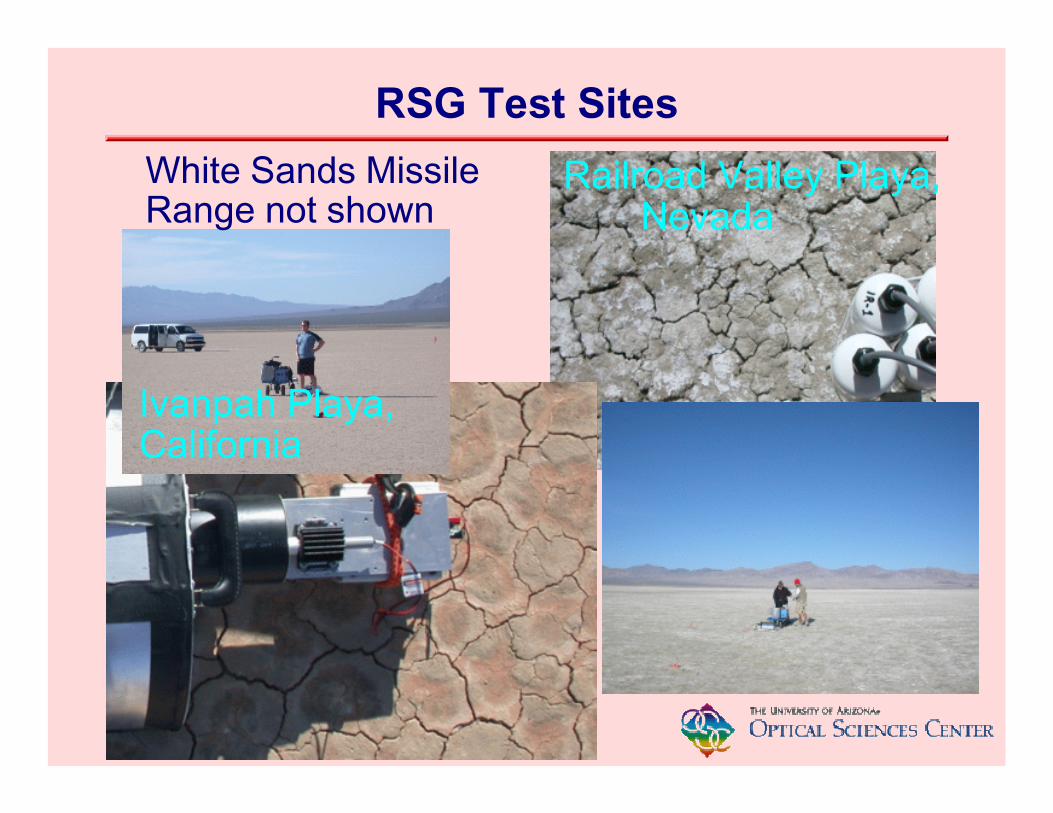
RSG Test Sites
Railroad Valley Playa,Nevada
Ivanpah Playa, California
White Sands MissileRange not shown

Landsat-7 results
ETM+ work indicates that there has not been significantdegradation of the sensor so use average and standard
deviation of difference in at-sensor radiance
Band 1 Band 2 Band 3 Band 4 Band 5 Band 7-9
-6
-3
0
3
6

P Sample a 1-km by 1-km area
P Takes approximately 1 hour to collect data
Large-footprint approachApplication to large-footprint sensors requires a different
surface reflectance sampling approach

Terra MODIS resultsTerra MODIS is also well-behaved with no significant
degradation at Level 1B
412 nm469 555 645 858 905 1240 1640 2130
-10
-5
0
5
10
15
20Terra MODIS

Landsat 7 and Terra Results
0.4 0.5 0.6 0.7 0.8 0.9
Wavelength (micrometers)
-9-6-30369
ASTERMISRMODISETM+
1.2 1.4 1.6 1.8 2 2.2 2.4
Wavelength (micrometers)
-9-6-30369
ASTERMISRMODISETM+

Results with EO-1
412 nm 469 555 645 858 905
-15
-10
-5
0
5
10
15Terra MODIS ETM+
ASTER ALI
Hyperion MISR
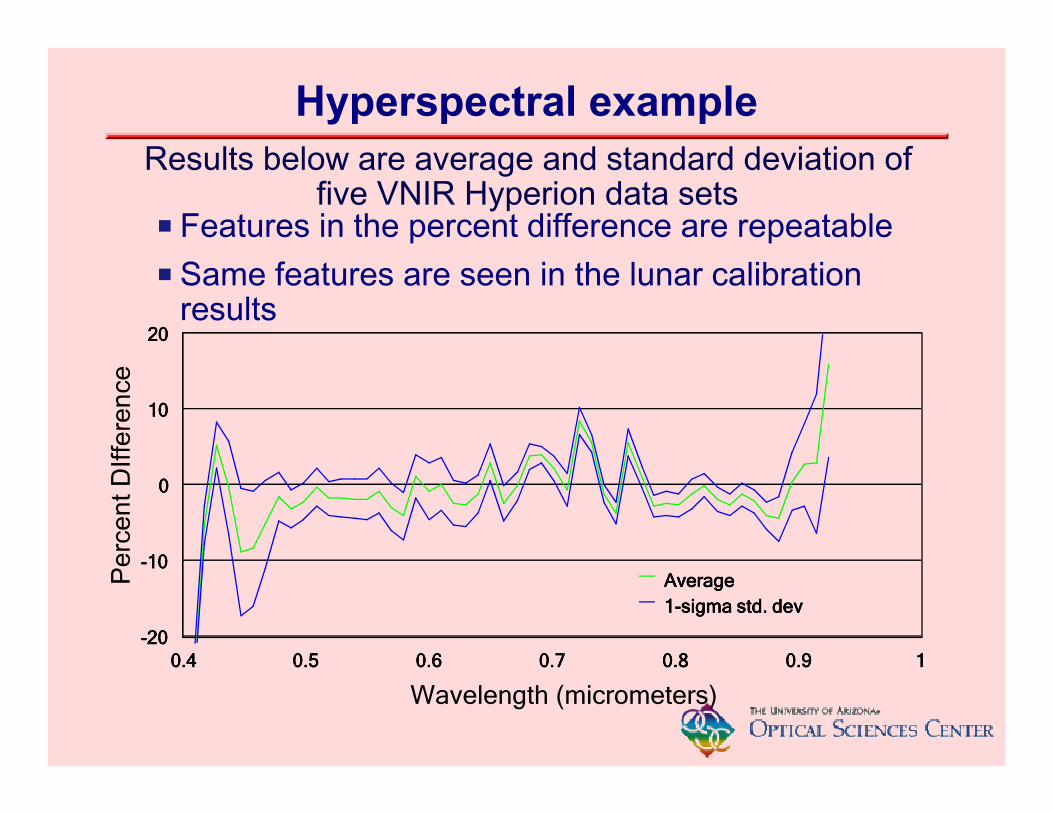
P Features in the percent difference are repeatable
P Same features are seen in the lunar calibrationresults
Hyperspectral exampleResults below are average and standard deviation of
five VNIR Hyperion data sets
0.40.40.40.4 0.50.50.50.5 0.60.60.60.6 0.70.70.70.7 0.80.80.80.8 0.90.90.90.9 1111
Wavelength (micrometers)
-20-20-20-20
-10-10-10-10
0000
11110000
22220000
AverageAverageAverageAverage1-sigma1-sigma1-sigma1-sigma std.std.std.std. devdevdevdev

P Examination of ETM+ results does not show anobvious cause
P Scatter most likely “errors” in surface reflectance
P Outliers due to anomalous atmospheres
Noise - outlier data sets One major drawback of the reflectance-based approach
are outlier data sets
0 500 1000 1500 2000
Days since launch
1.4
1.45
1.5
1.55
1.6
PreflightAverageGround-reference

P All data from RRVPlaya
P Mostly coincidentdates for plotshown here
P Standarddeviations slightlydifferent for two
P Note the outlierfrom thereflectance-basedapproach
Noise, MODIS-ASTER exampleRecent work has used MODIS as a reference for an
intercomparison with ASTER
600 800 1000 1200 1400
Days Since Launch
0.7
0.75
0.8
0.85
Reflectance-basedMODIS intercomparison

Temporal sampling issuesRailroad Valley
Playa is in centralNevada about 13hours by car fromthe University of
Arizona 0 500 1000 1500Days since Jan. 1, 2000
-10
-5
0
5
10Terra

P Require personnel on the ground at sensor overpass!Expensive in personnel and travel!Reduces opportunities for calibration attempts
P Currently make approximately one trip per month!Cannot get all sensors on all trips!Weather prevents success in some cases!Fortunate to obtain 8-10 data sets per sensor per
year
P These 8-10 data sets may not be sufficient for trendanalysis
P Goal - increase the number of data sets per sensorwithout sacrificing accuracy
Improved temporal samplingPoor temporal sampling has always been an issue with
the reflectance-based method

Ground-based instrumentationUse the same methodology but replace instruments
with sensors that do not require personnel to be present
RadiativeTransfer Code RadiativeTransfer Code

P Sunphotometer provides atmospheric optical depths anduses sky radiance data to produce aerosol size and type
P Data are available via the Web from Goddard SpaceFlight Center’s Aeronet
P Meteorological station provides ancillary data includingrainfall
Atmospheric dataAtmospheric measurements rely on a meteorological
station and automated Cimel sunphotometer

P Test sites used for vicariouscalibration are typically bright
P Uncertainties in the surfacereflectance cause the samelevel of uncertainty in thevicarious results
P Could assume the surface isinvariant
P NOT a good assumption at Railroad Valley
Surface reflectanceMost critical measurement is the
surface reflectance

P Benefit of combining spectral selection and detector!Reduces cost! Improves spectral and radiometric stability over time!Others have shown this stability to be much better
than 1% over periods in excess of 10 years
P Have a range of wavelengths available!Focus is currently on the visible and near infrared!Detector wavelength shifts relative to the emitting
wavelength
LED radiometersMonitor surface reflectance via a set of robust,
inexpensive radiometers relying on light emitting diodes(LEDs) operating as detectors

LED radiometersCurrent results are based on a simple design with a
four-channel approach

P The spectral bands are green, red, and NIR!Bands are similar to those of several earth-
imaging sensors!Bands are wider
than those typically used in imagers
P Spectral response varies somewhat from LED to LED but the wider bands help mitigate this
LED radiometers - Spectral responseOf the four channels, three survived assembly and early
deployment to Railroad Valley
0.0
0.2
0.4
0.6
0.8
1.0
400 500 600 700 800 900 1000
Wavelength (nm)
Green Red NIR

LED radiometer - reflectance retrieval
Output of LED radiometerdepends on the incidentsun angle, atmosphericconditions, and response
Correcting for these effectsallows the reflectance to befound
0.0
0.3
0.6
0.9
78.5 79.5 80.5
Day of Year (UTC)
00.10.20.30.40.50.60.7
78.5 79.5 80.5
Day of Year (UTC)

LED radiometer - resultsLED results are used to determine a hyperspectral
surface reflectance for the vicarious calibration
0.35
0.40
0.45
0.50
500 600 700 800 900
Wavelength (nm)
LED Radiometer 1
LED Radiometer 2
Fitted hyperspectralreflectance
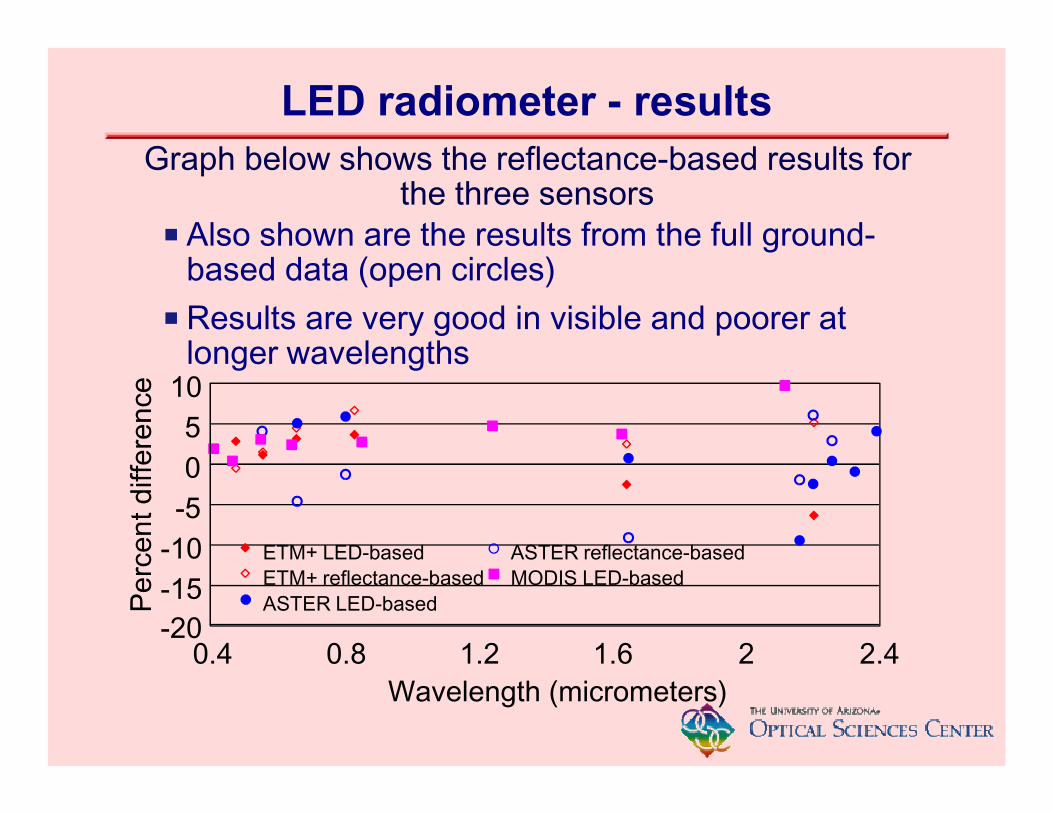
P Also shown are the results from the full ground-based data (open circles)
P Results are very good in visible and poorer atlonger wavelengths
LED radiometer - resultsGraph below shows the reflectance-based results for
the three sensors
0.4 0.8 1.2 1.6 2 2.4Wavelength (micrometers)
-20-15-10-505
10
ETM+ LED-basedETM+ reflectance-basedASTER LED-based
ASTER reflectance-basedMODIS LED-based

P This model will provide at-sensor radiance for a givensun-sensor geometry!Hyperspectral at 10-nm intervals from 350-2500 nm!30-m spatial resolution
P Combination of ground-based LED and satelliteimagery!Rainfall data give information regarding sharp
changes in reflectance!ETM+ data (or similar system) give spatial information!MODIS can give directional reflectance data along
with the LED data!Cimel provides atmospheric data
Model-based playaOne goal of this work is to develop a model of the
Railroad Valley Playa

P BRDF effects
P Spectral variabilityacross the playa
P Spatial variabilityover time
P Anomalousbehavior of playa
P Fortunately, all ofthese are also ofinterest to thereflectance-basedmeasurements
Model-based approach
Numerous issues must be addressed for this to work

P Clearly not invariant
P Note large changein middle row
P Last image takenone month aftersnow melt
Model-basedapproach
ASTER Band 3data from RRV
2002-06-15 2003-02-09
2003-06-20 2003-07-04 2003-07-06 2003-07-22
2003-08-23 2003-11-11 2004-03-18
2001-01-05

P Note that this shows that repeatability/precisionand accuracy are not identical
P Many of the cases shown have not overlappingtime periods
Reflectance-based intercomparisonsResampling of Landsat ETM+ results show that as fewas five data sets can provide a repeatable estimate of
sensor calibration
All 1 2 3 4 5 6 7 8 9 10
-6
-3
0
3
6

Intercomparison - MODISReflectance-based method allows for direct comparison
of results from two sensors without concurrent views
412 nm469 555 645 858 905 1240 1640 2130
-10
-5
0
5
10
15
20Terra MODIS Aqua MODIS
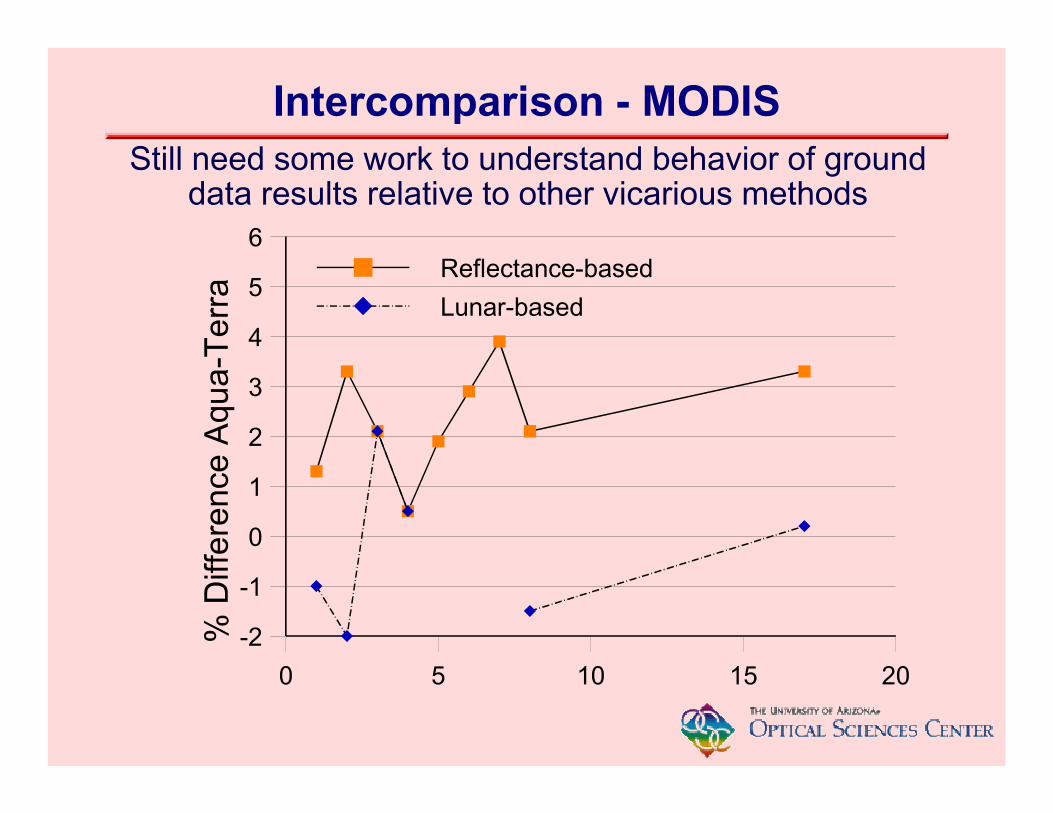
Intercomparison - MODISStill need some work to understand behavior of ground
data results relative to other vicarious methods
0 5 10 15 20
-2
-1
0
1
2
3
4
5
6Reflectance-based
Lunar-based

P Better understandvicarious approach (effectof atmospheric models)
P Self-consistency within theUofA laboratory andconsistency with fieldmeasurements!Same panels are used in
field and for radiancecalibration
!Multiple calibrationapproaches forlaboratory radiometer
Future IntercomparisonsIntercomparisons between laboratory radiometers
calibrated to radiance and model-predicted radiancesare currently being done

P Vicarious methods such as reflectance-based methodare now more repeatable
P Vicarious do not require coincident collections (evenallows gaps in the data record)!Does require consistent application of single method!Best when there is consistent sensor collection
methodologies (view angles, protocols)
P Results shown here showed some small biasesbetween several sensors!Biases could be real!Shows need for multiple intercomparison methods! In the case of large biases a decision must be made
regarding the “right” answer
Conclusions - IntercomparisonsVicarious methods can be used for sensor
intercomparisons

P ETM+ results between the two approaches agreedto better than 3% in the VNIR!ASTER did not have as good agreement -
possibly due to spatial atmospheric effects!SWIR results poorer due to assumptions used to
obtain the hyperspectral reflectance
P Two single point LED values gave good results forMODIS! In reality, this was somewhat fortuitous!Area of Railroad Valley was very uniform on this
date in the region of the LEDs!Future work will deploy more radiometers to
assess the spatial uniformity
Conclusions - LED resultsLED and Cimel results gave similar accuracies as the
full up ground-based measurements
P Precision of vicarious methods is improving!Repeatability used here as a surrogate for precision!Becoming more difficult to determine error sources
and how to correct
P Links/traceability to laboratory standards are needed!Solar-based calibration approaches!Laboratory-quality field radiometers
P Temporal sampling issues!What is the optimal sampling frequency?! “Clumping” of vicarious results may be preferred
P Vicarious methods should be considered whenplanning preflight characterizations!Size of source!Spectral nature
General Conclusions and Comments