rainbolt relationship between eating out and obesity compared between urban and rural counties in...
TRANSCRIPT
Relationship between eating out and obesity compared between urban and rural counties in the Southern Community Cohort Study – Victoria Rainbolt, 2011 Page 1
Relationship between eating out and obesity compared between urban and
rural counties in the Southern Community Cohort Study
Victoria Rainbolt; University of St Andrews student, International Epidemiology Institute intern
Abstract Purpose: To determine the relationship between obesity and eating out frequency within the Southern Community Cohort Study (SCCS), and compare such changes in this relationship across six county-level urbanization classifications as defined by the National Center for Health Statistics (NCHS). Basic methods: Using responses from a baseline questionnaire, a multiple logistic regression model was run to calculate adjusted odds ratios (OR) for obesity for different eating out frequencies within the total population and the six county classifications. Results: Any frequency category of eating out above the ‘never or rarely’ category statistically significantly raised the OR in the total population, though the association was slight (OR 1.12-1.24). The prevalence of obesity did not increase with the frequency of eating at restaurants in the total population, or within 5 of the 6 classifications. However, in the ‘noncore’ (most rural) classification, eating out at least 2-3 times per week (OR 1.32, 95% CI 1.06-1.66) and 3 or more times per week (OR 1.59, 95% CI 1.19-2.12) significantly raised the OR for obesity. Conclusions: Within the SCCS, overall eating out increased the OR for obesity, but the frequency of eating at restaurants over the baseline category did not have a consistent positive association. No association between
frequency of eating out and obesity in the total population or within each county type, with the exception of the most rural counties was observed.
Introduction In the United States, obesity is the second highest preventable cause of death next to tobacco use, due to its association with many negative health effects and risks (Wang & Beydoun, 2007; Wyatt, et al., 2006). Studies show that such health risks, notably cardiovascular disease, are very strongly associated with obesity (Flegal, Carroll, Kuczmarski, & Johnson, 1998). Additionally, research indicates that the prevalence of eating out has changed in recent years; a study by the United States Department of Agriculture (USDA) compared the percent of food budget used on away from home foods between 1970 and 2008 and found that the percent increased from 26% in 1970 to approximately 46% in 2008 (United States. Dept. of Agriculture, 2006). Despite the increase in eating out and the increase in overweight and obesity, very few studies have examined the effect eating out has on obesity (Guthrie, Lin, & Frazao, 2002). The Southern Community Cohort Study (SCCS) is an Institutional Review Board (IRB) approved cohort study composed of almost 74,000 low-income Southeastern American individuals

Relationship between eating out and obesity compared between urban and rural counties in the Southern Community Cohort Study – Victoria Rainbolt, 2011 Page 2
with ages at enrollment from 40-79 years of age. The focus of SCCS is to determine why cancer is “the leading cause of death in Americans aged 40-79,” particularly in those of African American descent, individuals in poverty or with low socioeconomic status, and those living in geographical areas with a high concentration of both: the Southeastern United States (Signorello, et al., 2005). Each participant in the study completed a baseline questionnaire at the time of enrollment. Using the SCCS participant’s questionnaire responses, I would like to determine if there is a relationship between the frequency of eating out and obesity as measured by body mass index (BMI), then further examine the association between urbanization classifications, as determined by the county of their home address and definitions of county classifications developed by the National Center for Health Statistics (NCHS) (National Center for Health Statistics, 2006). Overall, this study will help to better understand the relationship between eating habits and obesity and informing better targeted public health prevention measures.
Methods Study Population and Data Collection The Southern Community Cohort Study (SCCS) is a prospective cohort study consisting of individuals aged 40-79 at enrollment within 12 states in the Southeastern United States. Most participants enrolled into the study at over 70 different participating community health centers. Upon enrollment, the participants were given a computer aided personnel interview (CAPI) by trained interviewers regarding their past and present lifestyle habits and medical history (Signorello, Hargreaves, & Blot, 2010). This descriptive study examines lifestyle habits of the SCCS participants to offer clues to some possible lifestyle factors that contribute to obesity. Responses from the interview were used to analyze various factors
and their association to obesity. The factors under examination were characteristics that previous studies reported being at highest risk for obesity: age, sex, education, race, income, physical activity level, eating out frequency, tobacco use and community type, (Carroll, Blanck, Serdula, & Brown, 2010; Flegal, Carroll, Ogden, & Curtin, 2010; Ogden, Lamb, Carroll, & Flegal, 2010; Ramsey & Glenn, 2002; Wyatt, Winters, & Dubbert, 2006). As this was a descriptive study only, no change in exposure or intervention was applied. Primary outcome measure The primary outcome of interest in this analysis was obesity. Obesity is most easily measured using body Mass Index (BMI), calculated as the weight in kilograms divided by the height in meters squared and is typically used to classify an individual as underweight (<18.5), normal weight (≥18.5 and <25), overweight (≥25 and <30) or obese (≥30) ("Clinical Guidelines on the Identification, Evaluation, and Treatment of Overweight and Obesity in Adults--The Evidence Report. National Institutes of Health," 1998). 73,579 participants were enrolled into the SCCS at community health centers between 2002 and 2009. In this analysis, participants were excluded for living outside the 12 Southeastern states (AL, AR, FL, GA, KY, LA, MS, NC, SC, TN, VA, WV) under study (n=464), not reporting race or being of any race other than black or white (n=3,833), missing values for BMI (n=1,961), missing yearly household income amounts (n=722), missing education level (n=14), missing or impossible eating out frequencies (n=586), and having extreme or unlikely height values (n=35). The final study population consisted of 65,964 individuals. Analysis The analysis was performed using STATA statistical software v.10.1 (StataCorp,

Relationship between eating out and obesity compared between urban and rural counties in the Southern Community Cohort Study – Victoria Rainbolt, 2011 Page 3
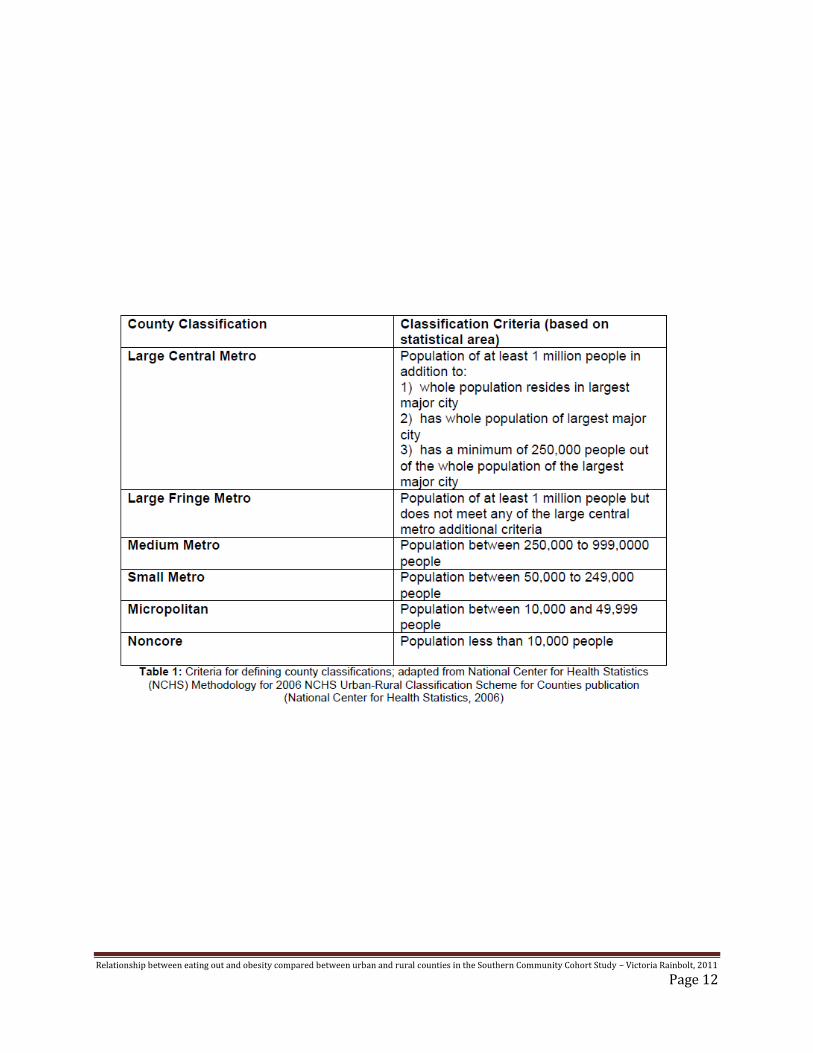
College Station, TX). The outcome of interest was whether the participant was obese (BMI ≥30), and the primary exposure of interest was the frequency the participant reported eating in restaurants. Many variables were adjusted for in the analysis to control for the potential confounding of this relationship: age, sex, race, education, income, tobacco use and state of residence (Flegal, et al., 2010). The analysis was also stratified by six county classifications: large central metro, large fringe metro, medium metro, small metro, micropolitan and noncore. The community type stratification was based on of the CDC classification method. NCHS classified counties using the 2003 Office of Management and Budget (OMB) metropolitan and nonmetropolitan counties definitions, the Rural-Urban Continuum Codes and the Urban Influence Codes classifications developed by the Economic Research Service of the U.S. Department of Agriculture, and the county-level 2000 and 2004 Census population counts and estimates (National Center for Health Statistics, 2006). Table 1 describes the criteria used by NCHS to determine county classifications. Multiple logistic regression was used to calculate the adjusted odds ratios and 95% confidence intervals for eating out frequency and the potential confounders. The regression model was also stratified by county urban-rural classifications. This model allows for a controlled comparison between the changes in odds for obesity between each stratum as well as how each stratum varied from the non-stratified total cohort odds ratios. The differences in odds per stratum were analyzed to show how the relationship between eating out and obesity varied within each county type, if at all. Reasons for using the SCCS The SCCS offered an unparalleled opportunity to observe potential contributing factors of obesity. Beyond its large number of participants and large variation in residential
community types, its participants met the demographics that previous studies have noted to be at the highest risk of obesity. These factors, notably being of black race and being middle aged or older (40-79) have especially high prevalence within this cohort. Additionally, the average body mass index (BMI) of the cohort was approximately 29.9, which is typically considered borderline obese ("Clinical Guidelines on the Identification, Evaluation, and Treatment of Overweight and Obesity in Adults--The Evidence Report. National Institutes of Health," 1998). Another advantage the SCCS offered was the large number of low-income participants. Low-income individuals have received growing attention due to concern for healthy food availability at affordable prices (Flegal, et al., 2010). The results of this study may offer insight as to how living a low-income lifestyle in various communities changes odds of obesity within a population that is demographically at high risk for obesity (Flegal, et al., 2010). Data Use Approval Approval to access to the de-identified SCCS dataset was received after submitting a data use proposal through the standard SCCS data request system. The proposal included the intent of my research project, my hypotheses, identified the CAPI variables required to conduct the study, and detailed the analysis plan. After submission of my request, a follow up presentation of my research question and methods to the Co-Principal Investigator of the SCCS was required to receive full approval. Advisor Assistance For my research project, I independently developed my research question: is there a correlation between the frequency of eating out and an increase in BMI and obesity levels. I determined that there are no similar published epidemiology studies addressing this question in a population such as the

Relationship between eating out and obesity compared between urban and rural counties in the Southern Community Cohort Study – Victoria Rainbolt, 2011 Page 4
SCCS. My mentor advised me on the study design that was best suited for the SCCS dataset. Throughout my research, my mentor provided me with access to previously published research reports that I did not have access to. For the analysis stage of my research project, my mentor illustrated how to run logistical modeling to calculate odds ratios and provided me with the standard operating manual for the STATA statistical software. I independently performed and evaluated all analyses. Finally, my mentor offered feedback on my final written report.
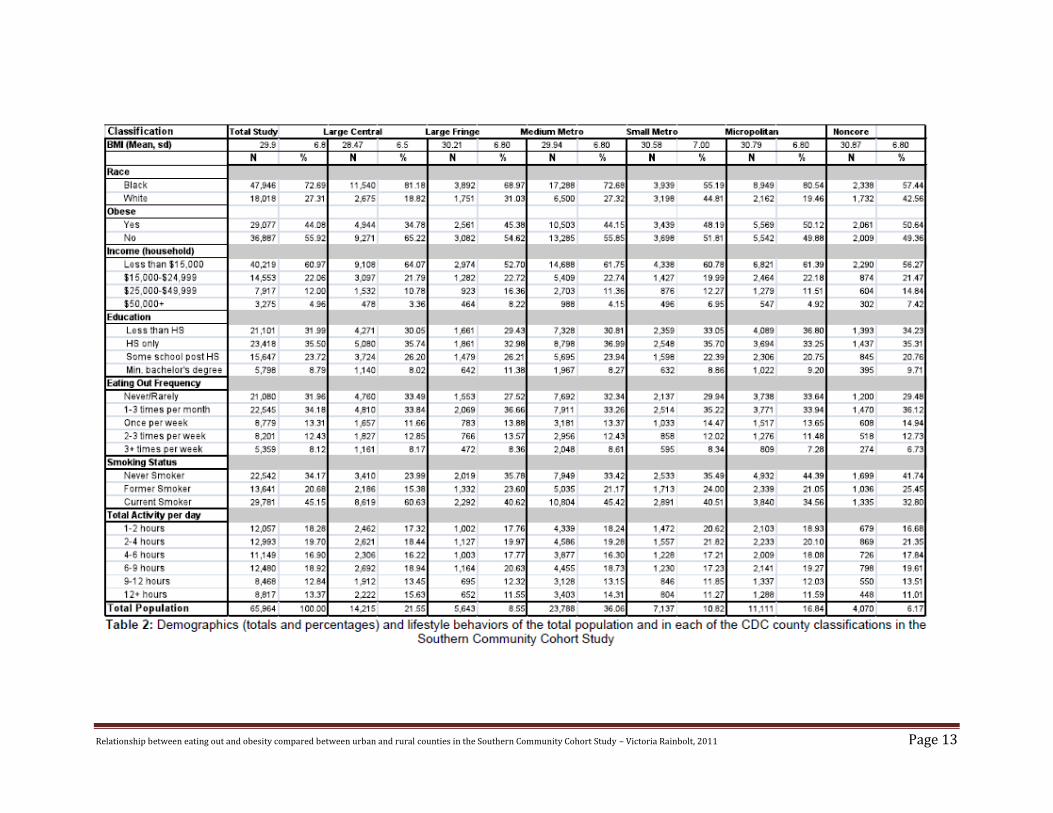
Results Demographics Table 2 presents the totals in each variable of interest for the total population as well as the totals in each of the six NCHS urban-rural classifications. Among the six strata, the medium metro had the highest total study population (n=23,788); the sixth classification (defined as non-core) had the lowest total (n=4,070). In summary, participants in this study were aged 40-79 and 59.4% (n=39,814) of the study was female. Out of the total of 65,964 participants, 47,946 (72.7%) were black and 18,108 (27.3%) were white. 32.0% had not completed high school, 35.5% had graduated from high school but did not attend college, 23.7% graduated from high school and had some college, attended technical school or received an associate’s degree, and 8.8% had graduated from high school and received at least a bachelor’s degree in college. A household income of less than $15,000 each year accounted for 61.0% of the participants; only 5.0% reported receiving a household income of $50,000 or more. Only the micropolitan and noncore county classifications (the most rural) had a higher percent of obese individuals in comparison to the other county types. The large central (most urban) classification has the greatest difference in the proportion of obese and not obese individuals, with only 34. 8% obese
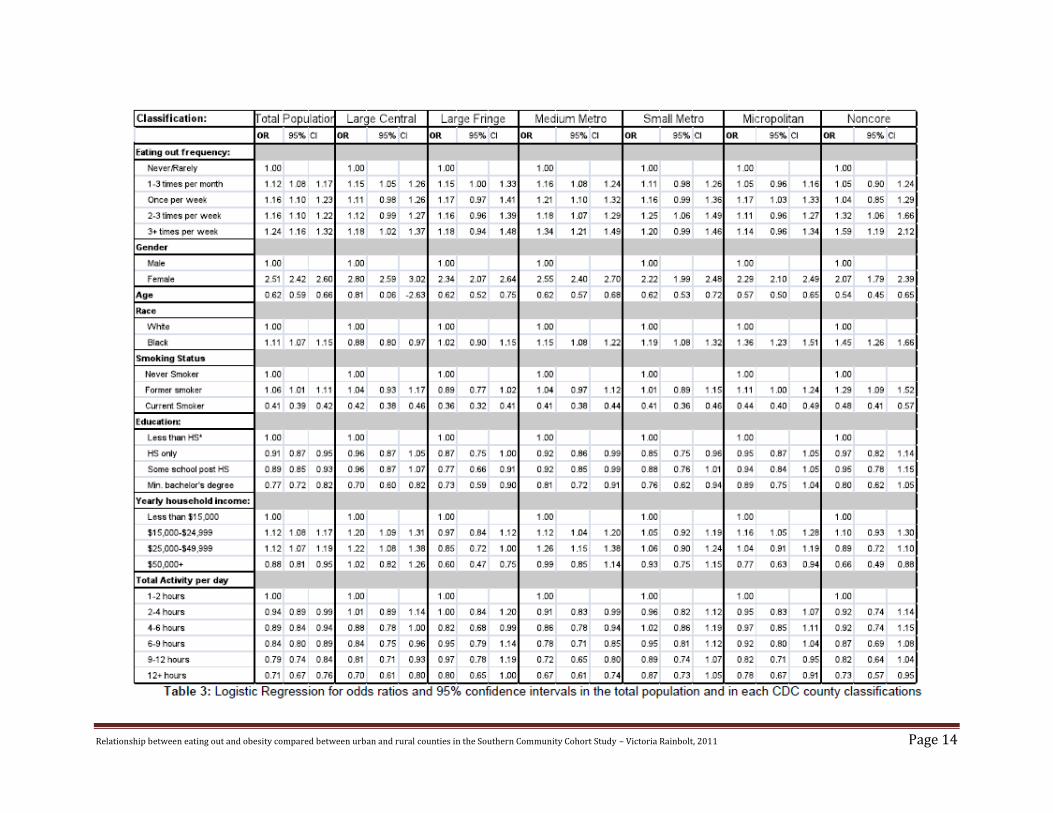
(compared to approximately 50% in the total population and all other county classifications). The classification that had the highest number of individuals that reported eating out at least three times per week was the medium metro classification by a very slight amount; this classification also had the most individuals reporting never or rarely eating out. With the exception of the micropolitan and noncore, each classification had a higher number of current smokers than those who reported as never smoked. Logistic Regression Analysis A logistic regression model was used to calculate the adjusted odds ratio (OR) and 95% confidence interval (CI) for obesity for each variable of interest. Odds ratios were calculated for the entire population and for each of the six urban rural classifications. Table 3 provides the OR for obesity and 95% CI for each analyzed variable. Logistic Regression Analysis I: Total Population In the total population, eating out frequency appeared to have little effect on the odds of being obese. Controlling for age, sex, race, tobacco use, education, income and average activity level, a very slight increasing trend was observed. Participants reporting eating out ‘never or rarely’ had the lowest odds of obesity. Odds for obesity in all eating out frequencies above never or rarely were slightly increasing, but still statistically significant (OR 1.12-1.24). Smoking had a strong negative association with obesity. Current smokers had a significantly low odds ratio (OR .41, 95 % CI 0.39-0.42) compared to never smokers, while former smokers had an odds ratio of 1.06 (95% CI 1.01-1.11) compared with the same reference. Gender was a similarly strong predictor of obesity with the odds of obesity among females increased by twofold compared to males within the total population.

Relationship between eating out and obesity compared between urban and rural counties in the Southern Community Cohort Study – Victoria Rainbolt, 2011 Page 5
Household income (HHI) had a negative association with obesity among those reporting having a HHI less than $50,000 per year. A linear relationship was observed between the odds of being obese and yearly income; those with a higher reported yearly household income were less prone to obesity. An individual receiving an income of at least $50,000 per year had a statistically significantly reduced odds ratio of 0.88 (95% CI 0.81-.95) compared to an individual receiving an income of less than $15,000 per year. As expected, there was a strong dose response relationship between the amount of physical activity and odds of being obese. Any physical activity above the referent category (1-2 hours of total activity per day) was associated with statistically significantly decreased odds of obesity and as the hours of activity per day increased, the odds of being obese decreased. Individuals that reported having 12+ hours of physical activity (exercising, walking etc.) per day had an odds ratio of 0.71 (95% CI 0.67-0.76) in comparison to the reference group in which participants reported having only 1-2 hours of physical activity per day. Logistic Regression Analysis II: Urban-rural stratification Each of the six county classifications had varying effects on the relationship between eating out and obesity. In the large central metro classification, of those that reported eating out more than rarely or never, the participants that reported eating out 3+ times per week had a marginal increase in the odds ratio (OR 1.18, 95% CI 1.02-1.37) compared to the odds ratios of the other frequency categories. The eating out frequency with the second highest odds ratio was in those that reported eating out 1-3 times per month (see Table 3), which indicates that though reporting any eating out had a higher odds of obesity than never eating out, it did not have a continuous association within this county type. Within the large fringe metro counties,
the odds of being obese changed with increasing frequency even less than they did in the large central metro counties; eating out 3+ times per week still had the highest OR (OR 1.18, 95% CI 0.94-1.48), but eating out once per week and 2-3 times per week had odds ratios of 1.17 and 1.6, respectively. Within the medium metro counties, eating out 3+ times per week had the highest odds of obesity (OR 1.34, 95% CI 1.21-1.49), as was seen in the large central metro and large fringe metro counties. However, unlike in the other two counties, the difference in odds ratio between the highest two frequencies was slightly greater. Eating out 2-3 times per week had an OR of 1.18 (1.07-1.29), while eating out 3 or more times per week had an OR of 1.34 (95% CI 1.21-1.49), leading to a noticeably larger difference in the odds for obesity for those reporting the highest frequency eating out that what was seen in the large central and large fringe metro counties. Examination of the effects of eating out within the small metro counties showed an upward trend in OR between eating out 1-3 times per month (OR 1.11, 95% CI 0.98- 1.26) and eating out 2-3 times per week (OR 1.25, 95% CI 1.06-1.49). However, among individuals that reported the highest frequency of eating out, the odds slightly decreased and were not statistically significant (OR 1.20, 95% CI 0.99-1.46). A consistent relationship was not observed between the odds of obesity and eating out in the micropolitan county population. Eating out once per week had the highest odds of being obese (OR 1.17, 95% CI 1.03-1.33) compared to the rest of the individuals that reported ever eating out. However, there was no indication of any sort of upward or downward trend between the different frequencies of eating out within this county classification. The results for the noncore group showed the strongest linear association between eating out frequency and the odds of being obese of all the county classification types. The OR between eating out 1-3 times per month and
Relationship between eating out and obesity compared between urban and rural counties in the Southern Community Cohort Study – Victoria Rainbolt, 2011 Page 6
once per week was relatively the same and close to 1.00. Comparably, eating out 2-3 times per week had second highest probability of being obese with an OR of 1.32 (95% CI 1.06-1.66) while the odds of obesity for eating out 3+ times per week increased considerably (OR 1.59, 95% CI 1.19-2.12). The relationship between obesity and frequency of eating out was the strongest observed association of all of the urban-rural classifications. Eating out, when compared to those that reported never or rarely eating out, raised the odds of obesity by some amount in all of the county types, indicating that eating out does have some effect on obesity. With the exception of the noncore county classification, which showed a clear dose response trend, the lack of a consistent relationship between the frequency of eating out and the odds of obesity across the different county types suggested that while any eating out had some relationship with current obesity in this population, frequency of eating out did not have very much effect on odds of obesity. Further variable analysis Across each county classification, current smoking statistically significantly decreased the odds of obesity. In most cases, never smokers and current smokers had lower odds of being obese than did former smokers; the exception to this was in the large fringe county classification where never smokers had increased odds of obesity than the current or former group. In almost all cases, the odds of being obese had a negative association to increasing education level compared to those that received less than a high school education; in all of the county types, having at least a four year college degree decreased odds of obesity relative to the OR of the other education levels within that particular county classification, and this relationship was statistically significant for participants in all but the micropolitan and noncore counties. Those with only a high school diploma in the
large central metro and micropolitan counties had almost identical odds of obesity as those who received an associate’s degree, a technical degree, or some college upon graduating from high school. Income had a significant influence on obesity in most of the county classifications. With the exception of large central metro counties, where the odds ratio for obesity was nearly identical to those earning <$15,000 per year, the odds of obesity decreased with individuals earning $50,000 per year (see Table 3). In comparing all of the community types, current physical activity appeared to have a somewhat consistent dose response relationship to current obesity; for the most part as total physical activity increased, the odds of obesity decreased. In all counties, as expected, 12+ hours of daily activity had the largest decrease in odds of obesity, and was statistically significant in all county types except large fringe, which was of borderline significance (OR 0.80, 95% CI 0.65-1.00). In large central metro counties and medium metro counties, a distinct decreasing trend was seen; small metro, micropolitan and noncore did not have a completely consistent trend. No consistent trend was observed the large fringe metro county type. Gender was strongly associated with obesity—females were between 2.0 and 2.8 times more likely to be obese than males across all county types.
Discussion Obesity is a national health risk with very high prevalence in the United States population. According to the 2005-06 Nation Health and Nutrition Examination Survey (NHANES), 34.3% of adults older than 20 years old were obese. In a set of studies conducted by Flegal et al. which used NHANES to observe trends, obesity (BMI ≥30) significantly increased mortality and excess deaths in comparison to normal weight. Combined with overweight (BMI between 25 and 29), obesity greatly increased death from diabetes and kidney

Relationship between eating out and obesity compared between urban and rural counties in the Southern Community Cohort Study – Victoria Rainbolt, 2011 Page 7
disease (Flegal, Graubard, Williamson, & Gail, 2007). A study conducted by Calle et al. from the Department of Epidemiology and Surveillance Research indicated that overweight and obesity combined account for 14% of all types of cancer in men and 20% of all types of cancer in women within the United States (Calle, Rodriguez, Walker-Thurmond, & Thun, 2003). Frequency of eating away from the home has also increased over recent years. A study conducted by Guthrie et al. for the US Department of Agriculture (USDA) compared eating out in 1977-78 against eating out in 1994-96. The percent of total calories eaten away from home increased from 18% and 32% over the approximately twenty years. In addition, comparisons between commercially sold foods and homemade foods indicated that on average, “away” foods had much higher concentrations of cholesterol and sodium (Guthrie, et al., 2002). Relationship between eating out and obesity The logistic regression of the total population indicated that in reference to never eating out, eating out at least one to three times per month increases, though slightly and the odds ratio (OR) of current obesity. As investigating the outcome and exposure of this study in a low income African American population was unique, comparisons between other study results were somewhat limited. In one study evaluating eating patterns in relation to obesity, eating breakfast and/or dinner outside the home on a regular basis doubled the risk for obesity (Ma, et al., 2003). These results are consistent with those of this study; in the total population and in each county stratum, odds of obesity for individuals that reported eating out 2-3 times per week or 3+ times per week were generally the highest in respect to the OR of the other eating out frequencies (Table 3). Findings from other studies show that the frequency of eating meals away from home
has also increased. According to a study by Kant and Graubard, which used data from the National Health Interview Survey (NHIS, years 1987 and 1992) and National Health and Nutrition Examination Survey (NHANES, 1992) to examine changes in eating out in America between the years 1987 and 2000, revealed that a greater number of Americans ate out in 2000 than in 1987, and the average eating out frequency increased between 1999 and 2000 (Kant and Graubard). The association found in the study at present can be attributed to several possible explanations. Some studies suggest that portion sizes, especially for commercially prepared meals, have increased significantly over the past few decades. The Kant and Graubard study (2004) found restaurant portion sizes to be significantly larger than the sizes recommended by the US Department of Agriculture (USDA) and US Food and Drug Administration (FDA). In comparison to the USDA standards, portion sizes increased up to 700% for restaurant cookies. Other portions reached 480% larger (cooked pasta), 333% (muffins), 224% (steaks) and 195% (bagels), (Kant & Graubard, 2004). Due to increased restaurant portion sizes, and increased frequency of eating out, Americans have significantly increased their caloric intake. Furthermore, these increased portion sizes have become the expected or normal portion sizes across America (Kant & Graubard, 2004). Very few, if any, studies have evaluated the relationship between southern culture (i.e. cooking and eating habits, physical activity habits etc.) and the southern population’s high prevalence of obesity. Some studies have reported that the Southeastern United States has the highest obese population in the United States, but the reasons as to why this is the case still remains unknown (Wang & Beydoun, 2007; Wyatt, et al., 2006). It is possible that the culture of Southern style of eating and methods of homemade food preparation play a role in the cohort’s overall large number of obese

Relationship between eating out and obesity compared between urban and rural counties in the Southern Community Cohort Study – Victoria Rainbolt, 2011 Page 8
participants; the composition of commercially prepared meals may not differ greatly from that of the types of food the participants are cooking at home. To my knowledge, this is the first study examining obesity within the Southeastern United States in relation to the frequency of consuming commercially prepared meals away from the home. There have been studies, however, investigating the effects of “food deserts” in several British and a few American populations (United States. Dept. of Agriculture. Economic Research, 2009; White, 2007). No such studies have been done in a population similar to the SCCS, however. Food deserts, defined as areas relatively isolated from food stores of or grocers have fairly high prevalence in both urban and rural counties. A study conducted by the United States Department of Agriculture (USDA) observed how the lack of grocers or food stores in urban areas affected dietary choices and overall health. Its findings suggest many factors that may play a role in food choices and obesity. In observing and comparing food choices among Supplemental Nutrition Assistant Program (SNAP) participants, it appeared that SNAP participants who did not shop at grocery stores were more prone to purchase items that had less healthy qualities (i.e. less un-canned fruit, un-canned vegetables, and milk) compared to SNAP participants who did shop at supermarket on a regular basis, (United States. Dept. of Agriculture. Economic Research, 2009). In addition, the study suggested that “easy access to all food, rather than lack of access to specific healthy foods, may be a more important factor in explaining increases in obesity,” therefore restaurant availability may have some contribution to obesity as well (United States. Dept. of Agriculture. Economic Research, 2009). The fact that studies show an increase in eating out, restaurant portion sizes, and population percent of obesity suggests that eating out has contributed to the United States’ significant increase in obesity over the past few decades.
The results of this study somewhat support this conclusion, given that the OR for obesity increased in every eating out frequency category that exceeded never or rarely eating out. While the odds of being obese increased for all eating out categories, the relationship between eating out more often compared to eating out less often did not reflect the expected trend. In the total population, eating out 2-3 times per week had almost an identical odds ratio to that of eating out only once per week, while eating out 3+ times per week only slightly increased the OR (Table 3). Based on this, there appears to be only a slight upward trend between the frequencies of eating out and odds of obesity amongst the population that reported ever eating out. There was not a significant linear trend in odds of obesity between eating out in large central metro counties (the most urban), large fringe metro counties, or medium metro counties. A weak upward trend in odds for obesity as eating out frequency increased was exhibited in the small metro counties. The effect of eating out on obesity in the noncore county classification was the most substantial out of all the county types (table 3). The upward trend observed within this county classification best fits the expected relationship between eating out and obesity: higher eating out frequency raises odds of obesity. However, since studies discussing the relationship between different urbanization types are very limited, and differences between the odds of obesity and frequencies of eating out in the present study were so slight, any conclusions on the difference between odds of obesity across county classifications are limited. The overall lack of a strong dose response relationship suggests that the frequency of eating away from the home is not a major contributing factor to obesity within the SCCS. This finding is consistent with the study by Kant and Graubard, which observed changes in American eating out trends and its nutritional consequences. Between 1987 and 1992, obesity had little to no association with
Relationship between eating out and obesity compared between urban and rural counties in the Southern Community Cohort Study – Victoria Rainbolt, 2011 Page 9
increased eating out frequencies, as is seen in the findings of the present study. In 1999-2000 however, a modest relationship among females that had reported higher frequencies of eating out was observed; the male population remained without a positive association (Kant and Graubard, 2004). Nonetheless, the association found in Kant and Graubard’s study between obesity and eating out frequency in females in 1999-2000 is too slight to determine if it is a cause-effect relationship, or simply due to chance. In looking at the present study, that there was no noticeable association within a population that had a borderline obese average BMI (the total average population BMI was approximately 29.9) suggests that other factors that were not examined in this study may be contributing to the high prevalence of obesity in the SCCS population. Strengths The demographics and size of the study population were ideal for observing the factors that increase obesity. With 44% of the total population obese, there was a very large population of obese individuals for comparison. This was important in that it allowed for a large-scale comparison, which increased the strength of the final odds ratio of each variable of interest. Additionally, the demographics are characteristic to those that other studies have found to be at highest risk to obesity, namely being of black race, having low income, reporting a wide range of physical activity and generally having low levels of education. The cohort also had a very large number of participants (n=64,964), which made the odds ratios more precise for this rarely studied population. Furthermore, there were large numbers of individuals in each county stratum. Weaknesses The present study was a cross sectional study, and was therefore only able to utilize the
participants’ baseline questionnaire responses. Cross sectional studies limit the analysis to responses at a single point in time, and are therefore unable to determine whether an observed association reflects a true cause and effect relationship. While the participants’ CAPI responses are assumed to be accurate of their actual lifestyle, this may not be the case. Under the pressure of the questioning, or other personal reasons, false data may have been supplied. Variables that did not appear to have any consistent association to obesity may be caused by this reason. However, validation studies verified that self-reported information for factors such as height, weight, and current smoking status, were highly accurate. Self-reported physical activity was less consistent with actual activity, but was still acceptable (Signorello, et al., 2010). Body mass index (BMI), as an outcome measure, was also a weakness. BMI is a commonly calculated value used to define the body type of an individual. However, BMI does not account for the weight of muscle mass; the weight of an individual with a high amount of muscle may significantly increase the BMI. Using the odds ratios as the measure of association was also a study weakness; the odds ratio is limited to assessing the risk of the outcome due to the exposure, as is it cannot accurately estimate the relative risk unless the exposure is rare in every group included in the analysis (Selvin, 2011). However, understanding such limitations will help in the interpretation of the different observed outcomes. Finally, the term “eating out” may be perceived differently than intended. Reported values may not have included some types of restaurants, such as fast food restaurants, while other values did. Ways to improve the study Repeating the analysis utilizing follow-up data to examine changes in eating out frequency in relation to obesity may indicate how obesity is affected by frequency of eating out over a period of time, rather than at the time of the

Relationship between eating out and obesity compared between urban and rural counties in the Southern Community Cohort Study – Victoria Rainbolt, 2011 Page 10
participant’s registration. If this study were re-conducted, frequencies of eating out at different types of restaurants should be calculated. Here, the frequency of eating out was defined collectively, with no distinction as to the type of restaurant. This additional information could offer valuable insight into the effects of eating out frequency with restaurant types for each county type of the SCCS. Follow up research and unanswered questions Based on the results of this study, several further studies could be conducted to better understand the reasons for the extremely high prevalence of obesity within this population. Further research could examine in greater detail the effect of the type and frequency of restaurants visited. Knowing what types of restaurants were most frequented would help to better understand which types of restaurants contribute most to obesity in different income and county classifications, providing better information for planning public health interventions. Furthermore, a food desert study could be conducted on the SCCS population, using the same questionnaire and county stratifications in conjunction with information about every restaurant within the county. This could indicate whether the density of certain types of restaurants within different communities has any impact on obesity. Future research could also address the frequency of preparing homemade meals, and the typical ingredients used in preparing them, relative to the frequency of eating out. In addition, participants’ motivation for their eating habits could be gathered, as to why one option was more preferred or less preferred than the other. Through such a study, reasons for eating out versus eating at home could be evaluated, and the health risks of each choice quantified.
Implications of results While the expected linear trend was not observed, the conclusion that overall frequency of eating out, above any eating out, is not a major contribution to obesity in the SCCS is still an important step in controlling obesity within this heavily obese population. Further studies can be conducted to understand what major factors, (besides age, gender, race, sex, education, income, and total activity) are contributing to the recent rise in obesity. Using the results that overall frequency of eating out was not significantly associated, other studies can be formulated to further investigate the rise in obesity.
Conclusion The results of this study indicate that within the total study population and among all county types there was a weak association between eating out and obesity. No increasing trend with frequency of eating at restaurant was observed, except in the noncore (most rural) county types. The results of the aforementioned USDA on food deserts study may offer insight about the results of the conducted study being described here (United States. Dept. of Agriculture. Economic Research, 2009). It is possible that the flat trend seen across almost all of the county classifications and within the total population may be caused due to the relative unhealthiness of at home foods. A large number of the participants within the SCCS have low income. Therefore, if the financial status of the SCCS participants reflects the results of low income food choices from the USDA studies, it is possible that their home prepared food is just as unhealthy as that of commercially prepared meals, possibly with the exception of noncore counties. Noncore counties had a stronger association between eating out and obesity, which could suggest that their home-prepared meals are slightly healthier than those in the other counties.

Relationship between eating out and obesity compared between urban and rural counties in the Southern Community Cohort Study – Victoria Rainbolt, 2011 Page 11
Relationship between eating out and obesity compared between urban and rural counties in the Southern Community Cohort Study – Victoria Rainbolt, 2011 Page 12
Relationship between eating out and obesity compared between urban and rural counties in the Southern Community Cohort Study – Victoria Rainbolt, 2011 Page 13
Relationship between eating out and obesity compared between urban and rural counties in the Southern Community Cohort Study – Victoria Rainbolt, 2011 Page 14
Relationship between eating out and obesity compared between urban and rural counties in the Southern Community Cohort Study – Victoria Rainbolt, 2011 Page 15
Acknowledgments This study would not have been made possible without the generous co-operation of the International Epidemiology Institute and the great opportunity provided by the Young Epidemiology Scholars Competition. A special thank you goes to Jennifer Sonderman for her wonderful mentoring throughout the entire study. I would also like to express my gratitude to everyone else within the International Epidemiology Institute for their unwavering support throughout the conduct of this study, and their continued interest in my research ambitions. References Calle, E. E., Rodriguez, C., Walker-
Thurmond, K., & Thun, M. J. (2003). Overweight, obesity, and mortality from cancer in a prospectively studied cohort of U.S. adults. N Engl J Med, 348(17), 1625-1638.
Carroll, D. D., Blanck, H. M., Serdula, M. K., & Brown, D. R. (2010). Obesity, physical activity, and depressive symptoms in a cohort of adults aged 51 to 61. J Aging Health, 22(3), 384-398.
Clinical Guidelines on the Identification, Evaluation, and Treatment of Overweight and Obesity in Adults--The Evidence Report. National Institutes of Health. (1998). Obes Res, 6 Suppl 2, 51S-209S.
Flegal, K. M., Carroll, M. D., Kuczmarski, R. J., & Johnson, C. L. (1998). Overweight and obesity in the United States: prevalence and trends, 1960-1994. Int J Obes Relat Metab Disord, 22(1), 39-47.
Flegal, K. M., Carroll, M. D., Ogden, C. L., & Curtin, L. R. (2010). Prevalence and
trends in obesity among US adults, 1999-2008. JAMA, 303(3), 235-241.
Flegal, K. M., Graubard, B. I., Williamson, D.
F., & Gail, M. H. (2007). Cause-specific excess deaths associated with underweight, overweight, and obesity. JAMA, 298(17), 2028-2037.
Guthrie, J. F., Lin, B. H., & Frazao, E. (2002). Role of food prepared away from home in the American diet, 1977-78 versus 1994-96: changes and consequences. J Nutr Educ Behav, 34(3), 140-150.
Kant, A. K., & Graubard, B. I. (2004). Eating out in America, 1987-2000: trends and nutritional correlates. Prev Med, 38(2), 243-249.
Ma, Y., Bertone, E. R., Stanek, E. J., 3rd, Reed, G. W., Hebert, J. R., Cohen, N. L., et al. (2003). Association between eating patterns and obesity in a free-living US adult population. Am J Epidemiol, 158(1), 85-92.
National Center for Health Statistics. (2006). 2006 NCHS Urban-Rural Classification Scheme for Counties. Retrieved from http://www.cdc.gov/nchs/data_access/urban_rural.htm#use
Ogden, C. L., Lamb, M. M., Carroll, M. D., & Flegal, K. M. (2010). Obesity and socioeconomic status in adults: United States, 2005-2008. NCHS Data Brief(50), 1-8.
Ramsey, P. W., & Glenn, L. L. (2002). Obesity and health status in rural, urban, and suburban southern women. South Med J, 95(7), 666-671.
Selvin, S. (2011). Statistical Tools for Epidemiologic Research. New York: Oxford University Press.
Signorello, L. B., Hargreaves, M. K., & Blot,
W. J. (2010). The Southern Community Cohort Study:

Relationship between eating out and obesity compared between urban and rural counties in the Southern Community Cohort Study – Victoria Rainbolt, 2011 Page 16
investigating health disparities. J Health Care Poor Underserved, 21(1 Suppl), 26-37.
Signorello, L. B., Hargreaves, M. K., Steinwandel, M. D., Zheng, W., Cai, Q., Schlundt, D. G., et al. (2005). Southern community cohort study: establishing a cohort to investigate health disparities. J Natl Med Assoc, 97(7), 972-979.
United States. Dept. of Agriculture. (2006). The Keystone Forum on Away-from-home Foods: Opportunities for Preventing Weight Gain and Obesity.
United States. Dept. of Agriculture. Economic Research, S. (2009). Access to affordable and nutritious food measuring and understanding food deserts and their consequences : report to Congress. From http://purl.fdlp.gov/GPO/gpo847
Wang, Y., & Beydoun, M. A. (2007). The obesity epidemic in the United States--gender, age, socioeconomic, racial/ethnic, and geographic characteristics: a systematic review and meta-regression analysis. Epidemiol Rev, 29, 6-28.
White, M. (2007). Food access and obesity. Obesity Reviews, 8, 99-107.
Wyatt, S. B., Winters, K. P., & Dubbert, P. M. (2006). Overweight and Obesity: Prevalence, Consequences, and Causes of a Growing Public Health Problem. The American Journal of the Medical Sciences, 331(4), 166-174.