rainfall atlas 14: replacement of technical paper … · rainfall atlas 14: replacement of...
TRANSCRIPT
resourceful. naturally.
Rainfall Atlas 14: Replacement of Technical Paper 40
Case Studies and Implications
Presentation to the Minnesota Water Resources Conference
October 15, 2013 Karen Chandler
resourceful. naturally.
outline
1. TP-40 (the old Atlas) 2. Atlas 14 3. TP-40/Atlas 14 comparisons 4. Rainfall distributions for Atlas 14 5. Atlas 14 case studies 6. Atlas 14 implications 7. questions/discussion
Steve Buan National Weather Service, NOAA

resourceful. naturally.
1. Technical Paper 40 (TP-40)
• key document for hydrologists and water planners, created by NOAA in 1961
• developed using available rainfall information from far fewer stations than exist today
• included the “dust-bowl” years of the 1930’s • gives rainfall data for entire country
– rainfall frequency or recurrence intervals: 1-, 2-, 5-, 10-, 25-, 50-year, and 100-year events
– rainfall durations: 30-m, 1-h, 2-h, 3-h, 6-h, 12-h, 24-h, 2-d, and 4-d events

resourceful. naturally.
1. Technical Paper 40 (TP-40)
resourceful. naturally.
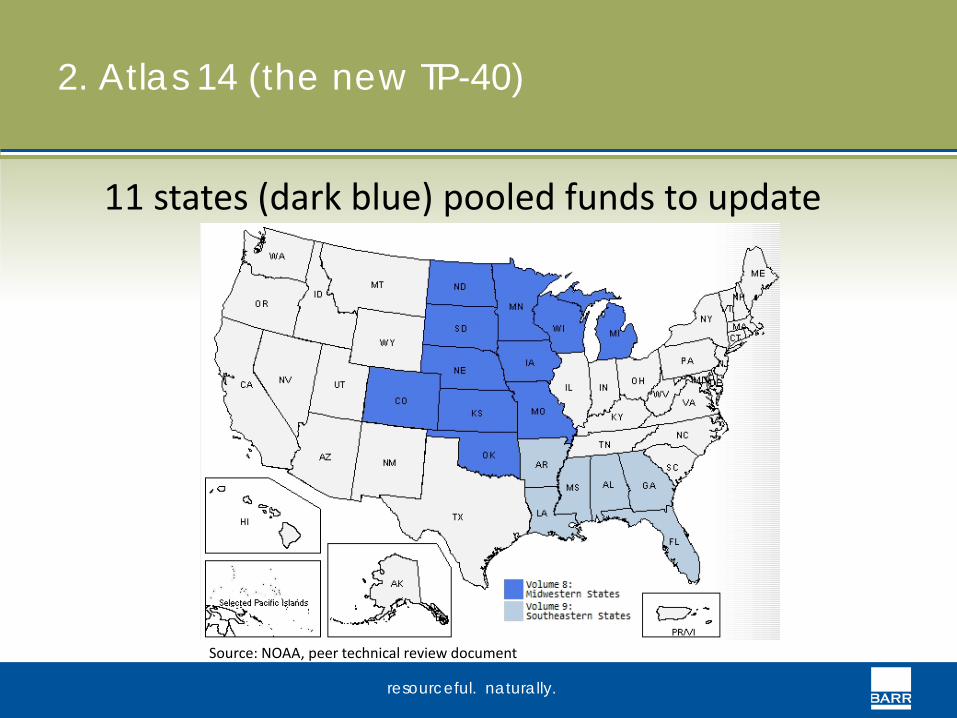
2. Atlas 14 (the new TP-40)
11 states (dark blue) pooled funds to update
Source: NOAA, peer technical review document

resourceful. naturally.
2. Atlas 14 (the new TP-40)
TP-40 Minnesota daily stations Atlas 14 Minnesota daily stations

resourceful. naturally.
2. Atlas 14 (the new TP-40)
TP-40 Minnesota sub-daily stations Atlas 14 Minnesota sub-daily stations
resourceful. naturally.
2. Atlas 14 (the new TP-40)
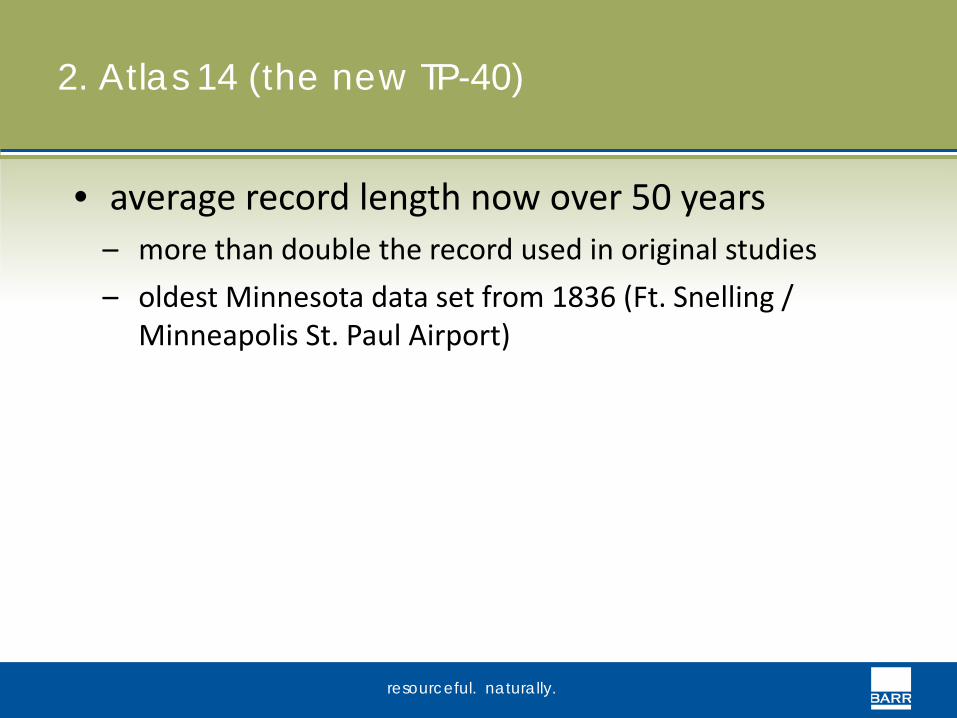
• average record length now over 50 years – more than double the record used in original studies – oldest Minnesota data set from 1836 (Ft. Snelling /
Minneapolis St. Paul Airport)
resourceful. naturally.
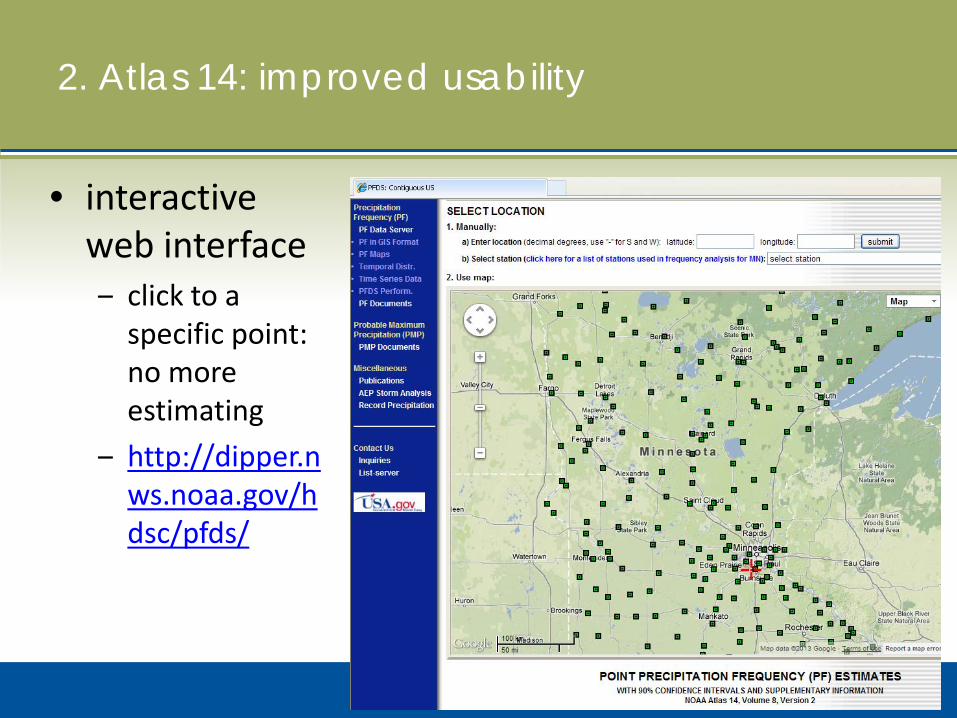
2. Atlas 14: improved usability
• interactive web interface ‒ click to a
specific point: no more estimating
‒ http://dipper.nws.noaa.gov/hdsc/pfds/

resourceful. naturally.
2. Atlas 14: improved usability
• station data provided in downloadable tabular form
• over 190 storms

resourceful. naturally.
2. Atlas 14: improved usability
• or as depth-duration-frequency graphs

resourceful. naturally.
3. TP-40/Atlas 14 comparisons
• many significant increases: e.g., Minneapolis, MN - 6.0 to 7.5 inches (+25%)
• some decreases for certain storms central Minnesota
• degree of change tends to increase as storm frequency decreases
MSP International AP
Frequency % Change 2 0 5 -3
10 0 50 21
100 25

resourceful. naturally.
St. Cloud (Frequency) (%Change) 2 4 5 0 10 -2 50 8 100 10
Minneapolis/St. Paul (Frequency) (%Change) 2 0 5 -3 10 0 50 21 100 25

resourceful. naturally.
Albert Lea (Frequency) (%Change) 2 0 5 0 10 5 50 21 100 24

resourceful. naturally.
Duluth Airport (Frequency) (%Change) 2 8 5 0 10 3 50 17 100 19

resourceful. naturally.
Alexandria (Frequency) (%Change) 2 4 5 -6 10 -5 50 2 100 7
Moorhead (Frequency) (%Change) 2 9 5 0 10 6 50 22 100 23

resourceful. naturally.
3. Atlas 14/TP 40 comparison
• Twin Cities Metro area – 100-year,
24-hour event

resourceful. naturally.
4. Review /compare rainfall distributions
0.0
0.2
0.4
0.6
0.8
1.0
0 4 8 12 16 20 24
Frac
tiona
l rai
nfal
l dep
th
Time (hours)
SCS Type II

resourceful. naturally.
4. “nested” distribution
• hypothetical precipitation distribution
• point-specific • embeds precip depths for
multiple durations (e.g., 5-min, 1-hour, 24-hour, etc.)
• each return frequency has a different distribution (e.g., 10-year or 100-year)
• multiple storms “nested” within single distribution
0
0.1
0.2
0.3
0.4
0.5
0.6
0.7
0.8
0.9
1
0 6 12 18 24Time (hours)

resourceful. naturally.
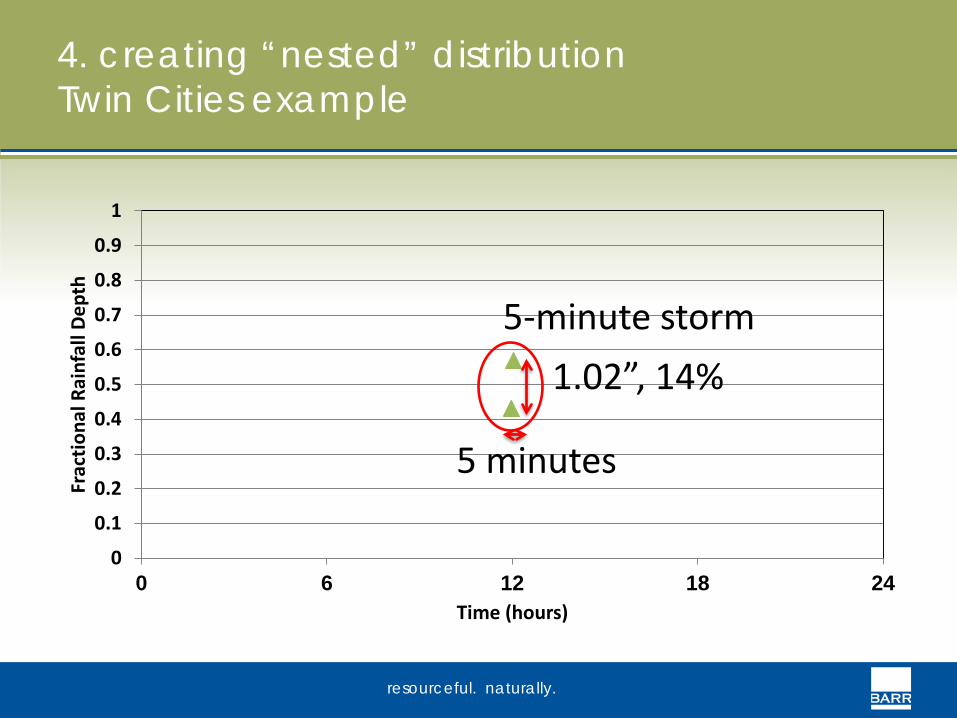
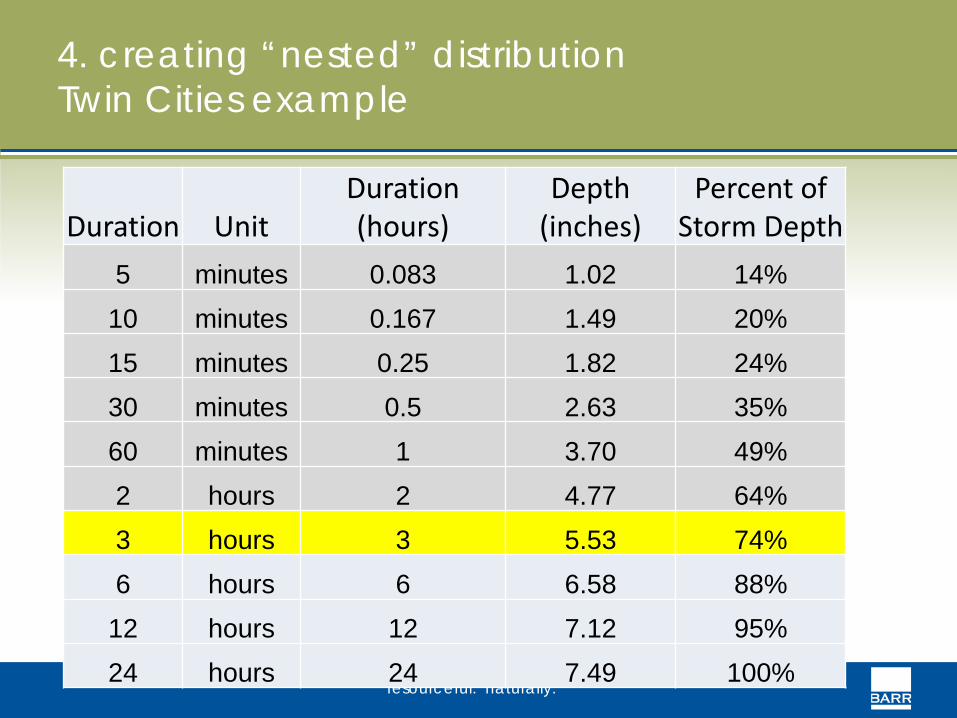
4. creating “nested” distribution Twin Cities example
Duration Unit Duration (hours)
Depth (inches)
Percent of Storm Depth
5 minutes 0.083 1.02 14% 10 minutes 0.167 1.49 20% 15 minutes 0.25 1.82 24% 30 minutes 0.5 2.63 35% 60 minutes 1 3.70 49% 2 hours 2 4.77 64% 3 hours 3 5.53 74% 6 hours 6 6.58 88%
12 hours 12 7.12 95% 24 hours 24 7.49 100%

resourceful. naturally.
Duration Unit Duration (hours)
Depth (inches)
Percent of Storm Depth
5 minutes 0.083 1.02 14% 10 minutes 0.167 1.49 20% 15 minutes 0.25 1.82 24% 30 minutes 0.5 2.63 35% 60 minutes 1 3.70 49% 2 hours 2 4.77 64% 3 hours 3 5.53 74% 6 hours 6 6.58 88%
12 hours 12 7.12 95% 24 hours 24 7.49 100%
4. creating “nested” distribution Twin Cities example
resourceful. naturally.
0
0.1
0.2
0.3
0.4
0.5
0.6
0.7
0.8
0.9
1
0 6 12 18 24
Frac
tiona
l Rai
nfal
l Dep
th
Time (hours)
4. creating “nested” distribution Twin Cities example
5-minute storm 1.02”, 14%
5 minutes
resourceful. naturally.
Duration Unit Duration (hours)
Depth (inches)
Percent of Storm Depth
5 minutes 0.083 1.02 14% 10 minutes 0.167 1.49 20% 15 minutes 0.25 1.82 24% 30 minutes 0.5 2.63 35% 60 minutes 1 3.70 49% 2 hours 2 4.77 64% 3 hours 3 5.53 74% 6 hours 6 6.58 88%
12 hours 12 7.12 95% 24 hours 24 7.49 100%
4. creating “nested” distribution Twin Cities example

resourceful. naturally.
0
0.1
0.2
0.3
0.4
0.5
0.6
0.7
0.8
0.9
1
0 6 12 18 24
Frac
tiona
l Rai
nfal
l Dep
th
Time (hours)
4. creating “nested” distribution Twin Cities example
3-hour storm
5.53”, 74%
3 hours

resourceful. naturally.
4. creating “nested” distribution Twin Cities example
0
0.1
0.2
0.3
0.4
0.5
0.6
0.7
0.8
0.9
1
0 6 12 18 24
Frac
tiona
l Rai
nfal
l Dep
th
Time (hours)

resourceful. naturally.
4. Atlas 14 quartile storms (NOAA)
0.0
0.2
0.4
0.6
0.8
1.0
0 4 8 12 16 20 24
Frac
tiona
l rai
nfal
l dep
th
Time (hours)
FirstQuartile
SecondQuartile
ThirdQuartile
FourthQuartile
• NOAA provided 4 quartile storms for Atlas 14
• similar to Huff distributions
• most rainfall falls in respective quartile
• most MN storms are 1st or 2nd quartile
resourceful. naturally.
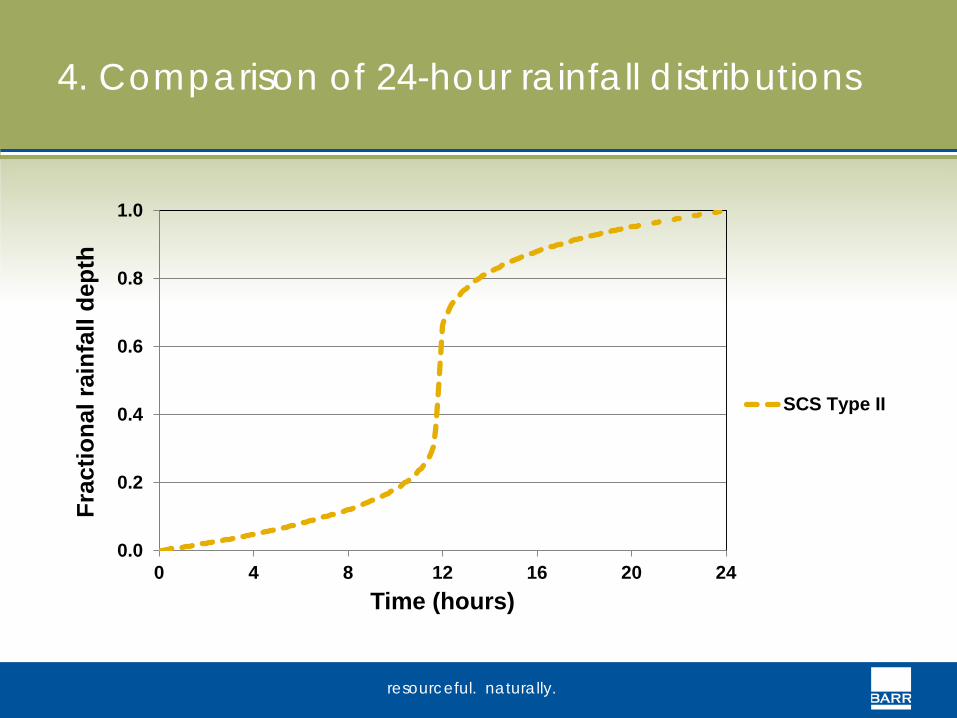
4. Comparison of 24-hour rainfall distributions
0.0
0.2
0.4
0.6
0.8
1.0
0 4 8 12 16 20 24
Frac
tiona
l rai
nfal
l dep
th
Time (hours)
SCS Type II

resourceful. naturally.
4. Comparison of 24-hour rainfall distributions
0.0
0.2
0.4
0.6
0.8
1.0
0 3 6 9 12 15 18 21 24
Frac
tiona
l rai
nfal
l dep
th
Time (hours)
SCS Type II
Nested

resourceful. naturally.
4. Comparison of 24-hour rainfall distributions
0.0
0.2
0.4
0.6
0.8
1.0
0 4 8 12 16 20 24
Frac
tiona
l rai
nfal
l dep
th
Time (hours)
First Quartile
SCS Type II
Nested

resourceful. naturally.
4. Comparison of 24-hour rainfall distributions
0.0
0.2
0.4
0.6
0.8
1.0
0 4 8 12 16 20 24
Frac
tiona
l rai
nfal
l dep
th
Time (hours)
First Quartile
SecondQuartile
SCS Type II
Nested

resourceful. naturally.
4. Comparison of 24-hour rainfall distributions
0.0
0.2
0.4
0.6
0.8
1.0
0 4 8 12 16 20 24
Frac
tiona
l rai
nfal
l dep
th
Time (hours)
First Quartile
SecondQuartile
ThirdQuartile
SCS Type II
Nested

resourceful. naturally.
4. Comparison of 24-hour rainfall distributions
0.0
0.2
0.4
0.6
0.8
1.0
0 4 8 12 16 20 24
Frac
tiona
l rai
nfal
l dep
th
Time (hours)
First Quartile
SecondQuartile
ThirdQuartile
FourthQuartile
SCS Type II
Nested

resourceful. naturally.
4. peak rainfall intensity of storms
0
2
4
6
8
10
12
14
SCS Type II(TP40)
FirstQuartile
SecondQuartile
ThirdQuartile
FourthQuartile
SCS Type II(Atlas 14)
Nested
Peak
rain
fall
inte
nsity
(in
/hr)
Comparison of peak rainfall intensity for the 100-year, 24-hour storm

resourceful. naturally.
4. draft NRCS regional Atlas 14 distributions
• NRCS considering regionalized distributions for Minnesota
• likely 2 distributions for entire state: – #3: most of MN – #4: arrowhead

resourceful. naturally.
0
0.1
0.2
0.3
0.4
0.5
0.6
0.7
0.8
0.9
1
0 4 8 12 16 20 24
Draft NRCS Type 3
Draft NRCS Type 4
Old SCS Type II
4. draft NRCS regional Atlas 14 distributions
both draft distributions are more intense than old SCS Type II
resourceful. naturally.
5. case studies: 3 examples
A. North Creek: Vermillion River Watershed B. Lake Cornelia/Lake Edina: Nine Mile Creek
Watershed C. Proposed residential development pond:
Coon Creek Watershed

resourceful. naturally.
5. H&H modeling to compare distributions
Model Number of
subwatersheds Model area
(acres)
Average subwatershed
size (acres)
Impervious percentage
(%) A. North Creek (tributary to Vermillion River)
154 8,431 55 13
B. Lake Cornelia/Lake Edina 230 1,474 6 41
C. Residential Pond 1 15 15 43

resourceful. naturally.
5.A. North Creek modeling
• Compared – Rainfall intensities for different distributions – Discharge changes at watershed outlet for 24-
hour 100-year storm

resourceful. naturally.
5.A. comparison of TP40 and Atlas 14 rainfall depths (North Creek)
Duration (hours)
TP40 Depth (in)
Atlas 14 Depth (in)
6 4.50 6.70
12 5.30 7.05
24 6.00 7.42

resourceful. naturally.
5.A. peak rainfall intensity (North Creek)
0
2
4
6
8
10
12
14
SCS Type II(TP40)
FirstQuartile
SecondQuartile
ThirdQuartile
FourthQuartile
SCS Type II(Atlas 14)
Nested
Peak
rain
fall
inte
nsity
(in
/hr)
Comparison of peak rainfall intensity for the 100-year, 24-hour storm

resourceful. naturally.
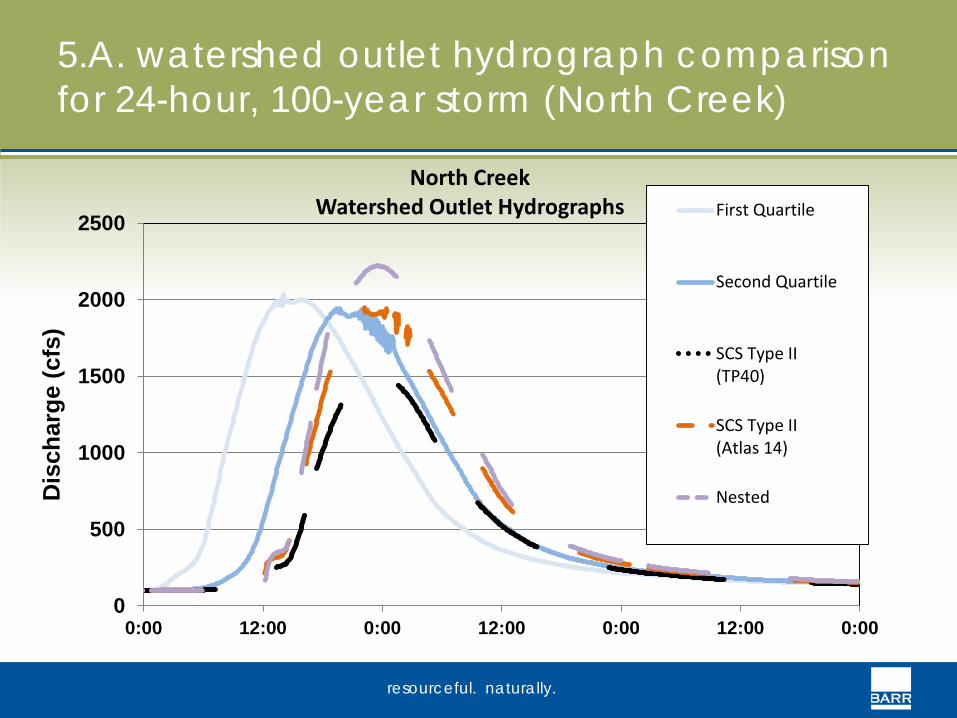
5.A. watershed outlet hydrograph comparison for 24-hour, 100-year storm (North Creek)
0
500
1000
1500
2000
2500
0:00 12:00 0:00 12:00 0:00 12:00 0:00
Dis
char
ge (c
fs)
North Creek Watershed Outlet Hydrographs
SCS Type II(TP40)

resourceful. naturally.
5.A. watershed outlet hydrograph comparison for 24-hour, 100-year storm (North Creek)
0
500
1000
1500
2000
2500
0:00 12:00 0:00 12:00 0:00 12:00 0:00
Dis
char
ge (c
fs)
North Creek Watershed Outlet Hydrographs
SCS Type II(TP40)
SCS Type II(Atlas 14)

resourceful. naturally.
5.A. watershed outlet hydrograph comparison for 24-hour, 100-year storm (North Creek)
0
500
1000
1500
2000
2500
0:00 12:00 0:00 12:00 0:00 12:00 0:00
Dis
char
ge (c
fs)
North Creek Watershed Outlet Hydrographs
SCS Type II(TP40)
SCS Type II(Atlas 14)
Nested

resourceful. naturally.
5.A. watershed outlet hydrograph comparison for 24-hour, 100-year storm (North Creek)
0
500
1000
1500
2000
2500
0:00 12:00 0:00 12:00 0:00 12:00 0:00
Dis
char
ge (c
fs)
North Creek Watershed Outlet Hydrographs First Quartile
SCS Type II(TP40)
SCS Type II(Atlas 14)
Nested
resourceful. naturally.
5.A. watershed outlet hydrograph comparison for 24-hour, 100-year storm (North Creek)
0
500
1000
1500
2000
2500
0:00 12:00 0:00 12:00 0:00 12:00 0:00
Dis
char
ge (c
fs)
North Creek Watershed Outlet Hydrographs First Quartile
Second Quartile
SCS Type II(TP40)
SCS Type II(Atlas 14)
Nested

resourceful. naturally.
5.A. Watershed outlet hydrograph comparison for 24-hour, 100-year storm (North Creek)
0
500
1000
1500
2000
2500
0:00 12:00 0:00 12:00 0:00 12:00 0:00
Dis
char
ge (c
fs)
North Creek Watershed Outlet Hydrographs First Quartile
Second Quartile
Third Quartile
SCS Type II(TP40)
SCS Type II(Atlas 14)
Nested

resourceful. naturally.
5.A. watershed outlet hydrograph comparison for 24-hour, 100-year storm (North Creek)
0
500
1000
1500
2000
2500
0:00 12:00 0:00 12:00 0:00 12:00 0:00
Dis
char
ge (c
fs)
North Creek Watershed Outlet Hydrographs First Quartile
Second Quartile
Third Quartile
Fourth Quartile
SCS Type II(TP40)SCS Type II(Atlas 14)Nested

resourceful. naturally.
5.A. North Creek modeling summary
• nested distribution produced highest peak discharge at watershed outlet (13 sq mi) for 100-year, 24-hour storm

resourceful. naturally.
5.B. Lakes Edina-Cornelia modeling
• compared runoff depth • compared peak
subwatershed runoff rate changes
• compared peak elevations for lakes

resourceful. naturally.
5.B. average runoff depth from pervious area (Edina-Cornelia)
0
1
2
3
4
5
6
7
SCS Type II(TP40)
FirstQuartile
SecondQuartile
ThirdQuartile
FourthQuartile
SCS Type II(Atlas 14)
Nested
Run
off D
epth
(inc
hes)
Comparison of average subwatershed runoff depth for 100-year, 24-hour storm

resourceful. naturally.
5.B. pervious area peak runoff rate: average change from SCS Type II – TP40
-100%
-80%
-60%
-40%
-20%
0%
20%
40%
60%
First Quartile SecondQuartile
ThirdQuartile
FourthQuartile
SCS Type II(Atlas 14)
Nested
Peak
runo
ff ra
te c
hang
e (A
vera
ge, %
)
Comparison of average subwatershed pervious area peak runoff rate For 100-year, 24-hour storm

resourceful. naturally.
5.B. lake elevation change from SCS Type II - TP40, 100-year, 24-hour event
-0.5
0.0
0.5
1.0
1.5
2.0
2.5
3.0
3.5
FirstQuartile
SecondQuartile
ThirdQuartile
FourthQuartile
SCS Type II(Atlas 14)
Nested
Peak
ele
vatio
n ch
ange
(ft
)
Lake Edina
24-hour

resourceful. naturally.
5.B. lake elevation change from SCS Type II - TP40, 100-year, 24-hour event
-0.5
0.0
0.5
1.0
1.5
2.0
2.5
3.0
3.5
FirstQuartile
SecondQuartile
ThirdQuartile
FourthQuartile
SCS Type II(Atlas 14)
Nested
Peak
ele
vatio
n ch
ange
(ft
)
North Cornelia
24-hour

resourceful. naturally.
5.B. lake elevation change from SCS Type II - TP40, 100-year, 24-hour event
-0.5
0.0
0.5
1.0
1.5
2.0
2.5
3.0
3.5
FirstQuartile
SecondQuartile
ThirdQuartile
FourthQuartile
SCS Type II(Atlas 14)
Nested
Peak
ele
vatio
n ch
ange
(ft
)
South Cornelia
24-hour

resourceful. naturally.
5.B. Lake Edina / Lake Cornelia modeling summary
• nested distribution produces highest average runoff depth and peak discharges for subwatersheds
• lake level impacts – peak lake elevations vary less than subwatershed
peak discharges – nested distribution produces highest lake
elevations
resourceful. naturally.
5.C. residential development rate control pond
• north metro development (Coon Creek) • Coon Creek WD managing to Atlas 14 • includes rate control pond and several WQ
BMPs • 15 acres tributary to rate control pond, 43%
impervious • modeled Atlas 14 and TP-40 depths using SCS
Type II

resourceful. naturally.
5.C. residential development rate control pond
• result: houses elevated additional half a foot to achieve required freeboard
100-Year, 24 Hour Storm
Rainfall Depth (in)
Pond Elevation
(feet)
TP-40 5.8 897.34
Atlas 14 7.17 897.91

resourceful. naturally.
6. implications for water planners, designers, and regulators
• when to start using Atlas 14 numbers? • what storm distribution should be used? • changes to permitting, ordinances, policies, and standards • legal implications of using or not using Atlas 14 results
Barr Engineering Utica Ravine stabilization project in Savage, MN

resourceful. naturally.
6. implications for water planners, designers, and regulators
• difference between 10- and 100-year events are greater: existing municipal storm sewer may not be undersized, but flood control could be undersized
http://minnesota.publicradio.org/display/web/2010/06/25/severe-weather http://minnesota.publicradio.org/display/web/2010/06/25/severe-weather
resourceful. naturally.
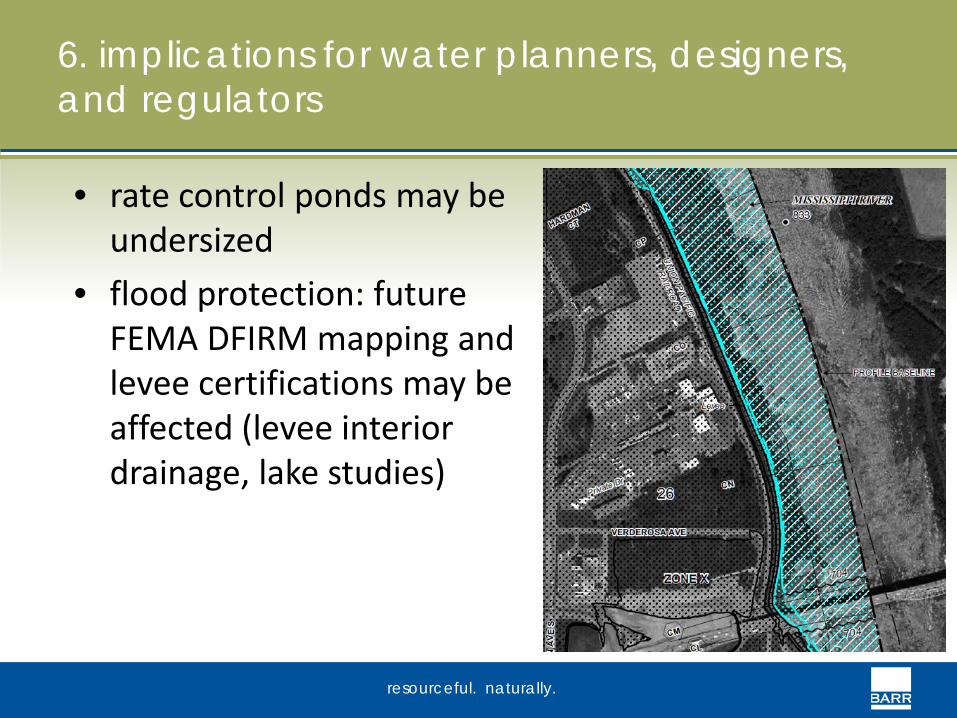
6. implications for water planners, designers, and regulators
• rate control ponds may be undersized
• flood protection: future FEMA DFIRM mapping and levee certifications may be affected (levee interior drainage, lake studies)
http://minnesota.publicradio.org/display/web/2010/06/25/severe-weather

resourceful. naturally.
6. implications: possible approaches for water planners, designers, and regulators
• adjust freeboard requirements • take advantage of opportunities to mitigate
impacts: – safe overflow routes – increase storage – larger easements
Thompson Lake rainwater garden
http://www.dakotacountyswcd.org/pdfs/sw_retrofit_plan_full.pdf
resourceful. naturally.
Rainfall Atlas 14: Replacement of Technical Paper 40
Implications and Case Studies
Presentation to the Minnesota Water Resources Conference
October 15, 2013 Karen Chandler
questions?

COMMUNITY STORMWATER RESPONSE TO A CHANGING LANDSCAPE AND CLIMATE: A FRAMEWORK FOR ADAPTATION PLANNING AND IMPLEMENTATION
Trisha Moore, John Gulliver (University of Minnesota), Leslie Yetka (Minnehaha Creek Watershed District), James Gruber (Antioch University of New England) Minnesota Water Resources Conference October 15, 2013

http://stormwater.safl.umn.edu/
Project Team and Partners
This study was funded through a grant from the National Oceanic Atmospheric Administration SARP program.
http://stormwater.safl.umn.edu/

http://stormwater.safl.umn.edu/
Stormwater & Climate Change: framework for adaptation planning and
implementation
• Vulnerability assessment – Climate model…how is rainfall distribution projected to change?
– Stormwater / Urban drainage model…is capacity of
existing SW infrastructure adequate?
• Assessing adaptation alternatives
• Outreach & community planning

http://stormwater.safl.umn.edu/
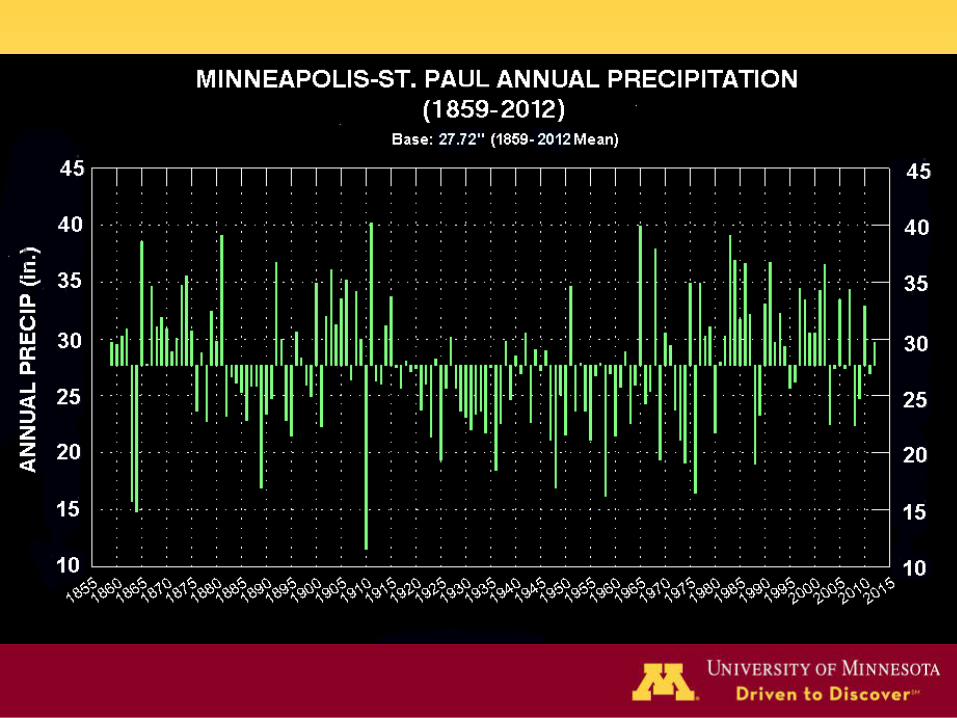
Recent Climate Trends
Occurrence of heavy precipitation events (largest 1% of all events) has increased 31% across the Great Lakes Region.
Updated from Groisman et al., 2005 Stockton, MN - FEMA
http://stormwater.safl.umn.edu/
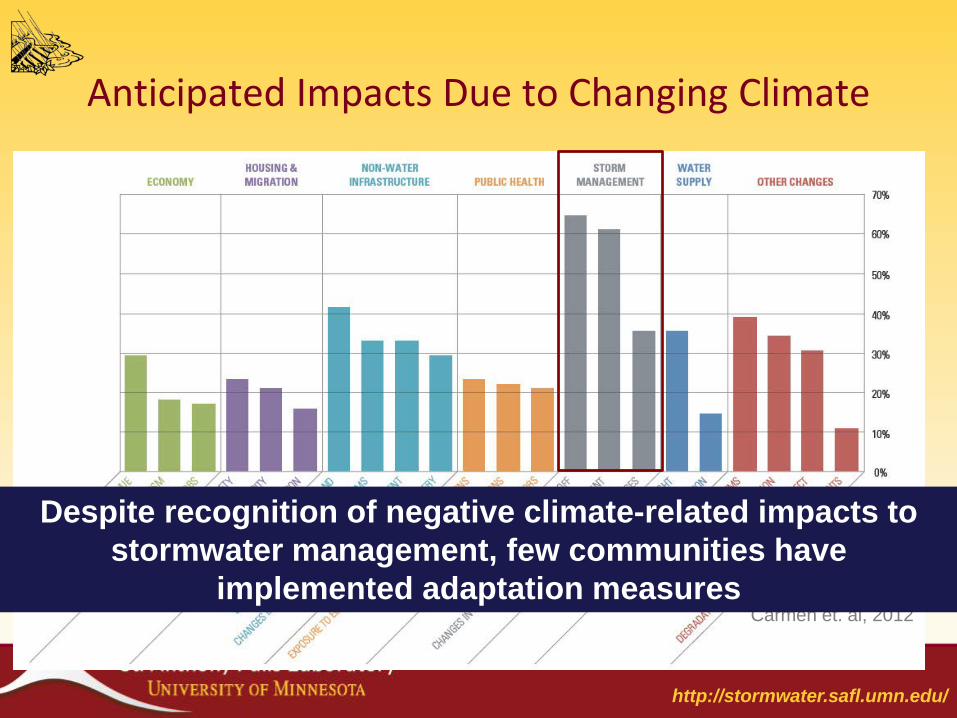
Anticipated Impacts Due to Changing Climate
Carmen et. al, 2012
Despite recognition of negative climate-related impacts to stormwater management, few communities have
implemented adaptation measures

http://stormwater.safl.umn.edu/
Study Goal Provide adaptation
framework for local communities to address changes in precipitation patterns and land use to reduce: 1. the risk of flooding 2. impacts to stormwater
infrastructure and downstream water resources
Duluth, MN 2012 - MN Sea Grant

http://stormwater.safl.umn.edu/
Objectives
1. Identify the vulnerability of local stormwater infrastructure and downstream water resources to changes in precipitation and land use.
2. Identify local and specific adaptation options, including costs.
3. Engage stakeholders to identify strategies that promote community adaptation and inform local decision-makers.
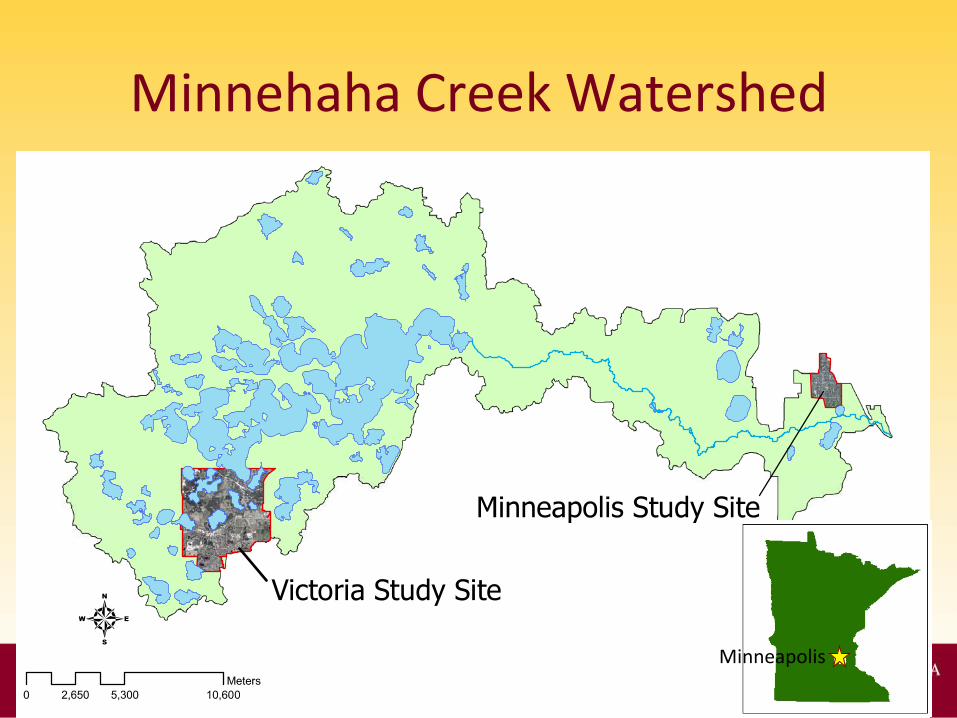
Minnehaha Creek Watershed
Minneapolis

Urban Case study: Lake Hiawatha watershed (S. Minneapolis)
1100 ac Pipeshed •50% impervious •3 detention basins •20 miles of pipes
Pipeshed outlet at Lake Hiawatha

http://stormwater.safl.umn.edu/
Rural Case study: City of Victoria 1145 ac Watershed
•31 Stormwater ponds •8 natural lakes & wetlands •12 miles pipes; 3 miles open channel

http://stormwater.safl.umn.edu/
Victoria: Climate AND
Land Use Changes
Red shading denotes areas of future development
Existing: 14% impervious Projected buildout: 29% impervious
Study watershed outlet
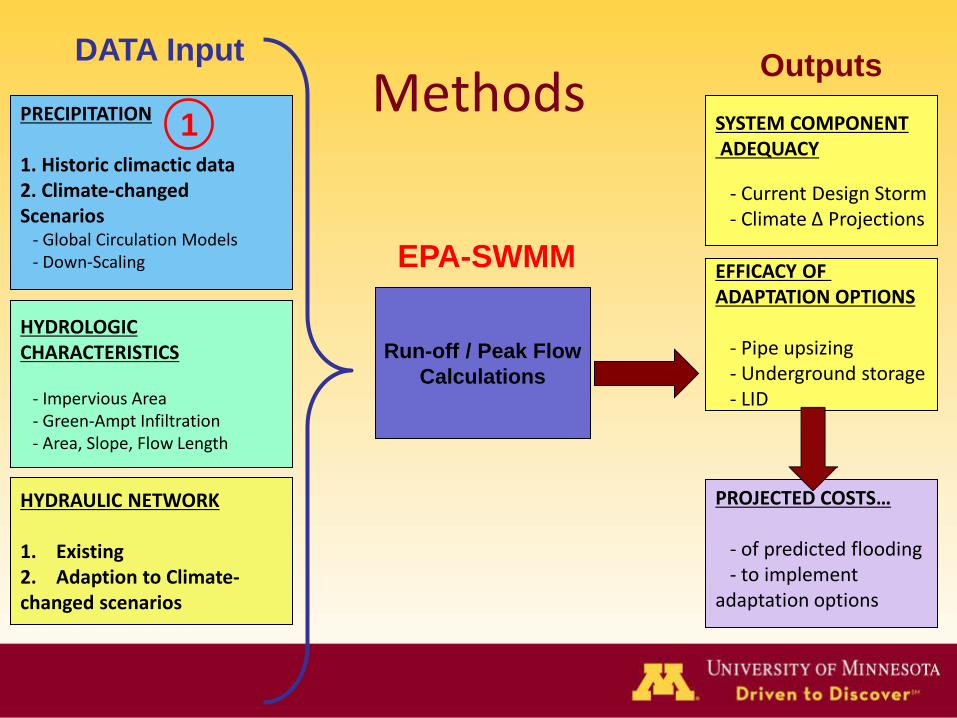
Run-off / Peak Flow Calculations
EPA-SWMM
Methods
HYDROLOGIC CHARACTERISTICS - Impervious Area - Green-Ampt Infiltration - Area, Slope, Flow Length
HYDRAULIC NETWORK 1. Existing 2. Adaption to Climate- changed scenarios
PRECIPITATION 1. Historic climactic data 2. Climate-changed Scenarios - Global Circulation Models - Down-Scaling
DATA Input
SYSTEM COMPONENT ADEQUACY - Current Design Storm - Climate Δ Projections
EFFICACY OF ADAPTATION OPTIONS - Pipe upsizing - Underground storage - LID
PROJECTED COSTS… - of predicted flooding - to implement adaptation options
Outputs
1

http://stormwater.safl.umn.edu/
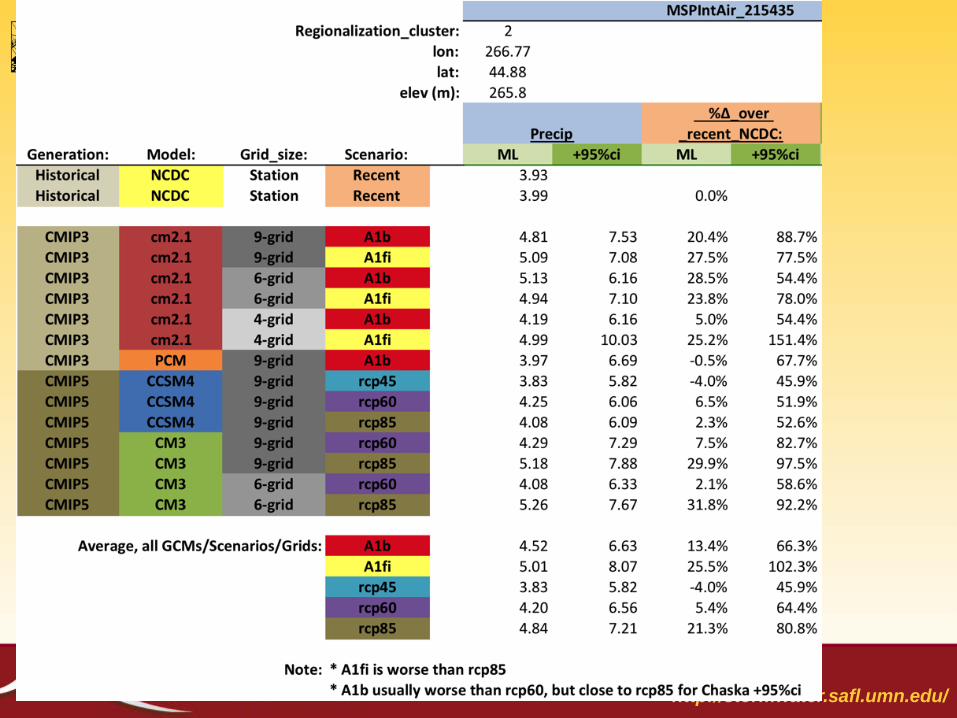
1. Vulnerability assessment: climate projections
Global climate models: GFDL CM2.1, CM3.0, PCM, CCSM4
Emission scenarios: A1b, Aifi, rcp45, rcp60, rcp85
Statistical downscaling by: 1. modified Delta 2. Empirical method

Return period (years)
Current 10-YR design Storm
(TP40)
mid-21st cent. Optimistic
(A1b)
mid-21st cent. Moderate
(A1fi)
mid-21st cent. Pessimistic
(A1fi, upper 95th C.I.)
2.5 2.8 2.84 3.3 6.86
5 3.6 3.47 4.11 8.4
7.5 3.8 3.88 4.66 9.39
10 4.1 4.19 5.1 10.13
25 4.8 5.28 6.74 12.75
50 5.4 6.22 8.31 15.03
75 5.7 6.82 9.39 16.5
100 6.0 7.27 10.23 17.59
Climate modeling results: Current and Future
2% 24% 147%
SWMM Precipitation Inputs
Atlas 14 10YR, 24hr: 4.24 in (3.73-4.85 in)

2. Vulnerability assessment: H&H Modeling (EPA SWMM)
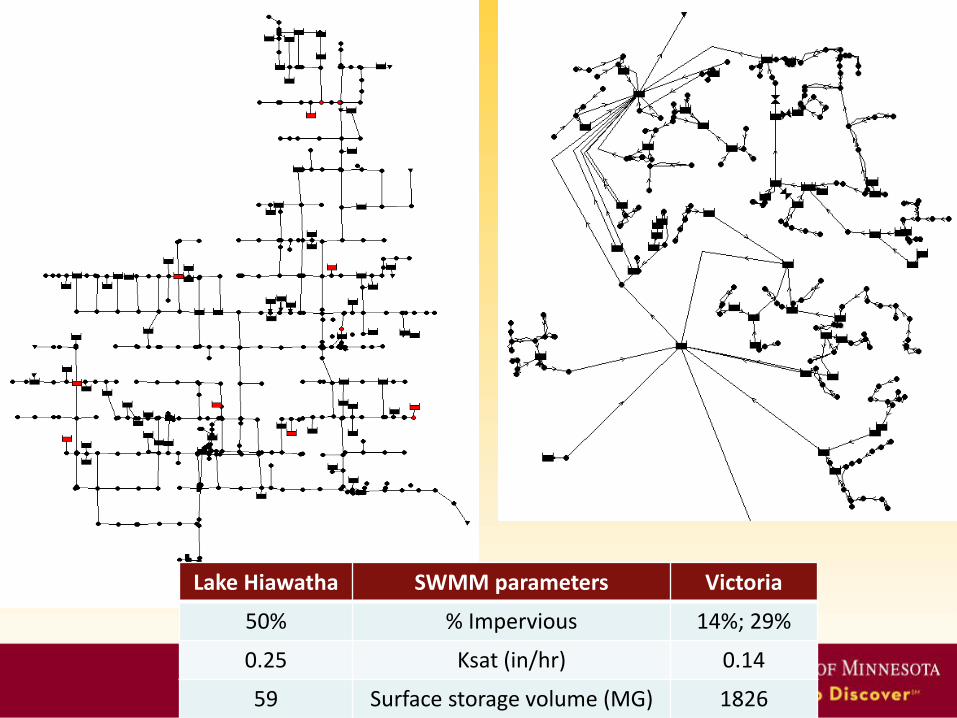
Lake Hiawatha SWMM parameters Victoria
50% % Impervious 14%; 29%
0.25 Ksat (in/hr) 0.14
59 Surface storage volume (MG) 1826

mid-21st Century “pessimistic”
mid-21st Century “moderate”
mid-21st Century “optimistic” Recent climate
Vulnerability Assessment
System Adequacy under climate change: urban case

Moderate emissions scenario
Optimistic emissions scenario
Pessimistic emissions scenario
System Adequacy: Flooding, Urban case
Vulnerability Assessment
05
1015202530354045
0% 50% 100% 150%
Floo
d Vo
lum
e (M
G)
% Increase over Current 10-yr Design
Total Flood Volume
Street Storage
Over-curb Flooding
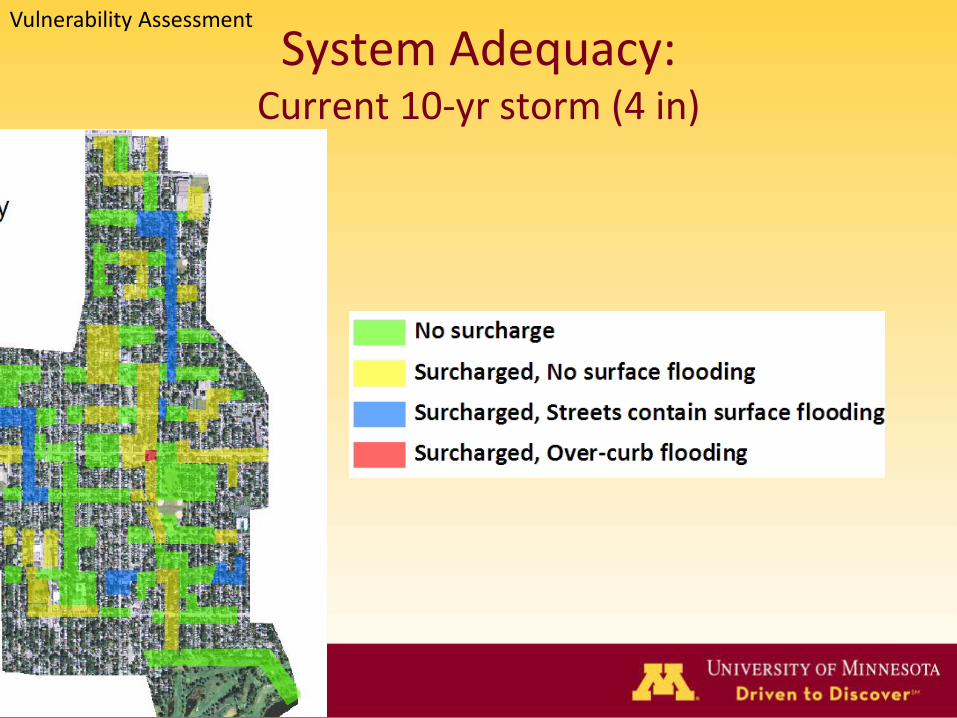
System Adequacy: Current 10-yr storm (4 in)
Vulnerability Assessment

System Adequacy: “Moderate” mid-century 10-yr storm (6.5 in)
Vulnerability Assessment

System Adequacy: “Pessimistic” mid-century 10-yr storm (10.1 in)
Vulnerability Assessment

SWMM to model Adaptation Options
Infiltrate/LID
Do Nothing
Underground Storage
Upsize Infrastructure

0.01
0.10
1.00
10.00
100.00
3 5 7 9 11
Floo
d Vo
lum
e (M
G)
Precip Depth (inches)
Existing Pipe Up-sizing 10% LID 15% LID
20% LID 25% LID 100% LID
Adaptation scenarios: flooding impacts in Lake Hiawatha study site
Moderate Optimistic Pessimistic
http://stormwater.safl.umn.edu/
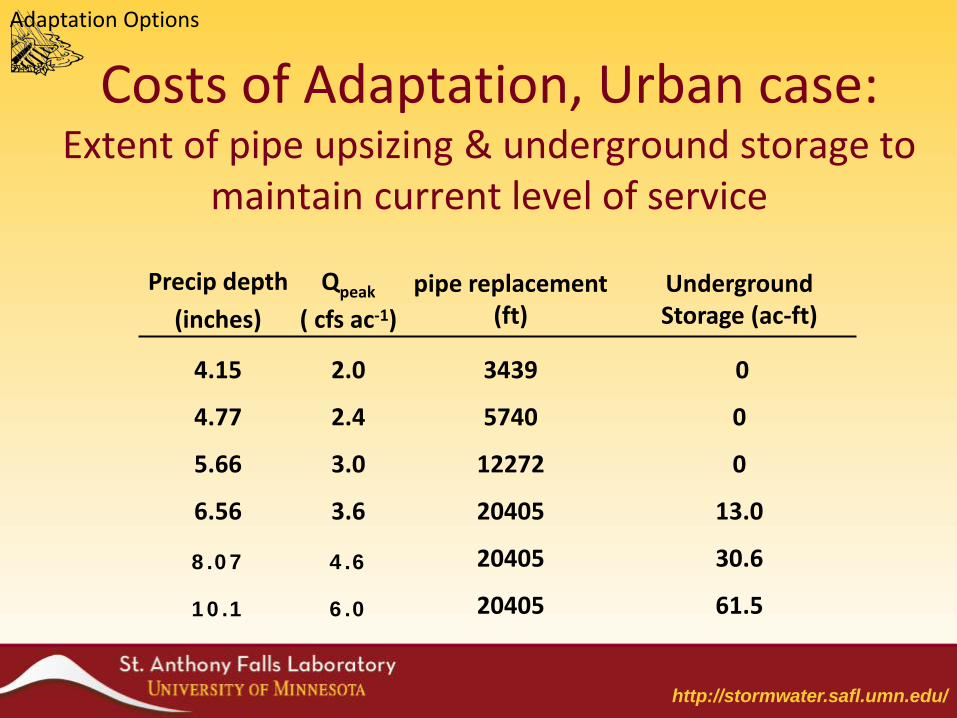
Precip depth Qpeak pipe replacement (ft)
Underground Storage (ac-ft) (inches) ( cfs ac-1)
4.15 2.0 3439 0
4.77 2.4 5740 0
5.66 3.0 12272 0
6.56 3.6 20405 13.0
8.07 4.6 20405 30.6
10.1 6.0 20405 61.5
Adaptation Options
Costs of Adaptation, Urban case: Extent of pipe upsizing & underground storage to
maintain current level of service

http://stormwater.safl.umn.edu/
Costs of Adaptation, Urban case: Pipe upsizing & Underground storage to maintain LOS
Adaptation Options
Costs from City of MInneapolis
$0
$20,000,000
$40,000,000
$60,000,000
$80,000,000
$100,000,000
$120,000,000
$140,000,000
0% 25% 50% 75% 100% 125% 150% 175%% Increase over current 10-YR storm
Moderate Optimistic Pessimistic
http://stormwater.safl.umn.edu/
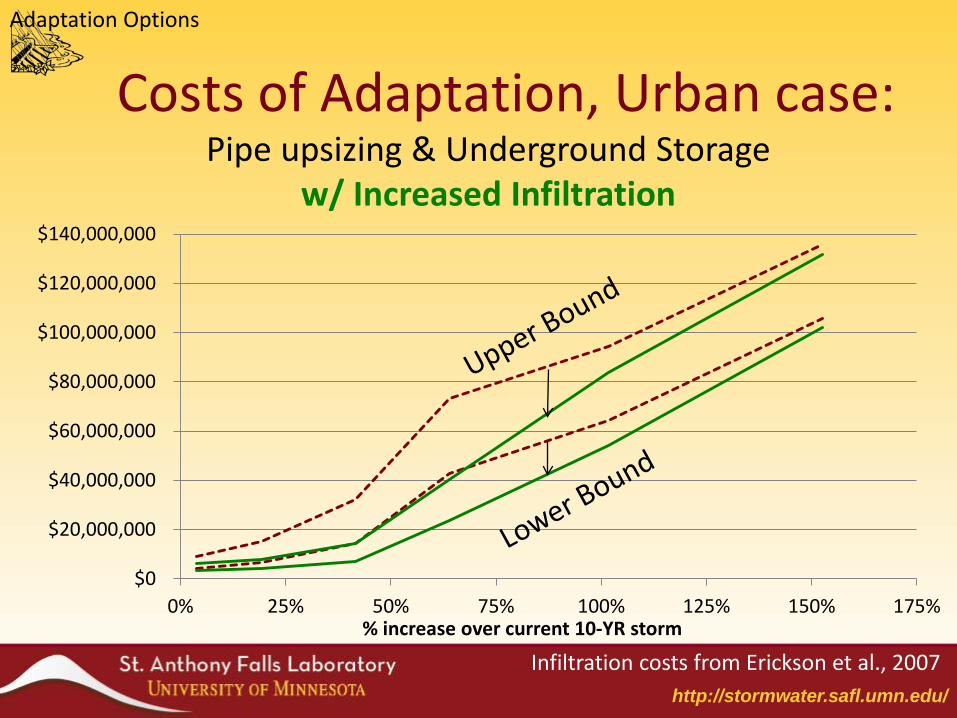
$0
$20,000,000
$40,000,000
$60,000,000
$80,000,000
$100,000,000
$120,000,000
$140,000,000
0% 25% 50% 75% 100% 125% 150% 175%% increase over current 10-YR storm
Costs of Adaptation, Urban case: Pipe upsizing & Underground Storage
w/ Increased Infiltration
Adaptation Options
Infiltration costs from Erickson et al., 2007
http://stormwater.safl.umn.edu/
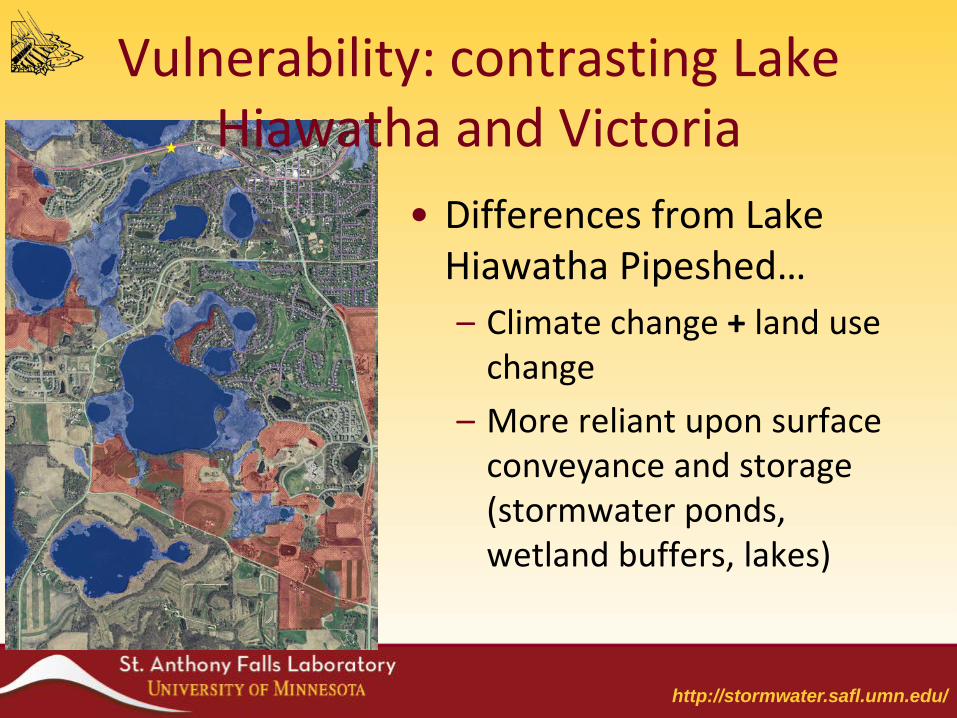
• Differences from Lake Hiawatha Pipeshed… – Climate change + land use
change – More reliant upon surface
conveyance and storage (stormwater ponds, wetland buffers, lakes)
Vulnerability: contrasting Lake Hiawatha and Victoria

http://stormwater.safl.umn.edu/
Vulnerability: contrasting Lake Hiawatha and Victoria
Victoria
Lake Hiawatha
Moderate Optimistic Pessimistic
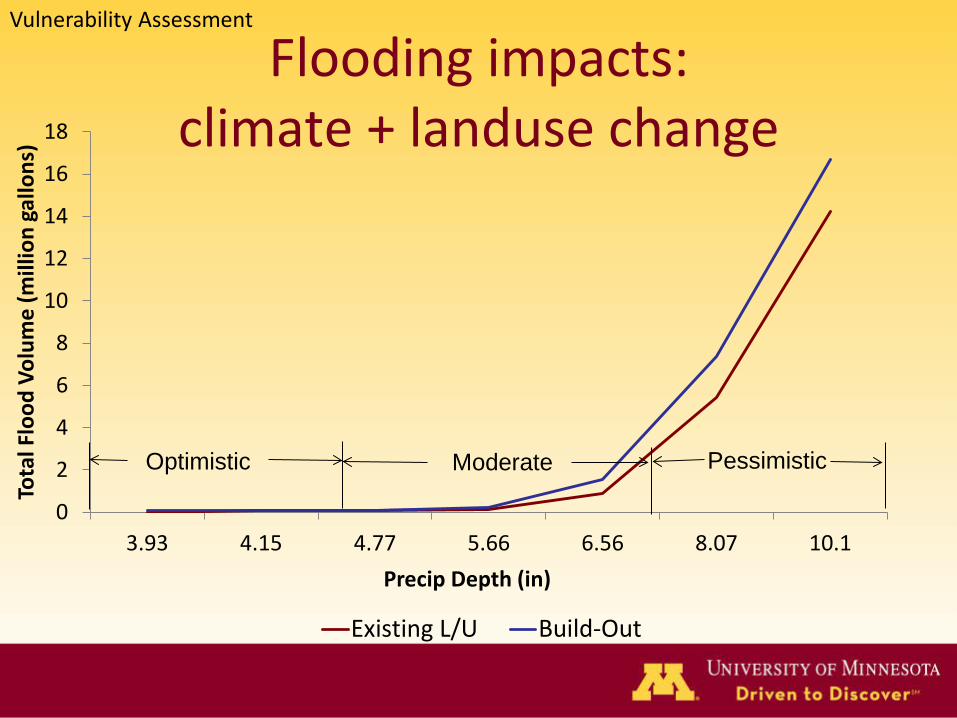
0
2
4
6
8
10
12
14
16
18
3.93 4.15 4.77 5.66 6.56 8.07 10.1
Tota
l Flo
od V
olum
e (m
illio
n ga
llons
)
Precip Depth (in)
Existing L/U Build-Out
Flooding impacts: climate + landuse change
Vulnerability Assessment
Moderate Optimistic Pessimistic

Victoria System
Adequacy: Current 10-yr storm (4 in)
Vulnerability Assessment

Victoria System
Adequacy: “Moderate” mid-
century 10-yr storm (6.5 in)
Vulnerability Assessment

System Adequacy:
“Pessimistic” mid-century 10-yr storm
(10.1 in)
Vulnerability Assessment
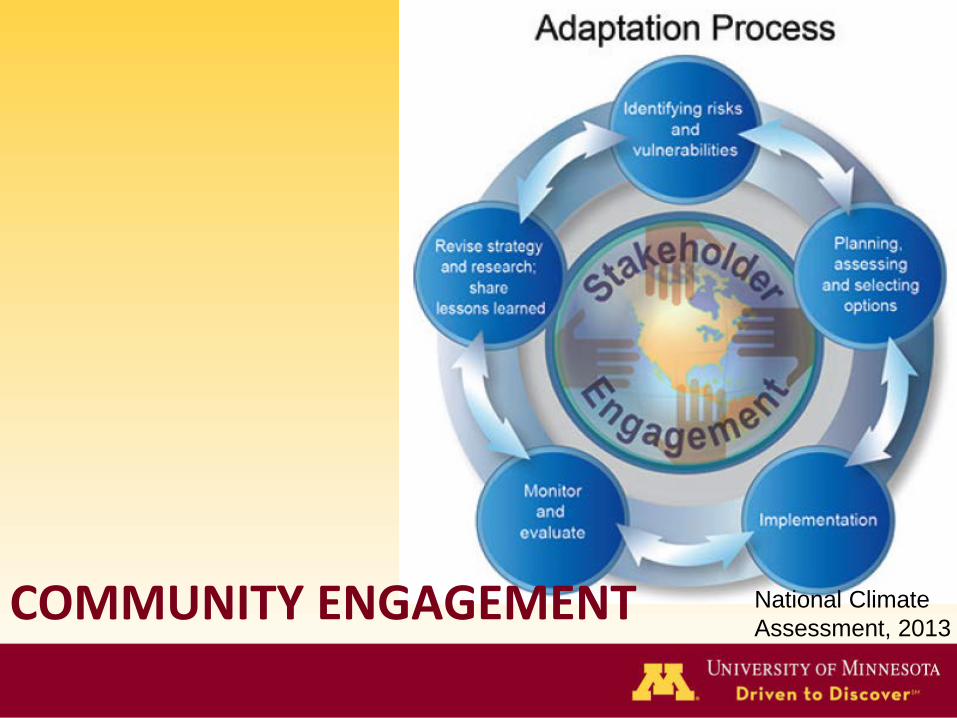
COMMUNITY ENGAGEMENT National Climate Assessment, 2013

http://stormwater.safl.umn.edu/
Why involve the public?
1.Improve quality of work 2.Improve legitimacy 3.Improve capacity of
environmental assessment & decisions

http://stormwater.safl.umn.edu/
Stakeholder Engagement Process
• Study Newsletter/Website • Forums (2) • Adaptation Work Groups (4) • Community Meetings (3-4) • Regional Symposium • Advisory Committee • Study Evaluation
Municipal Officials City Staff Regional Agencies State agencies Federal Agencies Non-Profits Homeowner Assoc. Lake Associations Academia Builders Developers Landowners Insurance Utilities

http://stormwater.safl.umn.edu/
Take Home Points • Projected climate changes present significant
challenges, esp. built-out environments – Need to consider downstream impacts of pipe
upsizing – Need to incorporate non-stationarity of climate in new
construction and retrofits
• Best bet in building resilience in climate uncertainty: Conservation development policies that retain hydrologic ecosystem services!!

http://stormwater.safl.umn.edu/
Thank you!
Additional information can be found at:
www.minnehahacreek.org/WET
http://stormwater.safl.umn.edu/

http://stormwater.safl.umn.edu/
The frequency of intense storms in our region has increased, and climate projections indicate that trend will continue.
The capacity of existing stormwater infrastructure may be inadequate in our communities, resulting in more frequent
flooding and impacts to infrastructure, public safety, and the quality of downstream water bodies. Development and
redevelopment can exacerbate the problem, but also provide an opportunity for communities to make sound planning
decisions that reflect adaptation to our new environment. A two-year study within the Minnehaha Creek watershed
focused on community stormwater adaptation in two cities, the urban City of Minneapolis and the suburban
community of Victoria. Results of this study provide a framework for community adaptation planning, including risk
and vulnerability assessments, planning and implementation strategies, and a stakeholder engagement process that
increases the capacity of a community to respond to a changing environment.

http://stormwater.safl.umn.edu/
http://stormwater.safl.umn.edu/

http://stormwater.safl.umn.edu/
Options for local-scale design targets: • Downscale: - Contract out for it - via universities with climate change research programs - In-house via NARCCAP and in-house IT/stat guru (1/8° resolution) • Don’t downscale: - Use national/regional reports, research articles - Historical 200/250-year (100-year is better than nothing) Chart: Return period x precip - Bottom-up (no downscaling)

http://stormwater.safl.umn.edu/ 11/8/2013 46 Minnehaha Creek Watershed
10-yr Event
Flood Volume
Increase Undersized Pipes Reduce Street Flooding Create Flood Storage
MG Ft of Pipe
After pipe upsizing
(MG) Cost
Excess Street (MG) Cost
3.9” 0.07 0 0% $0 0 $0
6.6” 1.6 4,199 -75% $205,000 0.91 $150,000-$575,000
10.1” 16.9 14,132 -30% $775,000 7.47 $1,015,000-$2,350,000
Options for Adaptation - Victoria
*LID does not provide effective flood control during large storm events
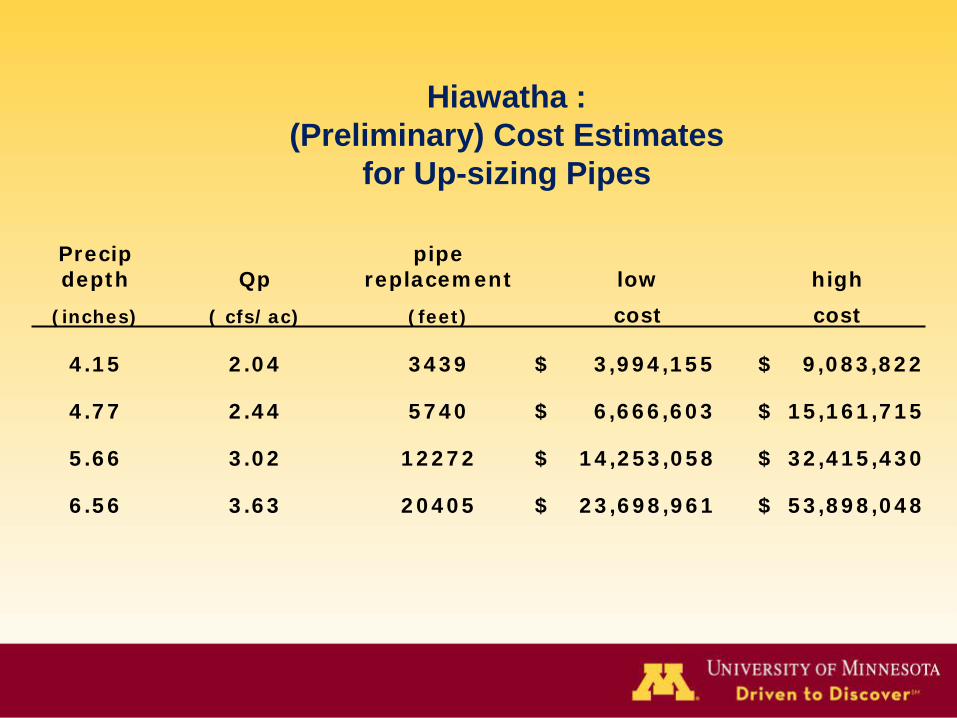
Precip depth Qp
pipe replacement low high
(inches) ( cfs/ac) (feet) cost cost
4.15 2.04 3439 $ 3,994,155 $ 9,083,822
4.77 2.44 5740 $ 6,666,603 $ 15,161,715
5.66 3.02 12272 $ 14,253,058 $ 32,415,430
6.56 3.63 20405 $ 23,698,961 $ 53,898,048
Hiawatha : (Preliminary) Cost Estimates
for Up-sizing Pipes

Excess Vol.
Flooding w/ pipe Estimated # of projects
Precipitation Volumes upsizing Excess Vol. Underground Basin comparable
(Mgal) (Mgal) acre-feet Costs to 37th ave
6.56 10.1 4.2 13.0 $ 9,833,167 4
8.07 20.0 10.0 30.6 $ 23,149,155 9
10.1 40.1 20.0 61.5 $ 46,502,636 18
Hiawatha : Underground Storage Cost Estimates for
Post-Piping Upgrade Volumes (preliminary)