raising expectations final v2 · pdf fileraising expectations and achievement. ... 2003). the...
TRANSCRIPT

Raising Expectations and Achievement. The Impact of Wide Scale Mathematics Reform Giving All Students Access to High Quality Mathematics
Jo Boaler, Stanford University, co-founder: www.youcubed.org David Foster, Executive Director, Silicon Valley Mathematics Initiative
Abstract !This!paper!shows!evidence!of!a!professional!development!intervention!given!to!8!school!districts!in!California.!
When!teachers!de9tracked!classes,!taught!all!students!high9level!work,!engaged!students!in!rich!tasks!and!used!
formative!assessment,!student!learning!of!mathematics!increased!dramatically.!The!intervention!districts!were!
contrasted!with!other!districts!who!did!not!engage!teachers!in!new!ways!of!working.!The!students!in!the!
intervention!districts!significantly!outperformed!students!in!the!comparison!districts!on!CST!and!MARS!tasks.!
This!paper!reviews!the!reasons!for!lower!achievement!in!tracked!classes,!and!the!value!both!of!formative!
assessment!and!rich!mathematics!tasks.!
Introduction Proposals to change school mathematics often prompt considerable controversy in the United States and even declarations of “war” (Boaler, 2009; Rosen, 2001; Wilson, 2002). Traditionalists fight to keep mathematics classrooms with the same curriculum and canonical pedagogy that has endured for centuries, particularly if it worked for them in school. This is despite a solid base of research evidence showing the positive impact of classroom changes that include teaching a broader mathematics and engaging students actively in their learning (Boaler, 2009; Schoenfeld, 2002). The data on students’ mathematics achievement in the US speaks to the need for change, with approximately three fifths of students in the US failing mathematics in K-16 schooling (Silva & White, 2013), and the country occupying a lowly 36th place out of 65 countries in international tests of mathematics achievement (PISA, 2012). In a recent survey over 50% of middle school children said they would rather eat broccoli than do mathematics (Raytheon-Company, 2012). Mathematics is also the most inequitable of all subjects with shocking levels of underachievement for students of color and those from under-resourced homes (Kozol, 2012; Rousseau & Tate, 2003). The plethora of data on mathematics failure, disinterest and inequity comes at a time when the need for quantitative literacy among the population is higher than it is ever been (Boaler, 2013b; Wolfram, 2010). Despite this data and the ‘math crisis’ that is widely recognized, some traditional groups work tirelessly to keep the forms of mathematics teaching that have produced the state of failure and inequality in classrooms across the US. The Common Core mathematics standards – the new curriculum standards that are being rolled out in most school districts across the US – have made small shifts in the mathematics content that is to be taught in schools accompanied by much more significant shifts in the ways of working that are recommended for classrooms (http://www.corestandards.org/). The mathematical practice standards of the Common Core do not introduce new knowledge to be learned but the mathematical actions used by mathematicians and that are needed for successful work and living in the new technological age (Boaler, 2013b; RAND, 2002, October). These include such
!
!
!
!
! 2!
important actions as problem solving, making sense of mathematics, persevering, reasoning and communicating mathematics in different ways. The introduction of the Common Core mathematics standards and their associated assessments has prompted resistance from many different camps, something that is to be expected when wide-scale societal change is proposed (Rosen, 2001). The most organized resistance comes from an alliance that has seen some political groups, who associate the new curriculum with political opponents, team up with long standing traditional camps who oppose any changes to school mathematics. Other, less predictable opposition is coming from parents, some of whom fear change because their children have been successful in the traditional model of mathematics instruction that is being reformed and some who fear that their children will not be able to work in the more demanding ways set out in the Common Core (Engel, 2014). Questions as to whether teachers are capable of changing their teaching and taking children to higher mathematical levels accompany these concerns. Within this context the data we report in this paper, showing the impact of a careful program of professional development with eight Californian school districts, when teachers were trained to implement a model of teaching that is consistent with the new common core mathematics standards, seems particularly important to share. Teacher change that is associated with student learning requires high quality professional development, in which teachers learn to engage in high-level mathematics themselves and during which they learn the pedagogical and assessment practices that raise students’ achievement (Borko, 2004; Boston & Smith, 2009). Some of those opposing the Common Core say that large-scale teacher change is an impossible goal, but school districts have the funding needed to train their teachers (http://www.cde.ca.gov/fg/fo/profile.asp?id=3434) and Universities have provided the research knowledge that is needed to form the content of the professional development, with evidence both of what works in classrooms (Boaler, 2009; Schoenfeld, 2002) and of ways to bring about teacher change (Borko, 2004; Boston & Smith, 2009). There is widespread belief that teachers only change when they receive ongoing and high quality professional development, and this is certainly the gold standard for change, but recent innovations, including an 8 week online course that changed teachers’ practices (Stanford, 2013) offer some challenge to the idea that professional development needs to be long-term and even face to face (https://ed.stanford.edu/news/new-online-course-learning-love-math). Online interventions are in their infancy and in need of careful study but they add useful data on the content of professional development that teachers need in order to bring about change. In the intervention that we report here professional development was provided to middle school teachers in eight school districts in California and their students’ achievement was compared to students in twenty-five other school districts who did not receive the professional development and provide a matched comparative sample. In the remainder of this paper we describe the professional development that was given to teachers, the classroom and grouping changes that were made, and the achievement of the students who learned through the new teaching approach, compared to those who worked in more traditional ways.
!
!
!
!
! 3!
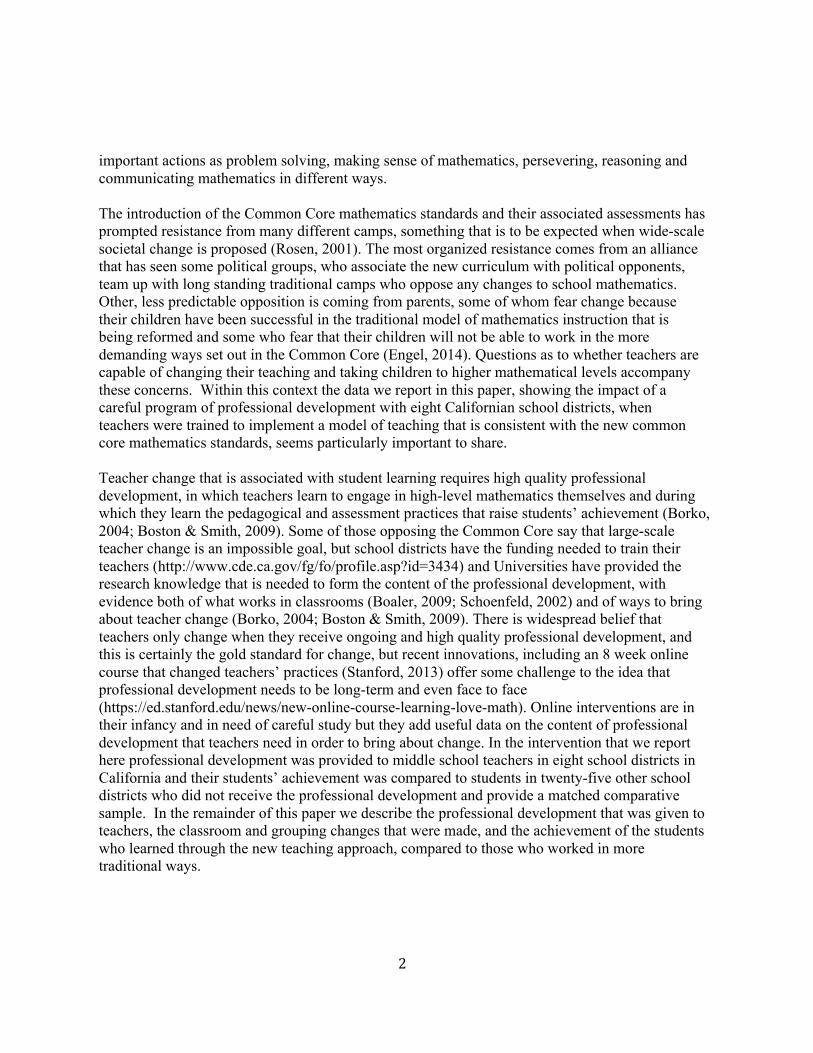
The Intervention The Silicon Valley Mathematics Initiative (SVMI) has worked with public school districts, private schools and charter schools since 1996 delivering professional development aimed at improving mathematics instruction and student learning. SVMI’s theory of action is that teachers improve their teaching when they learn new knowledge and skills through ongoing, comprehensive, intensive professional development and that improved achievement is an outcome of their improved instruction.
SVMI’s professional development teaches a cycle whereby teachers focus on high standards by assessing students’ work to the standards, examining students’ products and analyzing student understandings, then developing effective educational strategies and practices that are consistent with the findings, tailoring instruction to enhance student learning and understanding. Teachers are taught to have high expectations for all students and to teach high-level work to all students, not only some students who have been categorized as being more capable than others. During the 2005–06 school year, SVMI invited districts to participate in a program to improve instruction in mathematics for the middle grades, six through eight, accompanied by a study to measures its effectiveness. Twenty-five school districts submitted proposals for intensive professional development. SVMI selected eight school districts based upon a wide set of criteria including student diversity, stable leadership, and commitment. These eight districts were identified as districts who were interested in three general principles; 1) equity and access for all students 2) high expectations and support for all students, and 3) teaching a balanced program of mathematics concepts and procedures as well as mathematical problem solving. The study was conducted at the height of the No Child Left behind Era when many districts were focused on improving scores on high stakes exams. California had adopted a policy that required all eighth grade students be proficient in Algebra 1 but 65% of students in California were not meeting that standard. The SVMI theory of action called for intensive professional development for mathematics teachers and support for collaboration within the mathematics departments as they moved to teach more meaningful mathematics to all of their students. Over the next three years, the middle school teachers participated in a summer five-day institute and eight full days of professional development sessions during each school year. The professional development included cycles of formative assessment, whereby teachers administered rich performance tasks from MARS (Foster, Noyce, & Spiegal, 2007; Paek & Foster, April 15 2012) examined student work and planned re-engagement lessons that they taught to their students. Three MARS tasks are shown in the
!
!
!
!
! 4!
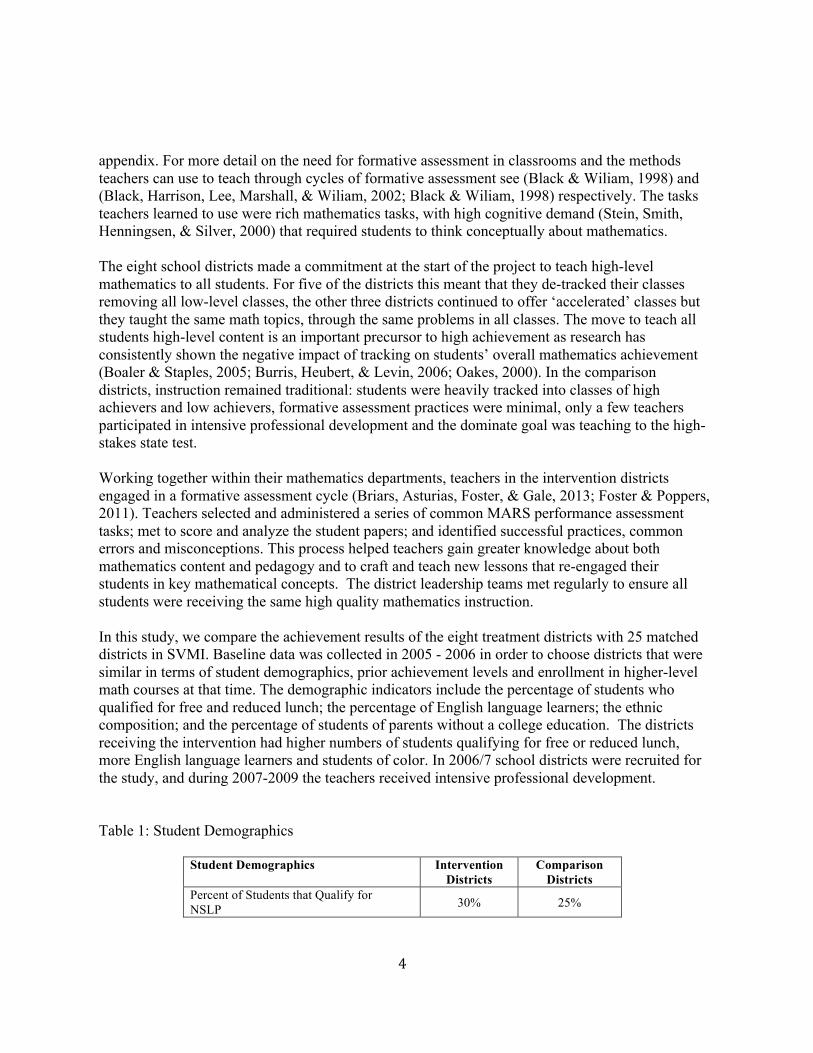
appendix. For more detail on the need for formative assessment in classrooms and the methods teachers can use to teach through cycles of formative assessment see (Black & Wiliam, 1998) and (Black, Harrison, Lee, Marshall, & Wiliam, 2002; Black & Wiliam, 1998) respectively. The tasks teachers learned to use were rich mathematics tasks, with high cognitive demand (Stein, Smith, Henningsen, & Silver, 2000) that required students to think conceptually about mathematics. The eight school districts made a commitment at the start of the project to teach high-level mathematics to all students. For five of the districts this meant that they de-tracked their classes removing all low-level classes, the other three districts continued to offer ‘accelerated’ classes but they taught the same math topics, through the same problems in all classes. The move to teach all students high-level content is an important precursor to high achievement as research has consistently shown the negative impact of tracking on students’ overall mathematics achievement (Boaler & Staples, 2005; Burris, Heubert, & Levin, 2006; Oakes, 2000). In the comparison districts, instruction remained traditional: students were heavily tracked into classes of high achievers and low achievers, formative assessment practices were minimal, only a few teachers participated in intensive professional development and the dominate goal was teaching to the high-stakes state test. Working together within their mathematics departments, teachers in the intervention districts engaged in a formative assessment cycle (Briars, Asturias, Foster, & Gale, 2013; Foster & Poppers, 2011). Teachers selected and administered a series of common MARS performance assessment tasks; met to score and analyze the student papers; and identified successful practices, common errors and misconceptions. This process helped teachers gain greater knowledge about both mathematics content and pedagogy and to craft and teach new lessons that re-engaged their students in key mathematical concepts. The district leadership teams met regularly to ensure all students were receiving the same high quality mathematics instruction. In this study, we compare the achievement results of the eight treatment districts with 25 matched districts in SVMI. Baseline data was collected in 2005 - 2006 in order to choose districts that were similar in terms of student demographics, prior achievement levels and enrollment in higher-level math courses at that time. The demographic indicators include the percentage of students who qualified for free and reduced lunch; the percentage of English language learners; the ethnic composition; and the percentage of students of parents without a college education. The districts receiving the intervention had higher numbers of students qualifying for free or reduced lunch, more English language learners and students of color. In 2006/7 school districts were recruited for the study, and during 2007-2009 the teachers received intensive professional development. Table 1: Student Demographics
Student Demographics
Intervention Districts
Comparison Districts
Percent of Students that Qualify for NSLP 30% 25%
!
!
!
!
! 5!
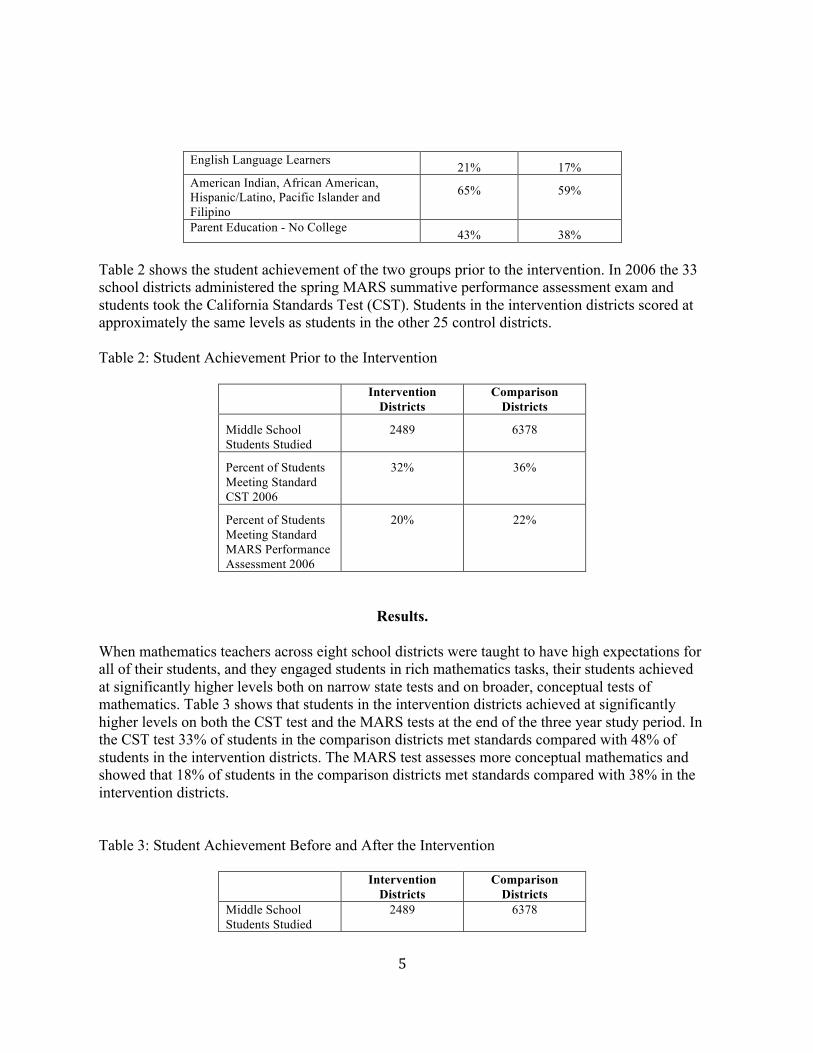
English Language Learners 21% 17% American Indian, African American, Hispanic/Latino, Pacific Islander and Filipino
65% 59%
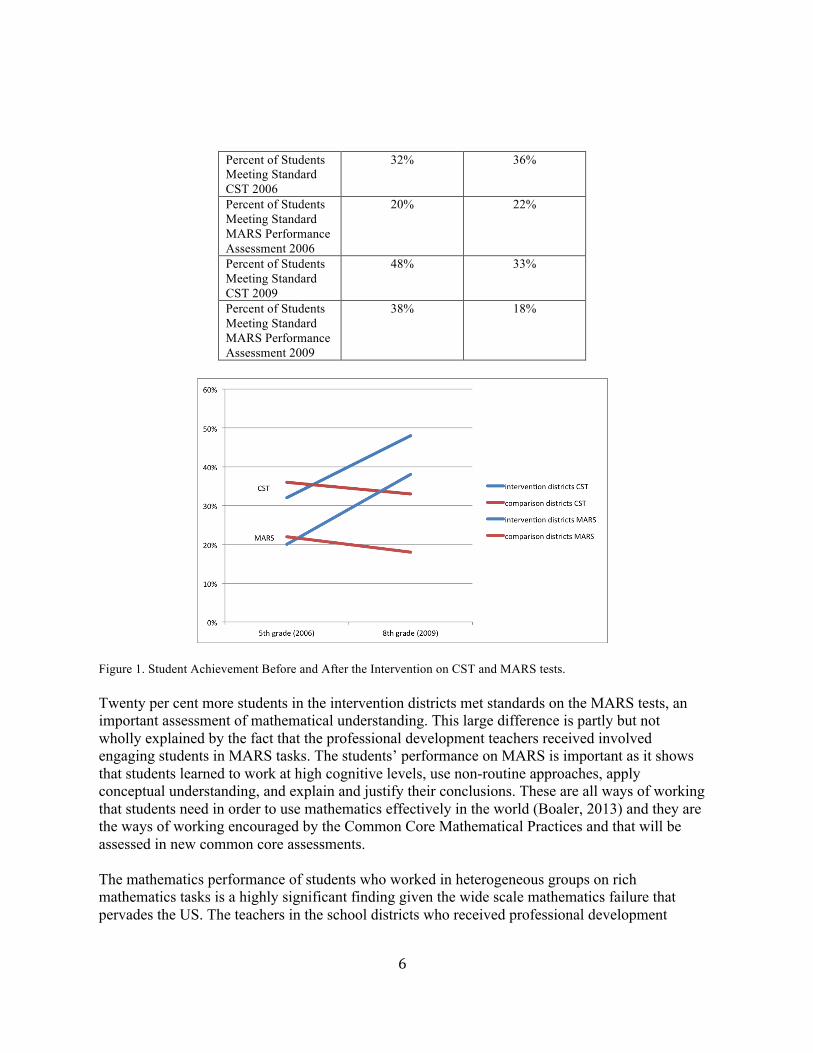
Parent Education - No College 43% 38% Table 2 shows the student achievement of the two groups prior to the intervention. In 2006 the 33 school districts administered the spring MARS summative performance assessment exam and students took the California Standards Test (CST). Students in the intervention districts scored at approximately the same levels as students in the other 25 control districts. Table 2: Student Achievement Prior to the Intervention
Intervention Districts
Comparison Districts
Middle School Students Studied
2489 6378
Percent of Students Meeting Standard CST 2006
32% 36%
Percent of Students Meeting Standard MARS Performance Assessment 2006
20% 22%
Results. When mathematics teachers across eight school districts were taught to have high expectations for all of their students, and they engaged students in rich mathematics tasks, their students achieved at significantly higher levels both on narrow state tests and on broader, conceptual tests of mathematics. Table 3 shows that students in the intervention districts achieved at significantly higher levels on both the CST test and the MARS tests at the end of the three year study period. In the CST test 33% of students in the comparison districts met standards compared with 48% of students in the intervention districts. The MARS test assesses more conceptual mathematics and showed that 18% of students in the comparison districts met standards compared with 38% in the intervention districts. Table 3: Student Achievement Before and After the Intervention
Intervention Districts
Comparison Districts
Middle School Students Studied
2489 6378
!
!
!
!
! 6!
Percent of Students Meeting Standard CST 2006
32% 36%
Percent of Students Meeting Standard MARS Performance Assessment 2006
20% 22%
Percent of Students Meeting Standard CST 2009
48% 33%
Percent of Students Meeting Standard MARS Performance Assessment 2009
38% 18%
Figure 1. Student Achievement Before and After the Intervention on CST and MARS tests. Twenty per cent more students in the intervention districts met standards on the MARS tests, an important assessment of mathematical understanding. This large difference is partly but not wholly explained by the fact that the professional development teachers received involved engaging students in MARS tasks. The students’ performance on MARS is important as it shows that students learned to work at high cognitive levels, use non-routine approaches, apply conceptual understanding, and explain and justify their conclusions. These are all ways of working that students need in order to use mathematics effectively in the world (Boaler, 2013) and they are the ways of working encouraged by the Common Core Mathematical Practices and that will be assessed in new common core assessments. The mathematics performance of students who worked in heterogeneous groups on rich mathematics tasks is a highly significant finding given the wide scale mathematics failure that pervades the US. The teachers in the school districts who received professional development
!
!
!
!
! 7!
implemented the recommended changes with high fidelity and at the end of the study 90% of the middle school math teachers reported engaging in formative assessment practices using the MARS bank of released tasks. Two-thirds of the intervention teachers also reported completing the formative assessment cycle, including designing and teaching re-engagement lessons. The teachers also reported that they planned to continue to teach using the new methods and tasks they had learned. As three of the teachers reported in interviews:
“I!haven’t!needed!to!pull!out!my!math!book,!because!I!feel!comfortable!pulling!out!a!rich!problem!and!
know!that!they’re!working!on!that!rich!problem!and!questioning!each!other!more!–!instead!of!a!worksheet.!!
This!way!my!students!are!doing!twice!as!many!problems!and!not!even!realizing!it.”!
!
“We’re!using!assessments!the!same!way!as!with!MARS.!!We!use!them!for!next!steps.!!I!use!assessments!
more!than!before.!!In!the!past,!I’d!just!look!at!results!and!say!“oh!well,”!and!move!on.!!Now!it’s!more!
assessment!along!the!way.!.!.!.!Now!I!know!more!what!to!look!for!as!I!walk!around.!!Know!how!to!
intervene.!!Now!I!understand!and!can!delve!in!to!help!my!students.”!
!
“Questioning!is!a!huge!piece!of!what!trying!to!do.!!Not!just!yes!or!no,!but!questioning!that!requires!
students!to!go!further.!!I!probe!so!they!see!what!they!might!not!have.!!It’s!one!of!the!hardest!things!to!
learn!how!to!do,!but!so!valuable.”!
!
In addition to the teachers’ increased knowledge of ways to engage students and the students working on rich mathematics tasks, students were taught in heterogeneous groups whereas the students in the comparison districts were taught in regular and advanced classes. Significantly more students from the intervention districts, with no tracking, scored at proficient or advanced levels in the two assessments reported. This finding is consistent with other research on ability grouping that shows that students taught in tracked groups score at lower levels overall (Boaler & Staples, 2005; Burris et al., 2006; Oakes, 2000). Burris, Heubert and Levin (2006) performed a large-scale study of mathematics tracking, following six cohorts of students through the middle school grades in the state of New York. In the first three years students learned mathematics in tracks, with some students advanced and working at higher levels. In the next three years the districts de-tracked and all classes were taught high-level mathematics. The students in the last three years of the study who were taught in heterogeneous groups achieved at higher mathematics levels overall, they took more advanced mathematics classes in high school and they passed the state test a year earlier. Students in the low, middle and high achievement range were advantaged by working together and not being placed into tracks (Burris, Heubert & Levin, AERJ, 43(1), 103-134).! Many parents and some teachers hold strong beliefs that students are helped by being promoted to advanced classes that move quickly through higher level content. But research has shown that early advancement can be detrimental for students. In the comparison districts in our study 65% of students who were enrolled in accelerated classes were required to repeat the classes when they went to high school. Students who repeat mathematics classes often enter a cycle of failure (Finkelstein, Fong, Tiffany-Morales, Shields, & Huang, 2012), and recent evidence on ‘Gifted and Talented (G&T)’ programs shows that students’ mathematics scores can be negatively impacted by attendance in G&T programs (Bui, Craig, & Imberman, 2012).
!
!
!
!
! 8!
Conclusion.
Mathematics change is hard, even when prompted by overwhelming data on failure. Teachers tend to teach the way that they were taught (Lortie, 1975) enabling the continuation of a faulty but persistent model of traditional teaching. One area that has been particularly hard to change concerns the classroom groups that are used in mathematics. Many teachers and parents assume that the best way to teach students is by pre-deciding the work they are capable of learning and then teaching them accordingly. But decades of research evidence show that when students are taught in heterogeneous groups, with accompanying good teaching practices, they achieve at higher levels (Boaler, 2009; Cohen & Lotan, 2014). Countries that do not use the forms of ability grouping that are dominant in US schools top the world in achievement. Countries as disparate as Finland and China believe that all students should be encouraged in mathematics and encouraged to take work to high levels (Sahlberg, 2013). One of the conclusions of the international analysts reviewing performance data across the world is that the highest performing countries are those that group by ability the least and the latest (Burstein, 1993). There are a number of reasons that ability grouping is associated with lower achievement. Three of the most important concern:
1) The Messages Communicated to Students. When students are given fixed messages about their own potential – with ideas that they are smart or not – they develop ‘fixed mindsets’. Such mindsets impact students’ learning greatly and they have been associated with long-term low achievement and avoidance of harder work (Blackwell, Trzesniewski, & Dweck, 2007; Boaler, 2013a; Dweck, 2006b). In a recent study the students found to be most impacted by fixed messages, were those who were placed into top tracks (Romero, 2013). Ability grouping sends a fixed mindset message to students – that they are smart or not – and fixed mindset thinking is detrimental to students in many aspects of learning (Dweck, 2006) and at all levels of achievement. One of the groups of students with the most persistent and damaging fixed mindset thinking is high achieving girls, who persistently avoid STEM subjects at high levels (Boaler, 2014; Dweck, 2006a). Many educators and parents understand that when students are placed into a middle or low track and given easier work, their chances of high achievement are reduced, but research evidence is revealing that students in high tracks may be similarly disadvantaged.
2) The Mathematics Problems Used in Classrooms
When teachers place students into ability groups they often assume they are all the same and prepare the same work for everyone, despite large differences in students’ learning needs. Students develop at different rates and times and students work at different speeds, meaning that good teaching requires the provision of work that can be taken to different levels by different students. In the SVMI classrooms teachers were trained to provide
!
!
!
!
! 9!
mathematical problems that students could take to different levels and that were accessible to students working at low levels, but could be extended by those working at higher levels. ‘Low floor - high ceiling’ problems are those that everyone can access and that can also be take to very high levels (for an example, see https://www.youtube.com/watch?v=pOOW0hQgVPQ). When all students are encouraged to work at high levels and students are provided with good mathematics resources that can be extended and differentiated, achievement increases.
3) The Detrimental Effects of Speed Parents of high achieving students often believe that their children will ultimately score at higher levels if they meet high level content earlier and they are advanced into higher-level classes at a younger age. But students who are rushed through content often lose the critical ability to think and reason. Students who are advanced often develop procedural speed but lack the depth of understanding that they need to do well on complex problems, and many turn away from mathematics as soon as they can. In the comparison districts in this study two-thirds of students who were advanced in algebra ended up repeating the subject in high school. In Finland, one of the highest performing countries in the world, students do not start school until they are 7 and are introduced to formal mathematical methods three years later than most students in the US (Sahlberg, 2013), yet Finnish students outperform US students by a considerable margin. In eighth grade 15.3% of Finish students score at the highest levels in PISA mathematics tests compared to only 8.8% of students in the United States (PISA, 2012). There is a widespread misconception that when students of different achievement levels are mixed in classrooms the high achievers are neglected, but research shows the opposite to be true as high achievers are often the ones most advantaged by heterogeneous grouping (Boaler & Staples, 2005). The advantages they experience come from the opportunities the receive to go into more depth, the opportunities they receive to explain work to others, which deepens their own understanding, and the provision of work that they can extend to higher levels than the work students are typically given in top tracks.
One of the areas most in need of change in the United States is the widespread use of ineffective models of student grouping, particularly in mathematics. Effective models of student grouping are well known and documented by research (Boaler, 2009) and they need to be used in many more schools in the United States. Some school districts are recognizing the research knowledge that exists and removing advanced classes in the earlier years. The school board in San Francisco for example, one of the largest urban school districts in California recently voted, unanimously, to remove advanced classes until 10th grade, giving all students the opportunity to excel until then. In 10th grade students are offered classes at different levels and high achievers are still able to take BC calculus before they leave high school (see https://www.youtube.com/watch?v=pOOW0hQgVPQ). Another area that is in huge need of change in the US concerns the assessment used in
!
!
!
!
! 10!
mathematics classrooms. In the professional development given to the intervention districts teachers were trained to use less summative assessments (tests and grades), and more formative assessment, giving students feedback on their work that would help them learn, rather than a simple grade, rank or test score (Black & Wiliam, 1998). Mathematics is the most over-tested and over graded subject in the curriculum, and the constant grading and testing students receive is part of the reason so many students feel inadequate in mathematics. The students in the intervention districts engaged in more formative and less summative assessment, which was part of the important teaching they experienced. The students in the intervention districts also moved from working on short mathematics questions to long, rich tasks, that required them to work in more depth, exploring mathematical ideas and working conceptually. The impact of the high quality professional development the teachers received is demonstrated clearly in the improved achievement of the students. Some people believe that wide-scale improvement of mathematics teaching, with students working on more challenging and conceptual mathematics is too difficult to achieve for mathematics teachers in the US (Engel, 2014). Comparisons of international test performance often prompt analysts to speculate that higher achievement comes from a better qualified teacher work force in other countries. Negative thinking about the capability of US teachers has also infused the arguments of those resisting the changes promoted by the common core. The data presented in this paper shows that such changes are achievable. When teachers are given respect, and treated professionally, something that has been lacking in much of the professional development of recent years in the US, they respond in important ways. Many analysts look to the achievement of China, with students from Shanghai currently topping the world in mathematics achievement by an impressive margin (PISA, 2012). But one of the reasons students do well in China is the time teachers are given to learn. In China teaching is a learning profession and teachers study each other’s lessons and spend many hours crafting good lessons, teaching classes for many less hours per week than US teachers but spending more time learning, out of class (Stevenson, 1994; Stigler & Stevenson, 1991). The result of such professional learning time in China is the teaching of conceptual mathematics, taught to all students, and students developing impressive depths of mathematical understanding (see an example on www.youcubed.org in July/August). In the professional development described in this study teachers were given time to learn – time that is manageable for all school districts – 5 days in the summer and 8 days a year. They engaged in mathematics themselves in the ways that students need to engage mathematically and they were treated as professionals. The time the teachers received to learn translated into student achievement. In the US we need to trust in our teaching force and trust in the research evidence that has been collected over decades on high quality mathematics teaching and learning. Such trust has been lacking in the US for a long time. When we erase the mathematical myths about who can learn mathematics (Boaler, 2013a, 2013b) and we invest in teacher learning time, students learn mathematics to high levels. The results reported in this study, though impressive, leave room for improvement and our goal should be for all students to reach proficient or advanced levels in mathematics. Such goals are within our reach but they will only be achievable if we, as a nation, raise our expectations, both of students learning mathematics and the teachers who are teaching them.
!
!
!
!
! 11!
References Black,!P.,!Harrison,!C.,!Lee,!C.,!Marshall,!B.,!&!Wiliam,!D.!(2002).!Working(inside(the(black(box:(
assessment(for(learning(in(the(classroom.!London:!Dept!of!Education!&!Professional!Studies,!King's!College.!
Black,!P.,!&!Wiliam,!D.!(1998).!Inside!the!Black!Box:!Raising!Standards!through!Classroom!
Assessment.!Phi(Delta(Kappan,(October,!1399148.!!Blackwell,!L.,!Trzesniewski,!K.,!&!Dweck,!C.!S.!(2007).!Implicit!Theories!of!Intelligence!Predict!
Achievement!Across!an!Adolescent!Transition:!A!Longitudinal!Study!and!an!
Intervention.!Child(Development,(78(1),!2469263.!!Boaler,!J.!(2009).!What's(Math(Got(To(Do(With(It?(How(Parents(and(Teachers(Can(Help(
Children(Learn(to(Love(Their(Least(Favorite(Subject.!New!York:!Penguin.!Boaler,!J.!(2013a).!Ability!and!Mathematics:!The!Mindset!Revolution!That!is!Reshaping!
Education.!FORUM,(55(1),!1439152.!!Boaler,!J.!(2013b,!Nov!12!2013).!The!Sterotypes!That!Distort!How!Americans!Teach!and!
Learn!Math.!The(Atlantic.!Boaler,!J.!(2014).!Changing!The!Conversation!About!Girls!and!STEM!(T.!W.!H.!C.!o.!W.!a.!Girls,!
Trans.).!Washington!DC:!The!White!House.!
Boaler,!J.,!&!Staples,!M.!(2005).!Transforming!Students'!Lives!through!an!Equitable!
Mathematics!Approach:The!Case!of!Railside!School.!Teachers(College(Record,(110(3),!6089645.!!
Borko,!H.!(2004).!Professional!Development!and!Teacher!Learning:!Mapping!the!Terrain.!
Educational(Researcher,(33(8),!3915.!!Boston,!M.,!&!Smith,!M.!(2009).!Transforming!Secondary!Mathematics!Teaching:!Increasing!
the!Cognitive!Demands!of!Instructional!Tasks!Used!in!Teachers'!Classrooms.!Journal(for(Research(in(Mathematic(Education,(40(2),!1199156.!!
Briars,!D.,!Asturias,!H.,!Foster,!D.,!&!Gale,!M.!(2013).!Implementing!the!Teaching9Assessing9
Learning!Cycle!Common(Core(Mathematics(in(a(PLC(at(Work(Grades(6X8:!Publication!Solution!Tree!!
Bui,!S.,!Craig,!S.,!&!Imberman,!S.!(2012).!Poor!Results!for!High!Achievers:!New!Evidence!on!
the!Impact!of!Gifted!and!Talented!Programs.!Education!Next.!
Burris,!C.,!Heubert,!J.,!&!Levin,!H.!(2006).!Accelerating!Mathematics!Achievement!Using!
Heterogeneous!Grouping.!American(Educational(Research(Journal,(43(1),!1039134.!!Burstein,!L.!(1993).!The(IEA(Study(of(Mathematics.(III:(Student(Growth(and(Classroom(
Processes.!Oxford:!Pergamon!Press.!Cohen,!E.,!&!Lotan,!R.!(2014).!Designing(Groupwork:(Strategies(for((the(Heterogeneous(
Classroom,(Third(Edition.!New!York:!Teachers!College!Press.!Dweck,!C.!S.!(2006a).!Is!Math!a!Gift?!Beliefs!That!Put!Females!at!Risk.!In!W.!W.!S.J.!Ceci!(Ed.),!
Why(Aren't(More(Women(in(Science?(Top(Researchers(Debate(the(Evidence.!Washington!DC:!American!Psychological!Association.!
Dweck,!C.!S.!(2006b).!Mindset:(The(New(Psychology(of(Success.!New!York:!Ballantine!Books.!Engel,!P.!(2014).!Why!Parents!Hate!Common!Core!Math.!!!!
!
!
!
!
! 12!
Finkelstein,!N.,!Fong,!A.,!Tiffany9Morales,!J.,!Shields,!P.!M.,!&!Huang,!M.!(2012).!College!Bound!
in!Middle!School!&!HIgh!School?!How!Math!Course!Sequences!Matter.!
http://www.cftl.org!Sacramento:!The!Center!for!the!Future!of!Teaching!&!Learning!at!
WestEd.!
Foster,!D.,!Noyce,!P.,!&!Spiegal.!(2007).!When!Assessment!Guides!Instruction!Silicon!Valley’s!!
Mathematics!Assessment!Collaborative.!In!MSRI!(Ed.),!Assessing(Mathematical(Proficiency!(Vol.!53).!
Foster,!D.,!&!Poppers,!A.!(2011).!How!Can!I!Get!Them!to!Understand?!Formative!Assessment!
and!Reengaging!Students!in!Core!Mathematics!New(Frontiers(in(Formative(Assessment:!Harvard!University!Press.!
Kozol,!J.!(2012).!Savage(Inequalities:(Children(in(America's(Schools.!New!York:!HarperPerennial.!
Lortie,!D.!C.!(1975).!Schoolteacher:(A(sociological(study.!Chicago,!IL:!University!of!Chicago!Press.!
Oakes,!J.!(2000).!Keeping(Track:(How(Schools(Structure(Inequality:!Yale!University!Press.!Paek,!P.,!&!Foster,!D.!(April!15!2012).!Improved(Mathematical(Teaching(Practices(and(Student(
Learning(Using(Complex(Performance(Assessment(Tasks.!Paper!presented!at!the!The!National!Council!on!Measurement!in!Education!Vancouver,!Canada.!!
PISA.!(2012).!PISA!2012!Results!in!Focus.!What!159year9olds!Know!and!What!they!Can!Do!
With!What!They!Know.!Paris,!France:!OECD.!
RAND,!M.!S.!P.!(2002,!October).!Mathematical!proficiency!for!all!students:!Toward!a!strategic!
research!and!development!program!in!mathematics!education!(DRU927739OERI).!
Arlington,!VA:!RAND!Education!&!Science!and!Technology!Policy!Institute.!
Raytheon9Company.!(2012).!Math!Relevance!to!US!Middle!School!Students:!A!Survey!
Commissioned!by!Raytheon!Company:!Raytheon!Company.!
Romero,!C.!(2013).!Coping(with(challenges(during(middle(school:(The(role(of(implicit(theories(of(emotion.!Retrieved!from!http://purl.stanford.edu/ft278nx7911!!!
Rosen,!L.!(2001).!Myth!Making!and!Moral!Order!in!a!Debate!on!Mathematics!Education!
Policy.!In!M.!Sutton!&!B.!A.!U.!Levinson!(Eds.),!Policy(as(Practice:(Toward(a(Comparative(Sociocultural(Analysis(of(Educational(Policy!(Vol.!1,!pp.!2959316).!Westport:!Ablex!Publishing.!
Rousseau,!C.,!&!Tate,!W.!(2003).!No!Time!Like!the!Present:!Reflecting!on!Equity!in!School!
Mathematics.!Theory(Into(Practice,(42(3),!2109216.!!Sahlberg,!P.!(2013).!Finnish(Lessons:(What(Can(the(Wold(Learn(from(Educational(Change(in(
Finland.!New!York:!Teachers!College!Press.!Schoenfeld,!A.!(2002).!Making!Mathematics!Work!For!All!Children:!Issues!of!Standards,!
Testing,!and!Equity.!Educational(Researcher(Jan9Feb!2002).!!Silva,!E.,!&!White,!T.!(2013).!Pathways!to!Improvement:!Using!Psychological!Strategies!to!
help!College!Students!Master!Developmental!Math:!Carnegie!Foundation!for!the!
Advancement!of!Teaching.!
Stanford,!P.!(2013).!Maturing!of!the!MOOC.!!!Retrieved!2!Nov,!2013!
!
!
!
!
! 13!
Stein,!M.!K.,!Smith,!M.,!Henningsen,!M.,!&!Silver,!E.!(2000).!Implementing(Standards(Based(Mathematics(Instruction:(A(Case(book(for(Professional(Development.!New!York:!Teachers!College!Press.!
Wilson,!S.!(2002).!California(Dreaming:(Reforming(Mathematics(Education.!New!Haven:!Yale!University!Press.!
(2010).!Teaching(Kids(Real(Math(With(Computers
!
!
!
!
! 14!
!
Appendix: Three MARS Tasks.
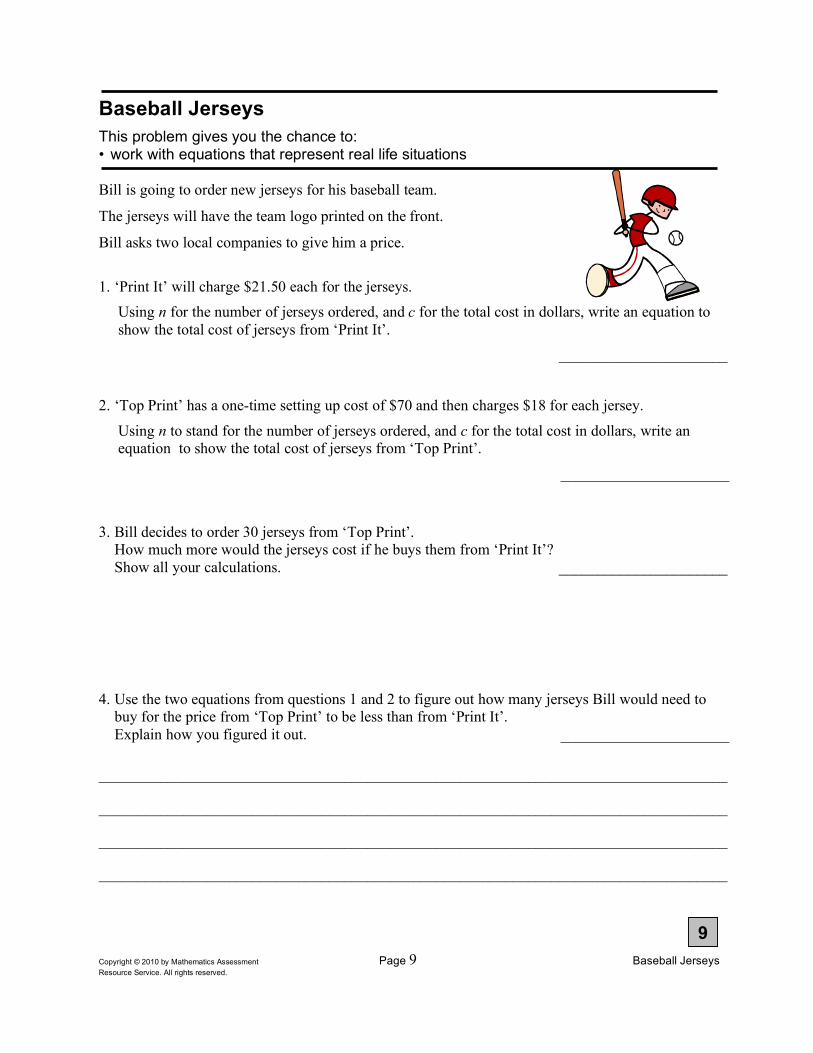
Copyright © 2010 by Mathematics Assessment Page 9 Baseball Jerseys Resource Service. All rights reserved.
Baseball Jerseys
This problem gives you the chance to: • work with equations that represent real life situations Bill is going to order new jerseys for his baseball team.
The jerseys will have the team logo printed on the front.
Bill asks two local companies to give him a price.
1. ‘Print It’ will charge $21.50 each for the jerseys.
Using n for the number of jerseys ordered, and c for the total cost in dollars, write an equation to show the total cost of jerseys from ‘Print It’.
______________________
2. ‘Top Print’ has a one-time setting up cost of $70 and then charges $18 for each jersey.
Using n to stand for the number of jerseys ordered, and c for the total cost in dollars, write an equation to show the total cost of jerseys from ‘Top Print’.
______________________
3. Bill decides to order 30 jerseys from ‘Top Print’. How much more would the jerseys cost if he buys them from ‘Print It’? Show all your calculations. ______________________
4. Use the two equations from questions 1 and 2 to figure out how many jerseys Bill would need to buy for the price from ‘Top Print’ to be less than from ‘Print It’.
Explain how you figured it out. ______________________
__________________________________________________________________________________
__________________________________________________________________________________
__________________________________________________________________________________
__________________________________________________________________________________
9

Copyright © 2007 by Mathematics Assessment Page 8 How Old Are They? Test 9 Resource Service. All rights reserved.
How Old Are They?
This problem gives you the chance to: • form expressions
• form and solve an equation to solve an age problem
Will is w years old. Ben is 3 years older. 1. Write an expression, in terms of w, for Ben’s age.
Jan is twice as old as Ben. 2. Write an expression, in terms of w, for Jan’s age. If you add together the ages of Will, Ben and Jan the total comes to 41 years. 3. Form an equation and solve it to work out how old Will, Ben, and Jan are.
Will is years old Ben is years old
Jan is years old
Show your work.
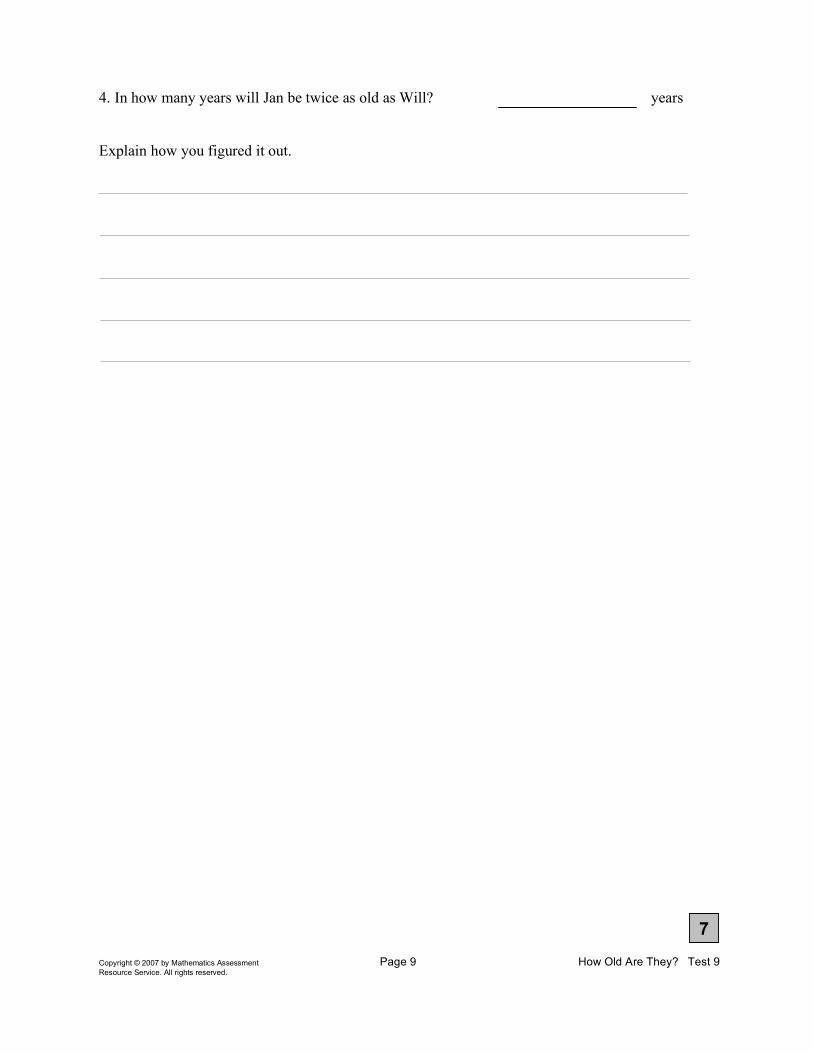
Copyright © 2007 by Mathematics Assessment Page 9 How Old Are They? Test 9 Resource Service. All rights reserved.
4. In how many years will Jan be twice as old as Will? years
Explain how you figured it out.
7
Page 4Published by CTB/McGraw-Hill LLC. Copyright © 2003by Mathematics Assessment Resource Service. All rights reserved.
DO
N
OT
W
RIT
E
HE
RE
DO
N
OT
W
RIT
E
HE
RE
DO
N
OT
W
RIT
E
HE
RE
DO
N
OT
W
RIT
E
HE
RE
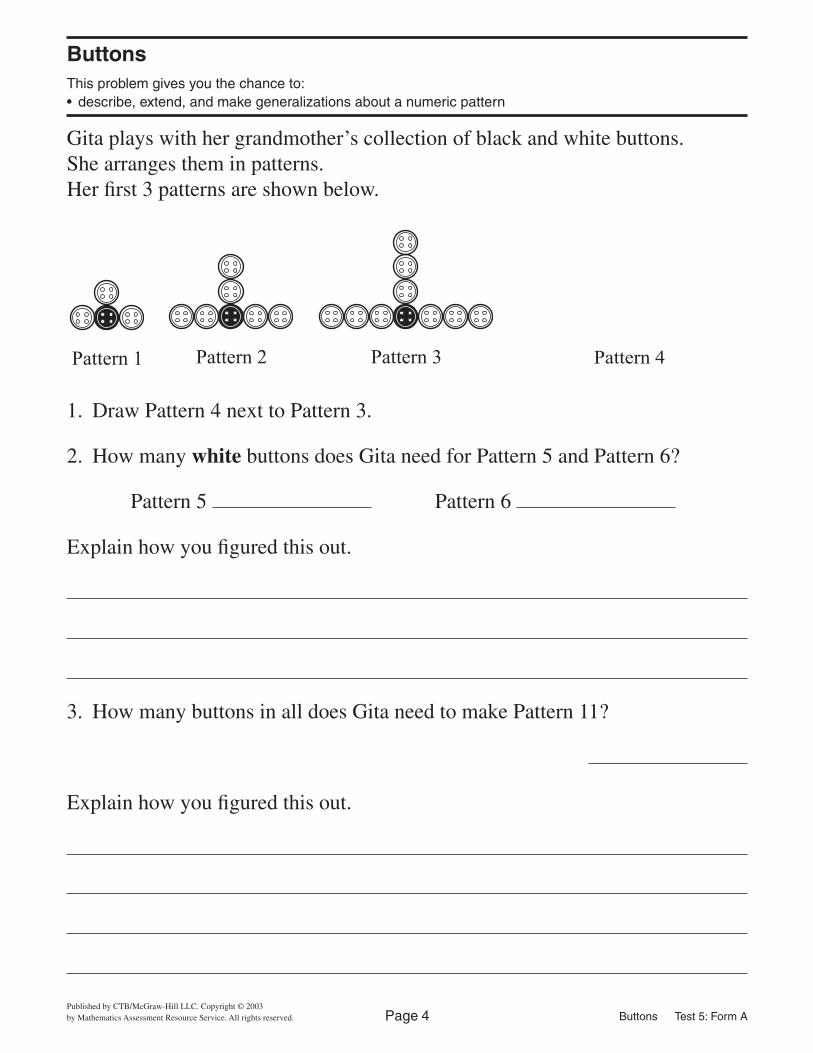
Buttons Test 5: Form A
Gita plays with her grandmother’s collection of black and white buttons.She arranges them in patterns.Her first 3 patterns are shown below.
ButtonsThis problem gives you the chance to:• describe, extend, and make generalizations about a numeric pattern
1. Draw Pattern 4 next to Pattern 3.
2. How many white buttons does Gita need for Pattern 5 and Pattern 6?
Pattern 5 Pattern 6
Explain how you figured this out.
3. How many buttons in all does Gita need to make Pattern 11?
Explain how you figured this out.
Pattern 1 Pattern 2 Pattern 3 Pattern 4
05m_01-16_A03BAM 10/29/02, 11:33 AM4
Page 5Published by CTB/McGraw-Hill LLC. Copyright © 2003by Mathematics Assessment Resource Service. All rights reserved.
DO
NO
T W
RIT
E H
ER
ED
O N
OT
WR
ITE
HE
RE
DO
NO
T W
RIT
E H
ER
ED
O N
OT
WR
ITE
HE
RE
Buttons Test 5: Form A
8
4. Gita thinks she needs 69 buttons in all to make Pattern 24.
How do you know that she is not correct?
How many buttons does she need to make Pattern 24?
05m_01-16_A03BAM 10/29/02, 11:33 AM5