rajesh raushan and r mutharayappa 326 - rajesh raushan and mutharayappa.pdf · neighbourhood...
TRANSCRIPT

NEIGHBOURHOOD DEVELOPMENT AND CASTE DISTRIBUTION
IN RURAL INDIA♣
Rajesh Raushan and R Mutharayappa∗
Abstract An overwhelming majority (above two-third) of India’s population particularly those resident in villages have not performed adequately to move up the ladder of human development Indicators. However, many villages in rural India are better developed while others lag behind in terms of development indicators. Infrastructural development of a village or community has a direct bearing on its degree of human development. In the context, the study tries to examine the level of neighbourhood development and their linkages with caste group disparity in rural India using IHDS: 2004-05 data. Based on selected infrastructural indicators such as communication & services, educational and health institutions, level of neighbourhood development is measured taking village as a unit of analysis. Further, employing factor analysis techniques, composite index of neighbourhood development is constructed. Results of the study reveal that 27 percent villages or neighbourhoods are highly developed, 52 percent moderately and rest are poorly developed. Considering different components, respectively 27 percent, 19 percent and 31 percent villages have been found highly developed on communication & services, education and health institutions. Caste group domination shows that a higher proportion of ST followed by SC people live in poorly developed neighbourhoods as against a higher proportion of Others caste group people who live in highly developed neighbourhoods; and same has been the case for educational institutions but not so for health institutions. Around half of the rural population is concentrated in moderately developed villages. Study provides insights on why poor people are performing inadequately on human development indices. The Study supports the view that poor infrastructural development and lack of opportunity lead to inequality of outcomes in terms of human development. Hence, the prime focus of micro level planning and policy formulation centred on rural India should be concerned with neighbourhoods where concentration of poor people is more. It will help to stimulate the growth and development of neighbourhoods as well as the people living there to contribute to the nation as a whole. Key Words: Caste groups, Composite Index, Factor Analysis, Human Development,
Neighbourhood, Rural India.
Introduction
Development is defined as the process of improving and enhancing the quality of the people through
reducing deprivation of the required components of development and increasing the possibility to live
with freedom in line with their capability. According to a more fundamental view, there are three
possible and equally important developmental aspects that can raise people’s standard of living by
creating conditions and environments conducive to their growth and enlarging the possibilities to attain
their choices. These three possible aspects of development are interlinked; increase in personal income
and education tend to improve their standard of life which may be possible through various social,
♣ Earlier version of this paper titled “Level of Village Development and Social Disparity in Rural India: Are they Inter-linked?” was presented at the 14th Annual Conference of Indian Association of Social Science Institutions (IASSI) on “Regional Pattern of Indian Development” held at ANSISS, Patna on March 7-8, 2014.
∗ Rajesh Raushan is Doctoral Fellow, Population Research Centre and R Mutharayappa is Professor, Centre for Women and Gender Studies, Institute for Social and Economic Change, Bangalore, India. E-mail: [email protected]; [email protected]; and [email protected].
Author (Rajesh Raushan) learnt Factor Analysis while he was working for Dr S C Gulati, Retired Professor, Population Research Centre, Institute of Economic Growth, Delhi, India who was working on a policy report titled ‘Population Stabilization through Reproductive and Child Health in Uttar Pradesh’ of National Institute of Health and Family Welfare (NIHFW), New Delhi, India at the time. He is highly indebted Dr Gulati for the same.

2
political, and economic institutions which promote choices through making available more services.
Notably, development is broadly measured in terms of growth and progress of economic, social and
demographic indicators directly or indirectly of the people at national, regional, state or community
level. However, very few studies are found to have focussed on environmental factors that influence
people’s progress. Environmental factors have a decisive role in human development. This can be
understood clearly from the spatial development differentials like urban parts being always more
developed than their rural counterparts in any nation. In the Indian context too, the degree of human
development can be gauged from status of spatial development of the area studied.
Past six decades have witnessed progress on various economic, social and political dimensions
of development in India, but we are still far behind the required pace of development to make it
complete and universal. The unequal progress has led to huge disparity within the country on various
social and economic indicator of spatial development, like urban India performing much better than
rural India. There is ample evidence to strengthen the inference that rural residents have poorer
socioeconomic development status on health, education, income, employment, etc. than their urban
counterparts. Interestingly, it is also notable that urban areas are more developed than rural ones,
although there is huge disparity within the urban space in regard to developmental issues. It is worth
noting here that more than two-third (69%) of our population still lives in rural India as against less
than one-third in urban India (RGI, 2011). All available evidences indicate that much of rural India is
facing the problem of unequal and unplanned development, making the notion of development
ambiguous. Development of rural area is an index of development of villages. In terms of aggregation
of resources, providing services and amenities, etc. village/rural development achieved hitherto is very
meagre. Therefore more attention needs to be given to accelerating human development in rural India
to reach the expected target. This developmental dichotomy can be studied by considering village as a
neighbourhood and development of village as neighbourhood development.
Need for the Study But, there is also the problem of lack of quantified data on village level indicators of conducive
conditions for human development on the one hand and indicators of responses of villagers to
development stimuli on the other. Further, studies pertaining to villages are broadly limited to individual
or particular villages which provide the insights of developmental process of the particular village but
the conclusions of such studies cannot be generalized for other villages. Also, there are no such theories
or models of sub sequential change and development at the village level to derive insights for
formulation and implementation of appropriate policies (Adelmen & Dalton, 1971). Further, studies have
broadly used social structure and social institutions using ‘caste dimension’ to analyse social
modification, cultural transformation and political power relation in rural India from a simple village
perspective but, caste structure and their linkages are yet to be studied with village or neighbourhood
development perspective in rural India. This may be one of the reasons for lagging behind in terms of
policy outcome; this aspect therefore needs investigation. It is because poor (low) caste people mostly
live in poorly developed villages in turn result in them showing poor development indicators or, is some
villages poorly developed because its inhabitants have low human development index. The paradox

3
needs to be investigated. A probable reason for poor village development is the lack of supportive
resources and services availability which leads inequality of opportunity to poor caste people which in
turn results in inequality of outcomes.
Many rural areas have seen a rapid integration with the global economy while others seem to
have lagged behind. This could be an additional reason for some villages remaining still
underdeveloped. It is important to add here that characteristics of communities have an influential
effect on the development of rural areas as well as important consequences for human development
(Desai et al, 2010). Given the all too obvious link between micro-level policy framework and human
development in villages, the study intends to measure the level of development of neighbourhoods and
their linkages to the caste group disparity in rural India.
Moving from ‘Village Development’ to ‘Neighbourhood Development’
There are several studies that focus on village development from people’s perspective but few done
with region-specific perspective. Like, people a village having high literacy rate, better standard of
living, better health outcomes for their population are termed as developed villages compared to others
that have poor score on the above indicators. However most of the time, it is lack of a conducive
environment that hampers the progress of people residing in such environments. So, development from
a village perspective is required as much as the progress of their residents. Notably, very few studies
have been indecisive about conditions and environments conducive to growth and enlarging the
possibilities of the villagers to attain their choices at village level. The net result is a complex set of
causes have made rural areas in general and villages in particular to lag behind in development
indicators as compared to their urban counterparts. These causes may be physical infrastructure,
institutions, and amenities and services intended to lead the villages to development on one hand and
their residents on other hand. For example, availability of roads in rural areas have been found very
catalysing in improving economic, demographic and health conditions of the people in such villages. An
evaluation study on development of all weather road under ‘Bihar Rural Roads Project’ in the med- 80s
found that annual income, literacy, use of contraception, treatment seeking behaviour, employment
generation and contacts with outer world had increased significantly after providing road connectivity to
villages (Lal, 1989).
Studies by NCAER1 on human development and their linkages with village level variables had
found positive and consistent relationships of transport and communication infrastructure with
household income, percent of people living below poverty line and average wage rate; education and
health infrastructure with level of literacy and demographic and health indicators like the villages having
sub centres and/or anganwadi centre; had high prevalence of immunization, contraceptive prevalence,
low morbidity incidence and low birth rates, although such association is not necessarily straight
forward (Shariff, 1999, Desai et al, 2010). It has found that villages located closer to district towns have
greater infrastructural development than those located farther away (Desai et al, 2010). Further,
villages connected by pucca roads and bus stops showed high literacy and enrolment rates for both
1 National Council of Applied Economic Research, New Delhi, India.

4
males and females. They also had high immunization and low child under nutrition. Interestingly, the
poor infrastructural development has been found linked with adverse demographic outcome in rural
India (Shariff, 1999). But there are very few studies which link adverse or poor human development
with area development than individual or household characteristics.
As per our knowledge and literatures accessed, it is post 80s that a new approach for area
based quantitative studies mainly in developed world started raising voice to address area effect on
different indices of human development, called neighbourhood approach2. Although studies on
neighbourhood approach are not very new and have long history in sociological arena as community
based qualitative studies, but a growing interest of quantitative studies in the effects of neighbourhoods
on individual social and economic outcomes emerged in 1980s only (Luption, 2003). But, in addressing
inequality or disparity in a broader context, research on neighbourhood effect has emerged as the main
method in the past decade (Pickett and Pearl, 2001). Neighbourhood approach explains their effects on
human development and outcomes linked with development and quality of the neighbourhood (Kawachi
& Berkman, 2003). In developed world, mostly in UK and USA, place effect on individual development is
very much linked with neighbourhood development.
A large number of research studies have examined neighbourhood effects on employment and
earnings, child development, educational and health outcomes, teen pregnancy, delinquency, peace and
crime etc., usually finding evidence of significant although small neighbourhood effects (Lupton, 2003;
Blackman, 2006). In Britain, the research has happened, mainly in the second half of the 1990s, looking
at a range of outcome measures like labour market engagement, entry into jobs, non-monetary poverty
measures and flows in and out of poverty against a range of individual variables, local unemployment
rates and area deprivation scores (Buck 2001). There has also been a specific body of work focusing on
health inequalities and the effect of place, again demonstrating that both area effects and individual
effects matter (Blackman, 2006).
It can thus indicate the likely impact of neighbourhood focused policy interventions, relative to
those focused on individuals (Luptan, 2003). Poor neighbourhoods can be seen as having systematically
disadvantaged their residents, isolating them from opportunity structures (Wilson, 1987). Poor people
are systematically disadvantaged by living in areas which are under-resourced and have weak
comparative advantages (Buck, 2001). The increasing evidences of neighbourhood development will
also be a new mechanism for explaining unequal area or locality development in a country like India
where still more than two third of its total population is concentrated in villages, and development of
villages can be seen as neighbourhood development and their extended evidence found in changed
caste group distribution in rural India. Scheduled caste (SCs) and scheduled tribes (STs) are highly
disadvantaged groups than the rest of caste groups in rural India, which finds reflection in their poor
social and economic development which directly or indirectly hampers the level of human development
in India as a whole.
2 Neighbourhood is a combination of compositional (individual) and contextual (place) attributes.

5
Defining and Measuring Neighbourhood Development in India
The term neighbourhood, community and area have often been used to refer to a person’s immediate
residential environment, having both physical and social characteristics potentially. But, clear
distinctions between the terms are usually not made well (Diez-Roux, 1998). More precisely,
neighbourhoods are the combinations of attributes of the place and the people living there. The former
is termed as contextual and later as compositional (Blackman, 2006). ‘Who is individual’ matters, and
developmental indicators like income, education, employment, health etc. have been found responsible
for their unequal status. Further, ‘where he/she lives’ also matter. It matters more for specific
population groups according to age, caste, class and so on (Kawachi & Berkman, 2003). Individual’s
attributes is compositional characteristics of the neighbourhood whereas place attributes is contextual
characteristics of neighbourhood.
Theoretical aspect of contextual characteristics of neighbourhood are linked with development
of area based physical and social characteristics at aggregate level which make them affluent or poor,
although the inclusion of characteristics for measuring neighbourhood depends upon relevance of those
characteristics. Physical characteristics include availability of infrastructure and services in the area
followed by social interaction and relationship in terms of social capital under social characteristics.
Social capital is a resource stemming from the structure of social relationships which in turn facilitate
the achievement of specific goals. Overwhelmingly three approaches- ecological studies, contextual
studies using multilevel analysis and comparative study of well defined neighbourhood is widely used to
study neighbourhood effect (Pickett & Pearl, 2001).
The place effect is not very much new but the cross disciplinary dialogue on concepts,
methods and evidences about the area effect on various dimensions of human development like
education, employment, health, income generation and even peace and conflicts which eventually
moves them on scale of socio economic development (Kawachi & Berkman, 2003) and which used
quantitative methods for analysis is not very old. On the other hand, variety of models have been
proposed to explain the possible causal influences of neighbourhood effects on physical model,
structural model, social capital model, environmental model and so on, but the many studies using
these models have not explained the possible causal pathways of neighbourhood effect (Pickett and
Pearl, 2001). Furthermore, most studies do not include variables pertaining to physical or institutional or
basic services characteristics of areas because of lack of data on those characteristics, but wherever
data is available on those composite indices of aggregate measurement they are widely used to
measure the level of neighbourhood development.
Method and Materials
Data Source
The availability of data on village indicators is sparse across the country. However, in 90s NCAER3 and
IIPS4 had collected the data on village level indicators during surveys related to human development,
3 NCAER had collected data on village level indicators during a survey in 1994 for profiling human development in
rural India.

6
demographic and health outcomes. The latest nationwide data available in this regard is through India
Human Development Survey (IHDS)5 conducted in 2004-05, which is used for this study.. IHDS is a
nationally representative survey of 41,554 urban and rural households and include 215,754 individuals.
As the study is concerned with rural India, a total of 1, 43,374 individuals have been interviewed from
26,734 households located in 1,503 villages across the country. But the village level data are not
available for all the indicators, so the number of sample villages considered varies from one component
to another component, but for aggregate level development, 984 sample villages have been selected.
Analytical Framework
The central argument of the study is that neighbourhood development and extent of their development
are linked to caste group distribution in rural India. The analysis is done considering village as
neighbourhood and so the level of development of village reveals neighbourhood development. Based
on selected infrastructural development parameters available within or nearby the village, level of
neighbourhood development is measured. It is assumed that as the distance of availability of any
indicator increases, the level of village development decreases correspondingly. It is mainly due to the
fact that as the availability reduces, accessibility and affordability of the said services also reduces (in
terms of increasing distance) for the population residing in those villages. Therefore, availability of a
particular development indicator will be measured in terms of the availability of the indicator within the
neighbourhood which also impacts human development indices in the community. First, based on a set
of indicators development level of different component is measured, then using the aggregate score of
those components, aggregate neighbourhood developments has been measured.
Lastly, neighbourhood development is linked with caste groups’ location or distribution in those
neighbourhood or villages to examine whether the notion of better off caste group people living in well
developed neighbourhoods and high concentration of poor caste people in poorly developed
neighbourhoods, is factual or not. The government of India classification of caste group into scheduled
caste (SC), scheduled tribe (ST), other backward classes (OBC) and Others is followed throughout the
analysis. Most existing studies support the view that Others are highly developed caste groups whereas
SC and ST are poor to poorest caste groups (Nayar, 2007). It may be the case that, lack of physical and
institutional characteristics tend to be strongly correlated with concentrated poverty and poor
performance of other development measures among them. Supporting this view Wilson (1987) stated
that poor or disadvantaged neighbourhoods have been seen as systematically disadvantaging their
residents and isolating them from opportunity structures.
4 IIPS had collected village level data during second round of National Family Health Survey (NFHS) in 1998-99
across the country. 5 IHDS data are cross sectional and collected during 2004-05 jointly by the University of Maryland, USA and National
Council for Applied Economic Research (NCAER), India across 28 states and 5 Union Territories except Andaman & Nicobar, and Lakshadweep islands. It covered 384 districts, 1,503 villages and 971 urban blocks, located in 276 towns and cities.
7
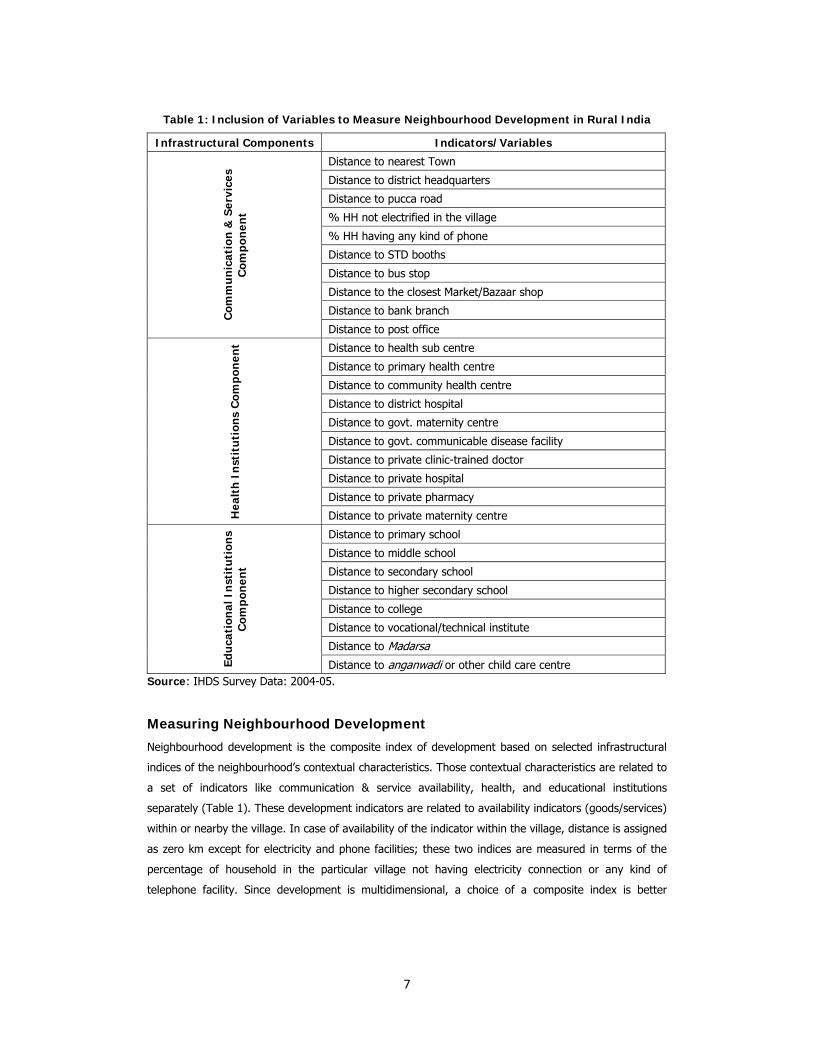
Table 1: Inclusion of Variables to Measure Neighbourhood Development in Rural India
Infrastructural Components Indicators/Variables
Com
mu
nic
atio
n &
Ser
vice
s C
ompo
nen
t
Distance to nearest Town
Distance to district headquarters
Distance to pucca road
% HH not electrified in the village
% HH having any kind of phone
Distance to STD booths
Distance to bus stop
Distance to the closest Market/Bazaar shop
Distance to bank branch
Distance to post office
Hea
lth
In
stit
uti
ons
Com
pon
ent Distance to health sub centre
Distance to primary health centre
Distance to community health centre
Distance to district hospital
Distance to govt. maternity centre
Distance to govt. communicable disease facility
Distance to private clinic-trained doctor
Distance to private hospital
Distance to private pharmacy
Distance to private maternity centre
Edu
cati
onal
In
stit
uti
ons
Com
pon
ent
Distance to primary school
Distance to middle school
Distance to secondary school
Distance to higher secondary school
Distance to college
Distance to vocational/technical institute
Distance to Madarsa
Distance to anganwadi or other child care centre Source: IHDS Survey Data: 2004-05.
Measuring Neighbourhood Development
Neighbourhood development is the composite index of development based on selected infrastructural
indices of the neighbourhood’s contextual characteristics. Those contextual characteristics are related to
a set of indicators like communication & service availability, health, and educational institutions
separately (Table 1). These development indicators are related to availability indicators (goods/services)
within or nearby the village. In case of availability of the indicator within the village, distance is assigned
as zero km except for electricity and phone facilities; these two indices are measured in terms of the
percentage of household in the particular village not having electricity connection or any kind of
telephone facility. Since development is multidimensional, a choice of a composite index is better

8
representation than representing each of the variables by different single indices. Hence, to develop
composite index of village development, factor analytic approach6 has been employed.
Factor analysis is a method that simplifies complex and diverse relationships that exists among
a set of observed variables by uncovering common dimensions or factors that link together the
seemingly unrelated variables, (and) consequently provides insight into the underlying structure of the
data (Dillon & Goldstein, 1984). Here, factor analysis is undertaken using the principal component
method of extraction with Varimax rotation criterion. The principal factor method extracts factors in
such a way that each factor accounts for the maximum possible amount of the variance contained in
the set of variable being factored. The extraction is different from principal component analysis, in that,
principal component method replaces each diagonal element of the correlation matrix by the respective
variable’s communality (ibid). The communality of the variable is the portion of a variable’s total
variance that is accounted for by the common factors.
The number of factors is restricted to the Kaiser’s criterion of the Eigen (E value) values
greater than unity. In the first stage, aggregate component score using a set of variables for particular
component is generated. In the second stage using aggregate component scores, neighbourhood
development score are generated. In the third stage, using neighbourhood development score,
neighbourhood development index is generated using the aggregate score with cut off ±2. The villages
having scores less than minus (-) 2 is categorised as highly developed villages; -2 to +2 as moderately
developed, and village having score more than +2 as poorly developed. This criterion is followed for
component development index also apart from neighbourhood development index. At each stage during
aggregation of scores, Eigen value is used as weight. The component indexes are neighbourhood
communication & services index, neighbourhood educational institution index and neighbourhood
healthcare institution index as generated first, whereas village development index is the aggregation of
the above these three indices.
Result of the Study
Structural Linkages among Neighbourhood Development Indices
Structural Linkages among various Communication & Services infrastructure
within the Neighbourhood
Within the framework of neighbourhood development based on communication & services indices at
village level, all the selected variables are measured based on distance from the village except for
electricity availability and any kind of phone facility to the HH. Descriptive statistics (Table 2) of these
indices delineates that in rural India, the nearest town is located at an average distance of 14 Kms from
the village, and the distance varies from a minimum of three to a maximum of 25 Kms, whereas the
distance to the district head-quarters is at average distance of 44 Kms and varies from a maximum of
72 Kms and a minimum of 17 Kms. Regarding access to electricity and any kind of telephone facility, it
is seen that the HHs with these facilities in rural India ranges between a minimum of 66 percent and a
maximum of 100 percent. Other service indices like closest bus stop, STD booth, post office, etc. are
6 See, Basic model of factor analysis and their equational notation in Appendices at last of the paper.

9
within a maximum of 8 to and minimum of 2 km from the neighbourhood. Another important
connectivity indicator of rural development i,e, pucca road or all weather road, and the distance from
the neighbourhood to these service indicators is found to be within a minimum of 2 and maximum of 7
kms.
Table 2: Descriptive Statistics of Communication & Service Indices (Distance in Km)
Communication & Services Variables Mean Std. Dev.
Distance Nearest Town 14.22 11.12
Distance to District HQ 44.39 27.09
Distance from Pucca Road 1.63 4.17
% HH not having Electricity in the village 86.23 19.92
% HH not having any kind of phone in the village 86.23 19.92
Distance to the Closest Bank Branch 4.55 5.36
Distance to the Closest STD Booth 2.41 4.90
Distance to the Closest Bus Stop 1.86 3.27
Distance to the Closest Market 6.39 6.88
Distance to the Closest Post Office 1.55 2.57
N 1449
Table 3: Factor Structure of Neighbourhood Communication and Service Indices
in Rural India
Factors Loadings*
Communalities F-I F-II F-III
Distance Nearest Town 0.011 0.044 0.639 .411
Distance to District HQ -0.026 0.238 0.584 .398
Distance from Pucca Road 0.682 0.063 0.080 .476
% HH not having Electricity 0.144 0.975 0.117 .985
% HH not having any kind of phone 0.144 0.975 0.117 .985
Distance to the Closest Bank Branch 0.521 0.058 0.535 .562
Distance to the Closest STD Booth 0.551 0.095 0.354 .438
Distance to the Closest Bus Stop 0.681 0.187 -0.089 .507
Distance to the Closest Market/Bazaar 0.151 -0.033 0.704 .520
Distance to the Closest Post Office 0.672 0.012 0.040 .453
Eigen Value 2.98 1.54 1.21
Variance Explained 57.35
*Based on Varimax Rotation Criteria with Eigen Value >1
Looking at the underlying structural linkages among those selected variables that contribute to
the neighbourhood development, it is seen that there is more than 50% communalities for most of the
indicators (Table 3). The indices of communication & services availability have generated three factors
with varying loads. The distance of village from pucca or all weather roads is highly linked with distance
to bus stop and shows a factor load of 0.682; STD booths, 0.551; post office, ,0.672; and bank branch,
0.521. (All extracted on first factor (F-I). Second factor is linked with percent households having some

10
kind of phone facilities (factor load 0.975) with percent households having electricity facility (factor load
0.975) in their households. Distance to nearest town and district head quarters is linked with distance to
bank branch and market in rural India and is extracted from factor three (F-III). This explains that the
distant villages in rural India are still facing the problem of basic services and communication facility,
and keeps them underdeveloped. The apt explanation of the inter dependency of availability of
infrastructural services depicts the development of one indicators leads to other one.
Structural Linkages among Various Education Institutions within
Neighbourhood
Availability of educational institution in rural India and their mean distance from the neighbourhood has
been provided in table 4, and the underlying linkages in the form of distance or agglomeration of these
educational institutions is provided into table 5. It can be seen from Table 4 that the basic education
provider institutional infrastructure namely primary school and anganwadi centre is located in most of
the villages within the one kilometre of range. But as we move upward from middle school to colleges
and technical or vocational institutions, the distance increases simultaneously. While colleges are
available at 16 km distance on an average, vocational or technical institutions are available at27 km
distance on an average. An interesting point to add here is that madarsa, which provides basic
education to Muslims is found at much more distance from neighbourhoods in rural India.
Table 4: Descriptive Statistics of Educational Institutions Indices (Distance in Km)
Mean Std. Dev.
Distance to Primary Schools 0.07 0.76
Distance to Middle Schools 1.28 2.77
Distance to Secondary Schools 3.69 4.95
Distance to Higher Secondary Schools 7.24 7.13
Distance to Colleges 16.96 14.06
Distance to Vocational Institutes 27.34 23.78
Distance to Madarasa 30.16 32.87
Distance to Anganwadi Centre 0.19 0.98
N 1245
Table 5 explains the underlying relationship of establishment and availability of different types
of educational institutions across the neighbourhoods in rural India. The different types of educational
institutions are explaining communalities of about 50-70% in rural India. Factor loadings of these
different types of education intuitions have been extracted on three factors. Distance or availability
(proximity) of primary, secondary and higher secondary schools from the village is extracted on first
factor (0.644 to 0.834); that of colleges, technical institutes and madarasa is extracted on second
factor; and that of primary school and anganwadi centre is extracted on third factor. Here, it is also
notable that madarsa has a negative relationship with the availability of basic educational institutions
like primary and middle schools. This factor loading very clearly shows that educational institutions
cluster together at some prominent spot probably to benefit from each other’s presence. So, in villages

11
where primary school is available, anganwadi centre is also available; similarly the technical institutions
are found established close to the colleges.
Table 5: Factor Structure of Neighbourhood Educational Institutions in Rural India
Factors Loadings*
CommunalitiesF-I F-II F-III
Distance to Primary Schools 0.022 -0.002 0.789 .623
Distance to Middle Schools 0.644 -0.106 0.295 .513
Distance to Secondary Schools 0.834 0.073 0.048 .704
Distance to Higher Secondary Schools 0.743 0.233 -0.049 .609
Distance to Colleges 0.355 0.641 -0.141 .557
Distance to Technical Institutes 0.067 0.792 -0.030 .633
Distances to Madarasas -0.110 0.622 0.307 .493
Distance to Anganwadi Centre 0.147 0.068 0.756 .598
Eigen Value 2.16 1.35 1.21
Variance Explained 59.20
*Based on Varimax Rotation Criteria with Eigen Value >1
Structural Linkages among Various Health Institutions within
Neighbourhood
Availability and accessibility constraints of health institutions in rural India are a major stumbling block
in providing universal healthcare services to the rural population. Their availability and their mean
distance from the neighbourhood is captured in table 6, whereas table 7 provides their underlying
linkages in the form of distance or agglomeration of these health institutions. Table 6 delineates that
the first contact place between people and three tyre government health care system at grass root level
is health sub centre (HSC) which is found on average 3 kms away from the village or neighbourhood,
and often as far away as of 8 kms. Their accessibility and healthcare service delivery are also a major
concerns, but beyond scope of this study. Regarding distance to primary health centre (PHC),
community health centre (CHC) it is found that on average these are located at distances ranging
between 8 and 16 kms. Availability of other institutions of government healthcare service delivery like
maternal healthcare facility and government maternity centre is much less in rural India, and found, on
an average, 20 kms away from the neighbourhood/village. This might also be contributing to high
maternal and child mortality and poor number of institutional deliveries in rural India. Also, Government
institutional support to control communicable disease is not available within a mean distance of 23 kms
from the village/neighbourhood.

12
Table 6: Descriptive Statistics of Health Institutions Indices (Distance in Km)
Mean Std. Dev.
Health Sub Centre 3.09 5.16
Primary Health Centre 7.90 7.29
Community Health Centre 16.06 12.34
District Hospitals 42.59 25.54
Government Maternity Centre 20.29 17.74
Govt. Communicable Disease Facility 23.51 20.13
Private Clinic-Trained Doctor 8.27 10.11
Private Hospitals 16.25 15.53
Private Pharmacy 8.61 10.22
Private Maternity Centre 18.78 19.28
N 994
Regarding the role of private healthcare service providers at neighbourhood level, this study
takes into account private clinic with trained doctors, private hospitals, private maternity centres and
private pharmacies, etc for analysis. Although IHDS survey has collected information on availability of
private clinic with untrained doctors, untrained birth attendants and other untrained healthcare service
providers, due to the unauthentic nature of their services, such institutions are not considered for this
study, even though a major part of private healthcare services is dominated by them currently. Table 6
shows that private clinics with trained doctors and private hospitals are available at an average distance
of 8 km and 16 km respectively from the neighbourhood, whereas private maternity was found at a
distance of 18 kms.
Coming to the factor structure of health facilities in rural India, table 7 shows that private
health facilities like private hospitals, private clinics, private pharmacy and private maternity centres are
found established close to one another (clusters), and gets a factor correlation coefficient of 0.585 to
0.767. Second extracted factor is found linked with district hospital, community health centre, and govt.
maternity centre, and government communicable disease facilities in rural India.
Third extracted factor is found linked with health sub centre and primary health centre and
negatively linked with government and private maternity centre. These extracted factors clearly show
that the factor load of healthcare infrastructure decreases with an increase in distance from district
hospitals or community health centre. Even private healthcare facilities are contributing significantly to
health care delivery at village/neighbourhood level in India, though they are mostly located in clusters
(in close proximity to each other). This study arrived at the above conclusion by studying the structural
linkages of their availability. It can be very clearly stated that as the distance increases from the district
hospitals the service availability decreases in rural India and this is consistent with the findings of other
studies (Gulati et al, 2010). The third extracted factor (F-III) on health sub centre and primary health
centre have correlation coefficient of 0.775 and 0.805 respectively. Extraction of third factor on health
sub centre and primary health centre delineate that the rural areas where primary health centre is
available or functioning better, health sub centre also contributes more.

13
Table7: Factor Structure of Neighbourhood Health Institutions in Rural India
Factors Loadings*
Communalities F-I F-II F-III
Distance to Health Sub-Centres 0.121 0.042 0.775 .617
Distance to Primary Health Centres 0.023 0.103 0.805 .660
Distance to Community Health Centres 0.134 0.578 0.119 .366
Distance to District Hospitals 0.024 0.684 0.065 .472
Distance to Government Maternity Centres 0.390 0.658 -0.008 .585 Distance to Govt. Communicable Disease Facility 0.253 0.723 0.011 .587
Distance to Private Clinic-Trained Doctors 0.721 0.108 0.108 .543
Distance to Private Hospitals 0.767 0.183 0.069 .627
Distance to Private Pharmacy 0.585 0.225 0.109 .405
Distance to Private Maternity Centres 0.736 0.143 -0.043 .565
Eigen Value 3.16 1.22 1.05
Variance Explained 54.30
*Based on Varimax Rotation Criteria with Eigen Value >1
Structural Linkages among various infrastructural components at
Neighbourhood
At second stage, based on component score of the selected indices of neighbourhood development, all
have extracted in same direction of mean value of 0.03 to 0.09 with standard variation of 2.61 to 3.37.
One important point to observe here is that the development of one indices are highly linked with
development of others but the speed and magnitude of their development varies as we move from one
component to other component (Table 8).
Table 8: Descriptive Statistics of factor scores of Neighbourhood components
Mean Std. Dev.
Village communication movement & services Score -0.09 2.61
Village Educational Institutions Score -0.09 2.61
Village Health Institutions Score -0.03 3.57
N 914
Further, considering the said indicators of village development, table 9 clearly depicts the
structural linkages of their establishment in rural India as these have a direct impact on neighbourhood
development. The underlying relationship of their availability through factor structure in the study
shows very high inter-linkage with each other and almost 80% variance is explained by those three
infrastructural components. Like, communication & services availability affect more to education
institutions than availability of health institutions in rural India. It has found that the increasing distance
of one component automatically leads to increase in distance of other component or may be said that
they are agglomerated near to each other.

14
Table 9: Factor Structure of Neighbourhood Development Indices in Rural India
Factor Loading*
Communalities F-I
Neighbourhood communication & services 0.966 .933
Neighbourhood Educational Institutions 0.966 .933
Neighbourhood Health Institutions 0.714 .509
Eigen Value 2.376
Variance Explained 79.20
*Based on Varimax Rotation Criteria with Eigen Value >1 Source: Author’s Calculation based on IHDS data
Neighbourhhod Development and Caste Group Distribution in India
Level of Neighbourhood Development in Rural India
At the country level, the issue of neighbourhood development matters more for two reasons. First, for
its relevance for micro policy and planning and second, because a very high proportion of the
population live in these rural neighbourhoods compared to urban areas. As per the latest information
(RGI, 2011) more than two third the population in India still live in rural areas, and development of
those areas is directly linked with indicators of human development. In view of this, three major indices,
namely village connectivity & services availability indicators, availability of educational institutions and
availability of health institutions for neighbourhood development are considered here for these are the
basic parameters of development apart from the individual’s socio-economic status, and lack or
unavailability of these factors can be considered as inequality of opportunity.
Table 10: Neighbourhood Development in Rural India
Level of Development Total
Highly Developed 26.7
Moderately Developed 52.1
Poorly Developed 21.2
N 921 Figures in table represent bivariate relationship are statistically significant based on Chi-square test (p>0.05).
Source: Author Calculation based on IHDS data
The extent of inequality of opportunity can be gauged from the level of development of the
neighbourhood in rural India. Table 10 shows that just above one fourth of the neighbourhoods or
villages in India are highly developed while more than half are moderately developed or on the way to
achieving significant development in these selected components or parameters of development.
Twenty-one percent of neighbourhood are still poorly developed, and more attention needs to be paid
to bettering human development and reduction of inequality of opportunity for the people living in these
villages to ensure acceptable outcomes in regard to education, health and equality of opportunity.

15
Regional Variation in Neighbourhood Development in Rural India
The pattern of neighbourhood development in rural India shows much variation across regions. For
example, about 9 percent of neighbourhoods are highly developed in north east as against of 33
percent in the north region. In contrast, in the poorly developed neighbourhoods, these percentages
vary widely, i.e. from 14 percent in west region to 64% in north east region (Table 11). A comparison of
the proportion of highly developed neighbourhoods across regions shows that it is north region that
holds the highest proportion of highly developed neighbourhoods, followed by south and west regions.
It is the point of observation that as north India is poorly developed on many indicators of socio
economic development compared to south India, there is the possibility of neighbourhoods or villages in
north India also being less developed compared to neighbourhoods in south India. But, as the study has
found, the highest percentage of highly developed neighbourhoods are found in the north region
because of the higher development of neighbourhoods in Punjab, Haryana and western Uttar Pradesh
and also to some extent in the national capital territory of Delhi. If we exclude the neighbourhoods of
these states the proportion of highly developed neighbourhoods will automatically be less than
proportion of highly developed neighbourhoods in south India.
Table 11: Regional Distribution of Neighbourhood Development in Rural India
Highly Developed Moderately Developed Poorly Developed Total
North 33.3 46.8 19.9 216
North East 9.1 27.3 63.6 22
East 21.4 52.0 26.5 98
West 28.0 58.4 13.6 125
Central 21.2 52.5 26.3 236
South 28.8 55.9 15.3 229
Total 26.6 52.2 21.3 926 Figures in table represent bivariate relationship are statistically significant based on Chi-square test
(p>0.05).
Source: Author Calculation on IHDS Data
Now, let us take up the issue of poorly developed villages. It is the west and south India that
account for the lowest 14 percent and 15 percent respectively of poorly developed neighbourhoods.
This is because these regions account for the highest percentage of moderately developed
neighbourhoods. The possible explanation is that in west and south regions consist mostly of
Maharashtra and Kerala which are comparatively developed states than others, and this could also be
due to the higher percentage proportion of developed rural neighbourhoods abutting urban
neighbourhoods in these states. It is east and central regions contain the highest percentage of poorly
developed neighbourhoods in rural India. Moderately developed neighbourhoods are mostly
concentrated in rural India as is 45-55 percent in most of the region except for in north east region (27
percent). Regional pattern of neighbourhood development has been found highly significant (p>0.005)
also.

F
Cast
Inter
This s
locatin
contrib
perfor
may b
the op
outcom
constr
to com
we ha
neighb
develo
percen
ST pop
develo
contra
43% S
develo
rural I
infrast
Figure 1: Cast
e Groups D
r-linkages
ection analyse
ng caste group
bution of each
mance of poor
be linked to lac
pportunity. On
mes keep them
uction of separ
mpare their dev
ave however t
bourhood and
oped neighbour
First, we lo
nt of Others ca
pulation. It is p
oped villages, t
ast, in poorly d
ST population.
oped villages, i.
India, most of
tructure and se
te Group dist
Domination
es level of neig
ps in these n
of the compon
r castes on man
ck of the requi
the other han
m poorly develo
rate caste grou
velopment leve
tried to observ
also tried to
rhoods’.
ook at village d
aste group pop
pertinent to ad
hus equating t
eveloped villag
The highest p
.e. 43 percent
the people ar
ervices are not
ribution in di
n and Neigh
ghbourhood de
neighbourhoods
nents separate
ny indicators o
red infrastruct
nd, poor capab
oped at individu
up wise human
el. However, th
ve location or
examine the
development a
ulation live in h
d here that aro
the issue of dev
ges, only 19 pe
proportion of a
of ST to 53 pe
re living in mo
available with
16
fferent type o
hbourhood
evelopment an
s at the aggr
ly. The logic be
of human devel
ure and servic
bilities to acce
ual level. More
development
his issue is bey
distribution of
validity of the
t aggregate le
highly develop
ound 33 percen
velopment of S
ercent Others c
all caste group
rcent of Others
oderately devel
in their villages
of neighbour
Developm
d their linkage
regate level an
ehind inclusion
opment is very
ces & amenities
ess the opportu
eover, as of now
index for the c
yond the scope
f caste groups
e notion of ‘po
evel. Figure 1 d
ed villages as a
nt SC populatio
SCs with neighb
caste group po
ps are found co
rs and OBC pop
loped villages
s but are not v
hood in rural
ment:
es with social
nd also tries
n of cast group
y poor. On the
s required to m
unity and to e
w there is no p
country as a wh
e of this study
s in differently
oor castes live
delineates that
against of only
on are now fou
bourhood deve
opulation live a
oncentrated in
pulation. This sh
or neighbourh
very distant, bu
l India
disparity by
to find the
s is that the
one hand it
make use of
excel on the
provision for
hole in order
y, but herein
y developed
es in poorly
t around 29
y 13 percent
und in highly
elopment. In
as against of
moderately
hows that in
hoods where
ut in case of

17
ST dominated villages/neighbourhoods the situation is just opposite, as most of the services and
infrastructures here are available at significant distance, which results in inequality of opportunity.
Table 12: Neighbourhood Development and Caste Group Domination in Rural India
Others OBC SC ST Total
On Communication and Services
Highly developed 34.9 28.1 24.9 8.0 27.5
Moderately Developed 46.9 53.3 56.6 43.1 50.4
Poorly Developed 18.2 18.5 18.5 48.9 22.1
N 478 583 189 174 1424
On Education Institutions
Highly developed 22.1 19.1 19.0 9.0 18.8
Moderately Developed 65.2 66.8 65.2 57.7 64.9
Poorly Developed 12.7 14.1 15.8 33.3 16.3
N 411 497 158 156 1222
On Health Institutions
Highly developed 32.5 32.5 36.6 16.0 31.4
Moderately Developed 50.0 49.6 47.2 42.6 48.8
Poorly Developed 17.5 17.9 16.3 41.5 19.8
N 348 419 123 94 984 Figures in table represent bivariate relationship are statistically significant based on Chi-square test (p>0.05).
Source: Author Calculation on IHDS Data
The neighbourhood can be categorised based on the development on selected components of
services and infrastructural development. For a better understanding of the distribution of caste group,
a disaggregated table on each of these components is provided into table 12. In terms of
neighbourhood communication and services index, a little above one fourth (27 percent) of the
neighbourhoods are found highly developed; around half (50 percent) of the neighbourhoods are
moderately developed and rest are poorly developed. Further, in terms of linkages, the highest (35
percent) of Others population live in highly developed neighbourhoods as against of only 8% ST
population living in highly developed neighbourhoods. The percentage for OBC and SC population are
28 percent and 25 percent respectively in these neighbourhoods. In contrast, in poorly developed
neighbourhoods, only around 18% of Others, OBC and SC are living as against of 49% ST population. It
is important to point out here that the maximum number of OBC and SC are residing in neighbourhoods
which are moderately developed on indicators of communication and services component.
A correlation of distance/proximity of educational institutions with caste group distribution in
neighbourhoods shows almost the same pattern as communication and services infrastructure, although
in varying proportion but health institutions shows some different patterns, as can be observed from the
data in table 12. In regard to development of neighbourhood based on availability of educational
institutions components, it can be seen that around 19 percent villages are highly developed, 16% are
poorly developed, and the rest are moderately developed. As the development of neighbourhood is
linked with distance of selected educational institutions from the neighbourhood, it does not signify the

18
quality of education provided by those institutions. In regard to the proportion of different caste group
people living is these neighbourhoods, it is seen that 22 percent of Others live in highly developed
neighbourhoods on educational institution index as against of only 9 percent of ST people. In contrast,
in poorly developed neighbourhoods, the population consists of 13 percent of Others people to 33
percent of ST. The percentage of OBC and SC population in these villages is 14 percent and 16 percent
respectively.
Coming to the linkages between availability of different type of health institutions and
proximity to neighbourhoods in rural India, 31 percent neighbourhoods are found highly developed, 20
percent least developed and the rest somewhere between the two extremes. Moving on to social
disparity, it is found that the highest (37%) of SC population live in neighbourhoods that are highly
developed in terms of health facilities indicator, followed by Others and OBC (32.5 percent each)
whereas the highest percentage of ST population still live in least developed neighbourhoods on health
facilities. Due to the high concentration of health facilities in SC dominated neighbourhoods, the highest
proportion of SC people are been found living in highly developed neighbourhoods at the aggregate
level. However, the IHDS does not contain data on service delivery or available healthcare services in
those health institutions; therefore it cannot be said that the availability of higher number of health
institutions/health facilities automatically assures better health outcomes among SC people, as their
economic status plays an important role in health care behaviours. Even with assured availability of
these institutions in the areas where poor people live, quite often their accessibility on one hand and the
quality of healthcare services on the other hand, provided to poor people in those health institutions
would be questionable.
Discussion and Conclusion Rural Development still remains focused on the sustained growth of rural economy and bringing
improvements in the well being of the people in rural areas, but without developing the rural areas, it is
not possible to improve their well being. This study focuses on measuring the development of villages
as evidenced by neighbourhood development in terms of availability of three important infrastructural
components like communication & services, educational institutions and health institutions. Availability
of communication and services infrastructure in any locality may increases the accessibility and possible
affordability of access to other services like access to education and healthcare and hence other
opportunities. Education and healthcare are two basic components of human development throughout
the world; contribution of these factors have been significant in India also where over 69 percent of the
population still live in rural areas, according to Census data, 2011. An explanation for the high level of
education, health and higher life-span in urban areas than in rural areas can possibly be found in the
more easy availability of these components in urban areas. The high rural to urban migration rate is one
of the possible explanations for the high availability of these basic components in urban areas than the
rural ones. Therefore, a relook look at villages/ neighbourhoods in rural India is much needed in our
endeavour to globalize the notion of development.
The study reveals that a almost half (49 percent) of the neighbourhoods in rural India are
moderately developed, and around one fifth are poorly developed. Considering different selected

19
components like communication & services indicators, educational and health institutions, their
availability at village level is highly correlated with each other. For instance the level of services &
communication indicators and educational institutions explain about 97 percent variance in human
development scores, whereas health institutions explained around 71 percent variance in rural
neighbourhood or village development. The earlier studies on village development have recorded the
contribution of several indicators to human development in rural India. Shariff (1999) in his study on
human development in India had highlighted the low rates of birth and death, high literacy rate and low
morbidity rates in villages which were within the two kms from pucca road. Several studies of
neighbourhood in developed countries have highlighted the positive and significant relationship of
neighbourhood development with educational and health outcomes (Kawachi & Berkman, 2003).
However, here our prime concern is not to measure the linkages of neighbourhood development with
human development outcomes but to measure caste group disparity and their spatial concentration.
In rural India, most of the indices under study have been found linked with development of
other indices. For example, government maternity centre, government communicable disease
prevention centre, etc mostly are located in the district hospitals or at very close distance from the
district hospitals. As the distance to the district head quarters or district hospital increases, their
availability also decreases correspondingly. The highest contribution to healthcare in India is provided
by private healthcare providers, but most of these facilities like private clinics, private maternity centres,
private pharmacies and private hospitals are located close to one another other clusters and not
spatially distributed. Almost the same is the case of educational institutions. In economic jargon it is
known as ‘agglomeration effect’ whereby development of one of the indices leads to development of
others. There are currently very few studies on the ‘agglomeration effect’ and the area or place where
are they are agglomerated, whether in affluent areas or in deprived areas.
Having observed the underlying structural relationship of village neighbourhood development
and caste group distribution in these neighbourhoods on all the pertinent components, it can be
concluded that high percentage of Others caste group people live in highly developed neighbourhoods
(also with higher concentration of health care institutions) as against the lowest percentage of ST
followed by SC and OBC. Overall, it can be stated that the neighbourhood development has an inverse
relationship with the development of settlements containing different caste group populations. Here, it
can be stated very clearly that it may be possible that the poor caste people remain poor due to
unavailability of possible developmental infrastructure in their neighbourhoods and this adversely impact
their development. It might not be wrong to argue that inequality of opportunity leads to inequality of
outcomes (Desai & Dubey, 2011). It can also be argued that the highest proportion of ST and SC
population are found living in poorly developed neighbourhoods whereas highest proportion of Others
or OBC are found living in highly or moderately developed neighbourhoods.
As pointed out in the preview of this study, there is need to study the relationship of village or
neighbourhood development with human development indicators than only to measure the level of
human development in rural India. This study provides insights on the possible gaps in research arena
as well as on micro level policy issue. It is well known that rural areas perform poorly on many more
indices of human development; however, within the rural areas the fruits of development are not

20
equally distributed. From the findings of the study, it becomes clear that the performance of SC and ST
people is very poor on many indicators of development outcomes like health, education etc. It could be
due to residence in the villages where infrastructural development is very poor, or are located very far
away from their locality, making them less accessible. A recent study (Raushan & Mutharayappa, 2014)
has found that in villages with good road connectivity, the number of ST children who underwent
curative care increased by 25 percent on an average. In rural India, people generally depend on
government healthcare facilities for curative care services and great distances often separate them from
health care/curative facilities.
Most Indian studies on caste structure and developmental linkages have been based more on
sociological and political perspectives. These issues need to be investigated from another perspective,
i.e., perspective of development in rural India with focus on neighbourhood development rather than
human development. There is also a need to create a caste group based human development index at
state level rural urban framework. Only a few states in India, have prepared state level human
development indices. In this context more effort is needed with special focus on the states having poor
human development index values. Further, needful infrastructure at village should be made available in
order to reduce the inequality of opportunity in availing and accessing the services by villagers. It is
essential to mitigate past inequality of outcomes and also to ensure that the dynamism is injected in
them to sustain the progress in human development indices. So, the prime focus of micro level planning
and policy formulation centred on rural India should be focused on areas where high concentration of
poor people is found and also in villages which are lagging behind on infrastructural development.

21
References Adelmen, I and G Dalton (1971). A Factor Analysis of Modernisation in Village India. The Economic
Journal , 81 (323).
Blackman, T (2006). Placing Health: Neighbourhood Renewal, Health improvement and Complexity.
United Kingdom: The Policy Press.
Buck, N (2001). Identifying Neighbourhood Effects on Social Exclusion. Urban Studies, 38 (12): 2277-
98.
Desai, S and A Dubey (2011). Caste in 21st Century India: Competing Narratives. Economic and Political
Weekly, 46 (11): 40-49.
Desai, S B, A Dubey, B L Joshi, M Sen, A Shariff and R Vanneman (2010). Human Development in India:
Challenges for a Society in Transition. New Delhi: Oxford University Press.
Dillon, W R and M Goldstein (1984). Multivariate Analysis: Methods and Applications. New York: John
Wiley & Sons.
Gulati, S C, R Singh, R Raushan and Arundhati (2010). Evaluation study of NRHM in 7 states of India.
Evaluation study report submitted to Planning Commission. Government of India, Planning
Commision, New Delhi.
Jodhka, S S (2012). Village Society. Hyderabad: Orient Blackswan Private Limited.
Kawachi, I and L F Berkman (2003). Neighbourhood and Health. New York: Oxford University Press.
Lal, M (1989). Rural Roads and Socio Economic Development. Delhi: Amar Prakashan.
Lupton, R (2003). Neighbourhood Effects: Can we Measure Them and Does Matter? London: London
School of erconomics, CASE paper 73.
Madan, G and T Madan (1983). Village Development in India: A Sociological approach. New Delhi: Allied
Publishers Private Limited.
Nayar, K R (2007). Social Exclusion, Caste & Health: A Review Based on Social Determinants
Framework. Indian Journal of Medical Research, 126: 355-363.
Pickett, K E and M Pearl (2001). Multilevel Analysis of Neighbourhood Socioeconomic Context and
Health Outcomes: A Critical Review. Journal of Epidemiology & Community Health, 55 (2):
111-22.
Raushan, R and R Mutharayappa (2014). Social Disparity in Child Morbidity and Curative Care:
Investigating for Determining Factors from Rural India. ISEC Working Paper, Bangalore.
RGI (2011). Census 2011. Ministry of Home Affairs. New Delhi: Office of the Registrar General & Census
Commissioner, India.
Shariff, A (1999). India Human Development Report: A Profile of Indian States in the 1990s. New Delhi:
Oxford University Press.
Wilson, W J (1987). The Truly Disadvantaged: The Inner City, the Underclass and Public Policy.
Chicago: University of Chicago Press.

22
Appendices
The Basic Model of Factor Analysis
The basic common factor analytic model is usually expressed as
X = Λf + e ------------------------------1
Where,
X = p-dimensional vector of observed responses i.e., X′ = (x1, x2,…….., x p),
f = q-dimensional vector of unobservable variables called common factors i.e.,
f′ = (f1, f2, …….., f p),
e = p- dimensional vector of unobservable variables called unique factors i.e.,
e′ = (e1, e2, …….., e p),
Λ = p x q matrix of unknown constant called factor loadings,
λ11 λ12 . . λ1q
λ21 λ22 . . λ2q
Λ = . . . . .
. . . . .
λp1 λp2 λp3 λp4 λpq
Extending the equation 1 i.e, linear factor model:
Xi = λi1 f1 + λi2 f2 + λi3 f3 + . . . + λiq fq + e1 -------------------------- 2
For factoring of different variable (i= 1,2,3,4………..p) would be illustrated as
X1 = λ11 f1 + λ12 f2 + λ13 f3 + . . . + λ1q fq + e1
X2 = λ21 f1 + λ22 f2 +λ23 f3 + . . . + λ2q fq + e2
.
.
Xp = λp1 f1 + λp2 f2 + λp3f3 + . . . + λpqfq + ep
Here, λi are the coefficients of X-s and are called factor loadings. Factor loadings would be chosen in
such a way that principal components are uncorrelated to each other. It also has to be ensured that
first principal components would absorb a maximum possible proportion of total variation of X-s and out
of the remaining variation, maximum proportion would be absorbed by the second principal component
and the process will be continued again for remaining variations like third, fourth principal components
and so on. The total contribution of factor fj to the total variance of the entire set of variable is given by
the Eigen value of factor fj.

23
Table A1: Correction Matrix of Indices of Services & Amenities Variables at Village Level in India
Services & Amenities Indices Nearest Town
District HQ
Pucca Road
HH not having
Electricity
HH not having
any phone
Closest Bank
Branch
Closest STD
Booth
Closest Bus Stop
Closest Market
Post Office
Distance Nearest Town 1
Distance to District HQ 0.2238 1
Distance from Pucca Road 0.1547 0.1288 1
% HH not having Electricity 0.1165 0.2139 0.1593 1
% HH not having any kind of phone 0.1165 0.2139 0.1593 1.0000 1
Distance to Closest Bank Branch 0.1896 0.2187 0.3057 0.2137 0.2137 1
Distance to Closest STD Booth 0.1691 0.1635 0.2956 0.2109 0.2109 0.3542 1
Distance to the Closest Bus Stop 0.0624 0.0936 0.3511 0.2196 0.2196 0.2304 0.2530 1
Distance to Closest Market 0.2067 0.1750 0.0746 0.1178 0.1178 0.4050 0.2547 0.0674 1
Distance to Closest Post Office 0.0539 0.0294 0.2440 0.1405 0.1405 0.3263 0.2670 0.2517 0.1469 1
Table A2: Correction Matrix of Indices of Educational Institutions at Village Level in India
Educational Institutions Primary Schools
Middle Schools
Secondary Schools
+2 Schools Colleges Vocational
Institutes Madarasas Anganwadi Centres
Primary Schools 1
Middle Schools 0.1216 1
Secondary Schools 0.0671 0.3968 1
Senior Secondary Schools (+2) 0.0475 0.2312 0.4950 1
Colleges -0.0042 0.0841 0.2377 0.3229 1
Vocational Institutes -0.0173 0.0444 0.1197 0.1593 0.3513 1
Madarasas 0.1082 0.0592 0.0560 0.0789 0.1302 0.2390 1
Anganwadi Centres 0.3312 0.2018 0.1282 0.0959 0.0481 0.0685 0.0994 1

24
Table A3: Correction Matrix of Indices of Health Institutions at Village Level in India
HSC PHC CHC DH Govt.
Maternity Centre
Govt. Communicable Disease Facility
Pvt. Clinic-
Trained Doctor
Pvt. Hospitals
Pvt. Pharmacy
Pvt. Maternity
Centre
Health Sub-centre (HSC) 1
Primary Health Centre (PHC) 0.2885 1
Community Health Centre (CHC) 0.0684 0.1379 1
District Hospitals (DH) 0.0710 0.1061 0.2471 1
Govt. Maternity Centre 0.1291 0.0773 0.2467 0.2826 1
Govt. Communicable Disease Facility 0.1227 0.0820 0.2682 0.2589 0.5518 1
Pvt. Clinic-Trained Dr. 0.1012 0.1240 0.2317 0.1800 0.2879 0.2311 1
Pvt. Hospitals 0.1480 0.0946 0.2288 0.2109 0.3831 0.2868 0.4454 1
Pvt. Pharmacy 0.1362 0.0956 0.1843 0.1574 0.3079 0.3291 0.3627 0.3326 1
Pvt. Maternity Centre 0.0736 0.0568 0.1987 0.1730 0.3516 0.2513 0.3536 0.4916 0.2929 1