rallis india limited...rallis india limited corporate identity no. l36992mh 1948plc014083 3rd june,...
TRANSCRIPT

RALLIS INDIA LIMITED Corporate Identity No. L36992MH 1948PLC014083
3rd June, 2019
The General Manager Corporate Relationship Dept. BSE Limited Phiroze Jeejeebhoy Towers Dalal Street Mumbai 400 001 Fax No. 2272 2039/ 2272 2041 Scrip Code: 500355
Asst. Vice President National Stock Exchange of India Ltd. Exchange Plaza, 5th Floor Plot No. C/1, G Block Bandra - Kurla Complex Bandra (E)Mumbai 400 051 Fax No. 2659 8237 / 2659 8238 Symbol: RALLIS
Dear Sir,
Sub: Annual Report - Regulation 34 of the SEBI (Listing Obligations and Disclosure Requirements) Regulations, 2015.
The Seventy First Annual General Meeting ('AGM') of the Company will be held on Friday, zs" June, 2019 at 3.00 p.m. at Walchand Hirachand Hall, 4th Floor, Indian Merchants' Chamber Building, IMC Marg, Churchgate, Mumbai 400 020.
Pursuant to Regulation 34(1) of SEBI (Listing Obligations and Disclosure Requirements) Regulations, 2015, we are submitting herewith the Annual Report of the Company along with the Notice of AGM for the financial year 2018-19 which is being dispatched/ sent to the members by the permitted mode(s).
The Annual Report for the financial year 2018-19 is uploaded on the website of the Company (www.rallis.co.in).
Kindly take the same on your record.
Thanking you,
Yours faithfully, RALLIS INDIA LI
(YASH SHETH) COMPANY SECRETARY
Regd Office 156/157 15th Floor Nariman Bhavan 227 Nariman Point Mumbai 400 021 Tel 91 22 6665 2700 Fax 91 22 6665 2847 website www.rallis.co.in
A TATA Enterprise

Accelerating Farm Prosperity71st Annual Report 2018-19

Basis of Reporting
Our apprOach tO the adOptiOn Of integrated repOrting <ir>Integrated Report <IR> is fast emerging as a new corporate reporting platform and practice. <IR> enhances and enriches reporting primarily due to its (i) wider focus on creating value for all stakeholders and (ii) utilisation and interlinkages of multiple capitals in the value creation process.
While <IR> is not yet statutorily mandated we, at Rallis India Limited (Rallis), have voluntarily commenced our <IR> journey as part of our constant endeavour towards transparency and disclosures beyond statutory norms.
The Report embraces the holistic reporting approach as suggested by the International Integrated Reporting Council (IIRC) and the Securities and Exchange Board of India’s (SEBI) circular dated 6th February, 2017.
repOrting principle The Report is prepared in line with the Companies Act, 2013 (and the Rules made thereunder), Indian Accounting Standards, SEBI (Listing Obligations and Disclosure Requirements) Regulations, 2015, Secretarial Standards and IIRC’s <IR> framework. The Report is compiled with the help of various internationally recognised framework and guidelines especially to present the non-financial data in a manner that is concise, comparable and enhances the value of the Report for the shareholders as well as other stakeholders.
repOrting periOd, scOpe and bOundary The Report covers financial and non-financial information and activities of Rallis and subsidiaries - Metahelix Life Sciences Limited and Zero Waste Agro Organics Limited for the period 1st April, 2018 to 31st March, 2019. While the financial information has been audited by B S R & Co., LLP, Chartered Accountants, the non-financial information are management estimates.
apprOach tO materiality The Report covers key material aspects that have been identified through various stakeholder engagements, their impact on the Company’s value-creation process and how these are being addressed with a measurable target. This will assist stakeholders to take informed decisions regarding their engagement with the Company.
To view or download this report, please log on to www.rallis.co.in/investor_relations.aspx?InvestorRelationSection ID=2&menuID=57

What’s Inside?
cOrpOrate OVerVieW financial statements01-36 118-257Company at a Glance 04Performance Highlights 06Chairman’s Message 08Board of Directors 10Business Model and Value Creation 12Business Review 14Strategies to Accelerate Pace 15Our Approach to Materiality 18Engaging with the Stakeholders 19Managing Risks Proactively 20Harvesting Hope for Farmer Success 22Accelerating Pace with Operational Excellence 26Innovation - the Way Forward 28Unlocking the People Potential 30Being a Responsible Organisation 32Senior Leadership 36
Standalone Financial StatementsIndependent Auditors’ Report 119Balance Sheet 130Statement of Profit and Loss 131Statement of Changes in Equity 132Statement of Cash Flow 133Notes to Financial Statements 135
Consolidated Financial StatementsIndependent Auditors’ Report 187Balance Sheet 194Statement of Profit and Loss 195Statement of Changes in Equity 196Statement of Cash Flow 197Notes to Financial Statements 199Form AOC - 1 257
statutOry repOrts37-117Board’s Report 38Management Discussion and Analysis Report 72Corporate Governance Report 88 Business Responsibility Report 108
fOrWard-lOOking statements Certain statements in this Report relating to our business operations and prospects may be forward-looking statements. These statements can be identified by usage of words such as ‘believes’, ‘estimates’, ‘anticipates’, ‘expects’, ‘intends’, ‘may’, ‘will’, ‘plans’, ‘outlook’ and other words of similar meaning in connection with a discussion of future operating or financial performance.
These forward-looking statements are dependent on assumptions, data or methods that may be incorrect or imprecise and hence may be incapable of being realised. Such statements are not guaranteed of future operating, financial and other results, but constitute our current expectations based on reasonable assumptions. The Company’s actual results could materially differ from those projected in any forward-looking statements due to various future events, risks and uncertainties some of which are beyond our control. We do not assume any obligation to update or revise any forward-looking statements, whether as a result of new information, future events or otherwise.
Annual General Meeting
Friday, 28th June, 2019
Time 3.00 p.m.
Venue Walchand Hirachand Hall, 4th Floor, Indian Merchants’ Chamber Building, IMC Marg, Churchgate, Mumbai 400 020
Book Closure Dates
21st June, 2019 to 28th June, 2019 (Both days inclusive)
258-280Notice 258Financial Statistics 275Attendance Slip/Proxy Form

Accelerating Farm Prosperity
Agriculture which contributes to 16% of the GDP and provides employment to nearly half of the country’s population, plays an important role in the Indian economy. India is a leading farm producer as well as an exporter of many agro commodities. Its agro economy faces multiple challenges which is reflected in the relatively lower productivity compared to the advanced economies of the world. Science provides solutions to address some of these challenges and in turn, these provide opportunities for businesses involved in agriculture inputs.
By virtue of our long association with farmers we, at Rallis, leverage our deep understanding of their needs to develop and deliver innovative inputs to enhance farm productivity.
Our product offerings include crop protection, seeds, plant growth nutrients and organic compost. We partner with global agro-chem players by offering crop protection chemicals as well as contract manufacturing services by leveraging our expertise in chemistry.
We are focused on,
02 | 71st Annual Report 2018-19
Corporate OverviewRallis India Limited

Our Values
• Safety• Passion• Integrity
• Customer-Centricity • Excellence
Our VisiOn
We aspire to be amongst the top 3 leading enterprises by
2025 in the chosen areas within farm inputs and chemistry-
led businesses
Our missiOn
Serving Farmers Through Science
03
Company at a Glance

Rallis: Serving Three Generations of the Farming Community with the Best of Science
At Rallis India Limited (Rallis), we are a part of the USD 110 billion Tata group and are associated with the farming community for 168 years. Trust built over long years reflects the strength of pioneering offerings, which helped farmers in addressing challenges of crop care from time to time.
We reach about 80% of the districts of India with our innovative and safe products developed through in-house Research and Development as well as in partnership with global innovators.
We remain committed to “Serving Farmers through Science” for sustainable farm prosperity.
Our presence in the agricultural Value chain
OrganisatiOnal structure – Our businesses
Seeds CropProtection
SoilConditioners
Plant Growth Nutrients
dOmestic business
Development, manufacturing and distribution of agri inputs: Seeds: Paddy, Millet, Maize, BT Cotton, Mustard,
Vegetables Crop Protection: Herbicides, Fungicides, Insecticides,
Seed Treatment Chemicals, Household Pesticides Soil Conditioners Plant Growth Nutrients
internatiOnal business
Alliances and direct partnership Distribution of technical-grade crop care and branded
formulations in international markets
Contract manufacturing Manufacturing molecules for global agro chemical
companies
04 | 71st Annual Report 2018-19
Corporate OverviewRallis India Limited
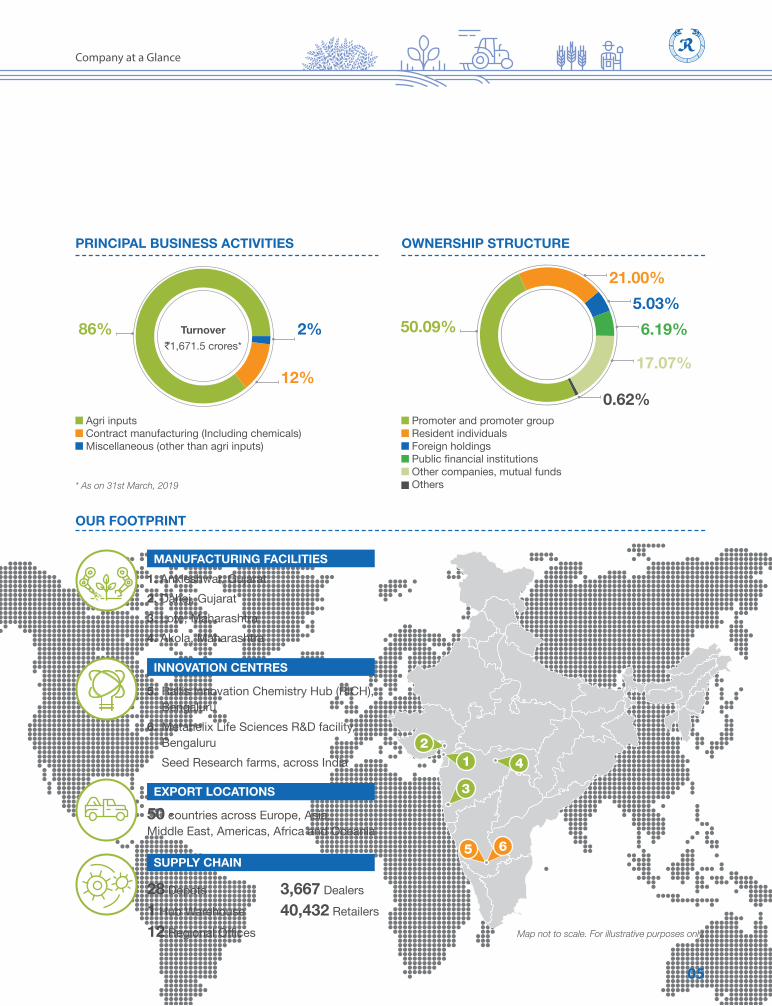
principal business actiVities OWnership structure
manufacturing facilities1. Ankleshwar, Gujarat2. Dahej, Gujarat3. Lote, Maharashtra4. Akola, Maharashtra
expOrt lOcatiOns
50 countries across Europe, Asia, Middle East, Americas, Africa and Oceania
28 Depots1 Hub Warehouse12 Regional Offices
3,667 Dealers40,432 Retailers
supply chain
innOVatiOn centres
5. Rallis Innovation Chemistry Hub (RICH), Bengaluru
6. Metahelix Life Sciences R&D facility, Bengaluru
Seed Research farms, across India
Our fOOtprint
Map not to scale. For illustrative purposes only.
21
3
4
65
2%
21.00%5.03%6.19%
17.07%
0.62%12%
86% 50.09%
Agri inputs Contract manufacturing (Including chemicals) Miscellaneous (other than agri inputs)
Promoter and promoter group Resident individuals Foreign holdings Public financial institutions Other companies, mutual funds Others
Turnover `1,671.5 crores*
* As on 31st March, 2019
05
Company at a Glance

financial capital
manufactured capital
Performance Highlights
Financial capital represents funds available and utilised for investment in manufacturing and other forms of capitals. We generate funds from surplus arising out of business operations and financing activities in the form of equity and debt. We leverage our expertise to source funds from various channels to strengthen our balance sheet.
Manufactured capital represents our plants, physical assets, warehouses and logistics facilities. We use these for production and distribution of our formulations and chemicals. We continually invest in these to enhance production, safety and reliability of operations and ensure efficient distribution.
Turnover ` 1,671.5 crores Increased by 10% from ` 1,515.94 crores recorded in FY 2017-18 owing to the strong performance of the international business and increase in product realisation.
Turnover ` 1,983.96 crores Increased by 10% from ` 1,808.46 crores recorded in FY 2017-18 owing to the strong performance of international business and increase in product realisation.
Manufacturing plants 4Gujarat: Ankleshwar and Dahej Maharashtra: Lote and Akola
rOce 15%Declined by 96 basis points from 16% recorded in FY 2017-18.
rOce 16%Declined by 170 basis points from 18% recorded in FY 2017-18.
rOnW 10%Declined by 167 basis points from 12% recorded in FY 2017-18.
rOnW 12%Declined by 199 basis points from 14% recorded in FY 2017-18.
ebitda ` 206.3 crores Declined by 9% from ` 226.19 crores recorded in FY 2017-18 owing to increase in import costs of raw materials from China and higher exceptional charges.
ebitda ` 240.94 crores Declined by 9% from ` 264.47 crores recorded in FY 2017-18 owing to increase in import costs of raw materials from China and higher exceptional charges.
Standalone
Consolidated
Formulations manufactured 16,192 KL/MT Decreased by 6% in FY 2018-19 compared to previous year.
pat ` 128.98 crores Declined by 9% from ` 141.49 crores recorded in FY 2017-18.
pat ` 154.78 crores Declined by 7% from ` 167.02 crores recorded in FY 2017-18.
Technical grade crop care products manufactured 8,440 mtDecreased by 12% in FY 2018-19 compared to previous year.
06 | 71st Annual Report 2018-19
Corporate OverviewRallis India Limited

intellectual capital
sOcial and relatiOnship capital
human capital
natural capital
Intellectual capital represents our scientific knowledge and research skills which form the backbone of our business. It enables us to develop superior products, improve process efficiency and drive resource optimisation. We collaborate with global experts, institutions, innovators and start-ups to strengthen our capabilities and innovation quotient.
Social capital represents our engagement with the communities and investment in their development. We continue to build on the ethos of the Tata group by going beyond the regulations and maximising our impact. We have mapped our social interventions with the United Nation’s Sustainable Development Goals (SDGs).
Relationship capital represents our focus on building long-term and trust-based relations with our business partners. We work closely with them to build their capacities, share knowledge and invest in product innovation to match their requirements.
Human capital represents the collective knowledge, skills and experience of our workforce that facilitates in value creation. We invest in their skill building, engagement and welfare to maximise the outcomes and provide them with a safe and healthy work environment.
Natural capital represents all the renewable and non-renewable resources that we utilise for our operations, including raw materials, land and water. We make these investments to ensure that our operations are sustainable.
Investment in R&D ` 19.80 crores We have stepped up our R&D efforts and have new molecules and seeds in pipeline.
CSR outreach (no. of beneficiaries) 1,55,205
Fresh Water Consumption (m3) 3,45,123
Innovation turnover index 10%
Customer satisfaction index (Net Promoter Score for farmers) 35
Turnover per employee ` 1.67 crores
Diversity (nos.)male - 968 female - 33
Patents filed 29 Cumulative no. of patents filed between FY 1994-95 and FY 2018-19.
Farmers and their families supported (nos.)33,758
Employees covered under talent development programme (nos.)39Through Tata Management Training Centre
Employee engagement score 79%
Utilisation of Renewable Energy in FY 2018-19 (Mwh)5,400
07
Performance Highlights

Chairman’s Message
In FY 2018-19, we continued our efforts to drive farmer prosperity with our innovation driven products, agronomic services and digital technology. Farmers continue to remain at the core of our strategy and we remain motivated to serve their composite needs. The theme of this Annual Report ‘Accelerating Farm Prosperity’ aptly captures this message.
This report marks the beginning of our Integrated Reporting <IR> journey. The reporting format is in line with our efforts to present a fair, transparent and holistic view of our value creation process to our stakeholders.
perfOrmance reVieW FY 2018-19 was a challenging year, attributed to external and internal factors. Externally, environmental crackdowns in China continued and disrupted operations of several upstream suppliers, some of whom even shut down. This triggered a raw material scarcity and led to price hikes. Closer home, erratic monsoon, uneven rainfall distribution and its prolonged withdrawal in certain locations led to a drastic shifting in crop and pest load, along with rural distress. While crops such as paddy and cotton experienced a bad season, soybean and groundnut, despite undergoing a good season, witnessed low output price. Further, restrictions on co-marketing of products in certain States impacted sales. Consequently, greater levels of credit and sales returns together with expenses towards new technology absorption, impacted cash flows.
Amidst a challenging scenario, our strong portfolio, distribution network and brand equity enabled us to deliver a steady performance. In the domestic business, although volumes were largely flat with margins being under pressure, an encouraging sign has been the growing acceptance of our Rallis Samrudh Krishi® (RSK) package. Through RSK, we provide holistic solutions to the farmers – right from seeds to harvest, digital technology-enabled agronomy and weather information services. Increasing number of farmers for RSK validates its effectiveness in enhancing their yield and income. This is a big positive for our future growth.
Our international business performed well. Disruptions in China led to customers looking for better avenues for consistent and reliable supply of agro chemical products. A proven track record, along with the advantage of being a Tata group company, worked in our favour. We added new customers, achieved new product registrations and also retained existing customers through strong customer relations management. This led to an improved demand in the key markets of Brazil, the US, Europe and South East
`155 crores
Consolidated Profit After Tax
`1,984 crores
Consolidated Revenues
Dear Shareholders,
Amidst a challenging scenario, our strong portfolio, distribution network and brand equity enabled us to deliver a steady performance.
08 | 71st Annual Report 2018-19
Corporate OverviewRallis India Limited

Asia. Though issues of capacity constraints perforce led us to forego several spot business opportunities, we remained focused on addressing this by ramping up the capacity of our Dahej plant.
Our subsidiary, Metahelix Life Sciences (Metahelix) also faced challenges leading to marginal growth in revenues and a decline in the bottom line. Despite difficult market conditions, it continued to maintain and grow its market share across various product lines. This is a positive trend, which indicates the strength of our product line-up and the robustness of its marketing and distribution initiatives.
Overall, for FY 2018-19, our consolidated revenue from operations grew by 10% to ̀ 1,984 crores, whereas pressure on margins led to EBITDA and PAT declining by 9% and 7%, respectively, to ` 241 crores and ` 155 crores, respectively.
fOcused On regaining mOmentum Even as the numbers have been on the lower side, it is important to consider the strong fundamentals of the organisation. We are one of the few companies serving the composite needs of farmers. We have a strong portfolio of seeds, crop protection, organic compost and plant growth nutrient products, coupled with agronomic services backed with digital technology. This is being further fortified with a strong line-up of products.
We are determined to fill our portfolio gaps, supported by products from alliances and a strong R&D drive. We are looking at achieving deeper market penetration by expanding our distribution network and supporting them with enhanced incentive programmes and digital technology. Our product development teams are also working towards alternate product delivery mechanisms.
We remain optimistic about our international business. In fact, we consider this segment to be our key growth driver with significant opportunities in product distribution and contract manufacturing space, led by our strong partnerships. We are making the right investments to scale this business higher. We have already made investments towards expanding our manufacturing capacities, setting up new capacities for critical inputs as part of backward integration, acquiring more product registrations and thrust on R&D for developing relevant products for key markets. In the contract manufacturing space, we are reaching out to more customers to build new partnerships, leveraging our process and formulation development track record and our low-cost manufacturing advantage.
streamlining OperatiOns The seeds segment is an important growth business for us. Until now, this portfolio was handled by both Rallis and Metahelix separately. There was a need to optimise resource allocation and make the operations lean and hence, we took a strategic call of discontinuing our internal
seeds operations. During the year under review, the Board has approved the merger of Metahelix into Rallis to achieve operational synergies. The merger is subject to necessary statutory and regulatory approvals.
safety & sustainability Despite robust safety management processes, there was an unfortunate incident of flash fire at the Ankleshwar unit during the year resulting in fatality of one employee. We have provided all support to the family of deceased employee. We are also taking various measures to further strengthen our process safety to ensure safe and healthy environment at all our units.
As much as we are contributing towards transforming India’s agricultural scenario, we also remain committed to improve the communities around us and nurture the planet. Investment in renewable energy sources, effluent management and water recycling has enabled us to significantly reduce consumption of natural resources and the impact of our operations on the environment. Our efforts on reducing emission, harmful liquid discharge and toxicity of our products, by shifting to an environment-friendly portfolio, has significantly reduced our carbon footprint. Additionally, we are also adopting key initiatives to make all our buildings green. Our social initiatives are directed towards education, farmer awareness, skill development and ensuring the safety of our people.
Way fOrWardOur intent, going forward, will be to accelerate farm prosperity, while striving for long-term sustainable growth. We have devised key strategies and embarked on several initiatives towards this goal. Our focus continues to be on effective implementation of these strategies to maximise value creation.
I would like to place on record the appreciation of the Board for the contribution of Mr. V. Shankar who stepped down from the Board to lead the Centre of Sustainable Agriculture and Farm Excellence (C-SAFE), an initiative to commemorate the 150 years of the Tata group. I also welcome Mr. Sanjiv Lal as the Managing Director & CEO effective 1st April, 2019.
I thank all our stakeholders for their whole-hearted support. As we move towards a better tomorrow, our intent will be to create value for each stakeholder – to ensure we can grow together.
Regards
Bhaskar BhatChairman
09
Chairman’s Message
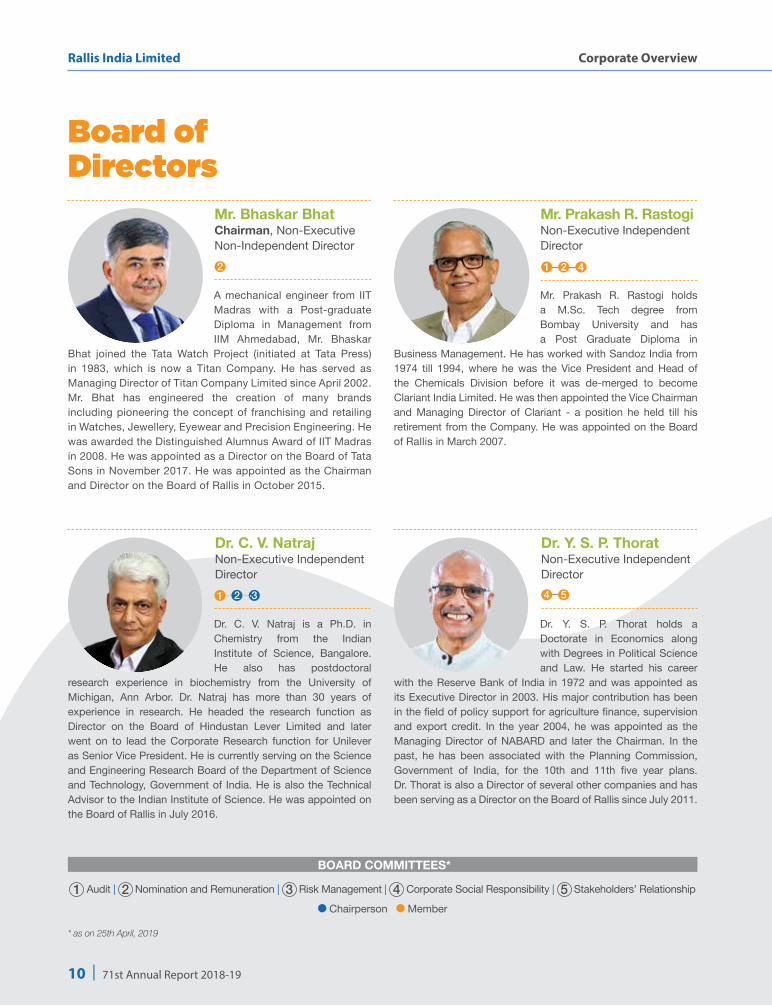
Board of Directors
A mechanical engineer from IIT Madras with a Post-graduate Diploma in Management from IIM Ahmedabad, Mr. Bhaskar
Bhat joined the Tata Watch Project (initiated at Tata Press) in 1983, which is now a Titan Company. He has served as Managing Director of Titan Company Limited since April 2002. Mr. Bhat has engineered the creation of many brands including pioneering the concept of franchising and retailing in Watches, Jewellery, Eyewear and Precision Engineering. He was awarded the Distinguished Alumnus Award of IIT Madras in 2008. He was appointed as a Director on the Board of Tata Sons in November 2017. He was appointed as the Chairman and Director on the Board of Rallis in October 2015.
Dr. Y. S. P. Thorat holds a Doctorate in Economics along with Degrees in Political Science and Law. He started his career
with the Reserve Bank of India in 1972 and was appointed as its Executive Director in 2003. His major contribution has been in the field of policy support for agriculture finance, supervision and export credit. In the year 2004, he was appointed as the Managing Director of NABARD and later the Chairman. In the past, he has been associated with the Planning Commission, Government of India, for the 10th and 11th five year plans. Dr. Thorat is also a Director of several other companies and has been serving as a Director on the Board of Rallis since July 2011.
Mr. Bhaskar BhatChairman, Non-Executive Non-Independent Director
Dr. Y. S. P. ThoratNon-Executive Independent Director
2
4 5
Mr. Prakash R. Rastogi holds a M.Sc. Tech degree from Bombay University and has a Post Graduate Diploma in
Business Management. He has worked with Sandoz India from 1974 till 1994, where he was the Vice President and Head of the Chemicals Division before it was de-merged to become Clariant India Limited. He was then appointed the Vice Chairman and Managing Director of Clariant - a position he held till his retirement from the Company. He was appointed on the Board of Rallis in March 2007.
Mr. Prakash R. RastogiNon-Executive Independent Director 1 2 4
bOard cOmmittees*
1 Audit | 2 Nomination and Remuneration | 3 Risk Management | 4 Corporate Social Responsibility | 5 Stakeholders’ Relationship
Chairperson Member
Dr. C. V. Natraj is a Ph.D. in Chemistry from the Indian Institute of Science, Bangalore. He also has postdoctoral
research experience in biochemistry from the University of Michigan, Ann Arbor. Dr. Natraj has more than 30 years of experience in research. He headed the research function as Director on the Board of Hindustan Lever Limited and later went on to lead the Corporate Research function for Unilever as Senior Vice President. He is currently serving on the Science and Engineering Research Board of the Department of Science and Technology, Government of India. He is also the Technical Advisor to the Indian Institute of Science. He was appointed on the Board of Rallis in July 2016.
dr. c. V. natrajNon-Executive Independent Director 1 2 3
* as on 25th April, 2019
10 | 71st Annual Report 2018-19
Corporate OverviewRallis India Limited

Dr. Punita Kumar-Sinha holds a Ph.D. and a Master’s Degree in Finance from the Wharton
School, University of Pennsylvania, an MBA degree from Drexel University and a Degree in Chemical Engineering from the IIT New Delhi. She is also a CFA Charter holder. She has 30 years of experience in fund management in emerging markets. She is also on several Boards and has numerous years of experience in the field of corporate governance.
She is a member of the CFA Institute and the Council on Foreign Relations. She has served the Blackstone Asia Advisors L.L.C. as its Chief Investment Officer and was a Senior Managing Director of The Blackstone Group L.P. She was inducted on the Board of Rallis in March 2014.
Ms. Padmini Khare Kaicker is a Certified Public Accountant (USA), a Chartered Accountant
from the Institute of Chartered Accountants of India and a Diploma holder in Business Finance from the Institute of Chartered Financial Analysts of India. She is the Managing Partner of B. K. Khare & Co., one of the leading Indian accounting firms. She has a wide and varied experience in the areas of audit, taxation, corporate finance, risk management, corporate governance, M&A and restructuring. She serves on the Board of several companies and has been a Director on the Board of Rallis since July 2016.
Dr. Punita Kumar-SinhaNon-Executive Independent Director
Ms. Padmini Khare KaickerNon-Executive Independent Director
5 1 3
Mr. Sanjiv Lal is a Chemical Engineering Graduate from the IIT, New Delhi. Mr. Lal was appointed on the Board of the Company as Managing Director & CEO on 1st April, 2019. Prior to his appointment, Mr. Lal was the Chief Operating Officer of the India Chemicals Business of Tata Chemicals. After he joined Tata Chemicals in 2004, he has handled its Agri Retail Business, headed the organisational transformation and business excellence function, headed the information technology function and was also nominated as the Joint Managing Director to IMACID, a JV in Morocco. Before joining Tata Chemicals, Mr. Lal has worked with Hindustan Unilever for 21 years in various functions.
Mr. Sanjiv LalManaging Director & CEO3 4 5
Mr. John Mulhall is the Chief Financial Officer of Tata Chemicals Limited. He is a graduate from the University
of Strathclyde and a Member of the Institute of Chartered Accountants of Scotland. Prior to Tata Chemicals, Mr. Mulhall worked in finance for various UK manufacturing companies. He joined Tata Chemicals in 2007 as European Finance Director of their recently acquired subsidiary-Brunner Mond (UK) Limited, followed by positions in Tata Chemicals North America Inc., (VP & CFO) and Tata Chemicals International Pte Limited in Singapore (CFO) before relocating to Mumbai in 2015. He was appointed as a Director on the Board in April 2018.
Mr. John MulhallNon-Executive Non-Independent Director1 3 4
An engineer from IIT Roorkee, Mr. R. Mukundan joined the Tata Administrative Service in 1990, after completing an
MBA from FMS, Delhi University. He is also an alumnus of the Harvard Business School. During his career with the Tata group, he has held various responsibilities across the chemical, automotive and hospitality sectors. Mr. Mukundan also serves as the Managing Director & CEO on the Board of Tata Chemicals. He was appointed on the Board of Rallis in December 2009.
Mr. R. MukundanNon-Executive Non-Independent Director2
11
Board of Directors
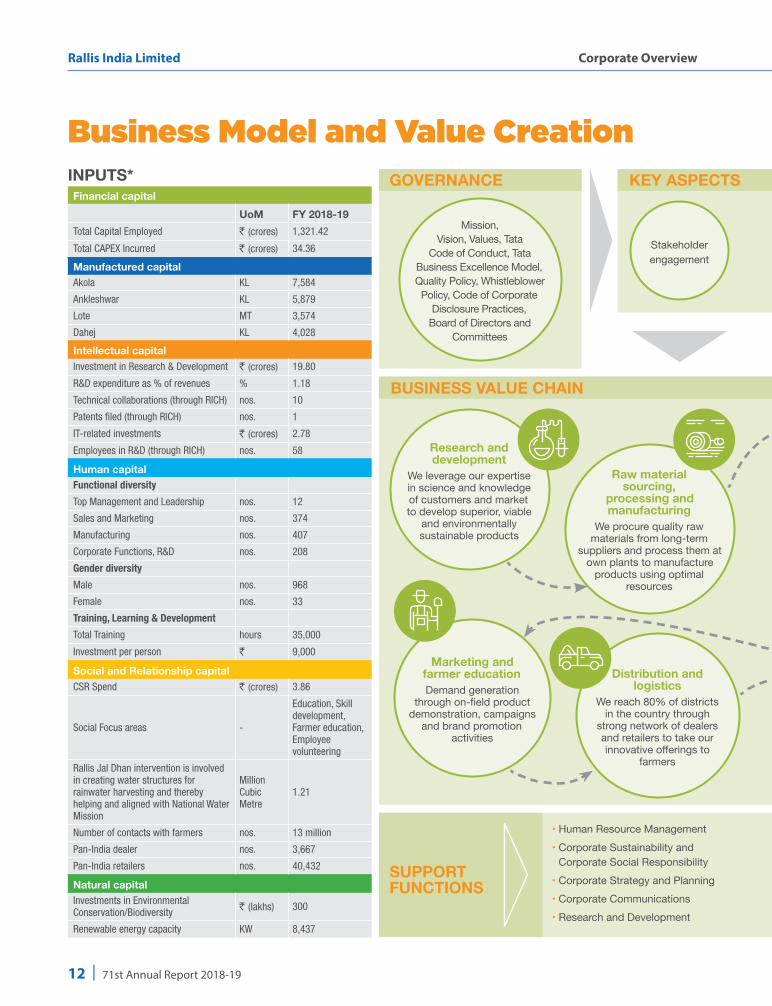
Business Model and Value Creation
Financial capital uom fy 2018-19
Total Capital Employed ` (crores) 1,321.42
Total CAPEX Incurred ` (crores) 34.36
Manufactured capital Akola KL 7,584
Ankleshwar KL 5,879
Lote MT 3,574
Dahej KL 4,028
Intellectual capital Investment in Research & Development ` (crores) 19.80
R&D expenditure as % of revenues % 1.18
Technical collaborations (through RICH) nos. 10
Patents filed (through RICH) nos. 1
IT-related investments ` (crores) 2.78
Employees in R&D (through RICH) nos. 58
Human capital Functional diversity
Top Management and Leadership nos. 12
Sales and Marketing nos. 374
Manufacturing nos. 407
Corporate Functions, R&D nos. 208
Gender diversity
Male nos. 968
Female nos. 33
Training, Learning & Development
Total Training hours 35,000
Investment per person ` 9,000
Social and Relationship capital CSR Spend ` (crores) 3.86
Social Focus areas -
Education, Skill development, Farmer education, Employee volunteering
Rallis Jal Dhan intervention is involved in creating water structures for rainwater harvesting and thereby helping and aligned with National Water Mission
Million Cubic Metre
1.21
Number of contacts with farmers nos. 13 million
Pan-India dealer nos. 3,667
Pan-India retailers nos. 40,432
Natural capital Investments in Environmental Conservation/Biodiversity ` (lakhs) 300
Renewable energy capacity KW 8,437
inputs* gOVernance
suppOrt functiOns
key aspects
business Value chain
Mission, Vision, Values, Tata
Code of Conduct, Tata Business Excellence Model, Quality Policy, Whistleblower Policy, Code of Corporate
Disclosure Practices, Board of Directors and
Committees
Stakeholder engagement
Research and development
We leverage our expertise in science and knowledge of customers and market to develop superior, viable
and environmentally sustainable products
raw material sourcing,
processing and manufacturing
We procure quality raw materials from long-term
suppliers and process them at own plants to manufacture
products using optimal resources
Distribution and logistics
We reach 80% of districts in the country through
strong network of dealers and retailers to take our innovative offerings to
farmers
• Human Resource Management• Corporate Sustainability and
Corporate Social Responsibility • Corporate Strategy and Planning • Corporate Communications • Research and Development
Marketing and farmer education Demand generation
through on-field product demonstration, campaigns
and brand promotion activities
12 | 71st Annual Report 2018-19
Corporate OverviewRallis India Limited

key aspects
business Value chain
OutputFinancial capital
UoM FY 2018-19Net sales ` (crores) 1,671.5EBIDTA ` (crores) 206.3PAT ` (crores) 128.98EPS ` / share 6.63Dividend (on face value of ` 1 each) ` / share 2.5 (250%)Net worth ` (crores) 1,248.36Market capitalisation (as on 31st March, 2019) ` (crores) 3,187.35 ROCE % 15ROE % 10Working capital days 116Manufactured capital Fungicide sales KL 2,503Fungicide sales Metric Tonnes 3,439Herbicide sales KL 1,452Herbicide sales Metric Tonnes 4,241Insecticide sales KL 4,265Insecticide sales Metric Tonnes 6,896Seed sales MT 1,378Average plant utilisation % 82.40Intellectual capital Innovation turnover index % 10New products developed (through RICH) (1 product commercialised) nos. 5
Products in pipeline (through RICH) nos. 40Molecules in pipeline (through RICH) nos. 10Ratio of R&D expenses to sales % 1.18Human capital Turnover per Employee ` (crores) 1.67Fatality nos. 1
TRIFR Injuries/million man hours 1.01
Attrition rate % 15.9Employee Engagement Scores % 79People trained under management development programme nos. 39
Employees covered under safety training programme % 100Training days per employee man-days 5.46Social and Relationship capital Lives impacted with CSR interventions nos. 1,53,000Students covered under education programme nos. 8,600Farmers and their families benefited from agriculture development programme nos. 33,758
Evaluation of strategically important suppliers (% of target achieved) % 100
Customer Satisfaction Index Score (for farmers)
Net Promoter Score 35
Customer complaints / resolution (DF + IBD) nos./% 63/97%Supplier satisfaction index % 96.97
Grievance resolution time (DF + IBD) days 20 (DF) & 60 (IBD) standard time
Natural capital Saplings planted nos. 80,419Energy saved kWh 9,40,570Energy generated from renewable sources % 20.8Fresh water consumption m3 3,45,123Water recharge m3 1.21 mcmWater discharged m3 94,333Water recycled % 31Green Manufacturing Index score 79Solid waste utilisation % 27GHG Emissions (CO2) CO2 emission 1.61
OutcOmes*
Packaging We make available products in multiple pack sizes to meet diverse customer
requirements
Risks and opportunities
Strategy and resource
allocation
• Information Technology and Digital • Finance and Accounts • Legal and Secretarial• Internal Audit• Administration• Business Excellence
farmer support services
We have initiated services using digital
technology to enable farmers to access timely
information on weather, market prices, crop
environment etc.
Fungicide productionMT6,755
Herbicide productionMT6,119
Insecticide production
MT11,738
Key Products
Herbicides: Tata Metri, Taarak,Tata Panida, Panida-Grande, Sartaj, Fateh
Fungicides: Contaf, Contaf Plus, Taqat, Ergon, Tata Master, Sultaf
Insecticides: Asataf, Applaud, Takumi, Hunk, Nagata, Origin, Reeva 5, Sedna, Sonic Flo, Tata Mida, Zeeny, Rilon, Anant, Summit
Plant Growth Nutrients: Ralligold WP, Ralligold Gr, Tata Bahaar, Uphaar, Solubor, Glucobeta, Tracel, Surplus
TRIFR: Total Recordable Injury Frequency RateDF: Domestic FormulationIBD: International Business DivisionRICH: Rallis Innovation Chemistry Hub*On Standalone basis
13
Business Model And Value Creation
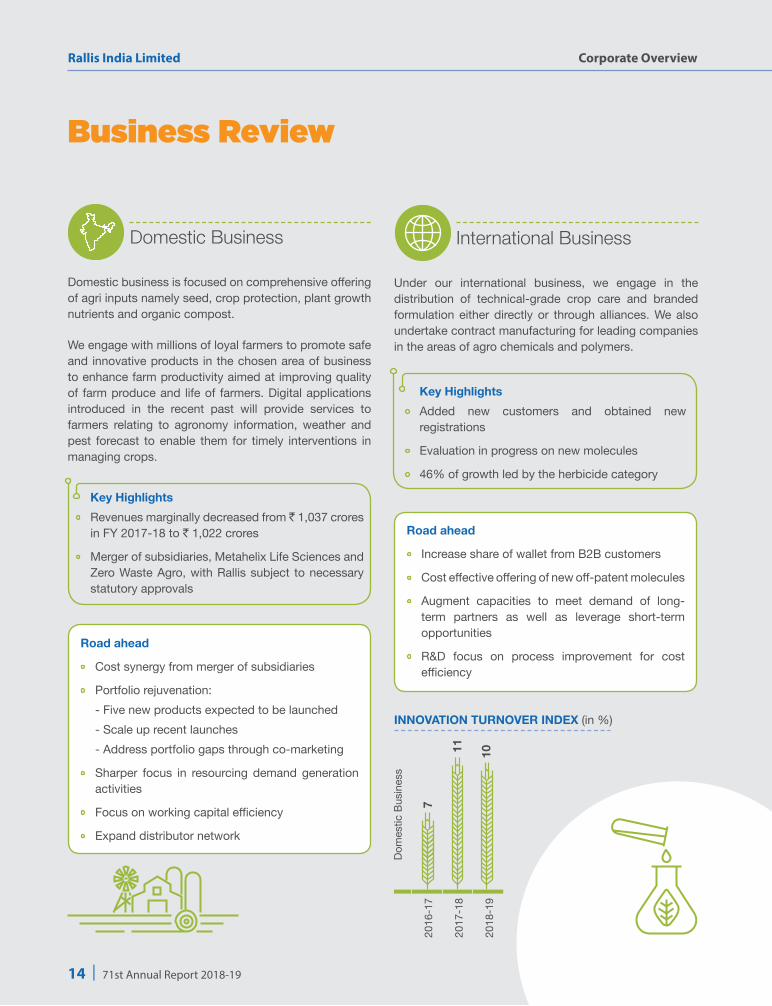
Business Review
Domestic Business
Domestic business is focused on comprehensive offering of agri inputs namely seed, crop protection, plant growth nutrients and organic compost.
We engage with millions of loyal farmers to promote safe and innovative products in the chosen area of business to enhance farm productivity aimed at improving quality of farm produce and life of farmers. Digital applications introduced in the recent past will provide services to farmers relating to agronomy information, weather and pest forecast to enable them for timely interventions in managing crops.
Key Highlights Revenues marginally decreased from ̀ 1,037 crores
in FY 2017-18 to ` 1,022 crores
Merger of subsidiaries, Metahelix Life Sciences and Zero Waste Agro, with Rallis subject to necessary statutory approvals
Road ahead
Cost synergy from merger of subsidiaries
Portfolio rejuvenation: - Five new products expected to be launched - Scale up recent launches - Address portfolio gaps through co-marketing
Sharper focus in resourcing demand generation activities
Focus on working capital efficiency
Expand distributor network
International Business
Key Highlights Added new customers and obtained new
registrations
Evaluation in progress on new molecules
46% of growth led by the herbicide category
Under our international business, we engage in the distribution of technical-grade crop care and branded formulation either directly or through alliances. We also undertake contract manufacturing for leading companies in the areas of agro chemicals and polymers.
Road ahead
Increase share of wallet from B2B customers
Cost effective offering of new off-patent molecules
Augment capacities to meet demand of long- term partners as well as leverage short-term opportunities
R&D focus on process improvement for cost efficiency
innOVatiOn turnOVer index (in %)
1011
720
16-1
7
2017
-18
2018
-19
Dom
estic
Bus
ines
s
14 | 71st Annual Report 2018-19
Corporate OverviewRallis India Limited

Strategies to Accelerate Pace
Science and technology-led innovation for the betterment of agriculture and the farmer community is the bedrock of our long-term growth and value creation. We remain agile to changing customer preferences and industry trends by undertaking appropriate strategy planning and resource deployment.
Our integrated strategy planning prOcess
market, cOmpetitOrs, inVestOrs, partners, internal capability, regulatOry, emplOyees, sOciety
Busi
ness
Env
ironm
ent S
cann
ing
Dep
loym
ent t
hrou
gh S
DM
. Goa
l she
ets
& EP
Ms
Prio
ritis
atio
nFinancial
Customer
Internal Process
Learning & Growth
Corporate Projects
SO Strategies
WO Strategies
ST Strategies
WT Strategies
Strengths (S)
Weaknesses (W)
Opportunities (O)
Threats (T)
Strategic Advantages
Core Competency
Strategic Challenges
rallis strategy scOrecard
SDM: Strategy Deployment MatrixEPMs: Enterprise Process Model
15
Business ReviewStrategies to Accelerate Pace

industry cOntextLow awareness and penetration in India Use of agrochemicals, better quality hybrid seeds and soil and plant nutrients have a proven track record of enhancing farm productivity, globally. However, affordability issues and lack of awareness are still prevalent in India, making it one of the lowest users of agrochemicals with low yield per hectare. Initiatives to hand-hold farmers and educate them on the benefits offer significant growth opportunities.
Tightening regulations The growing concern for environment protection has led to regulatory norms getting stringent. Industry players are required to invest in environment-friendly technologies, adopt globally accepted good manufacturing practices and enhance the portfolio mix with eco-friendly products.
Limited resources and growing population Agriculture in India is facing an imminent crisis – the cultivable land and water resources are decreasing
each year, even as population continues to grow. With the present level of farm yields, it would be impossible to meet the country’s growing food demand. This makes it important to use better agronomy practices with the use of appropriate agri inputs.
Mobile penetration and digitisation India is witnessing faster rate of internet and smartphone penetration, led by declining tariffs and increasing affordability. This growing consumption of data in India has opened opportunities to serve farmers digitally.
Contract manufacturing High labour costs globally, along with capacities closures in China due to environmental crackdown, has made India an attractive contract manufacturing destination. Players with end-to-end execution capabilities, strong R&D and quality excellence will stand to benefit.
Strategies to Accelerate Pace
16 | 71st Annual Report 2018-19
Corporate OverviewRallis India Limited

the rallis strategy
Strategy 1 Strategy 4
Strategy 5
Strategy 6
Strategy 3
Strategy 2
Consolidate position as India’s leading Agro Sciences Company
Become a contract manufacturer of choice
Strengthen export revenue
Lead CSR and EHS efforts
Consolidate position as a cost leader
Grow domestic market share
Increase farmer connect to offer innovative and safe products in Crop Protection, Seeds, Plant Growth Nutrients and Organic Compost
Investment in capacity and capability to tap contract manufacturing opportunities
Investment in registration to enhance export revenue from existing as well as new markets
Adopt safe practices and process management system
Focus on making portfolio eco-friendly
Ecological balancing with afforestation, water recharging and use of renewable energy
Have a lasting impact on the society
Appropriate portfolio mix Digital intervention to improve internal system Simplify organisational structure by consolidating
subsidiaries CAPEX in manufacturing for cost efficiency
Increase retail reach Further strengthen portfolio Increase channel engagement
5-YEAR CAPEx PROGRAMMEPlan of ` 800 crores over a five-year period for enhancing capacities to meet growth volumes, backward integration as well as for contract manufacturing opportunities.
EHS: Environment Health and Safety
17
Strategies to Accelerate Pace
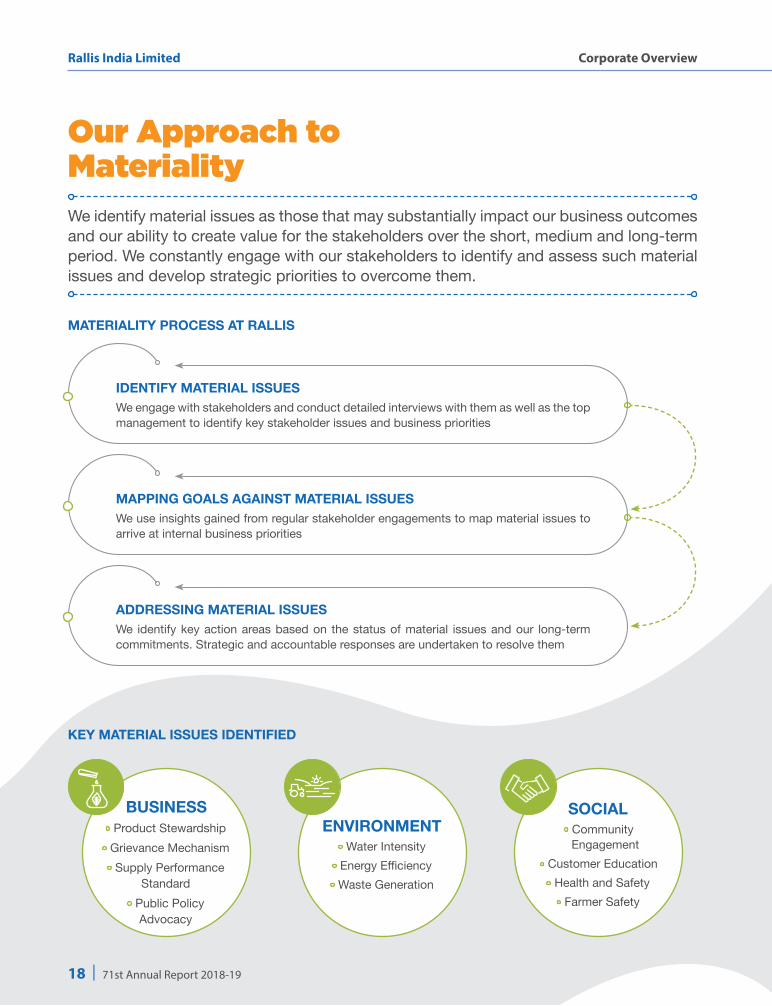
Our Approach to Materiality
We identify material issues as those that may substantially impact our business outcomes and our ability to create value for the stakeholders over the short, medium and long-term period. We constantly engage with our stakeholders to identify and assess such material issues and develop strategic priorities to overcome them.
key material issues identified
materiality prOcess at rallis
business Product Stewardship
Grievance Mechanism Supply Performance
Standard Public Policy
Advocacy
enVirOnment Water Intensity
Energy Efficiency Waste Generation
sOcial Community Engagement
Customer Education Health and Safety
Farmer Safety
identify material issuesWe engage with stakeholders and conduct detailed interviews with them as well as the top management to identify key stakeholder issues and business priorities
mapping gOals against material issuesWe use insights gained from regular stakeholder engagements to map material issues to arrive at internal business priorities
addressing material issuesWe identify key action areas based on the status of material issues and our long-term commitments. Strategic and accountable responses are undertaken to resolve them
18 | 71st Annual Report 2018-19
Corporate OverviewRallis India Limited

Engaging with the Stakeholders
Our philosophy of sustainable value creation involves listening to and addressing the concerns of each stakeholder group. We have a robust stakeholder engagement process that records issues and maps responses. This is indeed vital in building long-term relations, improving decision-making and maintaining transparency.
Stakeholders Relevant matters Engagement methods and response
Investors Strong profitability and cash generation Market share growth Robust business strategy Strong governance Appreciation in share price Sustained dividends
We are committed to create long-term sustainable value with strong governance. We engage with investor community through investor/analyst meets, conference calls, quarterly results and media releases to communicate our performance and outlook.
Customers and partners
Consistency in quality, delivery and services Responsiveness to needs Long-term business security and viability Sustainable profitable growth
We connect with our customers and partners through various forums including (Bagidhari Sabha, MD’s Elite Club, Distributor Meet, Anubandh Retailer. Meet in the crop protection business and Readers Club, Milaap, Milan in the Seeds business) and Customer Connect Programme – RSK Mega event, Farmer meet and Crop Seminar, among others. The purpose of these programmes is to understand market needs and strengthen the portfolio with better products. We have implemented digitisation, improved planning and capacities to ensure product availability. We also undertake periodic surveys of customers and business partners to develop better engagement.
Suppliers Transparency in selection Timely payment Ease of doing business Supplier feedback and
evaluation Engagement
We engage with suppliers through various meets including Annual Supplier Meet “Samagam”. We periodically undertake satisfaction surveys to understand the satisfaction level of the suppliers. We have automated vendor registration and made use of digital technologies to resolve supplier problem leading to stronger relationship.
employees Career growth Learning and development Competence building Health and safety Reward and recognition
We connect with employees through regular communication with senior leaders, CEO online, skip meetings, TGIF, union meetings, performance reviews, website and intranet, engagement initiatives, publications and newsletters and field visits etc. We take feedback from employee regarding safe and conducive workplace, provide regular training and focus on diversity while hiring a new employee.
Communities Equitable and inclusive development through support in the areas of education, health, infrastructure creation, livelihood generation
Clean and safe environment
We connect with the communities located around us through various engagements to understand their needs and take targeted actions. Our focus areas include improving the quality of education, imparting skill development training and educating farmers. Our projects are focused towards individuals from socially backward communities, including SC/ST communities. We also undertake activities towards protecting the biodiversity by reducing water and energy consumption, waste discharge and wealth from waste.
Government and regulatory bodies
Legal and regulatory compliance Contribution to exchequer Advocacy
We engage with the Government and regulatory bodies through advocacy meetings, memberships in industry bodies, seminars and media releases.We have undertaken various measures to overcome challenges of environmental/regulatory compliance by investing in better technologiesand addressing regional issues in partnership with the Government.
19
Engaging with the StakeholdersOur Approach to Materiality
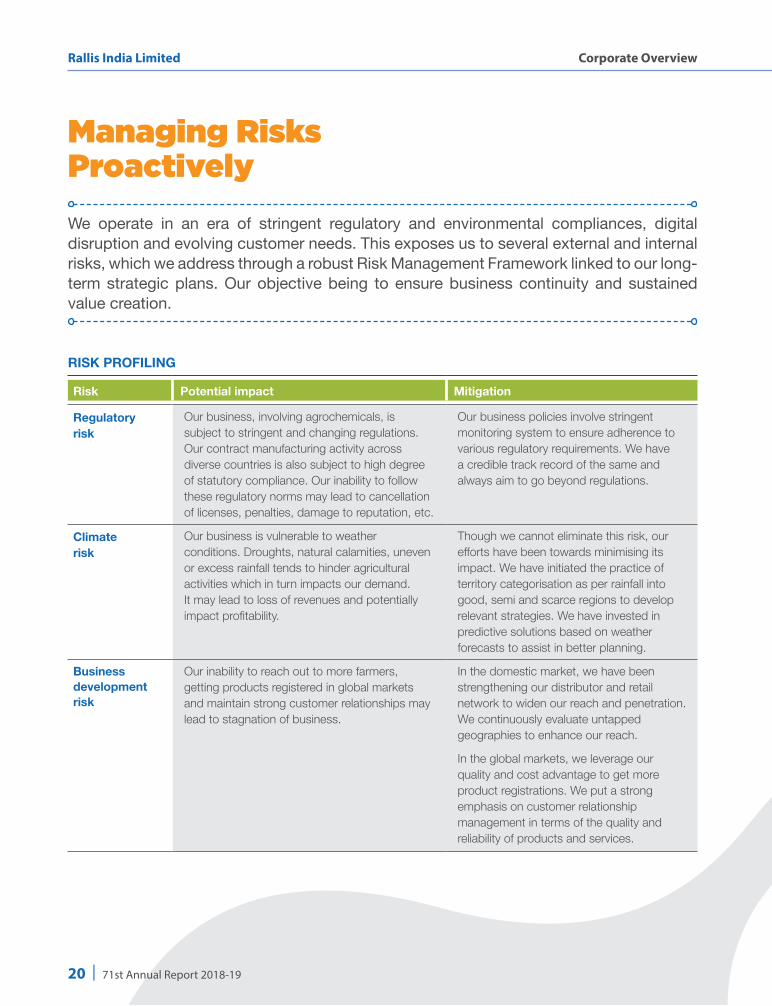
Managing Risks Proactively
We operate in an era of stringent regulatory and environmental compliances, digital disruption and evolving customer needs. This exposes us to several external and internal risks, which we address through a robust Risk Management Framework linked to our long-term strategic plans. Our objective being to ensure business continuity and sustained value creation.
risk prOfiling
Risk Potential impact Mitigation
Regulatory risk
Our business, involving agrochemicals, is subject to stringent and changing regulations. Our contract manufacturing activity across diverse countries is also subject to high degree of statutory compliance. Our inability to follow these regulatory norms may lead to cancellation of licenses, penalties, damage to reputation, etc.
Our business policies involve stringent monitoring system to ensure adherence to various regulatory requirements. We have a credible track record of the same and always aim to go beyond regulations.
climate risk
Our business is vulnerable to weather conditions. Droughts, natural calamities, uneven or excess rainfall tends to hinder agricultural activities which in turn impacts our demand. It may lead to loss of revenues and potentially impact profitability.
Though we cannot eliminate this risk, our efforts have been towards minimising its impact. We have initiated the practice of territory categorisation as per rainfall into good, semi and scarce regions to develop relevant strategies. We have invested in predictive solutions based on weather forecasts to assist in better planning.
Business development risk
Our inability to reach out to more farmers, getting products registered in global markets and maintain strong customer relationships may lead to stagnation of business.
In the domestic market, we have been strengthening our distributor and retail network to widen our reach and penetration. We continuously evaluate untapped geographies to enhance our reach.
In the global markets, we leverage our quality and cost advantage to get more product registrations. We put a strong emphasis on customer relationship management in terms of the quality and reliability of products and services.
20 | 71st Annual Report 2018-19
Corporate OverviewRallis India Limited
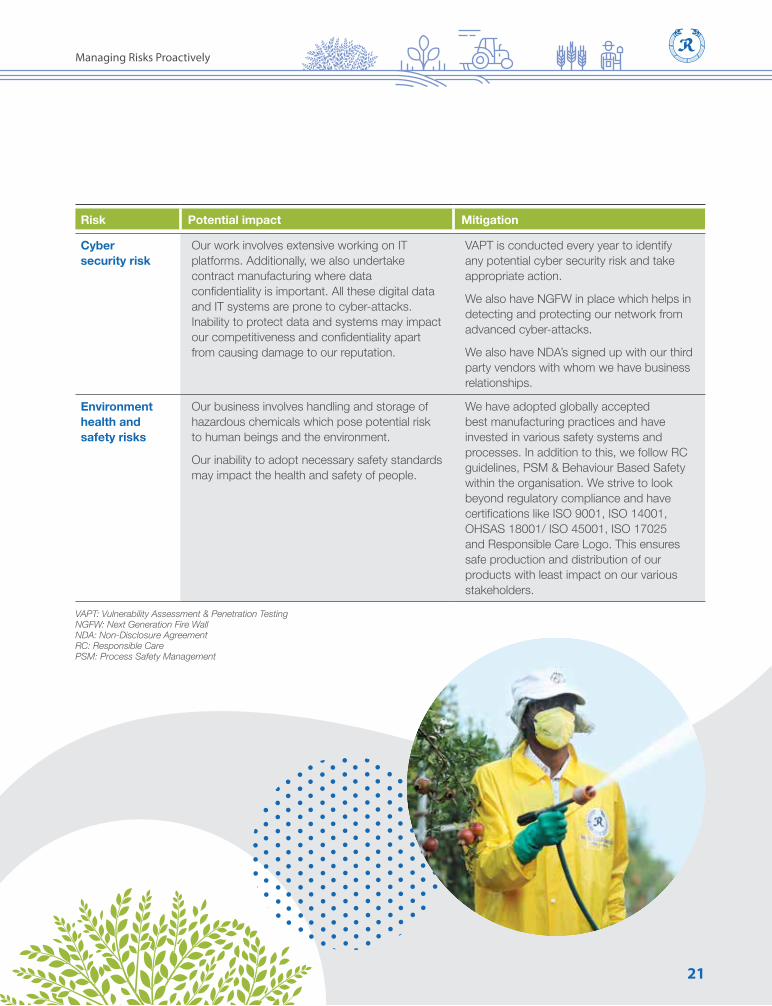
Risk Potential impact Mitigation
Cyber security risk
Our work involves extensive working on IT platforms. Additionally, we also undertake contract manufacturing where data confidentiality is important. All these digital data and IT systems are prone to cyber-attacks. Inability to protect data and systems may impact our competitiveness and confidentiality apart from causing damage to our reputation.
VAPT is conducted every year to identify any potential cyber security risk and take appropriate action.
We also have NGFW in place which helps in detecting and protecting our network from advanced cyber-attacks.
We also have NDA’s signed up with our third party vendors with whom we have business relationships.
Environment health and safety risks
Our business involves handling and storage of hazardous chemicals which pose potential risk to human beings and the environment.
Our inability to adopt necessary safety standards may impact the health and safety of people.
We have adopted globally accepted best manufacturing practices and have invested in various safety systems and processes. In addition to this, we follow RC guidelines, PSM & Behaviour Based Safety within the organisation. We strive to look beyond regulatory compliance and have certifications like ISO 9001, ISO 14001, OHSAS 18001/ ISO 45001, ISO 17025 and Responsible Care Logo. This ensures safe production and distribution of our products with least impact on our various stakeholders.
VAPT: Vulnerability Assessment & Penetration TestingNGFW: Next Generation Fire WallNDA: Non-Disclosure AgreementRC: Responsible CarePSM: Process Safety Management
21
Managing Risks Proactively

Harvesting Hope for Farmer Success
Farmer-centricity and value creation are central to our business strategy and value system. Our deep understanding of Indian agriculture, sustained engagement with farmers, use of innovative practices and our technological competencies qualify us to create relevant digital solutions and equip them to address these challenges. The immense trust of the farmers in our organisation endorses their strong bonding with us.
driVing digital reVOlutiOn fOr better experiencesIn an effort to enhance the farmers’ service experience and gain momentum on our growth plan, we have embarked on a digital initiative.
Progressing ahead on our digital information and communication technology mission, we have undertaken several initiatives to provide value-added services to the farming community.
Our digital sOlutiOns
drishti sampark app rallis krishi samadhanA pioneering predictive advisory
service providing weather forecast, crop health, pest/diseases, soil moisture related information.
An internal app that facilitates better engagement with farmer community, field force productivity, visibility on farmer reach mechanisms and data collection and access to virtual crop advisers.
Provides farmers direct access to Rallis’ products, Package of Practices developed by R&D and real-time inputs on weather and mandi prices among others.
22 | 71st Annual Report 2018-19
Corporate OverviewRallis India Limited

Farmer’s name: mukesh bhaiVillage: DholiDist.: SurendernagarState: GujaratAcreage: 10 Acres
“I used Rallis Summit in one of the areas and a product from another Company in the adjacent plot. Even after 10 days passed after spraying Summit, there was no single incidence of thrips, whereas it started in the adjacent plot. Apart from thrips control, I also observed improved growth and healthier leaves where Summit was sprayed. The same was not the case with the adjacent plot.”
OUR 5-YEAR DIGITAL vISIONTo serve 5 million+ farmers phygitally (physical + digital) – through a combination of workforce and digitally-powered, advanced customer experience ecosystem – to help them increase yield, reduce costs and grow income.
23
Harvesting Hope For Farmer Success
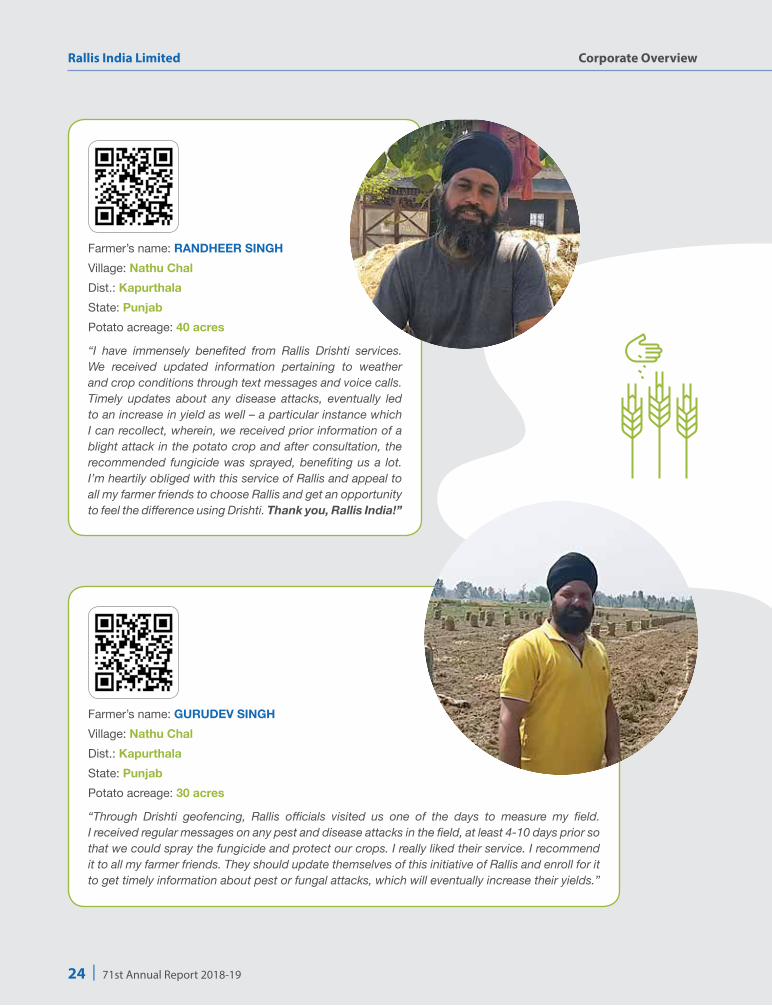
Farmer’s name: gurudeV singhVillage: Nathu ChalDist.: KapurthalaState: PunjabPotato acreage: 30 acres
“Through Drishti geofencing, Rallis officials visited us one of the days to measure my field. I received regular messages on any pest and disease attacks in the field, at least 4-10 days prior so that we could spray the fungicide and protect our crops. I really liked their service. I recommend it to all my farmer friends. They should update themselves of this initiative of Rallis and enroll for it to get timely information about pest or fungal attacks, which will eventually increase their yields.”
Farmer’s name: randheer singhVillage: Nathu ChalDist.: KapurthalaState: PunjabPotato acreage: 40 acres
“I have immensely benefited from Rallis Drishti services. We received updated information pertaining to weather and crop conditions through text messages and voice calls. Timely updates about any disease attacks, eventually led to an increase in yield as well – a particular instance which I can recollect, wherein, we received prior information of a blight attack in the potato crop and after consultation, the recommended fungicide was sprayed, benefiting us a lot. I’m heartily obliged with this service of Rallis and appeal to all my farmer friends to choose Rallis and get an opportunity to feel the difference using Drishti. Thank you, Rallis India!”
24 | 71st Annual Report 2018-19
Corporate OverviewRallis India Limited

sOme Of Our prOducts
25
Harvesting Hope For Farmer Success

Accelerating Pace with Operational Excellence
Farmers are dependent on our products and solutions for their livelihood. It is our constant endeavour to provide them high-quality, environment-friendly products at the lowest-cost by investing in better technologies and process improvement measures. This also ring-fences us from competition.
Our manufacturing capital
Location Products Key equipment used
Laurels Over the Years
Ankleshwar, Gujarat
Fungicides PEKKInsecticidesSC, WP, WDG formulations
Reactor (GLR, SS, MS)
ANFs
RVDs
Chilling and Brine Plants
Compressors
Boilers
Air Compressors
Nitrogen PSA Generators
ATFE
MEE
RO
Air Jet Mill
Blenders
Form Fill Seal (FFS) Machine
60 ACM (Air Classifier Mill)
Sigma Mixer
Extruders
Fluid Bed Dryers
Dynomill
Auto Filling and Packing Machines
Ankleshwar State Level Safety Award in 2016 for the maximum
number of Accident-Free days, by Gujarat Safety Council
NSCI (National Safety Council - India) Safety Awards – 2016 Suraksha Puraskar and Certification of Appreciation for 2017 and 2018
Green building IGBC Platinum certification in year 2018
Lote: NSC - Maharashtra Chapter Safety Award ‘Certificate of
Merit’ for Zero Accident Frequency Rate Consecutively four 3-year periods (2011 to 2013; 2012 to 2014; 2013 to 2015; and 2014 to 2016)
NSCI 2015 – Suraksha Puraskar Bronze Safety Award for implementing and achieving Occupational Safety and Health (OSH) Management System and procedures for the years 2012-2014
NSCI Safety Award – Certificate of Appreciation of OSH for the years 2013-2015
Dahej: Good House Keeping Award from Baroda Productivity
Council-2015
CSR Award from Government of Gujarat-2017
Akola: NSCI Certification of Appreciation for Excellence in OSH
for 2013-2015
NSC - Maharashtra Chapter Safety Award ‘Certificate of Merit’ in Industrial Safety during 2013-2015 and 2017
lote, Maharashtra
Insecticides
Dahej, Gujarat HerbicidesIntermediates
Akola, Maharashtra
Liquid Formulations EC (Insecticides, Fungicides, Herbicides), Capsule Suspension (CS), PGN, Nano-Micronutrients
NSCI: National Safety council of India, OSH: Occupational Safety Health, PSA: Pressure Swing Absorption, MS: Mild Steel, SS: Stainless SteelGLR: Glass Line Reactor, RVD: Rotary Vacuum Drier, ANF: Agitated Nutch Filler, ATFE: Agitated Thin Film Evaporator, MEE: Multi Effect EvaporatorRO: Reverse Osmosis
26 | 71st Annual Report 2018-19
Corporate OverviewRallis India Limited

Quality excellenceWe have been a Product Quality (Q) Leader in the domestic market and hence could build most trusted brands over the ages. Over the last decade, we have witnessed drastic changes in customer needs and expectations, as they expect a stated level of confidence assurance on Process Quality (Q) at all stages of handling of products and its constituents.
All our quality assurance laboratories are attached to manufacturing units and Central Quality Assurance Laboratories are accredited for ISO 17025:2017. All our quality Control laboratories maintain high traceability in measurement of product quality by following Good Laboratory Practices and Good Manufacturing Practices to strengthen Product/Process Quality.
Our quality assurance laboratories are equipped with advanced analytical instruments like High Performance Liquid Chromatography-Mass Spectroscopy, High Performance Liquid Chromatography, Gas Chromatography, Particle Size Analyser, UV-Visible Spectrophotometer, Fourier-transform infrared spectroscopy and Micro Plasma Atomic Emission Spectroscopy to ensure that each product we manufacture meets the same high standards.
Our strengths include extensive knowledge of entire set of requirements; understanding of the market and the products, Insecticide and Legal Metrology Acts and other required regulations, domestic and overseas customer’s requirements etc.
OperatiOnal excellenceOperational excellence has helped us in integrating people & processes in a seamless manner resulting in good performance over the years both financially & non financially.
In order to build a sustained high performance culture, we have focused on building strong processes by adopting a Balanced Score Card approach and Enterprise Process Model (EPM).
All our factories are ISO-certified and laboratories are NABL accredited. Good Manufacturing Practices are adopted, in addition to timely audits and assessments to bring improvements.
Theory of Constraints (ToC) in supply chain is implemented for on time product availability to customers and reduction of sales losses. Daily Work Management (DWM) has enhanced small group activities at shop floor level with several small but important improvements. This practice has improved the process reliability and capability at factories to maintain optimal condition of the operations.
All these have resulted in high employee engagement, customer satisfaction and us winning many state and national level recognitions for Business Excellence, Environment Health and Safety front year on year.
health and safety excellence We are a responsible care Company with strong impetus on employee safety being driven by the top management. It’s our policy is to ensure that every employee should go back safely. We have implemented multiple initiatives to achieve this:
Behaviour safety: Providing safety training to employees and Behavior Safety observation
Minimising hazards: Ensuring all the processes are run by competent people with adequate knowledge and implementing a 14-element Process Safety Management model, which is followed across globe
Plant automation: Focus on automating critical work areas and reducing the manual interventions
Identifying critical process safety: Identifying and analysing critical processes based on potential hazards and risk where maximum incidents occur and implement necessary controls
Road safety: Employee sensitisation, training and monitoring travel to minimise road incidents
Sensitisation: Audio-visual safety institution gallery at the plant entrance
27
Accelerating Pace with Operational Excellence

Innovation - The Way Forward
Innovation is both intrinsic and instrumental to our sustained success. Our ability to develop safe, superior and sustainable products and solutions across the agricultural value chain makes us a preferred global brand. We also undertake collaborative projects with global agriculture research institutes, start-ups and companies to further our innovation charter.
We undertake research and development activities at Rallis Innovation Chemistry Hub (RICH); and, Metahelix, Bengaluru. These centres are dedicated to undertaking R&D towards creating customer-centric technology and innovation in agrochemicals to improve farm productivity.
RALLIS INNOvATION CHEMISTRY HUB (RICH)RICH focuses on developing new, off-patented solutions that can enhance farm yield and farmer income and enable expansion in contract manufacturing. It has a strong pipeline of ongoing projects to support new launches for the next 3-5 years. Scientific personnel at the centre comprises 14 PhDs and 38 science post-graduates.
Key activities New solution development
and introduction Improve product development
process for existing products to bring down production cost
Development of customised and dynamic Package of Practices using Rallis solutions to improve farm productivity
Identify, develop, register and introduce new products in India and overseas markets
Development of innovative and safer formulations
Support contract manufacturing opportunities
Product stewardship
Innovation focus areas Process development for
generic and off-patented products
Analytical method development for new processes
Impurities synthesis Patented crop protection
molecules and intermediates for crop protection
Cost-effective processes for synthesising molecules
Novel combination molecules Development of novel and
eco-friendly formulation Bio-pesticides Crop nutrition products
Key developments fy 2018-19
Filed one patent Developed two crop nutrition
products and undertook all groundwork for its launch
Reached advanced development stage for five new products
For more information please scan the QR Code below
28 | 71st Annual Report 2018-19
Corporate OverviewRallis India Limited

metahelix life sciences Metahelix works in the area of agricultural biotechnology (genetic modification or marker-assisted section) for improving crop traits. It develops hybrid seeds for crops (paddy, maize, cotton, millet and mustard) and vegetables (tomatoes, chillies, okra and gourd). It undertakes multi-stage product trialing right from the farmer’s field in different conditions across various geographies. This ensures higher success rate of new launches.
Innovation focus areas Hybrid seeds with higher yield
Crop breeding and biotechnology for improving traits
Key developments fy 2018-19
Increased focus on strengthening Rabi portfolio through various strategies
Introduced three new millet seeds
Initiated breeding project for mustard
Working on biotech programme for genetically-modified seeds of maize and cotton
Innovation Centres Patents filed Patents granted r&d team
RICH and Metahelix 5 2 170
METAHELIx: SEEDS PORTFOLIO
Dhaanya Swoosh
29
Innovation - The Way Forward

Unlocking the People Potential
People are the most important stakeholders and resource for us. We have institutionalised our policies to provide our employees with the right growth opportunities and ensure their health and safety, engagement and well-being. While adding diversity to the organisation, we successfully nurtured the future leadership that will take forward our legacy.
learning and deVelOpmentAt Rallis, we follow a blended approach to learning and development. 40% of our learning intervention is through the digital platform – either through virtual instructor-led training or eLearning. The balance 60% is through classroom training, on-the-job coaching and mentoring and Assessment Development Centre. While we have successfully developed and executed customised eLearning modules during the year, we are in process of developing more relating to our field of chemical manufacturing to strengthen our competitiveness.
Developing and executing customised eLearning moduleseLearning Modules implemented e-Induction module for new joinees
Distillation module Work permit system
New eLearning modules under development Exothermic and Endothermic reaction
Filtration Safety devices Do’s and Don’ts: material handling, storage, loading and unloading chemicals
Functional interventions ~90% of our employees are covered under functional capability building training in the areas of: Unit operations and processes Troubleshooting in chemical plants
Product training for sales and marketing team
Managing risks in international trade
Operational issues for the International Business Division
Managerial/Behavioural Interventions~30% junior-mid senior level managers covered under Managerial Development & Leadership Programme such as: TATA GeM Customer-Centricity Development Intervention Early career key talent Goal Journey and Leadership Assessment and Development Centre
A different set of employees were provided need based open workshops
30 | 71st Annual Report 2018-19
Corporate OverviewRallis India Limited
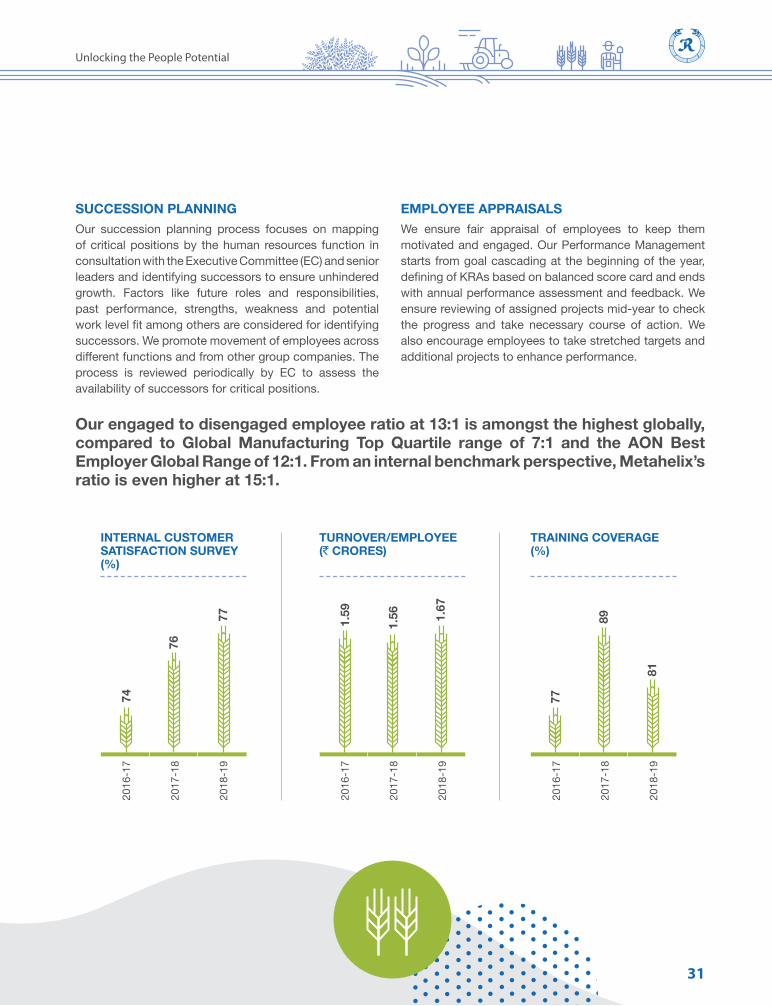
internal custOmer satisfactiOn surVey (%)
TURNOvER/EMPLOYEE (` CRORES)
training cOVerage (%)
1.67
81
1.56 89
74
1.59
77
77
76
2016
-17
2017
-18
2018
-19
2016
-17
2017
-18
2018
-19
2016
-17
2017
-18
2018
-19
Our engaged to disengaged employee ratio at 13:1 is amongst the highest globally, compared to Global Manufacturing Top Quartile range of 7:1 and the AON Best Employer Global Range of 12:1. From an internal benchmark perspective, Metahelix’s ratio is even higher at 15:1.
successiOn planningOur succession planning process focuses on mapping of critical positions by the human resources function in consultation with the Executive Committee (EC) and senior leaders and identifying successors to ensure unhindered growth. Factors like future roles and responsibilities, past performance, strengths, weakness and potential work level fit among others are considered for identifying successors. We promote movement of employees across different functions and from other group companies. The process is reviewed periodically by EC to assess the availability of successors for critical positions.
emplOyee appraisalsWe ensure fair appraisal of employees to keep them motivated and engaged. Our Performance Management starts from goal cascading at the beginning of the year, defining of KRAs based on balanced score card and ends with annual performance assessment and feedback. We ensure reviewing of assigned projects mid-year to check the progress and take necessary course of action. We also encourage employees to take stretched targets and additional projects to enhance performance.
31
Unlocking the People Potential
Being a Responsible Organisation
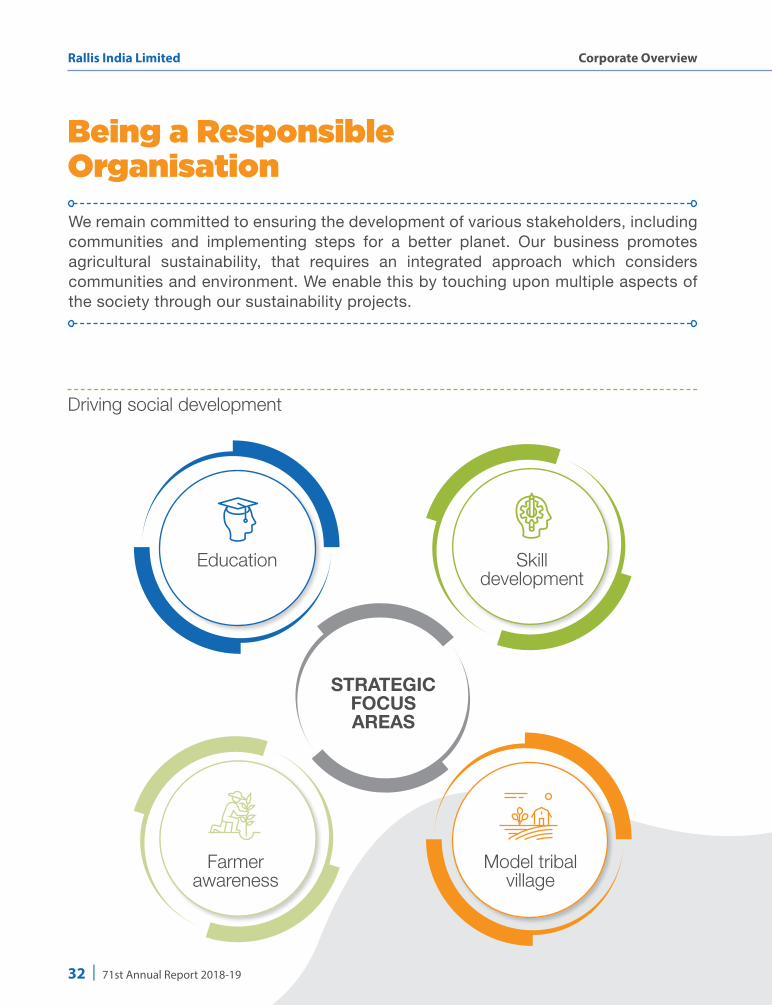
We remain committed to ensuring the development of various stakeholders, including communities and implementing steps for a better planet. Our business promotes agricultural sustainability, that requires an integrated approach which considers communities and environment. We enable this by touching upon multiple aspects of the society through our sustainability projects.
Driving social development
Skill development
strategic fOcus areas
Model tribal village
Farmer awareness
Education
32 | 71st Annual Report 2018-19
Corporate OverviewRallis India Limited

educatiOn We consider education to be an important area and the genesis for a better future. Our focus is on improving the access and quality of education for economically weak children from primary to middle school. Over 70% of the schools that we engage with, have been equipped with digital boards with softwares in vernacular language. This addresses the challenge of low teacher count and ensures wider coverage.
Special emphasis has been laid on the subjects of Science, English and Computer Education. For science, we engaged with an expert to develop a 100-module experiment-based curriculum to make the course easier and interesting. For English, we collaborated with Leap Forward and operated on “train the trainer” model, with a key focus on women. To enable computer literacy, computer labs were set up in number of schools. We also arranged for professional career guidance and role model sessions to encourage further studies.
In FY 2018-19, over 8,600 students benefited from our educational initiatives, about 60% of whom belonged to the Affirmative Action group.
skill deVelOpment We focus on enhancing the employability of youth with our RUBY (Rallis Ujjwal Bhavishya Yojana) initiative. The programme facilitates improving the quality of education, imparting soft skill training and providing exposure and informal education to students.
farmer educatiOn Apart from providing the products, we believe it is our duty to educate farmers on the best and safest way to use these products. During the year under review, we carried out a massive campaign through which we reached out to 15,000 farmers and 10,000 children across more than 300 villages in Nagpur to spread awareness on the safe use of pesticides and its storage. This involved participation of employees, crop advisors and associates. The campaign, carried out for mass awareness without any kind of marketing, has also been recognised with TVW award for our ‘You are Safe’ programme, an internal award among Tata group companies, for its uniqueness.
mOdel tribal Village With our model village concept, we focus on undertaking holistic development of villages to maximise impact and coverage. Our activities involve providing basic amenities, education, health coverage and ensuring capacity building and economic empowerment. In FY 2018-19, we worked with 5 villages with the aim of converting them into model villages.
` 3.86 crores
CSR spending in FY 2018-19
8,600 Students receiving
educational support
1,53,000 Villagers benefited from water management in
47 villages
TVW: Tata Volunteering Week
33
Being a Responsible Organisation
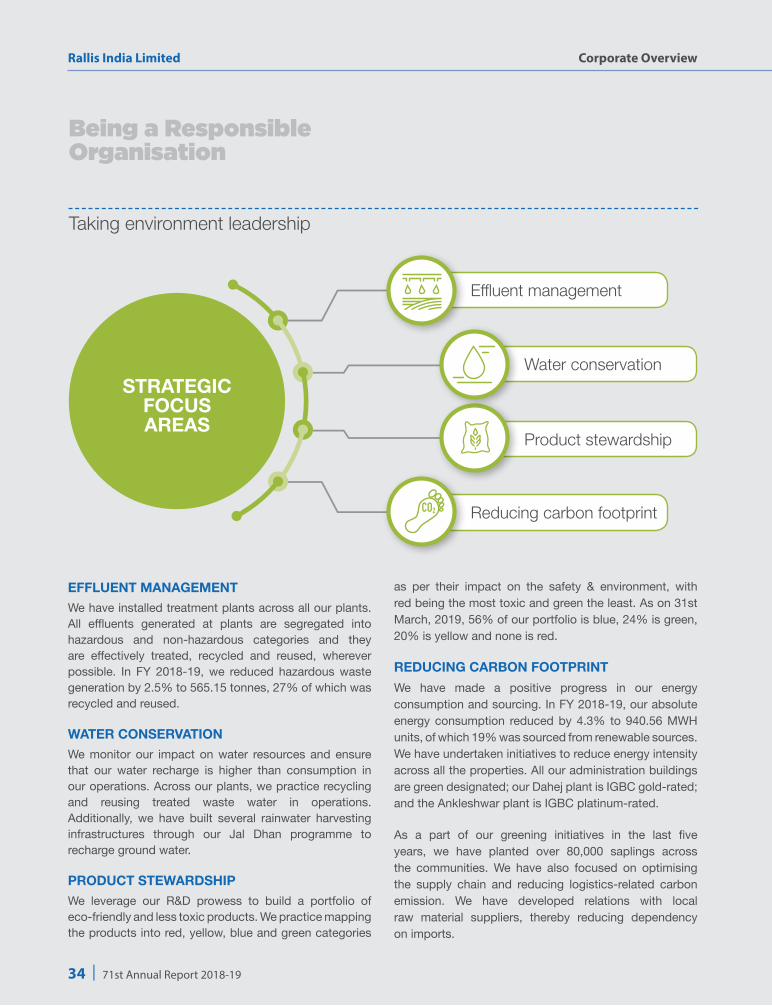
Being a Responsible Organisation
Taking environment leadership
effluent management We have installed treatment plants across all our plants. All effluents generated at plants are segregated into hazardous and non-hazardous categories and they are effectively treated, recycled and reused, wherever possible. In FY 2018-19, we reduced hazardous waste generation by 2.5% to 565.15 tonnes, 27% of which was recycled and reused.
Water cOnserVatiOnWe monitor our impact on water resources and ensure that our water recharge is higher than consumption in our operations. Across our plants, we practice recycling and reusing treated waste water in operations. Additionally, we have built several rainwater harvesting infrastructures through our Jal Dhan programme to recharge ground water.
prOduct steWardshipWe leverage our R&D prowess to build a portfolio of eco-friendly and less toxic products. We practice mapping the products into red, yellow, blue and green categories
as per their impact on the safety & environment, with red being the most toxic and green the least. As on 31st March, 2019, 56% of our portfolio is blue, 24% is green, 20% is yellow and none is red.
reducing carbOn fOOtprintWe have made a positive progress in our energy consumption and sourcing. In FY 2018-19, our absolute energy consumption reduced by 4.3% to 940.56 MWH units, of which 19% was sourced from renewable sources. We have undertaken initiatives to reduce energy intensity across all the properties. All our administration buildings are green designated; our Dahej plant is IGBC gold-rated; and the Ankleshwar plant is IGBC platinum-rated.
As a part of our greening initiatives in the last five years, we have planted over 80,000 saplings across the communities. We have also focused on optimising the supply chain and reducing logistics-related carbon emission. We have developed relations with local raw material suppliers, thereby reducing dependency on imports.
Effluent management
Reducing carbon footprint
Water conservation
Product stewardship
strategic fOcus areas
34 | 71st Annual Report 2018-19
Corporate OverviewRallis India Limited

rallis sustainability cOmmitments 50% energy from renewable sources by FY 2021-22 10% reduction in energy consumption by FY 2019-20
over FY 2013-14 Planting 2,00,000 saplings on 100% survival basis
by FY 2021-22 Generate at least 50% thermal energy from bio mass
in each unit by FY 2021-22
emissiOn intensity (tcO2Q/TONNE PRODUCED)
1.86
1.61
1.51
2016
-17
2017
-18
2018
-19
SPECIFIC WATER CONSUMPTION (KL/MT PRODUCED)
akOla plant
lOte plant
ankleshWar plant
dahej plant
0.44
9.42
12.2
646
.42
0.33
8.89
10.7
745
.99
1.00
7.71
11.5
737
.27
2016
-17
2017
-18
2018
-19
2016
-17
2017
-18
2018
-19
2016
-17
2017
-18
2018
-19
2016
-17
2017
-18
2018
-19
Water cOnsumptiOn
Million Cubic Liter water harvested than Industrial water consumed
Industrial water consumption in FY 2018-19
Rain Water harvested in FY 2018-19
0.34 Million Cubic Metre
1.21 Million Cubic Metre
3.5 times more than actual consumption
For our operation water is one of the important natural resource under our sustainability initiative we work towards maximising the recycling of treated water and rain water recharge through Jal Dhan. In this direction
we have recharged 3.5 times more water than actual consumption in FY 2018-19
Rain Water harvested (recharge) is more than
Industrial water consumed
35
Being a Responsible Organisation

Sanjiv Lal Managing Director & CEO
S. Nagarajan Chief Operating Officer
Ashish Mehta Chief Financial Officer
S. Mallikarjunappa Vice President - Research & Development
Ravindra R. Joshi Vice President - Technology Transfer
Sukhbir Singh Malik Vice President - Domestic Sales
Siddheswar Mallick Vice President - Marketing & Crop Nutrition
D. G. Shetty Vice President-Planning, Logistics & Third-Party Management
Subhra Jyoti Roy Vice President - International Business
n. k. uppal Vice President - Corporate Growth Projects
Rajashekhar Khinnavar Vice President - Manufacturing
Alok Chandra Vice President - Human Resources & Corporate Sustainability
coomie n. kapadia Head - Internal Audit
registered Office156/157, 15th Floor, Nariman Bhavan227 Nariman PointMumbai - 400 021Tel. No.: 91 22 6665 2700Fax No.: 91 22 6665 2827E-mail address: [email protected] Website: www.rallis.co.in
share transfer agentsTSR Darashaw Limited 6-10 Haji Moosa Patrawala Industrial Estate20 Dr. E. Moses Road, Mahalaxmi, Mumbai - 400 011.Tel. No.: 91 22 6656 8484Fax No.: 91 22 6656 8494E-mail address: [email protected]: www.tsrdarashaw.com
auditOrsB S R & Co. LLP Chartered Accountants
cOmpany secretaryYashaswin Sheth
Senior Leadership
36 | 71st Annual Report 2018-19
Corporate OverviewRallis India Limited

37
Board’s Report
Statutory Reports

38 | 71st Annual Report 2018-19
Statutory ReportsRallis India Limited
TO THE MEMBERS OF RALLIS INDIA LIMITEDThe Directors hereby present their Seventy First (71st) Annual Report on the business and operations of the Company and the financial statements for the year ended 31st March, 2019.
FINANcIAL RESuLTS(` in crores)
Particulars Standalone consolidated2018-2019 2017-2018 2018-2019 2017-2018
Revenue from operations 1,671.50 1,515.94 1,983.96 1,808.46 Other Income 25.72 8.93 30.65 13.18
1,697.22 1,524.87 2,014.61 1,821.64 Profit/ (Loss) before Finance cost, Depreciation and Tax 232.02 235.12 271.59 277.65 Finance Costs (4.86) (3.29) (5.25) (4.31)Depreciation (39.28) (40.57) (46.08) (46.31) Profit before exceptional items and tax 187.88 191.26 220.26 227.03Exceptional items - - - - Profit before Tax 187.88 191.26 220.26 227.03Provision for Tax (61.25) (58.95) (68.76) (66.32)Deferred Tax 2.35 9.18 3.28 6.31 Profit for the year 128.98 141.49 154.78 167.02 Profit for the year attributable to:- Owners of the Company 128.98 141.49 155.38 167.62- Non-controlling interests - - (0.60) (0.60)Other comprehensive income (‘OCI’) (0.86) (0.16) (1.48) (0.33) Total comprehensive income 128.12 141.33 153.30 166.69 Profit for the year 128.12 141.33 153.93 167.39Balance of Profit brought forward from previous year 801.01 747.56 812.84 733.33
929.13 888.89 966.77 900.72 Appropriations Transfer from equity instruments through OCI (1.41) (1.97) (1.41) (1.97) Others 0.06Dividend on Equity Shares (48.62) (72.93) (48.62) (72.93)Dividend Distribution Tax (9.99) (14.95) (9.99) (14.95)Transfer to Reserve for equity instruments through OCI 1.41 1.97 1.41 1.97 Balance Profit carried forward to Balance Sheet 870.52 801.01 908.22 812.84
Board’s Report

39
Board’s Report
TRANSFER TO RESERVESThe Board of Directors have decided to retain the entire amount of profits for FY 2018-19 in the profit and loss account.
DIVIDENDThe Directors are pleased to recommend a dividend of ` 2.50 per share (250%) on the Equity Shares of the Company (previous year ` 2.50 per share). If the dividend, as recommended above, is declared by the Members at the Annual General Meeting the total outflow towards dividend on Equity Shares for the year would be ` 58.61 crores (including dividend distribution tax) (previous year ` 58.61 crores).
DIVIDEND DISTRIBuTION POLIcYRegulation 43A of the Securities and Exchange Board of India (Listing Obligations and Disclosure Requirements) Regulations, 2015 (‘Listing Regulations’) requires the top 500 listed entities, based on market capitalisation calculated as on 31st March of every financial year, to formulate a Dividend Distribution Policy and disclose the same in the Annual Report and on the website of the Company.
Accordingly, the Board of Directors of the Company has adopted a Dividend Distribution Policy (‘Policy’) which aims to ensure fairness, sustainability and consistency in distributing profits to the Members. During the year under review, the Company amended the Policy to provide a target range of total dividend pay-out. The Policy is attached as Annexure A to this report and is also available on the website of the Company under the “Investor Relations” section at the link http://www.rallis.co.in/DDPolicy.htm.
SHARE cAPITALThe paid up Equity Share Capital as on 31st March, 2019 was ` 19.45 crores. During the year under review, the Company has not issued any shares. The Company has not issued shares with differential voting rights. It has neither issued employee stock options nor sweat equity shares and does not have any scheme to fund its employees to purchase the shares of the Company.
cOMPANY PERFORMANcE The Company’s consolidated revenue from operations for Financial Year (‘FY’) 2018-19 was ` 1,983.96 crores compared to ` 1,808.46 crores in the previous year, an increase by 9.7% over the previous year. The Company’s profit before exceptional items and tax on a consolidated basis was ` 220.26 crores during the year compared to ̀ 227.03 crores in the previous year, a decrease of 2.98% over the previous year. The Company earned a net profit of ` 154.78 crores, lower by 7.3%, as against a net profit of ` 167.02 crores in the previous year, on a consolidated basis.
The Company’s standalone revenue from operations for FY 2018-19 was ` 1,671.50 crores, an increase of 10.3% over the previous year’s revenue of ` 1,515.94 crores. Increase in cost and pressure on margin resulted in 8.8% lower net profit of ` 128.98 crores compared to ` 141.49 crores in the previous year.
OPERATIONS1. cROP PROTEcTION
Indian Agriculture in FY 2018-19 started on an optimistic note, reflecting a forecast of normal
40 | 71st Annual Report 2018-19
Statutory ReportsRallis India Limited
monsoon and commencing with good initial rainfall. Forecast of monsoon onset over Kerala for this year was very accurate, as both the forecasted and realised date of onset of monsoon over Kerala was 29th May, 2018. After a strong start, monsoon stopped advancing for 12 days till 3rd week of June which affected the initial sowings.
The season (June 2018 to September 2018) rainfall over the country as a whole was 91% of its Long Period Average (LPA). Out of the total 36 meteorological sub divisions, 23 sub divisions constituting 68% of the total area of the country received normal season rainfall, 1 sub division received excess rainfall and the balance 12 sub divisions received deficient rainfall. Monthly rainfall over the country as a whole was 95% of LPA in June, 94% of LPA in July, 92% of LPA in August and 76% of LPA in September.
The monsoon has been a mixed bag this year, swinging erratically from long dry patches to torrential rains, and on the whole it has not been well distributed. The monsoon withdrew from most parts of northwest India and adjoining central India by 1st October, and by 6th October the withdrawal was completed from major parts of India.
As per 2nd advance estimate released by the Department of Agriculture Cooperation and Farmers Welfare, India will have a food grain production of 281.37 Metric Tonne (MT) against 284.83 MT in the previous year (as per 4th advance estimate). Agriculture and allied sector’s Gross Value Added (GVA) at constant FY 2011-12 price grew at a CAGR of 2.75% between FY 2012 to FY 2018.
The year also saw reduced crop pest pressure in many areas, impacting the insecticides segment to a great extent. Inventory levels of crop protection products in the industry remained high due to poor liquidation. Chilli acreage reduced due to Gemini virus infestation and poor output price. Pest incidence in major crop pest segments like Brown Plant Hopper (BPH) and Blast on Rice, caterpillar on Pulses and Soybean, Powdery and Downey mildew of Grapes were low during the active infestation period. Hence, consumption of many
important molecules came down. Pink bollworm infestation on Cotton had a major impact, affecting not only productivity, but also impacting cash flow in the market. Paddy and Cotton prices improved from the lows during the crop harvest.
The total storage in 91 important reservoirs in different parts of the country, on week ending 14th February, 2019 was 66.260 Billion Cubic Metre (BCM) (41% of the storage capacity at full reservoir level) against 63.957 BCM during the corresponding date of the previous year and 69.169 which is the average storage of the last 10 years.
Despite the irregular monsoon pattern and constrained acreages of few key crops in important geographies, the Company managed to grow in Herbicides portfolio. The Company registered a growth of 31% in herbicides segment with good performance in Tata Metri, Preet, Mark, Cylo and Panida Grande. The Company has also gained market share in cotton. Even in areas where the industry faced regulatory issues, the Company has managed to maintain its business due to acceptance of Rallis Samrudh Krishi® at both channel and farmer level. In Paddy, market share improved through focused approach, inspite of low pest pressure in segments like BPH and Paddy blast. New products introduced in the previous year have received good response from farmers and will be growth drivers in the next few years. During the year under review the Company introduced one new product, Oliver, for post emergence control of grasses, which causes significant losses to commercial crops. Oliver has strengthened the Company’s herbicides portfolio.
The Company aims to bring meaningful contribution for farm productivity through higher yields, better quality produce at optimised costs leveraging Rallis Samrudh Krishi® (RSK). To this effect, the Company has been working on several crops such as paddy, pulses, grapes, chilli, etc. over last few years.
International Business Division (IBD): The preliminary view of global crop protection market is estimated to have increased by 5.0% to reach a total value of US$ 56.50 billion during calendar year 2018 compared
41
Board’s Report
to US$ 54.21 billion during calendar year 2017. Overall consumption of Agrochemicals increased across the globe during 2018 mainly on account of good weather conditions in South East Asia, Australia, North America and Africa. An improved inventory level in Latin America particularly in Brazil has led to increase in sales.
Stringent environmental norms continue to impact production in China leading to raw material scarcity and significant price increase for both intermediates and active ingredients. Pressure to display improved profitability by listed companies in China has also impacted price escalation process.
Commodity prices recorded some improvement in the first six months. However, June onwards prices of major commodities experienced a drop. This is largely attributable to the ongoing US – China trade relations.
IBD has achieved a revenue growth of 36% over the previous year, growing to ` 650 crores, as against ` 479 crores during FY 2017-18. Significant growth is recorded in North America, Latin America particularly Brazil and Asia. During the year under review, the Company has gained 11 new registrations in strategic overseas markets. Partnership models with strategic customers that were adopted during the year helped the Company in its growth journey through leveraging each others’ strengths. IBD continues its focus on developmental activities in key geographies in Latin America, South East Asia, Europe and African markets.
2. NON-PESTIcIDE PORTFOLIO (‘NPP’)
NPP is an important focus area for the Company. It serves the emerging needs of the farming community through an end-to-end solutions based approach. This creates value for farmers and enables them to look at the Company as a solution provider for all their agriculture related needs. NPP sales during the year were 33% of the total revenue.
Plant Growth Nutrients (‘PGNs’):
PGNs consists of Biologicals, Bio-stimulants, Micronutrients and Water soluble fertilizers which
are gaining farmer level acceptance as part of
Integrated Crop Management. During FY 2018-19,
the Company registered 51% growth in its
bio-stimulant, Tata Bahaar and 57% growth in its
micronutrient, Surplus. As one of the branding
initiatives, to reflect the image and value perception,
the Company has in FY 2018-19 launched new
packs of Tata Bahaar and Solubor, which are well
appreciated by the customers. The Company will launch
Aquafert brand Water soluble fertilizers business in
FY 2019-20 to actively participate and service the
growing needs of specialty fertilizers in farming.
Seeds:
The Company performed as per the seeds revenue
plans for the year and generated 3% higher
Gross Contribution over the previous year. The
Company has also supported growth of Metahelix
through seed brands of Rallis all these years. The
Company will henceforth focus on building and
growing the Seeds portfolio through the
Metahelix entity. There will be an uninterrupted
supply of the Seeds products to the market and
internally the Company will ensure a co-
ordinated supply chain to make this happen. The
Company exited from Rallis brand seeds
promotion and sales without any exit cost.
Agri Services:
Agri Services portfolio comprises the organic manure
product GeoGreen, Grapes Samrudh Krishi (‘Grapes SK’)
initiative and MoPu (More Pulses) programme.
During the year under review, GeoGreen sales
increased by about 14% over the previous year
with a significant reduction in quality related
complaints and improvement in supply lead time.
Production units and warehouses were properly
aligned with targeted geographies. Overall
a strong base is built for a substantial growth
in future.
Grapes SK initiative continued its good performance
with substantial increase in farmers seeking this service.

42 | 71st Annual Report 2018-19
Statutory ReportsRallis India Limited
A few additional modules for water management and
pest management were added to make it more valuable
for the farmers.
MoPu initiative continued in Maharashtra as well as in
Karnataka State for Pulses Productivity Improvement
Program under Public Private Partnership Integrated
Agricultural Developement (‘PPP IAD’) initiative,
supported by the Central Government.
During the year under review, 3 Blocks (Afzalpur,
Bijapur and Bhalki) from 3 Districts (Gulbarga, Bijapur
and Bidar) in Karnataka were covered under PPP
IAD Project with Karnataka Government for Pulses
Productivity improvement for Red Gram (Pigeon Pea)
and Bengal Gram (Chick Pea) which are saviour crops
for farmers apart from major crops in that area. Increase
in productivity and quality helps farmers for additional
income generation and fetching better prices for their
produce.
Productivity of Pulses increased by 18% to 20% and
savings in cost of the inputs, which is more than 25%, is
a direct benefit to the farmers.
A Memorandum of Understanding was signed with
Government of Maharashtra for SMART Project to
support FPO’s (Farmers Producers Organisations)
in Vidarbha and Marathwada areas for productivity
improvement through extensive field level guidance
and value chain support. The Government is planning
to provide warehouse facilities and other support for
permanent structures at village levels to support large
number of farmers.
SuBSIDIARY cOMPANIES AND cONSOLIDATED FINANcIAL STATEMENTS
The Consolidated Financial Statements of the Company
and its subsidiaries, prepared in accordance with Indian
Accounting Standards notified under the Companies (Indian
Accounting Standards) Rules, 2015 (‘Ind AS’), form part of the
Annual Report and are reflected in the Consolidated Financial
Statements of the Company.
The Annual Financial Statements of the subsidiaries and
related detailed information will be kept at the registered
office of the Company, as also at the registered offices of
the respective subsidiary companies and will be available to Members seeking information at any time. They are also available on the website of the Company at http://www.rallis.co.in/SFS.htm.
The Consolidated Financial Statements reflect the operations of the following subsidiaries: Metahelix Life Sciences Limited, PT Metahelix Lifesciences Indonesia (subsidiary of Metahelix), Zero Waste Agro Organics Limited and Rallis Chemistry Exports Limited.
The Company has adopted a Policy for determining Material Subsidiaries in terms of Regulation 16(1)(c) of the Listing Regulations. The Policy, as approved by the Board, is uploaded on the Company’s website at the weblink: http://www.rallis.co.in/Material_SubsidiariesPolicy.htm.
During the year under review, no Company has become or
ceased to be a subsidiary of the Company. The Company does
not have any associate or joint venture companies. A report
on the financial position of each of the subsidiary companies
as per the Companies Act, 2013 (‘the Act’) is provided in Form
AOc-1 attached to the financial statements.
PERFORMANcE OF SuBSIDIARIES
(1) Metahelix Life Sciences Limited (‘Metahelix’)
The consolidated revenue of Metahelix for FY 2018-19
increased from ` 319.42 crores to ` 336.57 crores,
an increase of 5.4% over the previous year. Profit
for the year attributable to equity shareholders of
Metahelix increased marginally from ` 23.57 crores to
` 23.86 crores.
Metahelix achieved a growth of 5.4% in revenues
under difficult conditions. In Paddy, it has significantly
improved its position with a value growth of 11%.
There was a growth of 50% in Cotton sales volumes
over the previous year.
In addition to strong business performance, Metahelix
continued its focus on strengthening its structured
brand building approach in the market to realise
better prices in the market. Its price realisations have
improved across crops.

43
Board’s Report
The increased focus on collections resulted in year end receivables being below the last year level, despite a growth in revenues.
On the seed production front, it has strengthened its production and supply capabilities. Volume production increased in FY 2018-19 as against the previous year.
(2) PT Metahelix Lifesciences Indonesia (‘PT Metahelix’)
During the year under review, Metahelix has invested US$ 1,83,750 for 1,83,750 Equity shares of US$ 1 each with 65.77% shareholding in its Indonesian Joint Venture (‘JV’) Company PT Metahelix as per the commitment in the JV Agreement. The JV partner has also invested his share of US$ 1,91,250 for 95,625 Equity Shares of US$ 2 each with 34.23% shareholding. The total equity of PT Metahelix stands at US$ 10,00,000 as on 31st March, 2019.
PT Metahelix continued to have difficulties in the Seed production operations during FY 2018-19 due to lower yield levels.
In the second year of launch of commercial activities in FY 2018-19, PT Metahelix achieved revenue from operations of ` 1.23 crores during FY 2018-19 as against ` 0.48 crore during FY 2017-18.
(3) Zero Waste Agro Organics Ltd. (‘ZWAOL’)
ZWAOL achieved revenues of ` 10.05 crores in FY 2018-19 compared to ` 9.98 crores in the previous year. ZWAOL’s profit before tax was ` 2.34 crores for the year compared to a profit before tax of ` 2.54 crores in the previous year. The net profit for the year was ` 1.68 crores as against a net profit of ` 1.94 crores in the previous year.
During the year under review, ZWAOL continued to build on cost reduction initiatives undertaken in the previous year by modifying its business model. It also initiated the process of identifying most cost effective sites to reduce overall cost of the product. It has also put in place a new quality control system for better control.
ZWAOL continued with a third party quality audit at production and storage sites for an independent feedback and corrective actions which resulted
in a sharp reduction in quality complaints. For an effective logistics, an alignment was done for production units and storage locations to cater Zonal requirements and reduction of supply lead time observed as an outcome.
As a result of these actions, ZWAOL could record good margins with slight volume growth.
(4) Rallis chemistry Exports Limited (‘RcEL’)
As RCEL had not commenced any commercial activities, it has, in March 2019, made an application under Section 248(2) of the Act read with the Companies (Removal of Name of Companies from the Register of Companies) Rules, 2016 for removal of its name from the Register of Companies. Approval of the Ministry of Corporate Affairs for the same is awaited.
ScHEME OF AMALGAMATION
Amalgamation of Metahelix with the company
During the year under review, the Board of Directors of the Company approved the proposal for the merger of Metahelix, a wholly owned subsidiary of the Company, with the Company and their shareholders and creditors pursuant to Sections 230 to 232 of the Act and as per the terms and conditions mentioned in the Scheme of Amalgamation. The merger is subject to the necessary approvals/ sanctions from the jurisdictional National Company Law Tribunal(s) or such other competent authority and shareholders and creditors of Metahelix and the Company, as applicable.
Amalgamation of ZWAOL with the company
The Board of Directors of the Company have approved the Scheme of Amalgamation (‘Scheme’) for merger of ZWAOL with the Company under Sections 230 to 232 of the Act and as per the terms and conditions mentioned in the Scheme, subject to receipt of all requisite statutory and regulatory approvals, including approval of the National Company Law Tribunal (‘NCLT’). Petition for sanctioning the Scheme is pending for hearing before the NCLT.
PARTIcuLARS OF LOANS, GuARANTEES OR INVESTMENTS
During the year under review, the Company has made an investment of ` 19.60 lakhs in Rallis Chemistry Exports Limited, wholly owned subsidiary of the Company, by way of equity shares.

44 | 71st Annual Report 2018-19
Statutory ReportsRallis India Limited
The Company has not given any loans or corporate guarantee
or provided any security during the year.
Details of loans, guarantees and investments covered under
the provisions of Section 186 of the Act are given in the notes
to the financial statements.
FIXED DEPOSITS
The Company has not accepted any deposits from the public
during the year under review. No amount on account of
principal or interest on deposits from public was outstanding
as on 31st March, 2019.
RELATED PARTY TRANSAcTIONS
All Related Party Transactions that were entered into during
the financial year were on an arm’s length basis, in the
ordinary course of business and were in compliance with the
applicable provisions of the Act and the Listing Regulations.
No material Related Party Transactions were entered
during the financial year by the Company. Accordingly,
the disclosure of Related Party Transactions, as required
under Section 134(3)(h) of the Act in Form AOC-2 is not
applicable to the Company and hence not provided.
All Related Party Transactions are placed before the
Audit Committee for approval. Prior omnibus approval
of the Audit Committee is obtained for the transactions
which are planned/repetitive in nature and omnibus
approvals are taken as per the policy laid down for
unforseen transactions. Related Party Transactions entered
into pursuant to omnibus approval so granted are placed
before the Audit Committee for its review on a quarterly basis,
specifying the nature, value and terms and conditions of the
transactions.
During the year under review, the Company has amended the
policy on Related Party Transactions in line with the revised
Listing Regulations and the same is uploaded
on the Company’s website at the link http://
www.rallis.co.in/Related_Party_Transactions
Policy.htm.
Further details on the transactions with related parties
are provided in the accompanying financial statements.
RISK MANAGEMENT
The Company has a comprehensive Risk Management framework that seeks to minimise adverse impact on business objectives and capitalise on opportunities. Our success as an organisation depends on the ability to identify such opportunities and leverage them while mitigating the risks that arise while conducting our business.
The Company has implemented a mechanism for risk management and formulated a Risk Management Policy. The said policy provides for creation of a Risk Register, identification of risks and formulating mitigation plans. Major risks identified by the businesses and functions are systematically addressed through mitigating actions on a continuing basis.
The Company has set up a Risk Management Committee which is chaired by Dr. C. V. Natraj, Independent Director, to monitor the risks and their mitigating actions as well as formulating strategies towards identifying new and emergent risks.
The major risks forming part of the Enterprise Risk Management process are linked to the audit universe and are also covered as part of the annual risk based audit plan.
INTERNAL FINANcIAL cONTROLS
The Company’s internal financial control systems comprising Corporate Governance Policies, roles, responsibilities and authorities, standard operating procedures and ERP are reviewed by the Management.
The Internal Controls over Financial Reporting are routinely tested and certified by Statutory as well as Internal Auditors to cover all offices, factories and key business areas. Two external firms were engaged to cover the internal audit reviews and the reviews were performed based on the risk-based internal audit plan approved by the Audit Committee. Significant audit observations and follow up actions thereon were reported to the Audit Committee.
The Audit Committee reviews the adequacy and effectiveness of the Company’s internal control environment and monitors the implementation of audit recommendations, including those relating to strengthening of the Company’s risk management policies and systems. The ultimate objective being, a Zero Surprise, Risk controlled Organisation.
45
Board’s Report
Further details of the internal controls system are given in the
Management Discussion and Analysis Report, which forms
part of this Annual Report.
DIREcTORS AND KEY MANAGERIAL PERSONNEL
Appointment and cessation:
Mr. John Mulhall was appointed as a Director of the Company
with effect from 1st April, 2018 in accordance with the
approval of the Members obtained at the Annual General
Meeting (‘AGM’) held on 2nd July, 2018.
At the meeting of the Board of Directors held on
3rd December, 2018, the Board accepted the request of
Mr. V. Shankar, Managing Director & CEO, for an early
retirement from the services of the Company with effect
from 31st March, 2019 to pursue his interest in setting
up of the Company’s proposed ‘Centre for Sustainable
Agriculture and Farm Excellence’ (C-SAFE), an initiative
commemorating the 150 years of the Tata Group as a
significant contribution to nation building. The Board of
Directors placed on record their sincere appreciation for
Mr. Shankar’s contribution during his tenure as the
Managing Director & CEO of the Company.
At the same meeting, in order to provide continuity of
leadership to the Company, the Board, on the recommendation
of the Nomination and Remuneration Committee (‘NRC’),
appointed Mr. R. Mukundan as the Managing Director
& CEO of the Company for a period commencing from
3rd December, 2018 to 31st March, 2021 subject to the
approval of Members.
At the meeting of the Board of Directors held on
9th February, 2019, the Board, on the recommendation
of the NRC, appointed Mr. Sanjiv Lal as an
Additional Director of the Company with effect from
1st April, 2019 in accordance with Article 116 of the
Company’s Articles of Association and Section 161(1)
of the Act. He was also appointed as the Managing
Director & CEO of the Company for a period of five years
with effect from 1st April, 2019 to 31st March, 2024
subject to the approval of Members at the ensuing AGM.
He holds office upto the date of the ensuing AGM and a
Notice under Section 160(1) of the Act has been received
from a Member signifying the intention to propose his
appointment as Director.
Consequent to the appointment of Mr. Sanjiv Lal as Managing Director & CEO, Mr. R. Mukundan stepped down as the Managing Director & CEO effective close of business hours of 31st March, 2019. However, he continues as a Non-Executive Director on the Board of the Company and will continue to offer his support and guidance to the Company. Accordingly, approval of the Members is being sought at the ensuing AGM for his appointment as the Managing Director & CEO for the period commencing from 3rd December, 2018 to 31st March, 2019.
Pursuant to the provisions of the Act, the Members at the AGM of the Company held on 30th June, 2014 had appointed Dr. Punita Kumar-Sinha as Independent Director to hold office for five consecutive years for a term upto 29th June, 2019. Dr. Kumar-Sinha is eligible for re-appointment as an Independent Director for a second term.
Based on the recommendation of the Nomination NRC, her re-appointment for a second term commencing from 30th June, 2019 upto 25th March, 2024 is proposed at the ensuing AGM for the approval of the Members by way of special resolution.
Mr. P. R. Rastogi and Dr. Y. S. P. Thorat were appointed as Independent Directors at the AGM of the Company held on 30th June, 2014 to hold office for five consecutive years for a term upto 29th June, 2019. The Board of Directors placed on record their sincere appreciation for the contributions made by Mr. Rastogi and Dr. Thorat during their tenure as Independent Directors of the Company.
In accordance with the provisions of Section 152 of the Act and in terms of Article 112(2) of the Articles of Association of the Company, Mr. Bhaskar Bhat retires by rotation at the ensuing AGM and being eligible, offers himself for re-appointment. A resolution seeking Members’ approval for his re-appointment forms part of the Notice.
Independent Directors:
Dr. C. V. Natraj and Ms. Padmini Khare Kaicker, Independent Directors, hold office for a term of five years, or until completion of 75 years, whichever is earlier. They are not liable to retire by rotation in terms of Section 149(13) of the Act.
Dr. Natraj and Ms. Kaicker have given declarations that they meet the criteria of independence as laid down under Section 149(6) of the Act and Regulation 16(1)(b) of
46 | 71st Annual Report 2018-19
Statutory ReportsRallis India Limited
the Listing Regulations. In the opinion of the Board, they fulfill the conditions of independence as specified in the Act and the Rules made thereunder and are independent of the management.
Key Managerial Personnel (‘KMP’):
Mrs. P. S. Meherhomji resigned as the Company Secretary and Compliance Officer with effect from 28th February, 2019. The Board, on the recommendation of the NRC, appointed Mr. Yashaswin Sheth as the Company Secretary and Compliance Officer with effect from 1st March, 2019.
In terms of Section 203 of the Act, the following are the KMPs of the Company:
Mr. V. Shankar, Managing Director & CEO (upto 31st March, 2019)
Mr. R. Mukundan, Managing Director & CEO (w.e.f. 3rd December, 2018 upto 31st March, 2019)
Mr. Sanjiv Lal, Managing Director & CEO (w.e.f. 1st April, 2019)
Mr. Ashish Mehta, Chief Financial Officer
Mr. Yashaswin Sheth, Company Secretary
Governance Guidelines:
The Board of the Company has adopted Governance Guidelines on Board Effectiveness. The Guidelines cover aspects related to composition and role of the Board, Chairman and Directors, Board diversity, definition of independence, Director term, retirement age and Committees of the Board. It also covers aspects relating to nomination, appointment, induction and development of Directors, Director remuneration, Subsidiary oversight, Code of Conduct, Board Effectiveness Review and Mandates of Board Committees.
Procedure for Nomination and Appointment of Directors:
The NRC is responsible for developing competency requirements for the Board based on the industry and strategy of the Company. The Board composition analysis reflects in-depth understanding of the Company, including its strategies, environment, operations, financial condition and compliance requirements.
The NRC conducts a gap analysis to refresh the Board on a periodic basis, including each time a Director’s appointment or re-appointment is required. The Committee is also
responsible for reviewing the profiles of potential candidates vis-à-vis the required competencies and meeting potential candidates, prior to making recommendations of their nomination to the Board. At the time of appointment, specific requirements for the position, including expert knowledge expected, is communicated to the appointee.
criteria for Determining Qualifications, Positive Attributes and Independence of a Director:
The NRC has formulated the criteria for determining qualifications, positive attributes and independence of Directors in terms of provisions of Section 178(3) of the Act and Regulation 19 read with Part D of Schedule II of the Listing Regulations.
Independence: In accordance with the above criteria, a Director will be considered as an ‘Independent Director’ if he/she meets with the criteria for ‘Independent Director’ as laid down in the Act and Rules framed thereunder and Regulation 16(1)(b) of the Listing Regulations.
Qualifications: A transparent Board nomination process is in place that encourages diversity of thought, experience, knowledge, perspective, age and gender. It is also ensured that the Board has an appropriate blend of functional and industry expertise. While recommending the appointment of a Director, the NRC considers the manner in which the function and domain expertise of the individual will contribute to the overall skill-domain mix of the Board.
Positive Attributes: In addition to the duties as prescribed under the Act, the Directors on the Board of the Company are also expected to demonstrate high standards of ethical behaviour, strong interpersonal and communication skills and soundness of judgement. Independent Directors are also expected to abide by the ‘Code for Independent Directors’ as outlined in Schedule IV to the Act.
Annual Evaluation of Board Performance and Performance of its committees and of Directors:
Pursuant to the applicable provisions of the Act and the Listing Regulations, the Board has carried out an annual evaluation of its own performance, performance of the Directors as well as the evaluation of the working of its Committees.
The NRC has defined the evaluation criteria, procedure and time schedule for the Performance Evaluation process for the Board, its Committees and Directors.

47
Board’s Report
The performance of the Board and individual Directors was evaluated by the Board after seeking inputs from all the Directors. The performance of the Committees was evaluated by the Board after seeking inputs from the Committee Members. The criteria for performance evaluation of the Board included aspects such as Board composition and structure, effectiveness of Board processes, contribution in the long term strategic planning, etc. The criteria for performance evaluation of the Committees included aspects such as structure and composition of Committees, effectiveness of Committee meetings etc. The above criteria for evaluation was based on the Guidance Note issued by SEBI.
ln a separate meeting, the lndependent Directors evaluated the performance of Non-Independent Directors and performance of the Board as a whole. They also evaluated the performance of the Chairman taking into account the views of Executive Directors and Non-Executive Directors. The NRC reviewed the performance of the Board, its Committees and of the Directors. The same was discussed in the Board Meeting that followed the meeting of the lndependent Directors and NRC, at which the feedback received from the Directors on the performance of the Board and its Committees was also discussed.
Significant highlights, learning and action points with respect to the evaluation were discussed by the Board.
REMuNERATION POLIcY
The Company has adopted a Remuneration Policy for the Directors, Key Managerial Personnel and other employees, pursuant to the provisions of the Act and the Listing Regulations. The Remuneration Policy is attached as Annexure B, which forms part of this Report.
BOARD AND cOMMITTEE MEETINGS
A calendar of Board and Committee Meetings to be held during the year was circulated in advance to the Directors.
1. Details of Board Meetings
During the year under review, 8 (eight) Board Meetings were held, details of which are provided in the Corporate Governance Report.
2. composition of Audit committee
During the year under review, the Audit Committee
comprised 4 (four) Members out of which 3 (three) were
Independent Directors and 1 (one) was a Non-Executive
Non-Independent Director. During the year, 6 (six) Audit
Committee Meetings were held, details of which are
provided in the Corporate Governance Report.
There have been no instances during the year when
recommendations of the Audit Committee were not
accepted by the Board.
3. composition of corporate Social Responsibility (cSR) committee
As on 31st March, 2019, the Committee comprised 3
(three) Members out of which 2 (two) were Independent
Directors and 1 (one) was a Non-Executive Director.
During the year under review, 2 (two) CSR Committee
meetings were held, details of which are provided in the
Corporate Governance Report. Mr. Sanjiv Lal, Managing
Director & CEO, was inducted as a Member of the
CSR Committee, effective 1st April, 2019.
DIREcTORS’ RESPONSIBILITY STATEMENT
Based on the framework of internal financial controls and
compliance systems established and maintained by the
Company, work performed by the Internal, Statutory, Cost
and Secretarial Auditors, including audit of the internal
financial controls over financial reporting by the Statutory
Auditors, and the reviews performed by Management
and the relevant Board Committees, including the Audit
Committee, the Board is of the opinion that the Company’s
internal financial controls were adequate and effective
during FY 2018-19.
Accordingly, pursuant to Section 134(3)(c) and 134(5) of the
Act, the Board of Directors, to the best of their knowledge and
ability, confirm that:
(i) in the preparation of the annual accounts, the applicable
accounting standards have been followed and that
there are no material departures;
(ii) they have selected such accounting policies and
applied them consistently and made judgements
and estimates that are reasonable and prudent,

48 | 71st Annual Report 2018-19
Statutory ReportsRallis India Limited
so as to give a true and fair view of the state of affairs of the Company at the end of the financial year and of the profit of the Company for that period;
(iii) they have taken proper and sufficient care for the maintenance of adequate accounting records in accordance with the provisions of the Act, for safeguarding the assets of the Company and for preventing and detecting fraud and other irregularities;
(iv) they have prepared the annual accounts on a going concern basis;
(v) they have laid down internal financial controls to be followed by the Company and that such internal financial controls are adequate and are operating effectively;
(vi) they have devised proper systems to ensure compliance with the provisions of all applicable laws and that such systems are adequate and operating effectively.
cORPORATE SOcIAL RESPONSIBILITY
Corporate Social Responsibility (‘CSR’) and Affirmative Action (‘AA’) is a very important part of the business journey of the Company. The Company has developed its own Sustainability Model focusing on CSR and AA initiatives. The leadership team at Rallis has been very supportive, sensitive and encourages the team to work for inclusive growth through its CSR initiatives.
The Company’s CSR initiatives are driven by its CSR team, in support with key strategic partners having domain expertise. For achieving a greater and sustainable impact, CSR project implementation is done in partnership with concerned stakeholders.
The Company’s CSR initiatives are woven around the Company’s focus areas, which include Natural Resource Management (‘NRM’), Education including Farmer safety awareness and Model Tribal Village under AA.
Employees are one of the key stakeholders and support the CSR and AA initiatives by active participation through volunteering. During the year under review, the Company was able to achieve more than 5,044 hours’ volunteering through various events in which 319 employees actively participated.
In NRM, focus is on water conservation through rain water harvesting (‘Jal Dhan’), recharging ground water and soil conservation. Under soil conservation, focus is on ‘Greening’, principally through afforestation and tree plantation drives. More than 80,000 trees have been planted and sustained by the Company in the last five years.
In Education, focus is on Science, English and Information Technology, along with support for infrastructure and capacity building. Educational interventions are branded as ‘RUBY’ (Rallis Ujjwal Bhavishya Yojana).
In ‘You are Safe’, focus is on educating farmers and students from rural schools on farmer safety. During the year under review, the Company spread the awareness among more than 23,000 farmers and more than 10,400 students from 2 districts of Maharashtra, which are spread across 16 Tehsils and 553 villages.
The Company, under its AA programme, focuses on converting a backward Tribal village into a Model Tribal village. This initiative is focused in tribal areas around Mumbai in Maharashtra.
The above projects are in accordance with Schedule VII of the Act. The Annual Report on CSR activities is attached as Annexure c which is forming part of this Report.
The Company has adopted a Corporate Social Responsibility (‘CSR’) Policy in compliance with the provisions of the Act and the same is available on the website of the Company at http://www.rallis.co.in/CSR_Policy.htm.
Salient features of the cSR Policy:
The Company’s CSR Policy (‘Policy’) provides guidelines which helps in designing, implementing and monitoring the CSR programmes across the Company.
Leveraging our presence pan India, the Policy lays emphasis on providing engagement opportunities through volunteering to employees, customers and partners. The Policy focuses on various sections and issues as under:
1. Natural Resource Management: This section focuses on two themes: (a) Jal Dhan (b) Rural development

49
Board’s Report
2. Employability: With focus on: (a) Skill development: Tara – Women empowerment, and (b) RUBY – Educational initiatives
3. The Company will respond to disaster as and when required
4. Geography and target communities:
a. Due to its significant presence in Gujarat and Maharashtra currently the focus is on these two States.
b. The Company focuses on underprivileged schools, underprivileged and marginalised communities, socially and economically disadvantaged groups.
5. Implementation and Monitoring:
a. Will be done by the In-house CSR team with the help from experts as may be required.
b. Programmes will have clearly defined output, outcome and process indicators.
c. CSR Committee will receive quarterly progress report of all activities.
POLIcY ON PREVENTION, PROHIBITION AND REDRESSAL OF SEXuAL HARASSMENT AT WORKPLAcE
The Company has zero tolerance for sexual harassment at workplace and has adopted a Policy on Prevention, Prohibition, and Redressal of Sexual Harassment at workplace. This is in line with provisions of the Sexual Harassment of Women at Workplace (Prevention, Prohibition and Redressal) Act, 2013 (‘POSH Act’) and the Rules made thereunder. With the objective of providing a safe working environment, all employees (permanent, contractual, temporary, trainees) are covered under this Policy. The policy is available on the website at http://www.rallis.co.in/POSH.htm
As per the requirement of the POSH Act and Rules made thereunder, the Company has constituted an Internal Committee at all its locations known as the Prevention of Sexual Harassment (POSH) Committees, to inquire and redress complaints received regarding sexual harassment.
During the year under review, the Company received
one complaint of alleged sexual harassment that was
investigated and dealt with by taking appropriate action as
per the provisions of the POSH Act. There are no pending
complaints as on the end of the financial year.
VIGIL MEcHANISM/ WHISTLEBLOWER POLIcY
Pursuant to Section 177(9) of the Act, a vigil mechanism
has been established for Directors and employees to report
to the management, instances of unethical behaviour,
actual or suspected, fraud or violation of the Company’s code
of conduct or ethics policy.
The Company believes in the conduct of the affairs of
its constituents by adopting the highest standards of
professionalism, honesty, integrity and ethical behaviour,
in line with the Tata Code of Conduct (‘TCoC’). The role
of the employees in pointing out such violations of the
TCoC cannot be undermined.
Further, the Policy provides for adequate safeguards
against victimisation of employees who avail of the
mechanism and also provides for direct access to the
Chairperson of the Audit Committee. During the year
under review, the Company amended the Whistleblower
Policy to provide a clause wherein all employees of the
Company are eligible to report any instance of leak of
Unpublished Price Sensitive Information.
SIGNIFIcANT AND MATERIAL ORDERS PASSED BY THE REGuLATORS OR cOuRTS
No significant material orders have been passed by the
Regulators or Courts or Tribunals which would impact
the going concern status of the Company and its
future operations.
AuDIT AND AuDITORS
(1) Statutory Auditors:
At the AGM of the Company held in 2017, pursuant
to the provisions of the Act and the Rules made
thereunder, B S R & Co. LLP, Chartered Accountants
(‘BSR’) (Firm Registration No. 101248W/W-100022),
were appointed as Statutory Auditors of the Company
50 | 71st Annual Report 2018-19
Statutory ReportsRallis India Limited
from the conclusion of the 69th AGM held on 23rd June, 2017 till the conclusion of the 74th AGM to be held in the year 2022. BSR have submitted a certificate confirming that their appointment is in accordance with Section 139 read with Section 141 of the Act.
The Audit Report of BSR on the Financial Statements of the Company for FY 2018-19 is a part of the Annual Report. The Report does not contain any qualification, reservation, adverse remark or disclaimer.
(2) cost Auditors:
The Company is required to maintain cost records as specified by the Central Government under sub-section (1) of Section 148 of the Act and the rules framed thereunder, and accordingly, the Company has made and maintained such cost accounts and records.
In terms of Section 148 of the Act read with Companies (Cost Records and Audits) Rules, 2014, the Audit Committee recommended and the Board of Directors appointed D. C. Dave & Co., Cost Accountants (Firm Registration No. 000611) to conduct Cost Audits relating to Insecticides (Liquid, Solid and Technical Grade), Fertilizers, Chemicals (Plastics and Polymers) and Drugs and Pharmaceuticals of the Company for the year ending 31st March, 2020. The Company has received their written consent that the appointment will be in accordance with the applicable provisions of the Act and rules framed thereunder.
Members are requested to consider the ratification of the remuneration payable to D. C. Dave & Co. as has been set out in the Notice of the 71st AGM of the Company.
(3) Internal Auditors:
Pursuant to the provisions of Section 138 of the Act and the Companies (Accounts) Rules, 2014, on the recommendation of the Audit Committee, Ernst & Young LLP and Mahajan & Aibara LLP were appointed by the Board of Directors to conduct internal audit reviews for the Company.
(4) Secretarial Auditors:
In terms of Section 204 of the Act and the Companies (Appointment and Remuneration of Managerial Personnel) Rules, 2014, Parikh & Associates, a firm of Company Secretaries in Practice, have been appointed as Secretarial Auditors of the Company. The report of the Secretarial Auditors is enclosed as Annexure D. There has been no qualification, reservation, adverse remark or disclaimer given by the Secretarial Auditors in their Report.
REPORTING OF FRAuDS BY AuDITORS
During the year under review, the Statutory Auditors, Cost Auditors and Secretarial Auditors have not reported any instances of frauds committed in the Company by its Officers or Employees, to the Audit Committee under Section 143(12) of the Companies Act, 2013, details of which needs to be mentioned in this Report.
ANNuAL RETuRN
Pursuant to Sections 92 and 134(3) of the Act and Rule 12 of the Companies (Management and Administration) Rules, 2014, the extract of Annual Return in Form MGT-9 is attached as Annexure E.
The extract of the Annual Return of the Company can also be accessed on the website of the Company at http://www.rallis.co.in/MGT2019.htm.
SEcRETARIAL STANDARDS OF IcSI
The Directors have devised proper systems and processes for complying with the requirements of applicable Secretarial Standards issued by the Institute of Company Secretaries of India and that such systems were adequate and operating effectively.
cONSERVATION OF ENERGY, TEcHNOLOGY ABSORPTION AND FOREIGN EXcHANGE EARNINGS AND OuTGO
The information on conservation of energy, technology absorption and foreign exchange earnings and outgo stipulated under Section 134(3)(m) of the Act read with Rule 8 of The Companies (Accounts) Rules, 2014, is attached as Annexure F.

51
Board’s Report
On behalf of the Board of Directors
BHASKAR BHATMumbai, 25th April, 2019 Chairman
PARTIcuLARS OF EMPLOYEES AND REMuNERATION
The information required under Section 197(12) of the Act read with Rule 5 of the Companies (Appointment and Remuneration of Managerial Personnel) Rules, 2014 is attached as Annexure G.
The information required under Rule 5(2) and (3) of The Companies (Appointment and Remuneration of Managerial Personnel) Rules, 2014 is provided in the Annexure forming part of the Report. In terms of the first proviso to Section 136 of the Act, the Report and Accounts are being sent to the Members excluding the aforesaid Annexure. Any Members interested in obtaining the same may write to the Company Secretary at the registered office of the Company. None of the employees listed in the said Annexure is related to any Director of the Company.
MANAGEMENT DIScuSSION AND ANALYSIS, BuSINESS RESPONSIBILITY AND cORPORATE GOVERNANcE REPORT
The Management Discussion and Analysis Report, the Business Responsibility Report and the Report on Corporate Governance, as required under the Listing Regulations, forms part of the Annual Report.
AcKNOWLEDGEMENTS
The Directors acknowledge the dedicated service of the employees of the Company during the year. They would also like to place on record their appreciation for the continued co-operation and support received by the Company during the year from bankers, financial institutions, Government authorities, business partners and other stakeholders.

52 | 71st Annual Report 2018-19
Statutory ReportsRallis India Limited
1. ABOUT THE COMPANY Rallis India Limited (hereinafter referred to as “the
Company” or “Rallis”) is a Company incorporated under the Indian Companies Act, 1913. It has its Registered Office at Mumbai and is a Tata Enterprise, engaged in the business of providing crop care solutions and agri services to the farming community. It is a subsidiary of Tata Chemicals Limited and is listed on BSE Limited and The National Stock Exchange of India Limited.
2. OBJECTIVES OF THE POLICY 2.1 Securities and Exchange Board of India (hereinafter
referred to as “SEBI”) has, by its Notification dated 8th July, 2016, inserted Regulation 43A in the SEBI (Listing Obligations and Disclosure Requirements) Regulations, 2015 (hereinafter referred to as “the Listing Regulations”).
2.2 Regulation 43A of the Listing Regulations requires the Company to formulate a Dividend Distribution Policy which shall be disclosed in the Annual Report and on the website of the Company.
2.3 In view of the above, the Company has framed this Dividend Distribution Policy (hereinafter referred to as “the Policy”) to determine the parameters on the basis of which the Company may or may not declare dividend.
2.4 The Policy seeks to balance the objectives of rewarding the shareholders through dividends and retaining capital to invest in the growth of the Company, while ensuring fairness, sustainability and consistency in distributing profits to the shareholders.
3. PAYMENT FREQUENCY The dividend shall, subject to the parameters hereinafter
described, be payable annually and shall be declared at the Annual General Meeting of the Company, based on the recommendation of the Board of Directors of the Company (hereinafter referred to as “the Board”). The Board may declare interim dividend during any financial year out of the surplus in the profit and loss account and out of profits of the financial year in which the interim dividend is sought to be declared. The Board may recommend special dividend in years of exceptional gains or on occasions of significance.
Annexure A to the Board’s ReportDIVIDEND DISTRIBUTION POLICY
4. DECLARATION OF DIVIDEND It is the intention of the Board of Directors, subject to
applicable laws, to pay dividend on the Company’s outstanding Equity shares. The Company does not have any class of Shares other than Equity Shares.
5. PARAMETERS FOR DISTRIBUTION OF DIVIDEND
5.1 Your Company has a track record of steady dividend declaration and payment over its history. The Board considers the yearly dividend based on the Net Profit After Tax (PAT) available for distribution. In addition, the Board reviews the capital expenditure needs, cash requirements for investments in capability enhancements and future non organic growth initiatives.
5.2 As in the past, subject to the provisions of the applicable law, the Company’s dividend pay-out will be determined based on available financial resources, investment requirements and taking into account optimal shareholder return. Based on the above, the Company will endeavour to maintain the steady level of dividend per share over the medium term.
5.3 Circumstances under which the shareholders of the Company may or may not expect dividend:
The Shareholders may ordinarily expect dividend if the Company has made profits during the current year. Recommending dividend out of profits of previous financial years or out of retained earnings shall be at the discretion of the Board, subject to the compliance with the Companies (Declaration and Payment of Dividend) Rules, 2014, as amended from time to time. The Board may not recommend a dividend if:
• Proposed expansion plans require higher allocation of capital; or
• Significantly higher working capital requirements adversely impact free cash flow; or
• The Company undertakes any acquisitions or investments including in joint ventures, new product launches, etc., requiring significant capital outflow; or
• In case of proposal for buyback of shares; or • In the event of inadequacy of profits.

53
Board’s Report
If the Board proposes not to distribute profit, the grounds thereof and information on utilisation of undistributed profit, if any, shall be disclosed to the shareholders in the Annual Report of the Company.
5.4 Financial Parameters for declaring dividend:
The Board shall consider the following financial parameters while declaring dividend:
• the Company’s Financial results of operations and earnings;
• working capital requirements for the operations and growth of the Company and its subsidiaries;
• q uantum of profits and liquidity position; • future fund requirements, including for brand
building, business acquisitions, business expansion, modernization of existing business;
• level of debt; • providing for unforeseen events and
contingencies; • any other financial factor as the Board may
deem fit.
5.5 Internal and External Factors for declaring dividend:
The Board may consider the following internal and external factors while declaring dividend:
Internal Factors: • the level of dividends paid historically; • contractual restrictions and financing
agreement covenants; • likelihood of crystallization of contingent
liabilities, if any.
External Factors: • general business conditions, risk and
uncertainties; • industry outlook and business cycles for
underlying businesses; • prevailing economic, competitive and
regulatory environment; • tax law and the Company’s taxpayer status; • capital market.
This is not intended to be an all-inclusive list, but rather a representative list of factors which may be considered while declaring dividend.
5.6 Manner in which the retained earnings shall be utilised:
Retained earnings are the sum of the Company’s profits after dividend payments, since the Company’s inception. The retained earnings of the Company will be utilised in one or more of the following manner:
• for expansion and growth of business; • for contributing towards the fixed as well as
working capital needs of the Company; • major repairs and maintenance, including
replacement of old assets which have become obsolete;
• renovation/ modernization for improving working efficiency of plants and equipments and for capacity enhancements;
• to make the Company self dependent of finance from external sources;
• for redemption of loans and debentures (if any); • for upgradation of technical knowhow; • non organic growth initiatives, including
acquisition of brands/ businesses; • for issuing fully paid-up bonus shares to the
Shareholders.
5.7 Dividend Range: As in the past, subject to the provisions of
applicable laws, the Company’s dividend payout will be determined based on availability of financial resources, investment requirements and also take into account optimal shareholder return. The Company would endeavour to target a total dividend payout ratio in the range of 30% to 50% of the Annual Standalone Profits after Tax (PAT) of the Company.
6. REVIEW OF POLICY This Policy has been adopted by the Board of
Directors of the Company and the Board may review and amend the Policy from time to time, pursuant to any change in law or otherwise.
7. DISCLOSURES Rallis shall disclose the Dividend Distribution Policy in
the Board’s Report forming part of the Annual Report. This Policy shall also be disclosed on the website of the Company at www.rallis.co.in. Any changes in the Policy, along with the rationale for the same, shall also be disclosed in the Annual Report and on the website of the Company.
On behalf of the Board of Directors
BHASKAR BHATMumbai, 25th April, 2019 Chairman

54 | 71st Annual Report 2018-19
Statutory ReportsRallis India Limited
The philosophy for remuneration of directors, Key Managerial Personnel (“KMP”) and all other employees of Rallis India Limited (“Company”) is based on the commitment of fostering a culture of Leadership with Trust. The remuneration policy is aligned to this philosophy.
This remuneration policy has been prepared pursuant to the provisions of Section 178(3) of the Companies Act, 2013 (“Act”) and Regulation 19(4) read with Para A (1) of Part D of Schedule II of the Securities and Exchange Board of India (Listing Obligations and Disclosure Requirements) Regulations, 2015 (“Listing Regulations”). In case of any inconsistency between the provisions of law and this remuneration policy, the provisions of the law shall prevail and the Company shall abide by the applicable law. While formulating this policy, the Nomination and Remuneration Committee (“NRC”) has considered the factors laid down under Section 178(4) of the Act, which are as under:
“(a) the level and composition of remuneration is reasonable and sufficient to attract, retain and motivate directors of the quality required to run the Company successfully;
(b) relationship of remuneration to performance is clear and meets appropriate performance benchmarks; and
(c) remuneration to directors, key managerial personnel and senior management involves a balance between fixed and incentive pay reflecting short and long-term performance objectives appropriate to the working of the Company and its goals.”
Key principles governing this remuneration policy are as follows:
Remuneration for independent directors and non-independent non-executive directors
• Independent directors (“ID”) and non-independent non-executive directors (“NED”) may be paid sitting fees (for attending the meetings of the Board and of Committees of which they may be members) and commission within regulatory limits.
• Within the parameters prescribed by law, the payment of sitting fees and commission will be recommended by the NRC and approved by the Board.
• Overall remuneration (sitting fees and commission) should be reasonable and sufficient to attract, retain
and motivate directors aligned to the requirements of the Company (taking into consideration the challenges faced by the Company and its future growth imperatives).
• Overall remuneration should be reflective of size of the Company, complexity of the sector/ industry/ Company’s operations and the Company’s capacity to pay the remuneration.
• Overall remuneration practices should be consistent with recognized best practices.
• Quantum of sitting fees may be subject to review on a periodic basis, as required.
• The aggregate commission payable to all the NEDs and IDs will be recommended by the NRC to the Board based on Company performance, profits, return to investors, shareholder value creation and any other significant qualitative parameters as may be decided by the Board.
• The NRC will recommend to the Board the quantum of commission for each director based upon the outcome of the evaluation process which is driven by various factors including attendance and time spent in the Board and Committee meetings, individual contributions at the meetings and contributions made by directors other than in meetings.
• In addition to the sitting fees and commission, the Company may pay to any director such fair and reasonable expenditure, as may have been incurred by the director while performing his/ her role as a director of the Company. This could include reasonable expenditure incurred by the director for attending Board/ Board Committee meetings, general meetings, court convened meetings, meetings with shareholders/ creditors/ management, site visits, induction and training (organized by the Company for directors) and in obtaining professional advice from independent advisors in the furtherance of his/ her duties as a director.
Remuneration for Managing Director (“MD”)/ Executive Directors (“ED”)/ KMP/ rest of the employees
• The extent of overall remuneration should be sufficient to attract and retain talented and qualified individuals suitable for every role. Hence remuneration should be:
Annexure B to the Board’s ReportREMUNERATION POLICY FOR DIRECTORS, KEY MANAGERIAL PERSONNEL AND OTHER EMPLOYEES

55
Board’s Report
o Market competitive (market for every role is defined as companies from which the Company attracts talent or companies to which the Company loses talent).
o Driven by the role played by the individual.
o Reflective of size of the Company, complexity of the sector/ industry/ Company’s operations and the Company’s capacity to pay.
o Consistent with recognized best practices; and
o Aligned to any regulatory requirements.
• In terms of remuneration mix or composition:
o The remuneration mix for the MD/ EDs is as per the contract approved by the shareholders. In case of any change, the same would require the approval of the shareholders.
o Basic/ fixed salary is provided to all employees to ensure that there is a steady income in line with their skills and experience.
o In addition to the basic/ fixed salary, the Company provides employees with certain perquisites, allowances and benefits to enable a certain level of lifestyle and to offer scope for savings and tax optimization, where possible. The Company also provides all employees with a social security net (subject to limits) by covering medical expenses and hospitalization through re-imbursements or insurance cover and accidental death and dismemberment through personal accident insurance.
o The Company provides retirement benefits as applicable.
o In addition to the basic/ fixed salary, benefits, perquisites and allowances as provided above, the Company provides MD/ EDs such remuneration by way of commission, calculated with reference to the net profits of the Company in a particular financial year, as may be determined by the Board, subject to the overall ceilings stipulated in Section 197 of the Act. The specific amount payable to the MD/ EDs would be based on performance as evaluated by the Board or the NRC and approved by the Board.
o The Company provides the rest of the employees a performance linked bonus. The performance linked bonus would be driven by the outcome of the performance appraisal process and the performance of the Company.
Remuneration payable to Director for services rendered in other capacity
The remuneration payable to the Directors shall be inclusive of any remuneration payable for services rendered by such director in any other capacity unless:
a) The services rendered are of a professional nature; and
b) The NRC is of the opinion that the director possesses requisite qualification for the practice of the profession.
Policy implementation
The NRC is responsible for recommending the remuneration policy to the Board. The Board is responsible for approving and overseeing implementation of the remuneration policy.
On behalf of the Board of Directors
BHASKAR BHAT Chairman
Mumbai, 25th April, 2019

56 | 71st Annual Report 2018-19
Statutory ReportsRallis India Limited
1. A brief outline of the Company’s CSR Policy, including overview of projects or programs proposed to be undertaken and a reference to the web-link to the CSR Policy and projects or programs.
The Company is committed to improve quality of lives of people in the community it serves through long term stakeholder value creation, with special focus on empowerment of communities in rural India. Our CSR initiatives focus on Natural Resources Management (Water, Soil Health, Public Healthcare and Sanitation), Employability through skills building and education, and Farmer Safety. CSR activities of the Company are implemented by the in-house CSR team, through participatory approach involving beneficiaries, NGOs and other community partners. Interventions are aligned with Tata Group Focus Initiatives.
The Company has framed its CSR Policy in compliance with the provisions of the Companies Act, 2013 and the same is placed on the Company’s website at the following weblink:
http://www.rallis.co.in/CSR_Policy.htm
The overview of CSR projects and programmes are available at the following weblink:
http://www.rallis.co.in/CSRProjects.htm
2. The Composition of the CSR Committee. 1. Mr. John Mulhall (Chairman)2. Dr. Y. S. P. Thorat3. Mr. Prakash R. Rastogi4. Mr. Sanjiv Lal (appointed w.e.f. 1st April, 2019)
3. Average net profit of the Company for last three financial years.
` 192.35 crores
4. Prescribed CSR Expenditure (two percent of the amount as in item 3 above).
` 3.85 crores
5. Details of CSR spent for the financial year.
(a) Total amount to be spent for the financial year:
(b) Amount unspent, if any:
(c) Manner in which the amount spent during the financial year is detailed below:
` 3.85 crores (The Company has spent ` 3.86 crores during financial year 2018-19)
Nil
The manner in which the amount is spent is annexed.
6. In case the Company has failed to spend the two per cent of the average net profit of the last three financial years or any part thereof, the Company shall provide the reasons for not spending the amount in its Board report.
Not Applicable
7. A responsibility statement of the CSR Committee that the implementation and monitoring of CSR Policy, is in compliance with CSR objectives and Policy of the Company.
The implementation and monitoring of CSR Policy is in compliance with CSR objectives and Policy of the Company.
Mumbai25th April, 2019
Sanjiv LalManaging Director & CEO
John Mulhall Chairman - CSR Committee
Annexure C to the Board’s ReportANNUAL REPORT ON CORPORATE SOCIAL RESPONSIBILITY (CSR) ACTIVITIES
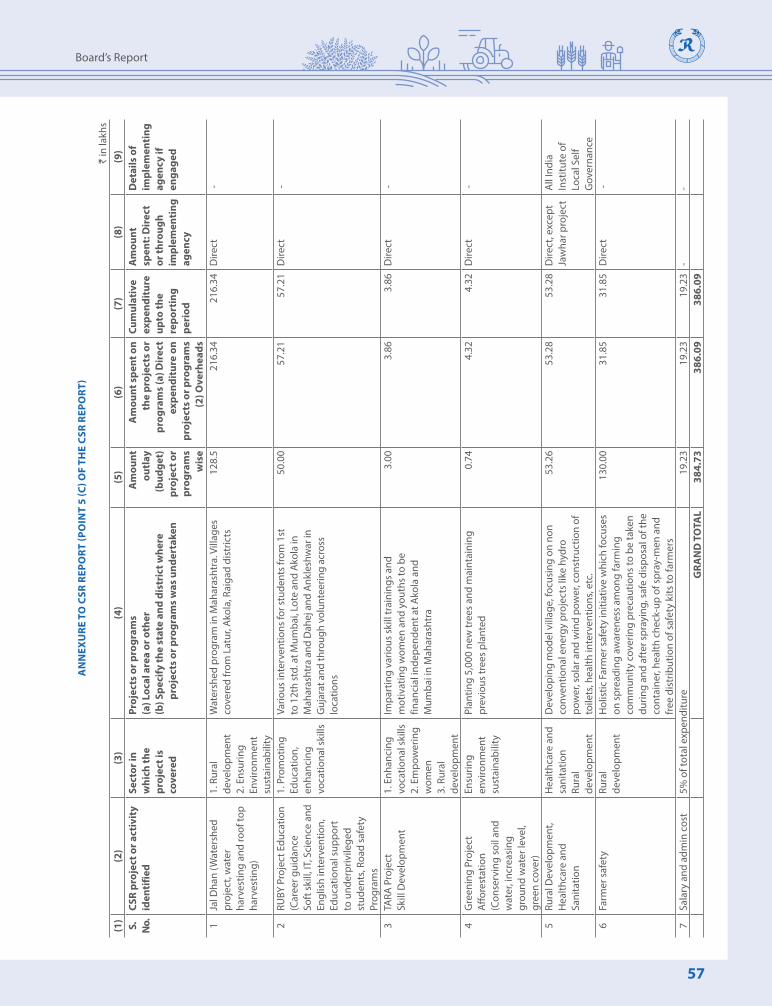
57
Board’s Report
AN
NEx
URE
TO
CSR
REP
ORT
(PO
INT
5 (C
) OF
THE
CSR
REPO
RT)
` in
lakh
s(1
)(2
)(3
)(4
)(5
)(6
)(7
)(8
)(9
)S.
N
o.CS
R pr
ojec
t or a
ctiv
ity
iden
tifie
dSe
ctor
in
whi
ch th
e pr
ojec
t is
cove
red
Proj
ects
or p
rogr
ams
(a
) Loc
al a
rea
or o
ther
(b
) Spe
cify
the
stat
e an
d di
stri
ct w
here
pro
ject
s or
pro
gram
s w
as u
nder
take
n
Am
ount
ou
tlay
(b
udge
t)
proj
ect o
r pr
ogra
ms
wis
e
Am
ount
spe
nt o
n th
e pr
ojec
ts o
r pr
ogra
ms
(a) D
irec
t ex
pend
itur
e on
pr
ojec
ts o
r pro
gram
s (2
) Ove
rhea
ds
Cum
ulat
ive
expe
ndit
ure
upto
the
repo
rtin
g pe
riod
Am
ount
sp
ent:
Dir
ect
or th
roug
h im
plem
enti
ng
agen
cy
Det
ails
of
impl
emen
ting
ag
ency
if
enga
ged
1Ja
l Dha
n (W
ater
shed
pr
ojec
t, w
ater
ha
rves
ting
and
roof
top
harv
estin
g)
1. R
ural
de
velo
pmen
t 2.
Ens
urin
g En
viro
nmen
t su
stai
nabi
lity
Wat
ersh
ed p
rogr
am in
Mah
aras
htra
. Vill
ages
co
vere
d fr
om L
atur
, Ako
la, R
aiga
d di
stric
ts12
8.5
216.
34 2
16.3
4D
irect
-
2RU
BY P
roje
ct E
duca
tion
(C
aree
r gui
danc
e So
ft s
kill,
IT, S
cien
ce a
nd
Engl
ish
inte
rven
tion,
Ed
ucat
iona
l sup
port
to
und
erpr
ivile
ged
stud
ents
, Roa
d sa
fety
Pr
ogra
ms
1. P
rom
otin
g Ed
ucat
ion,
en
hanc
ing
voca
tiona
l ski
lls
Vario
us in
terv
entio
ns fo
r stu
dent
s fro
m 1
st
to 1
2th
std.
at M
umba
i, Lo
te a
nd A
kola
in
Mah
aras
htra
and
Dah
ej a
nd A
nkle
shw
ar in
G
ujar
at a
nd th
roug
h vo
lunt
eerin
g ac
ross
lo
catio
ns
50.0
057
.21
57.
21D
irect
-
3TA
RA P
roje
ct
Skill
Dev
elop
men
t 1.
Enh
anci
ng
voca
tiona
l ski
lls
2. E
mpo
wer
ing
w
omen
3.
Rur
al
deve
lopm
ent
Impa
rtin
g va
rious
ski
ll tr
aini
ngs
and
mot
ivat
ing
wom
en a
nd y
outh
s to
be
fin
anci
al in
depe
nden
t at A
kola
and
M
umba
i in
Mah
aras
htra
3.00
3.86
3.8
6D
irect
-
4G
reen
ing
Proj
ect
Affo
rest
atio
n (C
onse
rvin
g so
il an
d w
ater
, inc
reas
ing
grou
nd w
ater
leve
l, gr
een
cove
r)
Ensu
ring
envi
ronm
ent
sust
aina
bilit
y
Plan
ting
5,00
0 ne
w tr
ees
and
mai
ntai
ning
pr
evio
us tr
ees
plan
ted
0.74
4.32
4.3
2D
irect
-
5Ru
ral D
evel
opm
ent,
Hea
lthca
re a
nd
Sani
tatio
n
Hea
lthca
re a
nd
sani
tatio
n Ru
ral
deve
lopm
ent
Dev
elop
ing
mod
el v
illag
e, fo
cusi
ng o
n no
n co
nven
tiona
l ene
rgy
proj
ects
like
hyd
ro
pow
er, s
olar
and
win
d po
wer
, con
stru
ctio
n of
to
ilets
, hea
lth in
terv
entio
ns, e
tc.
53.2
653
.28
53.
28D
irect
, exc
ept
Jaw
har p
roje
ctA
ll In
dia
Inst
itute
of
Loca
l Sel
f G
over
nanc
e6
Farm
er s
afet
yRu
ral
deve
lopm
ent
Hol
istic
Far
mer
saf
ety
initi
ativ
e w
hich
focu
ses
on s
prea
ding
aw
aren
ess
amon
g fa
rmin
g co
mm
unity
cov
erin
g pr
ecau
tions
to b
e ta
ken
durin
g an
d af
ter s
pray
ing,
saf
e di
spos
al o
f the
co
ntai
ner,
heal
th c
heck
-up
of s
pray
-men
and
fr
ee d
istr
ibut
ion
of s
afet
y ki
ts to
farm
ers
130.
0031
.85
31.
85D
irect
-
7Sa
lary
and
adm
in c
ost
5% o
f tot
al e
xpen
ditu
re
19.2
319
.23
19.2
3 -
-
GRA
ND
TO
TAL
384.
7338
6.09
386.
09

58 | 71st Annual Report 2018-19
Statutory ReportsRallis India Limited
To,
The Members, Rallis India Limited
We have conducted the secretarial audit of the compliance of applicable statutory provisions and the adherence to good corporate practices by Rallis India Limited (hereinafter called the Company). Secretarial Audit was conducted in a manner that provided us a reasonable basis for evaluating the corporate conducts/statutory compliances and expressing our opinion thereon.
Based on our verification of the Company’s books, papers, minute books, forms and returns filed and other records maintained by the Company, the information provided by the Company, its officers, agents and authorised representatives during the conduct of secretarial audit, the explanations and clarifications given to us and the representations made by the Management, we hereby report that in our opinion, the Company has, during the audit period covering the financial year ended on 31st March, 2019 generally complied with the statutory provisions listed hereunder and also that the Company has proper Board processes and compliance mechanism in place to the extent, in the manner and subject to the reporting made hereinafter:
We have examined the books, papers, minute books, forms and returns filed and other records made available to us and maintained by the Company for the financial year ended on 31st March, 2019 according to the provisions of:
(i) The Companies Act, 2013 (‘the Act’) and the Rules made thereunder;
(ii) The Securities Contract (Regulation) Act, 1956 (‘SCRA’) and the Rules made thereunder;
(iii) The Depositories Act, 1996 and the Regulations and Bye-laws framed thereunder;
(iv) Foreign Exchange Management Act, 1999 and the Rules and Regulations made thereunder to the extent of Foreign Direct Investment, Overseas Direct Investment and External Commercial Borrowings;
Annexure D to the Board’s ReportFORM NO. MR-3
SECRETARIAL AUDIT REPORTFOR THE FINANCIAL YEAR ENDED 31ST MARCH, 2019(Pursuant to Section 204 (1) of the Companies Act, 2013 and Rule No. 9 of the Companies (Appointment and Remuneration of Managerial Personnel) Rules, 2014)
(v) The following Regulations and Guidelines prescribed under the Securities and Exchange Board of India Act, 1992 (‘SEBI Act’):
(a) The Securities and Exchange Board of India (Substantial Acquisition of Shares and Takeovers) Regulations, 2011;
(b) The Securities and Exchange Board of India (Prohibition of Insider Trading) Regulations, 2015;
(c) The Securities and Exchange Board of India (Issue of Capital and Disclosure Requirements) Regulations, 2009 and The Securities and Exchange Board of India (Issue of Capital and Disclosure Requirements) Regulations, 2018 and amendments from time to time; (Not applicable to the Company during the audit period)
(d) The Securities and Exchange Board of India (Share Based Employee Benefits) Regulations, 2014; (Not applicable to the Company during the audit period)
(e) The Securities and Exchange Board of India (Issue and Listing of Debt Securities) Regulations, 2008; (Not applicable to the Company during the audit period)
(f ) The Securities and Exchange Board of India (Registrars to an Issue and Share Transfer Agents) Regulations, 1993 regarding the Companies Act and dealing with client; (Not applicable to the Company during the audit period)
(g) The Securities and Exchange Board of India (Delisting of Equity Shares) Regulations, 2009; (Not applicable to the Company during the audit period) and
(h) The Securities and Exchange Board of India (Buyback of Securities) Regulations, 1998; Securities and Exchange Board of India (Buyback of Securities) Regulations, 2018; (Not applicable to the Company during the audit period)
59
Board’s Report
(vi) Other laws specifically applicable to the Company namely:
1) The Insecticides Act, 1968 and Rules, 1971
2) The Seeds Act, 1966 and Rules, 1968
3) The Fertilizers (Control) Order, 1985
We have also examined compliance with the applicable clauses of the following:
(i) Secretarial Standards issued by The Institute of Company Secretaries of India with respect to board and general meetings.
(ii) The Listing Agreements entered into by the Company with BSE Limited and National Stock Exchange of India Limited read with the SEBI (Listing Obligations and Disclosure Requirements) Regulations, 2015.
During the period under review, the Company has complied with the provisions of the Act, Rules, Regulations, Guidelines, Standards, etc. mentioned above.
We further report that:
The Board of Directors of the Company is duly constituted with proper balance of Executive Directors, Non-Executive Directors and Independent Directors. The changes in the composition of the Board of Directors that took place during
the period under review were carried out in compliance with the provisions of the Act.
Adequate notice was given to all directors to schedule the Board Meetings, agenda and detailed notes on agenda were sent at least seven days in advance other than those held at shorter notice, and a system exists for seeking and obtaining further information and clarifications on the agenda items before the meeting and for meaningful participation at the meeting.
Decisions at the Board Meetings were taken unanimously.
We further report that there are adequate systems and processes in the Company commensurate with the size and operations of the Company to monitor and ensure compliance with applicable laws, rules, regulations and guidelines.
We further report that during the audit period, the following events which had bearing on the Company’s affairs in pursuance of the above referred laws, rules, regulations, guidelines, standards etc.:
The Board of Directors of the Company at its meeting held on 17th January, 2019, approved the scheme of merger by absorption of its Wholly Owned Subsidiary, Metahelix Life Sciences Limited with the Company, subject to receipt of all requisite statutory and regulatory approvals, including approval of the National Company Law Tribunal.
For Parikh & AssociatesCompany Secretaries
Jigyasa VedPlace: Mumbai PartnerDate: 25th April, 2019 FCS No: 6488 CP No: 6018
This Report is to be read with our letter of even date which is annexed as Annexure A and forms an integral part of this report.

60 | 71st Annual Report 2018-19
Statutory ReportsRallis India Limited
‘Annexure A’
To,
The Members,Rallis India Limited
Our report of even date is to be read along with this letter.
1. Maintenance of Secretarial record is the responsibility of the management of the Company. Our responsibility is to express an opinion on these secretarial records based on our audit.
2. We have followed the audit practices and process as were appropriate to obtain reasonable assurance about the correctness of the contents of the Secretarial records. The verification was done on test basis to ensure that correct facts are reflected in Secretarial records. We believe that the process and practices, we followed provide a reasonable basis for our opinion.
3. We have not verified the correctness and appropriateness of financial records and Books of Accounts of the Company.
4. Wherever required, we have obtained the Management representation about the compliance of laws, rules and regulations and happening of events etc.
5. The compliance of the provisions of Corporate and other applicable laws, rules, regulations, standards is the responsibility of management. Our examination was limited to the verification of procedure on test basis.
6. The Secretarial Audit report is neither an assurance as to the future viability of the Company nor of the efficacy or effectiveness with which the management has conducted the affairs of the Company.
For Parikh & AssociatesCompany Secretaries
Jigyasa VedPlace: Mumbai PartnerDate: 25th April, 2019 FCS No: 6488 CP No: 6018

61
Board’s Report
Annexure E to the Board’s ReportFORM NO. MGT.9
ExTRACT OF ANNUAL RETURNas on the financial year ended on 31st March, 2019[Pursuant to Section 92(3) of the Companies Act, 2013 and Rule 12 (1) of The Companies (Management and Administration) Rules, 2014]
I. REGISTRATION AND OTHER DETAILS
CIN L36992MH1948PLC014083
Registration Date 23rd August, 1948
Name of the Company Rallis India Limited
Category / Sub-Category of the Company Public Company / Limited by shares
Address of the Registered Office and contact details 156/157 15th Floor Nariman Bhavan 227 Nariman Point Mumbai - 400 021.Tel. No.: 91 22 6665 2700Fax No.: 91 22 6665 2827E-mail: [email protected]: www.rallis.co.in
Whether listed company Yes
Name, address and contact details of Registrar and Transfer Agents, if any
TSR DARASHAW LIMITED6-10 Haji Moosa Patrawala Industrial Estate,20 Dr. E. Moses Road, Mahalaxmi, Mumbai - 400 011.Tel. No.: 91 22 6656 8484Fax No.: 91 22 6656 8494E-mail: [email protected]: www.tsrdarashaw.com
II. PRINCIPAL BUSINESS ACTIVITIES OF THE COMPANY All the business activities contributing 10% or more of the total turnover of the Company shall be stated:
Sl. No.
Name and Descriptionof main products/services
NIC Code of theproduct/service
% to total turnoverof the Company
1. Agri Inputs 3808 97.72
III. PARTICULARS OF HOLDING, SUBSIDIARY AND ASSOCIATE COMPANIES
Sl. No.
Name andAddress of the Company
CIN/GLN Holding/Subsidiary/
Associate
% ofShares
Held
ApplicableSection
1. Tata Chemicals LimitedBombay House 24 Homi Mody Street Fort Mumbai - 400 001.
L24239MH1939PLC002893 Holding Company
50.06 2(46)
2. Metahelix Life Sciences LimitedPlot No. 3 KAIAD 4th Phase Bommasandra Industrial Estate Bengaluru - 560 099.
U73100KA2000PLC028246 Subsidiary Company
100 2(87)(ii)

62 | 71st Annual Report 2018-19
Statutory ReportsRallis India Limited
Sl. No.
Name andAddress of the Company
CIN/GLN Holding/Subsidiary/
Associate
% ofShares
Held
ApplicableSection
3. PT Metahelix Lifesciences Indonesia*JI. Batu Tulis Raya No. 17 PAV, Kel. Kebon, Kelapa, Kec. Gambir, Jakarta Pusat, Indonesia.
Not Applicable Subsidiary Company
65.77 2(87)(ii)
4. Zero Waste Agro Organics LimitedKapil Towers, First Floor, S. No. 40-1/B Near Sagam Bridge, Dr. Ambedkar Road, Pune - 411 001.
U01400PN2011PLC141307 Subsidiary Company
100 2(87)(ii)
5. Rallis Chemistry Exports Limited#
156/157 15th Floor Nariman Bhavan, 227 Nariman Point, Mumbai - 400 021.
U74990MH2009PLC193869 Subsidiary Company
100 2(87)(ii)
* Metahellix Life Sciences Limited is holding 65.77%
# Rallis Chemistry Exports Limited has made an application to the Registrar of Companies for removal of its name from the Register of Companies, for which approval is awaited
IV. SHAREHOLDING PATTERN (Equity Share Capital Breakup as percentage of Total Equity)
(i) Category-wise Shareholding
Category ofShareholders
No. of Shares held at the beginning of the year
No. of Shares held at the end of the year
%Changeduring
the yearDemat Physical Total % of
Total ShareDemat Physical Total % of
Total ShareA. Promoters (Including Promoter Group)(1) Indiana) Individual / HUF 0 0 0 0 0 0 0 0 0b) Central Govt. 0 0 0 0 0 0 0 0 0c) State Govt.(s) 0 0 0 0 0 0 0 0 0d) Bodies Corporate 9,74,16,610 0 9,74,16,610 50.09 9,74,16,610 0 9,74,16,610 50.09 0e) Banks / FI 0 0 0 0 0 0 0 0 0f ) Any Other… 0 0 0 0 0 0 0 0 0Sub-Total (A)(1): 9,74,16,610 0 9,74,16,610 50.09 9,74,16,610 0 9,74,16,610 50.09 0(2) Foreigna) NRIs – Individuals 0 0 0 0 0 0 0 0 0b) Other – Individuals 0 0 0 0 0 0 0 0 0c) Bodies Corporate 0 0 0 0 0 0 0 0 0d) Banks / FI 0 0 0 0 0 0 0 0 0e) Any Other… 0 0 0 0 0 0 0 0 0Sub-Total (A)(2): 0 0 0 0 0 0 0 0 0Total Shareholding ofPromoters (A)= (A)(1)+(A)(2)
9,74,16,610 0 9,74,16,610 50.09 9,74,16,610 0 9,74,16,610 50.09 0
B. Public Shareholding(1) Institutionsa) Mutual Funds 2,39,81,362 1,110 2,39,82,472 12.33 2,63,40,413 1,110 2,63,41,523 13.55 1.21b) Banks / FI 2,25,599 24,600 2,50,199 0.13 3,00,267 24,600 3,24,867 0.17 0.04c) Central Govt. 0 0 0 0 0 0 0 0 0d) State Govt.(s) 0 8,01,150 8,01,150 0.41 0 8,01,150 8,01,150 0.41 0e) Venture Capital Funds 0 0 0 0 0 0 0 0 0f ) Insurance Companies 1,00,66,834 0 1,00,66,834 5.18 1,09,12,523 0 1,09,12,523 5.61 0.43

63
Board’s Report
Category ofShareholders
No. of Shares held at the beginning of the year
No. of Shares held at the end of the year
%Changeduring
the yearDemat Physical Total % of
Total ShareDemat Physical Total % of
Total Share
g) FIIs 157 0 157 0 0 0 0 0 0
h) Foreign VentureCapital Funds
0 0 0 0 0 0 0 0 0
i) Others (specify)
i) Foreign Portfolio Investors (Corporate)
75,83,687 0 75,83,687 3.90 77,75,464 0 77,75,464 4.00 0.10
ii) Alternative Investment Funds
14,25,566 0 14,25,566 0.73 4,78,728 0 4,78,728 0.25 -0.49
Sub-Total (B)(1): 4,32,83,205 8,26,860 4,41,10,065 22.68 4,58,07,395 8,26,860 4,66,34,255 23.98 1.29
(2) Non-Institutions
a) Bodies Corporate
i) Indian 71,83,469 21,000 72,04,469 3.70 68,08,917 21,000 68,29,917 3.51 -0.19
ii) Overseas 0 0 0 0 0 0 0 0 0
b) Individuals
i) Individual Shareholders holding nominal share capital upto ` 1 lakh
2,30,64,839 10,63,170 2,41,28,009 12.41 2,19,70,307 9,12,085 2,28,82,392 11.77 -0.64
ii) Individual Shareholders holding nominal share capital in excess of ` 1 lakh
2,08,88,107 0 2,08,88,107 10.74 1,99,60,036 0 1,99,60,036 10.26 -0.48
c) Others (specify)
i) Trusts 56,328 0 56,328 0.03 16,000 0 16,000 0.01 -0.02
ii) IEPF Suspense A/c 6,65,302 0 6,65,302 0.34 7,29,680 0 7,29,680 0.38 0.04
Sub-Total (B)(2): 5,18,58,045 10,84,170 5,29,42,215 27.22 4,94,84,940 9,33,085 5,04,18,025 25.93 -1.29
Total Public Shareholding(B)=(B)(1)+(B)(2)
9,51,41,250 19,11,030 9,70,52,280 49.91 9,52,92,335 17,59,945 9,70,52,280 49.91 0.00
C. Shares held by Custodian for GDRs & ADRs
0 0 0 0 0 0 0 0 0
Grand Total (A+B+C) 19,25,57,860 19,11,030 19,44,68,890 100.00 19,27,08,945 17,59,945 19,44,68,890 100.00 0
(ii) Shareholding of Promoters (including Promoter Group)
SlNo.
Shareholder’sName
Shareholding at the beginning of the year
Shareholding at the end of the year
% Changein shareholding
duringthe year
No. of Shares
% of totalShares of the
Company
% of Sharespledged /
encumberedto total shares
No. ofShares
% of totalShares of the
Company
% of Sharespledged /
encumberedto total shares
1. Tata Chemicals Limited 9,73,41,610 50.06 0 9,73,41,610 50.06 0 0
2. Ewart Investments Limited* 75,000 0.04 0 75,000 0.04 0 0
Total 9,74,16,610 50.09 0 9,74,16,610 50.09 0 0
* Part of Promoter Group

64 | 71st Annual Report 2018-19
Statutory ReportsRallis India Limited
(iii) Change in Promoters’ (Including Promoter Group) Shareholding (please specify, if there is no change)
Sl.No.
Shareholding at the beginning of the year
Cumulative Shareholding during the year
No. of shares % of total shares of the Company
No. of shares % of total shares ofthe Company
1. Tata Chemicals Limited At the beginning of the year 9,73,41,610 50.06 9,73,41,610 50.06At the end of the year 9,73,41,610 50.06 9,73,41,610 50.06
2. Ewart Investments Limited*At the beginning of the year 75,000 0.04 75,000 0.04At the end of the year 75,000 0.04 75,000 0.04
* Part of Promoter GroupNote :There is no change in Shareholding of the Promoter including Promoter Group
(iv) Shareholding Pattern of top ten Shareholders (other than Directors, Promoters and Holders of GDRs and ADRs)
Sl. Name of shareholders Shareholding Cumulative Shareholding during the year
No. of Shares % of total shares of the Company
No. of Shares % of total shares of the Company
1. Rakesh JhunjhunwalaAt the beginning of the year 1,88,05,820 9.67 1,88,05,820 9.67Bought during the year 9,16,000 0.47 1,97,21,820 10.14Sold during the year (17,41,000) (0.89) 1,79,80,820 9.25At the end of the year 1,79,80,820 9.25 1,79,80,820 9.25
2. HDFC Life Insurance Company Limited (Formerly HDFC Standard Life Insurance Company Limited)At the beginning of the year 64,84,723 3.33 64,84,723 3.33Bought during the year 19,04,244 0.98 83,88,967 4.31Sold during the year (9,43,050) (0.48) 74,45,917 3.83At the end of the year 74,45,917 3.83 74,45,917 3.83
3. SBI Magnum Taxgain Scheme (various accounts)At the beginning of the year 25,00,000 1.29 25,00,000 1.29Bought during the year 31,44,397 1.61 56,44,397 2.90Sold during the year 0 0.00 56,44,397 2.90At the end of the year 56,44,397 2.90 56,44,397 2.90
4. Tata Mutual Fund (various accounts)At the beginning of the year 10,44,000 0.54 10,44,000 0.54Bought during the year 49,00,000 2.52 59,44,000 3.06Sold during the year (4,13,500) (0.22) 55,30,500 2.84At the end of the year 55,30,500 2.84 55,30,500 2.84
5. Franklin India Smaller Companies FundAt the beginning of the year 37,33,258 1.92 37,33,258 1.92Bought during the year 4,50,000 0.23 41,83,258 2.15Sold during the year 0 0.00 41,83,258 2.15At the end of the year 41,83,258 2.15 41,83,258 2.15
6. Sundaram Mutual Fund (various accounts)At the beginning of the year 27,92,498 1.44 27,92,498 1.44Bought during the year 1,87,457 0.09 29,79,955 1.53Sold during the year 0 0.00 29,79,955 1.53At the end of the year 29,79,955 1.53 29,79,955 1.53
7. ITPL - Invesco India (various accounts)At the beginning of the year 13,57,957 0.70 13,57,957 0.70Bought during the year 30,50,106 1.57 44,08,063 2.27Sold during the year (15,28,178) (0.79) 28,79,885 1.48At the end of the year 28,79,885 1.48 28,79,885 1.48

65
Board’s Report
Sl. Name of shareholders Shareholding Cumulative Shareholding during the year
No. of Shares % of total shares of the Company
No. of Shares % of total shares of the Company
8 Reliance Capital Trustee Company Limited-A/c Reliance Small Cap Fund
At the beginning of the year 0 0.00 0 0.00
Bought during the year 25,52,528 1.31 25,52,528 1.31
Sold during the year 0 0.00 25,52,528 1.31
At the end of the year 25,52,528 1.31 25,52,528 1.31
9 Ishares Core Emerging Markets Mauritius Company
At the beginning of the year 14,11,897 0.73 14,11,897 0.73
Bought during the year 4,19,235 0.21 18,31,132 0.94
Sold during the year (37,242) (0.02) 17,93,890 0.92
At the end of the year 17,93,890 0.92 17,93,890 0.92
10 Steinberg India Emerging Opportunities Fund Limited
At the beginning of the year 11,08,000 0.57 11,08,000 0.57
Bought during the year 4,92,000 0.25 16,00,000 0.82
Sold during the year 0 0.00 16,00,000 0.82
At the end of the year 16,00,000 0.82 16,00,000 0.82
11 Aditya Birla Sun Life Trustee Private Limited (various accounts)
At the beginning of the year 22,55,715 1.16 22,55,715 1.16
Bought during the year 84,000 0.04 23,39,715 1.20
Sold during the year (15,00,000) (0.77) 8,39,715 0.43
At the end of the year 8,39,715 0.43 8,39,715 0.43
12 ICICI Prudential Life Insurance Company Limited
At the beginning of the year 14,37,933 0.74 14,37,933 0.74
Bought during the year 0 0.00 14,37,933 0.74
Sold during the year (9,31,589) (0.48) 5,06,344 0.26
At the end of the year 5,06,344 0.26 5,06,344 0.26
13 ICICI Prudential (various accounts)
At the beginning of the year 37,15,970 1.91 37,15,970 1.91
Bought during the year 161 0.00 37,16,131 1.91
Sold during the year (33,33,521) (1.71) 3,82,610 0.20
At the end of the year 3,82,610 0.20 3,82,610 0.20
14 HDFC Trustee Company Limited (various accounts)
At the beginning of the year 54,38,673 2.80 54,38,673 2.80
Bought during the year 20,99,973 1.08 75,38,646 3.88
Sold during the year (75,38,645) (3.88) 1 0.00
At the end of the year 1 0.00 1 0.00
15 Avendus Enhanced Return Fund
At the beginning of the year 14,25,566 0.73 14,25,566 0.73
Bought during the year 3,13,251 0.16 17,38,817 0.89
Sold during the year (17,38,817) (0.89) 0 0.00
At the end of the year 0 0.00 0 0.00
Note :1) The above information is based on the weekly beneficiary position.2) The date wise increase/decrease in shareholding of the top 10 shareholders is available on the website of the Company at www.rallis.co.in
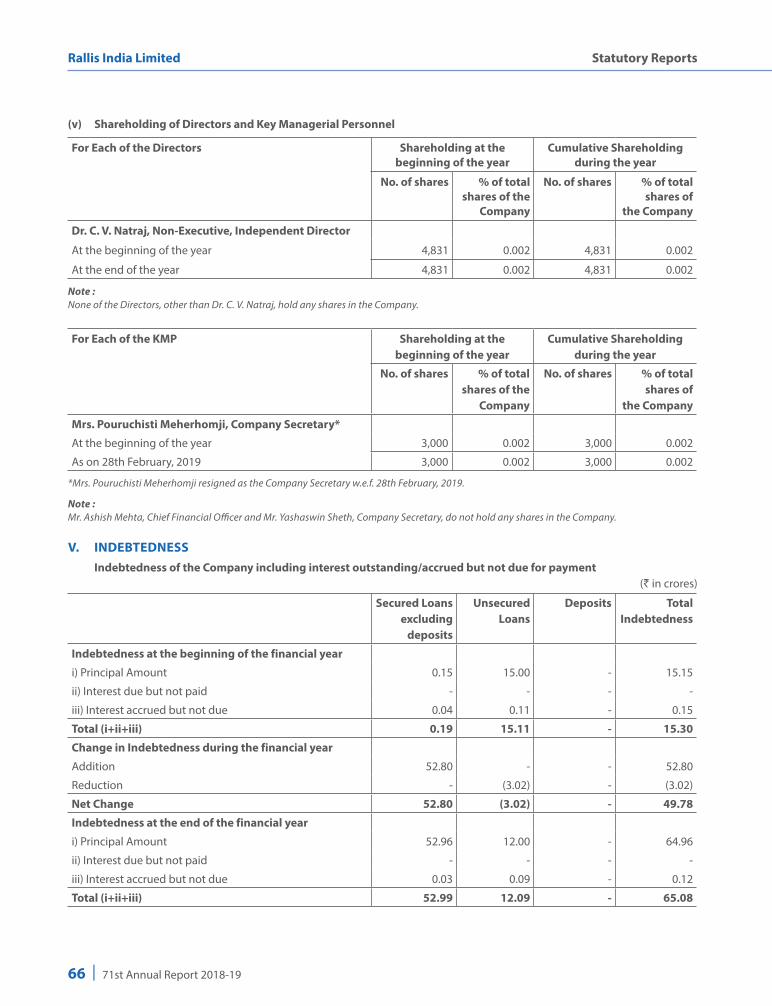
66 | 71st Annual Report 2018-19
Statutory ReportsRallis India Limited
(v) Shareholding of Directors and Key Managerial Personnel
For Each of the Directors Shareholding at the beginning of the year
Cumulative Shareholding during the year
No. of shares % of totalshares of the
Company
No. of shares % of total shares of
the Company
Dr. C. V. Natraj, Non-Executive, Independent Director
At the beginning of the year 4,831 0.002 4,831 0.002
At the end of the year 4,831 0.002 4,831 0.002
Note :None of the Directors, other than Dr. C. V. Natraj, hold any shares in the Company.
For Each of the KMP Shareholding at the beginning of the year
Cumulative Shareholding during the year
No. of shares % of totalshares of the
Company
No. of shares % of total shares of
the Company
Mrs. Pouruchisti Meherhomji, Company Secretary*
At the beginning of the year 3,000 0.002 3,000 0.002
As on 28th February, 2019 3,000 0.002 3,000 0.002
*Mrs. Pouruchisti Meherhomji resigned as the Company Secretary w.e.f. 28th February, 2019.
Note :Mr. Ashish Mehta, Chief Financial Officer and Mr. Yashaswin Sheth, Company Secretary, do not hold any shares in the Company.
V. INDEBTEDNESS Indebtedness of the Company including interest outstanding/accrued but not due for payment
(` in crores)
Secured Loansexcluding
deposits
UnsecuredLoans
Deposits TotalIndebtedness
Indebtedness at the beginning of the financial year
i) Principal Amount 0.15 15.00 - 15.15
ii) Interest due but not paid - - - -
iii) Interest accrued but not due 0.04 0.11 - 0.15
Total (i+ii+iii) 0.19 15.11 - 15.30
Change in Indebtedness during the financial year
Addition 52.80 - - 52.80
Reduction - (3.02) - (3.02)
Net Change 52.80 (3.02) - 49.78
Indebtedness at the end of the financial year
i) Principal Amount 52.96 12.00 - 64.96
ii) Interest due but not paid - - - -
iii) Interest accrued but not due 0.03 0.09 - 0.12
Total (i+ii+iii) 52.99 12.09 - 65.08

67
Board’s Report
VI. REMUNERATION OF DIRECTORS AND KEY MANAGERIAL PERSONNEL A. Remuneration to Managing Director, Whole-time Directors and/or Manager
Sl.No.
Particulars of Remuneration Mr. V. ShankarManaging Director & CEO
1 Gross Salary
(a) Salary as per provisions contained in Section 17(1) of the Income Tax Act, 1961 3,36,42,563*(b) Value of perquisites under Section 17(2) of the Income Tax Act, 1961 25,99,936(c) Profits in lieu of salary under Section 17(3) of the Income Tax Act, 1961 0
2 Stock Options 03 Sweat Equity 04 Commission
- as % of profit 0- others, specify. (Performance based) (Refer Note 2) 1,25,00,000
5. Others, please specify -
Total 4,87,42,499Ceiling as per the Act 9,73,70,326
* Amount includes retiral benefits paid
Note:1. Mr. R. Mukundan who was Managing Director & CEO from 3rd December, 2018 to 31st March, 2019 has not drawn any remuneration from the Company.2. Commission is for FY 2018-19, which will be paid during FY 2019-20.
B. Remuneration to other Directors 1. Independent Directors
Sl.No.
Particulars of Remuneration
Name of Directors TotalAmountDr. C. V.
NatrajMrs. Padmini Khare Kaicker
Mr. Prakash R. Rastogi
Dr. Y. S. P. Thorat
Dr. Punita Kumar-Sinha
1 Fee for attending Board/ Committee Meetings
3,40,000 3,00,000 4,60,000 3,80,000 2,20,000 17,00,000
2 Commission 25,00,000 28,00,000 28,00,000 30,00,000 20,00,000 1,31,00,0003 Others, please specify - - - - - -
Total (B1) 28,40,000 31,00,000 32,60,000 33,80,000 22,20,000 1,48,00,000
2. Other Non-Executive Directors
Sl.No.
Particulars of Remuneration
Name of Directors TotalAmountMr. Bhaskar Bhat Mr. R. Mukundan Mr. John Mulhall
1 Fee for attending Board/ Committee Meetings
3,00,000 ** ** 3,00,000
2 Commission * ** ** -3 Others, please specify - - - -
Total (B2) 3,00,000 - - 3,00,000Total Managerial Remuneration (B1) + (B2) 1,51,00,000Total Sitting Fees 20,00,000Total Commission 1,31,00,000Overall Ceiling as per the Act for payment of commission to Non-Executive Directors 1,94,74,065
* As per the internal guidelines, no payment is made towards commission to Mr. Bhaskar Bhat, Non-Executive Director of the Company, who is in full-time employment of other Tata Company.
** Mr. R. Mukundan and Mr. John Mulhall are in whole-time employment of Tata Chemicals Limited, the holding company, and draw remuneration from it.
Note: Commission is for FY 2018-19, which will be paid during FY 2019-20
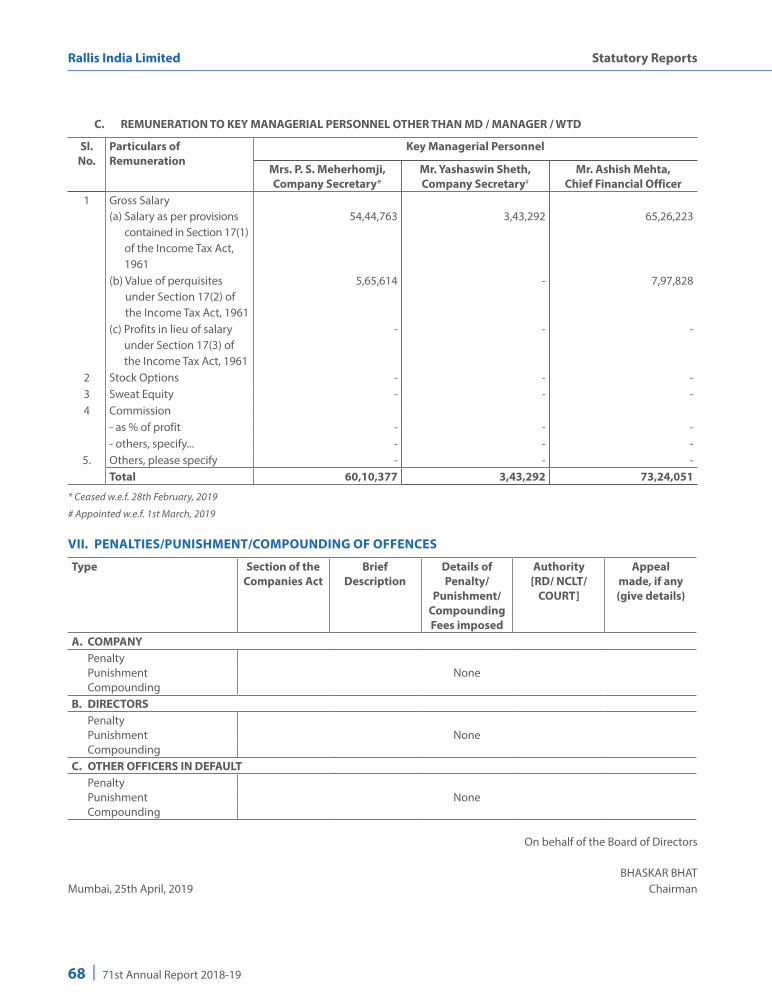
68 | 71st Annual Report 2018-19
Statutory ReportsRallis India Limited
C. REMUNERATION TO KEY MANAGERIAL PERSONNEL OTHER THAN MD / MANAGER / WTD
Sl.No.
Particulars of Remuneration
Key Managerial Personnel
Mrs. P. S. Meherhomji, Company Secretary*
Mr. Yashaswin Sheth, Company Secretary#
Mr. Ashish Mehta, Chief Financial Officer
1 Gross Salary(a) Salary as per provisions
contained in Section 17(1) of the Income Tax Act, 1961
54,44,763
3,43,292
65,26,223
(b) Value of perquisites under Section 17(2) of the Income Tax Act, 1961
5,65,614 - 7,97,828
(c) Profits in lieu of salary under Section 17(3) of the Income Tax Act, 1961
- - -
2 Stock Options - - -3 Sweat Equity - - -4 Commission
- as % of profit - - -- others, specify... - - -
5. Others, please specify - - -Total 60,10,377 3,43,292 73,24,051
* Ceased w.e.f. 28th February, 2019
# Appointed w.e.f. 1st March, 2019
VII. PENALTIES/PUNISHMENT/COMPOUNDING OF OFFENCES
Type Section of the Companies Act
BriefDescription
Details of Penalty/
Punishment/CompoundingFees imposed
Authority[RD/ NCLT/
COURT]
Appealmade, if any(give details)
A. COMPANYPenalty
NonePunishmentCompounding
B. DIRECTORSPenalty
NonePunishmentCompounding
C. OTHER OFFICERS IN DEFAULTPenalty
NonePunishmentCompounding
On behalf of the Board of Directors
BHASKAR BHATMumbai, 25th April, 2019 Chairman

69
Board’s Report
Annexure F to the Board’s Report[Pursuant to Section 134(3)(m) of The Companies Act, 2013 read with Rule 8(3) of The Companies (Accounts) Rules, 2014]
(A) CONSERVATION OF ENERGY
(i) Steps Taken or Impact on Conservation of Energy:
The Company has continued its efforts to improve energy efficiency with more vigor and depth. Steps taken during the year to conserve energy include:
• Plant lighting 125 W HPMV lamps replaced by 39 W LED lamp
• Plant separation and vessel lighting 60W GLS lamps replaced by 15 W LED lamp
• Energy efficient street lamp fixture replacement from 125 W to 60 W LED
• Energy efficient High Bay fixture by 250 W HPMV to 90 W LED lamps
• Installation of Solar panels for Green Building
• Installation of energy efficient dry vacuum system
• Replacement of reciprocating compressors by screw compressors
• Replacement of Energy Efficient Motor
The Company’s energy efficiency related efforts are acknowledged by the International Certification ISO-50001 on energy management for two of its Units i.e. Dahej and Ankleshwar. This is an exceptional achievement as far as chemical industries is concerned.
(ii) Steps taken by the Company for utilizing alternate sources of Energy:
As part of its long term sustainability plan, the Company has initiated various steps towards utilising alternate sources/renewable source of energy. Some of the key initiatives implemented by the Company are:
• Hot water generation by solar panel to start the process of production.
• Installation of solar power system for Admin Green Building at Ankleshwar.
• The Company has installed 4 MW solar power plant at its Unit in Dahej, Gujarat. The Unit got a rebate of 1,588 MWh/ annum in the financial year 2018-19 from the solar power plant.
• Expected reduction in carbon dioxide emission due to the 8 TPH Briquette fire boiler commissioned at Dahej SEZ Plant is approximately 9,456 MT on generation of 44,628 MT of steam, as compared to usage of furnace oil
(iii) Capital Investment on Energy Conservation Equipments:
Renewable energy and energy efficiency are seen as the “twin pillars” of a sustainable energy policy. The Company recognises that investment in energy conservation offers significant economic benefits in addition to climate change benefits. In the last few years, the Company has tried to improve energy efficiency significantly by investing in energy conservation equipment.
During the year, the Company has invested ` 2 crores as capital investment on energy conservation equipment, including among others, screw compressors for chilled water replacing reciprocating compressors, brine screw compressors, screw air compressor, solar street lights, high efficiency motor (IE3), installation of LED lighting, installation of solar power system for Admin Green Building, solar heaters etc.
(B) TECHNOLOGY ABSORPTION
(i) Efforts made towards Technology Absorption:
(a) A new type of formulation viz., ZC (mixed formulation of Capsule Suspension (CS) and Suspension Concentrate (SC) with two different active ingredients) is developed, where the skin irritant active ingredient is encapsulated in the formulation to reduce exposure to humans.
(b) Processes developed to achieve high purity of two active ingredients.
(c) Recommendations were obtained from State Agricultural University/Indian Council of Agricultural Research for three products on four crops for inclusion in the Package of Practices. This will help in participating in Government subsidy business.
(d) The Innovation Turnover Index (revenues from products newly introduced in the last four years) was around 10%.

70 | 71st Annual Report 2018-19
Statutory ReportsRallis India Limited
(ii) Benefits derived like product improvement, cost reduction, product development or import substitution:
(a) Continuous troubleshooting support from R&D to Dahej manufacturing unit in the commercialisation batches of NPI-II during the year to support production of 12-14 MT per month.
(b) Eleven products were registered in the international market. Sixteen registration dossiers were submitted in various international markets.
(c) Ten products were registered in India for the domestic/export market. Label claim expansion approval was obtained on two products on four crops. Nineteen dossiers were submitted under various categories of new registration.
(d) Dossier has been submitted to Central Insecticides Board and Registration Committee for leading products like Taqat on Wheat & Rice and Anant on Okra, Mango, Wheat, Mustard, Tomato, Brinjal, Tea, Potato & Citrus crops as label expansion.
(e) Product commercialized during FY 2018-19: OLIVER- A systemic post-emergent herbicide formulated using Haloxyfop-methyl into 10.5% EC is very effective against all major grassy weeds in Soybean.
(iii) In case of imported technology (imported during the last three years reckoned from the beginning of the financial year):
(a) the details of technology imported: The Company has not imported any technology during the last three financial years.
(b) the year of import: Not applicable
(c) whether the technology has been fully absorbed: Not applicable
(d) if not fully absorbed, areas where absorption has not taken place, and the reason thereof: Not applicable
(iv) Expenditure on R & D:(` in crores)
2018-19 2017-18Capital expenditure 1.25 0.66Revenue expenditure* 18.50 18.79
19.75 19.45Total R&D expenditure as a percentage of net sales (excluding excise duty)
1.18% 1.30%
* included in the above is an amount of ` 0.19 crore (Previous Year ` 0.21 crore) paid to an external agency.
(C) FOREIGN ExCHANGE EARNINGS AND OUTGOForeign Exchange earned in terms of actual inflows during the year and Foreign Exchange outgo during the year in terms of actual outflows:
(` in crores)
2018-19 2017-181. Foreign Exchange Earned 637.77 471.85
2. Outgo of Foreign Exchange 459.61 422.64
On behalf of the Board of Directors
BHASKAR BHATMumbai, 25th April, 2019 Chairman

71
Board’s Report
Annexure G to the Board’s Report[Pursuant to Rule 5 of The Companies (Appointment and Remuneration of Managerial Personnel) Rules, 2014]
Disclosure of Managerial Remuneration
A. Ratio of remuneration of each Director to the median remuneration of the employees of the Company for FY 2018-19 as well as the percentage increase in remuneration of each Director, Chief Financial Officer (CFO) and Company Secretary is as under:
Name of Director Ratio to median
remuneration
% increase in remuneration over previous
yearNon-Executive DirectorsMr. Bhaskar Bhat@ - -Mr. Prakash R Rastogi 4.3:1 12.2Dr. Y. S. P. Thorat 4.5:1 -13.4Dr. C. V. Natraj 3.8:1 -6.7Mrs. Padmini Khare Kaicker 4.1:1 -12.4Dr. Punita Kumar-Sinha 3.0:1 1.8Executive DirectorsMr. V. Shankar, Managing Director & CEO#
46.6:1 (14.63)
Key Managerial PersonnelMr. Ashish Mehta, Chief Financial Officer
- 5.7
Mrs. Pouruchisti Meherhomji,Company Secretary*
- **
Mr. Yashaswin Sheth, Company Secretary*
- **
* Part year
@ In line with the internal guidelines, no payment is made towards commission to Mr. Bhaskar Bhat, Non-Executive Director of the Company, since he is in full-time employment with other Tata company and hence not stated
# Excludes retiral benefits paid
** Since the remuneration is only for part of the year, the percentage increase in remuneration is not comparable and hence not stated
Note:
1. Remuneration includes sitting fees and commission for
Non-Executive Directors. Commission relates to the
financial year ended 31st March, 2019, which will be paid
during FY 2019-20.
2. Mr. R. Mukundan and Mr. John Mulhall being in the
whole-time employment of Tata Chemicals Limited, the
holding company, draw remuneration from it and hence the
above details are not applicable for them.
B. Percentage increase in the median remuneration of employees in the FY 2018-19: 7.78%
C. Number of permanent employees on the rolls of the Company as on 31st March, 2019: 1,001
D. Comparison of average percentile increase in salary of employees other than the managerial personnel and the percentile increase in the managerial remuneration:
% change in remuneration
Average increase in salary of employees (other than managerial personnel)
10.68
Average increase in remuneration of managerial personnel
(14.63)#
# Excluding retiral benefits paid
E. Affirmation:
It is affirmed that the remuneration paid to the Directors, Key Managerial Personnel and other employees is as per the Remuneration Policy of the Company.
On behalf of the Board of Directors
BHASKAR BHATMumbai, 25th April, 2019 Chairman

72 | 71st Annual Report 2018-19
Statutory ReportsRallis India Limited
Global ECoNoMYGlobal economic growth is estimated at 3.6% in 2018 compared to 3.8% in 2017. The year started off strongly driven by economic acceleration gained in 2017, however weaker performance in some countries, notably Europe and Asia impacted growth in the second half. Factors like weakening financial market sentiment, trade policy uncertainties, credit policy tightening and concerns over China’s outlook weighed down momentum.
outlook
Global growth is projected to decline to 3.3% in 2019, before picking up slightly to 3.6% in 2020. Growth in advanced economies is projected to slow from an estimated 2.2% in 2018 to 1.8% in 2019 and further to 1.7% in 2020, mostly due to downward revision in the Euro area and subsiding impact of US fiscal stimulus. Growth in the Euro area is estimated to moderate from 1.8% in 2018 to 1.3% in 2019 and 1.5% in 2020, while that in the US from 2.9% to 2.3% and 1.9% in the same period. Growth rates have been marked down for many economies. Germany is likely to be impacted by weak private consumption, industrial production and foreign demand, Italy by weak domestic demand and higher borrowing costs and France by negative impact of street protests and industrial action.
Growth in Emerging and Developing Asia is likely to dip from 6.4% in 2018 to 6.3% in both 2019 and 2020. Despite fiscal stimulus that partially offsets the impact of higher US tariffs, China’s economy is expected to slow
Management Discussion and Analysis
down due to financial regulatory tightening and trade tensions with the US. However, India’s economy is poised to pick up in 2019, benefiting from lower oil prices and a slower pace of monetary tightening, as inflation pressure eases. (Source: International Monetary Fund World Economic Outlook, April 2019)
World Economic outlook
World output Advanced economies Emerging Market and Developing Economies
P - Projection
3.8% 3.6% 3.3% 3.6%
2.4% 2.2%1.8% 1.7%
4.8% 4.5% 4.4%4.8%
2017 2018 2019 (P) 2020 (P)
(Source: IMF World Economic Outlook, April 2019)
Impact of climatic conditions on global agriculture
The year 2018 became the fourth warmest on record since 1880, according to an independent analysis by NASA and the National Oceanic and Atmospheric Administration. Preliminary data indicated that 2018 global temperatures were 0.79O Celsius above the 20th century average. The warming was largely driven by increased emissions of carbon dioxide and other greenhouse gases into the atmosphere caused by human activities. National Centers for Environmental Information data indicated that 2018 was also

73
Management Discussion and Analysis
the 42nd consecutive year of above average global land and sea surface temperatures.
Unfavourable weather for crops in key growing regions adversely impacted crop production and yield. According to the Grain Market Report by the International Grains Council, global grains production is estimated to have fallen by 17 Million Tonnes (‘MT’) in Financial Year (‘FY’) 2018-19 to a three-year low of 2,125 MT. This decline was because a higher maize output had been outweighed by declines for other crops.
spending and corporate fundamentals. Despite external vulnerabilities in the form of high oil prices, trade tensions between major global trading partners and the US monetary tightening, the Indian economy remained resilient. The World Bank estimated the Indian economy to grow by 7.2% in FY 2018-19.
outlook
Globally, analysts and agencies have a consensus that Indian economy will continue to outperform amidst global gloom, albeit at a slower pace. As per the International Monetory Fund (‘IMF’), the Indian economy is likely to accelerate moderately and grow by 7.3% in FY 2019-20 compared to its earlier projection of 7.5%. To support the growth momentum, the Reserve Bank of India is taking the necessary steps to maintain financial stability and to facilitate enabling conditions for sustainable and robust growth. It has already taken back-to-back rate cuts of 25 basis points, resulting in repo rate declining to 6%.
As per the Confederation of Indian Industry (‘CII’), the positive outlook in India is supported by better demand conditions, settled GST implementation, capacity expansion from growing investments in infrastructure, continuing positive effects of reform policies and improved credit offtake. The industry body observed that despite 2018 being filled with external vulnerabilities arising out of rising oil prices, trade wars between major global trading partners and US monetary tightening, the Indian economy outshined. Various measures of the Government under “Make in India” and other similar initiatives have begun showing positive results.
Global Food Grains statistics (In Million Tonnes)
Production Consumption Trade Carryover Stocks
2,187
2,125
2,175
2,126
2,1532,170
2,204369
575604368
648
367
659
353
2016-17 2017-18(Estimated)
2018-19 (Forecast)
2019-20 (Projection)
(Source: International Grains Council)
2,142
INdIaN ECoNoMY
While the global economy is battling headwinds, India continues to be one of the fastest growing major economies in the world in FY 2018-19, driven by strong household

74 | 71st Annual Report 2018-19
Statutory ReportsRallis India Limited
Impact of Climatic Changes on agricultural Production
As per the India Meteorological Department (IMD), 2018 was the sixth warmest year on record in India with patchy monsoon and average temperature being significantly above normal. The rainfall during the annual monsoon season was less than the original forecast at 91% of the long-term average. Nearly 50% of India’s cultivable farm area is dependent on the monsoon, making it lifeline of the country’s rural economy and agriculture sector. However, most major crops producing states witnessed normal monsoon rainfall, hence the production of food grains for FY 2018-19 is higher.
As per the 2nd Advance Estimates released by the Department of Agriculture, Cooperation and Farmers Welfare, the total food grains production in India is estimated to be 281.37 MT in FY 2018-19, despite deficit rains. This is higher than the 277.49 MT (as per 2nd advance estimate) harvested by India in FY 2017-18 crop year and the previous five years’ average (FY 2013-14 to FY 2017-18) production of food grains by 15.63 MT.
Production of rice, the main cereal crop, in FY 2018-19 despite a dismal performance of the monsoon witnessed an output at 115.60 MT. This is on account of a substantial increase in production during the kharif season. However, the production of other cereals is set for a decline, mainly on account of deficit rainfall triggering drought conditions across many states.
Food Grains Production in India (In MT)
Crop FY 2018-19 FY 2017-18 FY 2016-17
Cereals 257.35 253.54 251.98
Pulses 24.02 23.95 23.13
Food grains 281.37 277.49 275.11
Oilseeds (lakh tonnes) 315.02 298.82 312.76
Cotton (lakh bales of 180 kgs)
325.77 339.15 300.87
(Source: Second Advance Estimates by the Government)
However, increasing crop production has impacted prices and, in turn, affected farmers’ income.
A number of measures and policies have been introduced by the Government. The pro-farmer policies will help the cultivators attain higher levels of agricultural produce and enable a structured income support for them. Agriculture’s role in the process of economic growth in India is unprecedented. Agriculture, with its allied sectors, is the largest source of livelihood in India. Advancement in agriculture and allied sectors is positive for inclusive economic growth at the national level. India is the largest producer, consumer and importer of pulses in the world. As farmers find themselves in a more comfortable situation, the agriculture sector will gather further momentum.
INdUSTRY oVERVIEW
Agriculture inputs play a decisive role in enhancing crop production. With arable land declining, production of crops can only be increased by using quality inputs through a scaled-up country-wide effort. Concerted efforts
Monthly monsoon season rainfall in India
Rainfall (mm) Rainfall (% of LPA)
155.3
241.4
132.4
June July August September
(Source: Indian Meteorological Department)
272.4 76%
92%94%95%
Season (June to September) rainfall in India
Rainfall (mm) Rainfall (% of LPA)
804911.3
1,087.5
All India Northwest India
Central India
South Peninsula
East & Northeast India
(Source: Indian Meteorological Department)
603.2
76%
98%98%91%
704.4
93%
Indian Economic outlook
Real GDP Consumer prices Current account balance as a % of GDP
P - Projection
(Source: IMF World Economic Outlook, April 2019)
7.2% 7.3% 7.5%
3.6% 3.5% 3.9% 4.2%
-2.4%-2.5%-2.5%-1.8%
7.1%
2017 2018 2019 (P) 2020 (P)

75
Management Discussion and Analysis
are being taken to transform agriculture, improve farm productivity and farmer prosperity, achieve food security and environmental sustainability.
Segments of agriculture Inputs Industry
Seeds Irrigation Fertilisers and Plant Nutrients
Crop Protection
Seeds Industry
The global seed market continues to expand, as the demand for food will grow unabated in the backdrop of world population anticipated to reach 10 billion by 2050. One of the major trends, which has influenced the seed market worldwide, is the significant shift in farming practices. Farmers are increasingly buying commercially-produced enhanced seed varieties, as against using seeds from the last harvest due to advantages of higher yield, improved nutritional quality, reduced crop damage and better disease resistance.
India has a vibrant seed market with an estimated value of US$ 2.5 billion (US$ 1.5 billion hybrid seed and US$ 1 billion Open Pollinated Variety). The industry has undergone significant restructuring due to implementation of progressive policies by the Government. Heightened support from the Centre and rapid advancements in seed technology, have strengthened the Indian seed industry in the areas of R&D, product development, supply chain management and quality assurance. Supporting regulatory mechanism can aid faster adoption of globally successful seed technology to address multiple challenges of farm productivity and catapult seed industry in India to a new orbit.
Growing food grain production, rate of replacement and increasing government investments in agriculture are augmenting the demand for seeds in India. This is compounded by rising disposable incomes, commercialisation of agriculture and growing awareness among farmers regarding the use of certified seeds.
Cotton holds the maximum share of revenue among row crops. The large-scale adoption of BT cotton seed in India has been the driving force behind the share of cotton increasing cultivation. Vegetables and maize also witness high hybridisation and seed replacement rates, and have a higher share.
FY 2018-19 has been a challenging year for the seeds sector. While the overall rainfall was near the long-term average, the issue was uneven distribution and timing. Poor rainfall during key cropping periods in both Kharif and Rabi seasons led to cropping pattern change and hence impacted demand.
Another challenge for the industry players was the tightening regulation on co-marketing of branded cotton seeds in certain states.
Irrigation industry
Irrigation is an area of major concern globally driven by depleting water levels and uneven rainfall due to climate change. With about 20% of global agricultural area irrigated, there is a growing demand for mechanised irrigation systems that can address farm water needs, while minimising consumption. Strong support from Governments globally, higher returns on investments compared to alternatives, water usage efficiency are further driving increasing adoption of such systems. As per a report by Transparency Market Research (TMR), the global mechanised irrigation systems market is expected to increase at a CAGR of 14.9% during 2016-2024 and that of micro irrigation systems market at a CAGR of 15.3% during 2017-23. Solutions like sprinkler and drip irrigation systems are likely to drive the segment. (Source: Globe Newswire)
In India too, where less than half of the net sown area is irrigated, the need for irrigation solutions is imminent. The Government in a bid to double farmers income has laid special focus on irrigation. Under its Pradhan Mantri Krishi Sinchayee Yojana (PMKSY), the Government has made an outlay of ` 50,000 crores for a five-year period (FY 2015-16 to FY 2019-20). The scheme focuses on convergence of investments in irrigation at the field level, expanding irrigated cultivable area, improving on-farm water use efficiency, and enhancing the adoption of precision irrigation and other technologies (Per drop, More crop). (Source: Globe Newswire)
Plant Nutrient Industry
Fertilizers are important for maximising yields and improving fertility and have played a key role in the success of India’s green revolution and subsequent self-reliance in food grain production. As per a report by Mordor Intelligence, the global fertilizer market is expected to expand at a CAGR of 3.8% during 2019-2024 to become a US$ 188.1 billion industry. This growth is likely to be triggered by the need to increase crop production to meet the growing demand for food. (Source: Mordor Intelligence, Industry Report)
76 | 71st Annual Report 2018-19
Statutory ReportsRallis India Limited
India has retained its position as the world’s second largest consumer of fertilizers. The Indian fertilizer market was valued at ` 4,675 billion in 2017 and is projected to reach ` 9,987 billion by 2023, at a CAGR of around 13% during 2018-2023. (Source: IMARC Group)
The Bio-stimulants market in India is projected to witness a CAGR of 16.49% to reach a total market size of US$ 181 million by 2023, increasing from US$ 72 million in 2017 (Source: Business Wire). These are materials with an organic base which are used throughout the lifecycle of the crops, helping increase crop yield, bring in efficiencies in water consumption and overall, enhance crop quality.
Micro-nutrients are plant growth nutrients and they play a crucial role in balanced crop nutrition. Non-availability of micro-nutrients inhibits the critical functions of the crop, leading to abnormality, slow growth and reduced yield. The micro-nutrient market in India is currently pegged at ` 19 billion, and is expected to grow at 8%-9% CAGR, going ahead.
As per ICRA report, the industry continues to face legacy issues of subsidy budgeting resulting in large backlogs. Though Government initiatives of Special Banking arrangements are providing temporary relief in the form of subsidised interest costs, in the long term, the industry sales are likely to grow between 2%-4% annually. (Source: Economic Times)
Crop Protection industry
Crop protection chemicals play a major role in increasing agriculture productivity. They help in minimising plant diseases, weeds, and other pests that damage agriculture crops, and thus increasing and maintaining year-on-year crop yield. Around 25% of the global crop output is lost due to attacks by pests, weeds and diseases. The global crop protection industry, which reached a value of US$ 57.7 billion in 2017, is expected to reach US$ 77.3 billion by 2023, exhibiting 5.3% CAGR during 2018-2023. (Source: Mena Fn, IMARC Group)
India is the 4th largest producer of agrochemicals, after the US, Japan and China. As per a Report published by Federation of Indian Chambers of Commerce and Industry (‘FICCI’) titled Indian Agrochemical Industry, July 2018, the industry is valued at US$ 4.1 billion, and likely to grow at 8.3% CAGR to touch US$ 8.1 billion by FY 2024-25. In India, better timing and spatial distribution of rainfall, higher pest incidence, and steps by the Government to improve farm income are expected to increase the application of agrochemicals. The industry faces several
challenges due to strict environmental regulations. Crop protection comprises of insecticides, fungicides, herbicides and bio-pesticides. India’s pesticides consumption is currently one of the lowest in the world among other economies. Its per hectare consumption stands at 0.6 Kg, compared to US (5-7 Kg/ha) and Japan (11-12 Kg/ha). In India, paddy accounts for the maximum share of pesticide consumption at around 26%-28%, followed by cotton at 18%-20%.
India is the fifth largest exporter of pesticides, with most of the exports being off-patent products. Exports of pesticides are likely to grow at a CAGR of 8.6% and reach US$ 4.2 billion by FY 2024-25. Low-cost manufacturing, availability of technically trained manpower, seasonal domestic demand, overcapacity, better price realisation globally and strong presence in generic pesticide manufacturing are the key factors driving growth in India. (Source: FICCI & CARE Ratings Report)
In FY 2018-19, the Indian crop protection chemical industry witnessed several challenges. Uneven distribution of rainfall and its skewness in certain regions led to a significant change in the pest load factor, impacting its consumption. In Rabi season, significant rainfall during beginning of cropping period led to a decline in pest infestation. The industry further faced the challenge of fluctuation in the prices of raw materials as supply got impacted due to operational issues in China led by environmental crackdown. In India, regulatory issues like label claim, co-marketing, and restriction and banning of products in Maharashtra, Punjab and Haryana impacted demand.
Despite this, the opportunities for the Indian market are increasing with China shutting down capacities and with agrochemicals valuing US$ 2.9 billion going off-patent between 2017-2020. Moreover, educating farmers about the advantages of pesticides and its safe usage is projected to increase demand for pesticides in the country. Growth is expected to be largely driven by export demand, which is expected to grow by 15%-16% per annum. Tropical climatic conditions and high production of paddy, cotton, sugarcane and other cereals in India will drive consumption of insecticides. The Government is looking to double farmers’ income by 2022 and working towards addressing their unmet needs across the agri-value chain augurs well for India’s crop protection industry.
CoMPaNY oVERVIEW With a legacy of 168 years, Rallis has carved a niche for itself with its innovations and R&D capabilities, and is

77
Management Discussion and Analysis
today well established as a responsible player in the agriculture inputs industry.
From being just an pesticides player, the Company has widened its portfolio by diversifying across the agriculture value chain – ranging from plant protection chemicals to hybrid seeds, plant growth nutrients and soil conditioners. The Company has manufacturing facilities at four sites: Ankleshwar and Dahej in Gujarat; and Lote and Akola in Maharashtra. All these are modern facilities in terms of technical knowhow and practices. Its business is supported by the Rallis Innovation Chemistry Hub (RICH), which is focused on product development and process chemistry to bring the latest crop health products to the farmers.
The Company’s operations are divided into domestic and international business. The domestic business focuses on enhancing farm productivity and farmer income across India. For this, the Company associates with farmers at each stage of the farming cycle by providing quality seeds, plant growth nutrients and agrochemicals, thus ensuring an integrated crop management system. It also engages in safety awareness campaigns “You are Safe” on usage of crop protection by farmers and channel partners. The Company also helps farmers improve their farming practices through various hand-hold approaches.
On the international business front, the Company manufactures and markets technical-grade crop care and branded formulation either directly or through alliances. The Company also leverages its knowledge in process chemistry to undertake contract manufacturing activities in the areas of agro chemicals and polymers, for leading global companies. It is a preferred partner owing to its execution capabilities, low-cost advantage, customer relationship management and reliability in terms of quality and supply.
aGRI SolUTIoNSThe Company is aligned with the Government’s mission to provide food security and drive farm productivity, with the aim of empowering farmers and increasing their incomes. Over the years, with sustainability at the core of its operations, it has consciously looked beyond manufacturing to expand its offerings and deliver value to farmers including agronomic advice and knowledge of best practices to enable farmers enhance the yield and their net incomes.
The Company offers several solutions in its agri services portfolio which include successful initiatives of GeoGreen and MoPu (More Pulses). Under GeoGreen, the Company
facilitated its organic manure product to farmers and with proper knowledge of usage for enhancing soil health which found immense acceptance as they witnessed improved yield. Under the MoPu initiative, the Company works with several state agencies to provide training, package of practice and scientific information to enable farmer enhance pulses production. MoPu is now operational in the states of Madhya Pradesh and Maharashtra. Rallis Samrudh Krishi® (RSK) initiative, brings to the farmers the latest farm technology and practices, while focusing on nurturing safety and protecting the environment. It facilitates farmers increase the yield through better quality and lower costs, optimise their resources to increase farm productivity sustainably, thereby creating value for them. Through RSK and its digital interventions, the Company supported farmers by helping them take informed decisions on various aspects of crop management. Digitalisation facilitates the Company in generating real-time data and predictive analysis and enables constant improvements in Good Agricultural Practices (GAP).
Key Enablers for a digitally Enabled RSK:
The Company in line with its strategy of helping farmers enhance their prosperity using technology is leveraging the RSK platform. The intent of the initiative is to provide right application and information to internal (sales and marketing teams) and external customers (farmers, channel partners and vendors) to achieve wider reach and greater impact. Various digital initiatives executed under the program include:
Drishti: One of the most critical needs of the farming community is the availability of predictive advisory services. Through its digital platform Drishti, the Company aims at providing customised and predictive advisory services to the farmers from rain-fed areas. It supplies the farmers with reliable information on weather, soil condition, crop health, and pest attacks, among others. This enables them to take informed decisions and ensure higher productivity.
Rallis Krishi Samadhan is a mobile app launched to provide the farming community pre-harvest and post-harvest related information including package of practice, weather information, mandi information, complaint/query resolution, and personalised advisory through farm visits. The app allows farmers to gain direct access to the Company’s helpline for resolution of their problems. The service is currently available in 11 regional languages which increases the reach.

78 | 71st Annual Report 2018-19
Statutory ReportsRallis India Limited
Sampark is a mobile app for the frontline workforce aimed at ensuring better engagement with farmers, better visibility and insight gathering. The app improves the productivity of the Company’s field-force by facilitating data collection and ensuring digital farmer engagement by crop advisors.
bUSINESS oVERVIEW FY 2018-19 was a challenging year for the Company. While the total income grew by 11%, margins were under pressure. The growth was largely driven by strong performance of the international business led by fructification in new registrations and retention of existing accounts due to strong customer relationship management which enhanced the overall sales.
In the domestic business, difficult weather conditions impacted crop shift pattern and pest load factor leading to subdued performance. The business was further impacted by surge in raw material prices, working capital management and debtor collections issues. To address these issues, the Company has devised a working capital management strategy with strong focus on domestic debtor management. The Company has also entered into strategic partnership with financing companies for channel partner financing. This will enable it to grow business and improve working capital position. The crop protection business of the Company was impacted by lower pest loads in both Kharif and Rabi season. Monsoon-proofing continues to be a key strategy for the Company to reduce influences of climatic conditions.
Though the Company’s performance was impacted due to business and environmental conditions, it sees demand significantly increasing in the coming years. This will be more so in the international business where the Company is gaining new registrations and strengthening its geographic presence. To capitalise on this, the Company over the next 5-6 years has planned a total capex of ` 800 crores to expand formulation capacities, new active ingredients as well as adding intermediates capacity for backward integration. This will enable it to cater to the growing demand and reduce dependencies on imports. The Company’s new products introduced in the previous years have witnessed good response. The focus will be on strengthening its marketing and distribution to grow volumes.
During the year, the Company has created a strong pipeline of products by leveraging its R&D and its technical alliances with other partners.
Besides, the Company took several key initiatives to strengthen its market position. It bolstered its distributor network across the key growth markets and also worked towards increasing the number of channel partners with the aim of getting closer to the farming community.
The Company’s seeds business is one of the fastest growing segments with a significant room for expansion. However, with both the Company and its subsidiary, Metahelix Life Sciences Limited (‘Metahelix’), having operational seeds business there were newly emerging regulatory challenges related to co-marketing and some overlap presenting scope for optimising. Focused on this objective, the Company’s Board of Directors have taken the strategic decision of discontinuing its seeds business. Henceforth, the seeds operations shall be completely handled by Metahelix, whose strong portfolio and brand connect will benefit the Company to grow the seeds business with focused approach and optimal utilisation of resources. During the year under review, the Board has further accorded its approval for merger of Metahelix with the Company subject to necessary regulatory and statutory approvals.
Moving ahead, the Company remains poised to implement key initiatives across functions to enable itself to face market challenges and leverage the emerging opportunities. It remains focused on improving revenue growth and profitability, driven by high growth segments such as seeds and nutrients.
REVIEW oF FINaNCIal PERFoRMaNCEStandalone performance for the year ended 31st March, 2019analysis of the Standalone Profit and loss statement
(` crores)
Particulars FY 2018-19 FY 2017-18 % change
Revenue from operations (net)
1,672 1,516 10%
Other income 26 9 188%
Cost of materials consumed
1,016 885 15%
Power and fuel 62 53 17%
Freight, handling and packing
58 59 -1%
Employee benefits expenses
138 126 10%
Depreciation and amortisation expenses
39 41 -3%
Finance costs 5 3 48%
EBITDA 206 226 -9%
Profit after Tax 129 141 -9%

79
Management Discussion and Analysis
Income
The total income of the Company increased 11% from ` 1,525 crores in FY 2017-18 to ` 1,697 crores in FY 2018-19. It comprises revenue from operations and other income.
Revenue from operations increased by 10% from ` 1,516 crores in FY 2017-18 to ` 1,672 crores in FY 2018-19. This growth has been primarily due to strong momentum achieved in the international business where the Company received new product registrations, enhanced business with existing clients and added new ones. Other income increased by 188% from ` 9 crores in FY 2017-18 to ` 26 crores in FY 2018-19. Other income includes ` 13 crores for export incentives which in the earlier period were reported under “Other Operating Revenue” in the Statement of Profit and Loss. This has no impact on reported Profit Before Tax (‘PBT’).
Expenses
The Company’s total expenses increased by 13% from ` 1,334 crores in FY 2017-18 to ` 1,509 crores in FY 2018-19. Major expense items of the Company comprise cost of materials consumed, purchase of stock-in-trade, power and fuel, freight, handling and packing, employee benefits expenses, depreciation and amortisation expenses and finance costs.
Cost of materials consumed increased by 15% from ` 885 crores in FY 2017-18 to ` 1,016 crores in FY 2018-19 owing to increase in major raw material prices like DMPAT/Triazinone/ DEK/4Nox/ Pexi etc.
Power and fuel expenses increased by 17% from ` 53 crores in FY 2017-18 to ` 62 crores in FY 2018-19, largely due to increase in prices of utilities.
Freight, handling and packaging expenses decreased by 1% from ` 59 crores in FY 2017-18 to ` 58 crores in FY 2018-19. Hence, no major variance in freight, handling and packing expenses.
Employee benefit expenses increased by 10% from ` 126 crores in FY 2017-18 to ` 138 crores in FY 2018-19 owing to Director retiral benefits amounting to ` 7.2 crores, with balance increase coming from annual increment and new recruitment.
Depreciation and amortisation expenses decreased by 3% from ` 41 crores in FY 2017-18 to ` 39 crores in FY 2018-19.
Finance costs increased by 48% from ` 3 crores in FY 2017-18 to ` 5 crores. Domestic business witnessed slow collection resulting into working capital loan utilisation and resulted into higher finance cost.
Profitability
The Company’s profitability was under pressure during the year due to continuing increase in imported raw material cost as a result of closure of many units in China due to environmental issues. The price increase was not in sync with cost increase and this eroded margins. Further, one time donation to electoral fund of ` 5 crores and provision for Director’s retiral benefits of ` 7.2 crores overall impacted the margins. EBITDA decreased by 9% from ` 226 crores in FY 2017-18 to ` 206 crores in FY 2018-19. EBITDA margins reduced by 258 basis points from 15% in FY 2017-18 to 12% in FY 2018-19. PAT decreased by 9% from ` 141 crores in FY 2017-18 to ` 129 crores in FY 2018-19. PAT margins decreased 162 basis points from 9% in FY 2017-18 to 8% in FY 2018-19.
analysis of the standalone balance Sheet
Non-current assets
(` crores)
Particulars 31st March, 2019
31st March, 2018
% Change
Property, plant and equipment
349 343 2%
Capital work-in-progress 13 12 6%
Investment property 6 6 -1%
Other intangible assets 3 3 16%
Intangible assets under development
12 13 -6%
Financial assets
(i) Investments 310 310 0%
(ii) Loans 5 4 26%
(iii) Other financial assets - 1 -64%
Income-tax assets (net) 62 63 -1%
Other non-current assets 32 33 -3%
Total non-current assets 790 785 1%
Non-current assets of the Company increased by 1% from ` 785 crores as on 31st March, 2018 to ` 790 crores as on 31st March, 2019. The increase was owing to normal additions in property, plant and equipment.
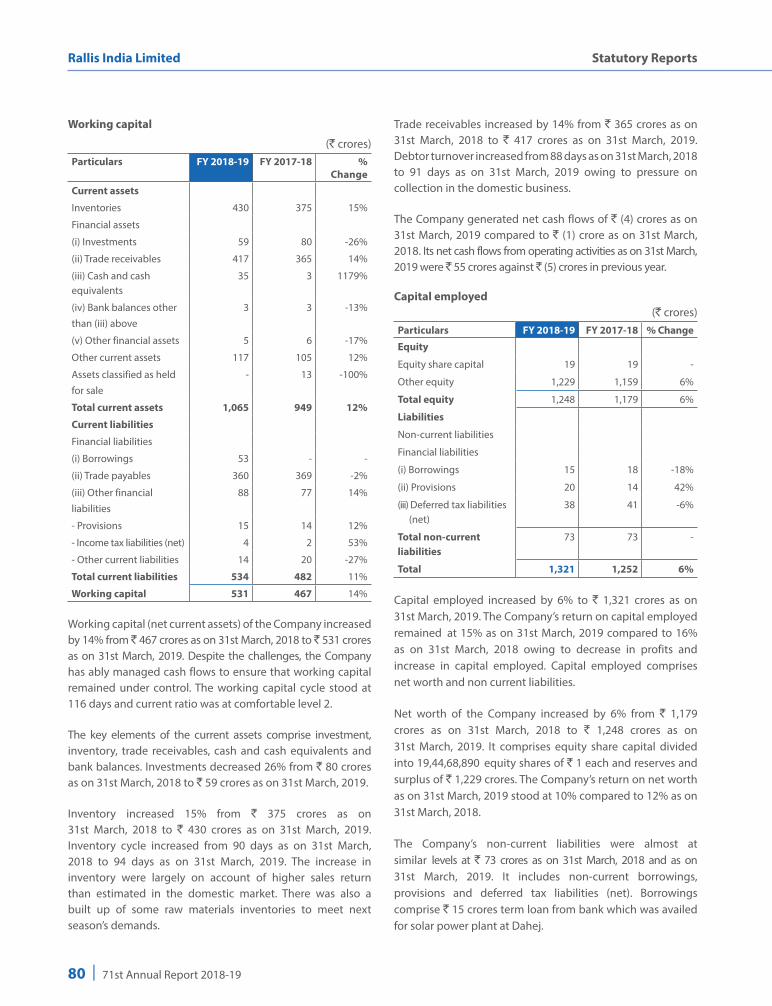
80 | 71st Annual Report 2018-19
Statutory ReportsRallis India Limited
Working capital
(` crores)Particulars FY 2018-19 FY 2017-18 %
ChangeCurrent assets
Inventories 430 375 15%
Financial assets
(i) Investments 59 80 -26%
(ii) Trade receivables 417 365 14%
(iii) Cash and cash equivalents
35 3 1179%
(iv) Bank balances other than (iii) above
3 3 -13%
(v) Other financial assets 5 6 -17%
Other current assets 117 105 12%
Assets classified as held for sale
- 13 -100%
Total current assets 1,065 949 12%
Current liabilities
Financial liabilities
(i) Borrowings 53 - -
(ii) Trade payables 360 369 -2%
(iii) Other financial liabilities
88 77 14%
- Provisions 15 14 12%
- Income tax liabilities (net) 4 2 53%
- Other current liabilities 14 20 -27%
Total current liabilities 534 482 11%
Working capital 531 467 14%
Working capital (net current assets) of the Company increased by 14% from ` 467 crores as on 31st March, 2018 to ` 531 crores as on 31st March, 2019. Despite the challenges, the Company has ably managed cash flows to ensure that working capital remained under control. The working capital cycle stood at 116 days and current ratio was at comfortable level 2.
The key elements of the current assets comprise investment, inventory, trade receivables, cash and cash equivalents and bank balances. Investments decreased 26% from ` 80 crores as on 31st March, 2018 to ` 59 crores as on 31st March, 2019.
Inventory increased 15% from ` 375 crores as on 31st March, 2018 to ` 430 crores as on 31st March, 2019. Inventory cycle increased from 90 days as on 31st March, 2018 to 94 days as on 31st March, 2019. The increase in inventory were largely on account of higher sales return than estimated in the domestic market. There was also a built up of some raw materials inventories to meet next season’s demands.
Trade receivables increased by 14% from ` 365 crores as on 31st March, 2018 to ` 417 crores as on 31st March, 2019. Debtor turnover increased from 88 days as on 31st March, 2018 to 91 days as on 31st March, 2019 owing to pressure on collection in the domestic business.
The Company generated net cash flows of ` (4) crores as on 31st March, 2019 compared to ` (1) crore as on 31st March, 2018. Its net cash flows from operating activities as on 31st March, 2019 were ` 55 crores against ` (5) crores in previous year.
Capital employed (` crores)
Particulars FY 2018-19 FY 2017-18 % Change
Equity
Equity share capital 19 19 -
Other equity 1,229 1,159 6%
Total equity 1,248 1,179 6%
liabilities
Non-current liabilities
Financial liabilities
(i) Borrowings 15 18 -18%
(ii) Provisions 20 14 42%
(iii) Deferred tax liabilities (net)
38 41 -6%
Total non-current liabilities
73 73 -
Total 1,321 1,252 6%
Capital employed increased by 6% to ` 1,321 crores as on 31st March, 2019. The Company’s return on capital employed remained at 15% as on 31st March, 2019 compared to 16% as on 31st March, 2018 owing to decrease in profits and increase in capital employed. Capital employed comprises net worth and non current liabilities.
Net worth of the Company increased by 6% from ` 1,179 crores as on 31st March, 2018 to ` 1,248 crores as on 31st March, 2019. It comprises equity share capital divided into 19,44,68,890 equity shares of ` 1 each and reserves and surplus of ` 1,229 crores. The Company’s return on net worth as on 31st March, 2019 stood at 10% compared to 12% as on 31st March, 2018.
The Company’s non-current liabilities were almost at similar levels at ̀ 73 crores as on 31st March, 2018 and as on 31st March, 2019. It includes non-current borrowings, provisions and deferred tax liabilities (net). Borrowings comprise ` 15 crores term loan from bank which was availed for solar power plant at Dahej.

81
Management Discussion and Analysis
The Company’s debt:equity ratio as on 31st March, 2019 stood at 0.06 compared to 0.02 as on 31st March, 2018, indicating its low leverage.
Consolidated performance for the year ended 31st March, 2019analysis of the consolidated Profit and loss statement
(` crores)Particulars FY 2018-19 FY 2017-18 % changeRevenue from operationsRallis India Ltd. -Consolidated 1,984 1,808 10%Rallis India Ltd. -Standalone 1,672 1,516 10%Metahelix Life Sciences Ltd. 336 319 5%Zero Waste Agro Organics Ltd. 10 10 1%Rallis Chemistry Exports Ltd. - - -PT. Metahelix Lifesciences Indonesia
1 0 155%
EbITda Rallis India Ltd. -Consolidated 241 264 -9%Rallis India Ltd. -Standalone 206 226 -9%Metahelix Life Sciences Ltd. 31 37 -17%Zero Waste Agro Organics Ltd. 1 2 -32%Rallis Chemistry Exports Ltd. - - -PT. Metahelix Lifesciences Indonesia
-1 -1 -1%
PaTRallis India Ltd. -Consolidated 155 167 -7%Rallis India Ltd. -Standalone 129 141 -9%Metahelix Life Sciences Ltd. 23 24 -5%Zero Waste Agro Organics Ltd. 2 2 -13%Rallis Chemistry Exports Ltd. - - -PT. Metahelix Lifesciences Indonesia
-1 -1 -1%
Total income increased by 11% from ` 1,822 crores in FY 2017-18 to ` 2,015 crores in FY 2018-19. EBITDA decreased by 9% from ` 264 crores in FY 2017-18 to ` 241 crores in FY 2018-19. Profit after tax decreased by 7% from ` 167 crores in FY 2017-18 to ` 155 crores in FY 2018-19.
Key Financial Ratios :
Standalone:
1. Interest coverage ratio was at 40 compared to 59 of previous year. Even after a drop the Company has a high interest coverage ratio which indicates stronger financial health and capability of meeting interest obligations.
2. Debt equity ratio was at 0.06 as compared to the previous year 0.02. However, the Company has a very low debt to equity ratio which indicates strong ability to repay its debt obligations.
3. Return on net worth decreased from 12% to 10% over the previous year due to decrease in profit after tax from ` 141 crores to ` 129 crores and increase in net worth due to increase in reserves and surplus by ` 70 crores.
Consolidated
1. Debt equity ratio was at 0.06 as compared to the previous year 0.02. However, the Company has a very low debt to equity ratio which indicates strong ability to repay its debt obligations.
2. Return on net worth decreased from 14% to 12% due to decrease in profit after tax from ` 167 crores to ` 155 crores and increase in net worth by ` 95 crores.
oPPoRTUNITIES & oUTlooK
India provides immense growth opportunities in the agrochemical sector owing to its low consumption. The country faces a certain urgency to increase the knowledge and awareness among farmers to enhance production and productivity of crops and improve the yield per hectare. There is also a need for better crop protection solutions to shield the crop and produce from pest attacks and increase farm productivity. Per hectare usage of pesticides is the lowest in India and farmers are gradually learning to use agrochemicals to improve productivity. Awareness on a sustainable seed system to ensure high-quality hybrid seeds is also a key imperative, demonstrating growth opportunity. The Company is ensuring a wide product portfolio, extensive geographical reach and improved internal processes and supply chains to leverage the growing opportunity landscape.
The Company remains focused on providing holistic agro-solutions aimed at improving farm productivity and yield effectively, rather than just selling products. It is constantly working towards fostering knowledge-based farming by leveraging its Rallis Samrudh Krishi® platform.

82 | 71st Annual Report 2018-19
Statutory ReportsRallis India Limited
off-patent opportunity
Pesticides valuing US$ 2.9 billion are expected to go off-patent between 2017-2020, according to a FICCI report. This patent cliff will result in a decline in market share of patented products from 20%-22% to around 13%-15% by 2020. This will provide significant opportunities to Indian players with high proportion of exports as part of their total turnover. India’s capability in low-cost manufacturing, availability of technically trained manpower, seasonal domestic demand, overcapacity, better price realisation globally and strong presence in generic pesticide manufacturing is supporting the country create a niche in the international marketplace. The Company is fully geared to explore these opportunities and is building the requisite capability and portfolio.
Contract Manufacturing (‘CM’)
CM is another growth area. As China looks to shut down capacities to curb pollution, this shift in manufacturing base from China and Japan is opening opportunities for Indian players reputed for cost-competitive production. The Company has already identified growth opportunities in the field of CM and is building up capacities in a big way to boost its revenues.
RISKS & CoNCERNSRisk management comprises all the organisational rules and actions for early identification of risks in the course of doing business and the management of such risks along with identification of opportunities.
The Company has constituted a Risk Management Committee of the Board. The Committee reviews the Company’s performance against the identified risks, formulates strategies towards identifying new and emergent risks that may materially affect the Company’s overall risk exposure and review the risk management policy and structure.
This robust Risk Management framework seeks to create transparency, minimise adverse impact on business objectives and enhance the Company’s competitive advantage.
The Internal Audit Department is responsible to facilitate coordination with various heads of departments with respect to the process of identifying key risks associated with the business, manner of handling risks, adequacy of mitigating factors and recommending corrective action. The major risks forming part of the Enterprise Risk Management process are linked to the audit universe and are also covered as part of the annual risk based audit plan.
RESEaRCH & dEVEloPMENT Being actively engaged in product and process development activities across various segments of its businesses, Research & Development is an integral part of the Company’s operations. Bengaluru-based Rallis Innovation & Chemistry Hub (‘RICH’) is the Company’s primary R&D center. RICH leverages its R&D capability to develop innovative solutions that assist various departments to work more efficiently towards common objectives. It is aggressively engaged in identifying potential areas for new product and process development and carrying out relevant activities to help the Company achieve its R&D goals. Besides, it also formulates and designs various modules and plans for the Farmer Connect programme, which is aimed towards offering package of practice for various crops to the farmers.
RICH undertakes activities under four key functions – Process Chemistry, Formulation Development, Product Development and Regulatory Affairs. Besides, it also designs and develops Package of Practice (‘PoPs’) for farmers, enabling them to improve their yield and net income. Apart from offering customised PoPs, the Company also creates awareness about safe handling of crop protection products and keeps them abreast on various integrated farm practices. Farmers have already reaped the benefits in terms of yield improvements. These efforts have shown good results in crops such as paddy, cotton, tomato, soybean, red gram, black gram, chilli and sugarcane.
RICH remains focused on environment-friendly chemistry so as to develop products and formulations which are safe to handle. There is emphasis on eco-friendly and sustainable formulations, without compromising on the efficacy.
RICH also develops modules and periodicals for internal teams to keep them updated on the key developments in the field of R&D. It is actively involved in supporting the sales & marketing and manufacturing teams during pre and post launch of its products. The Company encourages its Scientists to participate in various seminars and workshops to enhance their knowledge.
Rallis Innovation Turnover Index (ITI) is an indicator to understand the share of new products in the overall revenues. After witnessing a drop in the index for few years, a distinct improvement was visible in ITI during FY 2017-18, as it moved to 11% from 7% in the previous years. During FY 2018-19, the ITI moved to 10%. During the year under review, the Company received 15 registrations – 4 for the domestic market and 11 for the international market.

83
Management Discussion and Analysis
Going forward, the Company is fully geared to ramp up its product portfolio in a significant manner. It has formulated a long-term strategy of looking at products and solutions beyond 5-10 years, which will go a long way in improving the ITI. Along with augmenting its manufacturing efforts, these initiatives will enable the Company to explore emerging opportunities effectively.
ENVIRoNMENT, HEalTH & SaFETYAt Rallis India, safety, health and environment is a key to business success. The Company accords utmost priority to build a strong and fool-proof system to ensure that the safety standards and norms are adequately complied with. In fact, ‘safety is a condition of employment, rather than being a choice’ within the Company. Its leadership team is fully committed towards building an organisation where health and safety practices and standards are not only well defined, but also adhered to in the best possible manner. It continuously works towards creating new benchmarks which increasingly focus on production of environment-friendly formulations through safer chemistry and processes. This ensures safety for all the stakeholders who are handling these products on a regular basis. The Company has been re-certified for Responsible Care Logo by Indian Chemical Council (‘ICC’) for another period of three years starting 2019.
The Company’s focus towards care and safety also reflects in its approach as it promotes behavioural safety, process safety and road safety as key focus areas among its workforce. At Rallis, a culture of safety is encouraged across hierarchies of the organisation to ensure there is no scope for any shortcuts and leniency. As a part of daily sensitisation on “safety”, the Company has introduced the concept of a safety gallery through which all employees and workers must pass while entering and exiting the factory premises on daily basis. This invigorates higher sense of safety and better awareness. A set of road safety rules and guidelines have been put in place for employees who often travel on roads to perform their duties. Despite these very strong processes, there was an unfortunate incident of flash fire at the Ankleshwar unit during the year resulting in fatality of one employee. The Company has provided all support to family of deceased employee. The Company is also taking various measures to further strengthen its process safety to ensure safe and healthy environment at all its units.
Adoption of automation has helped the Company improve its safety standards across the value chain. It has achieved upto 70% automation across its various manufacturing processes, thus ensuring a higher degree of safety for its workforce. It is working towards increasing its automation level to 90% over the next few years.
Being an environmentally-responsible organisation, the Company has built facilities with the right processes and technologies to minimise the level of effluent discharge. In fact, the Company has gone a step ahead and moved forward on achieving its mission of Zero Liquid Discharge (‘ZLD’) for two of its manufacturing units, even while efforts are being undertaken to move the other two facilities towards ZLD as well.
Taking a step ahead in its environmental responsibility, the Company is investing in various energy conservation equipment to ensure all its buildings and structures are energy efficient. While all the admin buildings are IGBC (Indian Green Building Council certified) ‘green building’ certified, its Dahej plant has IGBC gold rating and Ankleshwar IGBC platinum rating.
The Company is currently generating 30% of its energy requirements from renewable sources. It is committed to take this higher to 50% over the next few years. As a part of green initiative, the Company has cumulatively planted over 80,000 saplings in the last five years with more than 90% survival.
Farmers’ safety
The Company is a Responsible Care Company. On one hand, the Company is focused on manufacturing environment friendly products in terms of crop protection, ensuring the safety of farmers who handle these chemicals. On the other hand, it has adopted measures to create awareness among farmers to minimise risks and other concerns while using these chemicals in farms. The Company regularly organises awareness workshops and campaigns to sensitise the farmer community. Various government agencies have also duly acknowledged these efforts. During FY 2018-19, under “You are Safe” campaign, the Company conducted safety awareness contact programs in 535 villages across 2 districts, covering 23,234 farmers and 10,494 students.
HUMaN RESoURCES The Company’s Employee Engagement Score has improved from 75% (last survey in 2017) to 79% in recently conducted Employee Engagement Survey by AON. This signifies the trust and binding of employees towards the organisation. This has been possible as the Company continues to focus on building a robust HR system and employee-friendly HR policies for the holistic development of its human resource. Policies are designed to provide healthy work environment with freedom to work and express views coupled with growth opportunities within the organisation. The policies are well-documented and disseminated to instill the much-needed trust and transparency among
84 | 71st Annual Report 2018-19
Statutory ReportsRallis India Limited
the employees. This also helps the Company in its talent acquisition and retention processes, thereby building a strong and dedicated workforce.
As a part of the Tata Group, the Company has well-designed and documented policies in place that prevent discrimination and harassment. There is a Whistleblower Policy as well as POSH Policy in place to discourage any wrong practices at the workplace.
The Company has adopted the Tata Code of Conduct to reinforce the core Tata values. The adoption of this Code renews the Company’s commitment to values of excellence and leadership.
Learning and development and building of talent pool continue to be vital areas for ensuring availability of adequate and competent resource to meet the Company’s growth plan. During the year under review, the Company has strengthened its talent pipeline to around 8% of its total workforce. Various platforms including Development Centre at Tata Management Training Centre (‘TMTC’), GeMS program for new managers at TMTC, cross functional team, corporate projects, enriching the role, Job rotation, etc. have been provided as a part of growth plan for these employees. Besides this, the Company regularly conducts various programmes and workshops to train and upgrade its workforce. The RSK workshops impart the Sales & Marketing team with various modules of RSK programmes and equip them with latest techniques and concepts.
Moreover, in order to offer opportunities to the rural youth, the Company conducts a novel employment programme focused on agri-marketing - Tata Rallis Agri Input Training Scheme (‘TRAITS’). As a part of continuous learning reinforcement, the Company has developed structured online digital platforms for employees to access self-learning and knowledge building resources. As on 31st March, 2019, the employee strength of the Company was 1,001 compared to 977 as on 31st March, 2018 (excluding trainees).
bUSINESS EXCEllENCE The Company has been constantly working towards strengthening its operational excellence. It pursues a culture of continuous improvement and excellence, thus achieving its set goals in an efficient and effective manner. The Company has consistently followed the journey of excellence under TBEM (Tata Business Excellence Model) with encouraging results, culminating in winning the prestigious JRDQV Award in 2011. The TBEM model assesses the Company on its processes and results parameters to identify its level of maturity of improvement.
At Rallis India, business excellence is not only about following the TBEM model, it is about building a continuous culture of excellence across the organisation. The Company has regularly moved up on the maturity and excellence scale. As per assessment conducted in 2018-19 the Company falls under Emerging Industry Leader category. It also denotes the level of processes that the organisation aims at for achieving the desired results.
The Company boosted its excellence journey through an intensive internal assessment - ROCK (Ralliites on Continuous Karma), encompassing all locations and functions. A group of excellence assessors have been developed within the Company, who do their assessment across functions and locations. Feedback on improvement is shared across departments and high scoring functions and locations are recognised. Over time, the Company has developed around 12 external and 40 internal assessors. Recently, the management decided to make the Company a part of its parent Company, Tata Chemical’s integrated assessment process, which is carried out every two years.
In FY 2018-19, the Company implemented the data maturity assessment conducted by Tata Business Excellence Group. This is aimed at gaining feedback on how it is efficiently managing large data and information received from internal and external stakeholders and utilising that in the decision-making process.
Rallis India is reputed for its innovation capabilities. In the last 168 years of its existence, innovation has played a key role in the Company’s evolution journey. It relentlessly attempts to accomplish innovation across its business model, products, processes and people. It participates in the Group forum ‘Tata Innovista’ each year. In 2018, it submitted 57 innovation entries, of which three were selected for the Global round.
In 2018, the Company’s strategic innovation RSK won several external recognitions:
• IMC MQH (Making Quality Happen) Best PracticesCompetition in services category at the RBNQAT.
• Business model innovation by CII at the 6th NationalExcellence Practice Competition.
• Outstanding innovation in crop solution at PMFAI-SMLAGCHEM award.
Backed by initiatives such as Drishti, the Company is geared up to move to the next level of excellence. Drishti is one such digital enabler of the RSK programme, as it empowers farmers with data and information and helps them take informed decisions.

85
Management Discussion and Analysis
The Company has an online digital platform for employees to register their innovative ideas. Knowledge sharing is leveraged through Knowledge Management on the Company’s intranet. To strengthen manufacturing, DWM (Daily Work Management), a visual management concept based on Statistical Quality Control was implemented in all areas of
CoRPoRaTE SUSTaINabIlITY aNd aFFIRMaTIVE aCTIoN (‘aa’) The Company believes in pursuing a business strategy which derives strength from sustainability. The Company has developed its own Sustainability Model having clear focus on CSR and AA initiatives. For achieving a greater and sustainable impact, the projects are implemented in partnership with the concerned stakeholders. The Company’s CSR activities are focused in the areas of natural resource management (NRM), education, model tribal village, greening and skill development.
The Company is also a part of the AA program whereby initiatives are centered towards inclusion of socially disadvantaged and marginalised sections of the society (Scheduled Castes and Scheduled Tribes). These interventions are channelised towards education, employment, employability, entrepreneurship and essential amenities.
importance, and significant results were achieved regarding process control. The Company trained more than 80% of its people in factories based on the DWM principles. Customer-oriented business strategies, operational efficiencies and their sustainability are aimed at helping the Company make significant progress on the path of excellence.
Jal dhan
With increasing population, the consumption of food grains is growing and so is the demand for water and other natural resources. Availability of water is gradually declining, such that it has already become a scarce commodity. It is imperative on the part of stakeholders to conserve and manage water and other natural resources in a more efficient manner.
Rallis’ sustainability model promotes water management through its Jal Dhan and Jal Mitra programmes. A key focus is on water conservation and on improving its availability in villages facing severe water crisis. The Company adopts various water management tools and techniques to deal with specific water related issues.
The Jal Dhan project, operational in Gujarat and Maharashtra, has been a notable success. Commenced five years ago, at Lote in Maharashtra, the project has so far covered 47 villages
2005• TBEMSeries
Adoption Award
452 2007• RBNQA
Award for Excellence
• TBEMActivePromotion Award
553 2008• CIIExim
Award for Significant Achievement
500+ 2011• JRDQV
Award
602 2012• CIIEXIM
prize
600+2013• TBEM
6092015• CIIEXIM
prize
600+2018• TBEM
622Rallis business excellence journey
Excellence has become the culture of Rallis through continuous improvement in its processes

86 | 71st Annual Report 2018-19
Statutory ReportsRallis India Limited
from 16 Tehsils and 8 districts. The interventions are aimed towards rejuvenating the existing water bodies and related infrastructure and creating newer water structures and check dams to improve water availability. Successive normal monsoons in the last few years have provided adequate support to the initiatives taken up by the Company.
The Jal Dhan project has gone on to recharge water bodies with 1,214 million litres of water, thus transforming the lives of more than 1,53,000 villagers, including over 43,000 people from AA community. Having succeeded in the very first year at Lote, the project invoked good response in drought prone areas of Beed, Marathwada and Vidarbha in Maharashtra.
The Government of Maharashtra also appreciated the interventions and expressed its willingness to lend support to these initiatives. In FY 2018-19, the Company has signed an MoU with the Government of Maharashtra to make 120 villages of Latur Taluka, water stress free in 5-8 years time.
As part of its NRM initiatives, the Company carries out various measures to conserve soil. The focus is on ‘Greening’, principally through afforestation and tree plantation drives. More than 80,000 saplings have been planted and sustained in the last five years.
Tribal Model Village
The Company, under its AA programme, works on transforming a backward Tribal Village into a Model Tribal village. This initiative is currently operational across five tribal villages in districts such as Thane, Raigarh and Palghar in Maharashtra. Most of these tribal villages are deprived of basic amenities, including access to water and sanitation, besides livelihood opportunities and government entitlements. Under the Model village concept, the Company follows a scientific approach and starts with need assessment involving a third party.
Based on the need assessment report, multiple interventions are planned and implemented in a time bound manner. The Company is associated with various Institutions, experts and NGOs such as TISS (Tata Institute of Social Sciences) and All India Institute of Local Self Governance to sustain the projects in the long run.
RUbY (Education Initiative)
The Company implements its CSR initiative for education through RUBY (Rallis Ujjwal Bhavishya Yojana). This is aimed at encouraging children to opt for formal education through various educational programmes. Its key emphasis is on improving the quality of education, teachers’ training, support for infrastructure development in schools and providing educational aids to deprived students.
The Company has identified subjects like Science, English and e-Learning, where students from Government schools are selected. Mostly these are from Government schools that lack the required infrastructure and other modern learning tools. The initiative supports the conversion of these Government schools by providing them with smart boards and e-learning materials.
In 2019, the Company was engaged with 32 schools from Gujarat and Maharashtra.
The educational intervention by RUBY resulted in holistic development of students and improvement in passing percentage of students over the years. It has directly benefited more than 8,600 students, of which 4,700 belonged to the AA community.
TaRa - Women empowerment
Having started with basic amenities such as water and sanitation, the Company gradually expanded its scope of CSR intervention under TARA. The key focus is on enhancing livelihood opportunities for tribal and under-privileged women. Various livelihood skills, such as tailoring and income generating courses, are imparted to women. During FY 2017-18, about 50 women were trained under this initiative. This year, the Company trained another 70 women.
INFoRMaTIoN aNd CoMMUNICaTIoNS TECHNoloGY The Information and Communications Technology (ICT) function assumes significance as the Company pursues digital transformation. In order to derive optimal efficiency across various functions and processes, the Company has aggressively built up its ICT capabilities in the last few years.
The Company has strengthened its core ERP and BW systems further with more upgrades and enhancements.

87
Management Discussion and Analysis
It has developed several reports to support business decisions and implemented the geo-spatial analytics system – DRISHTI.
INTERNal CoNTRolS SYSTEMS aNd adEQUaCY The Company possesses a suitable mechanism for internal controls. It follows a well-designed documentation system for policies and procedures covering all financial and operating functions. These controls have been developed and designed in a manner to properly maintain accounting records for ensuring reliability of financial reporting, monitoring of operations, protecting assets from unauthorised use or losses and compliance with regulations. The Company has digitalised all key process controls through the ERP systems to maximise automated control transactions. The auditor verifies IT-enabled controls as part of the review of functions and processes as part of the Internal Audit function.
The Company has an Audit Committee Charter which defines the scope of work, requirements, accountability, independence and reporting responsibilities of the Internal Audit Function. This is headed by ‘Head – Internal Audit’ who reports functionally to the Chairman of the Audit Committee and administratively to the Managing Director & CEO. The Head – Internal Audit also undertakes the responsibility of Internal Audit, Risk Management and Ethics Functions.
At the start of the fiscal year, the Audit Committee of the Board approves a risk-based internal audit plan, based on which the internal audit reviews are conducted. The Annual Audit Plan is aligned with the major risks identified by the businesses. The scope of audits comprises review and reporting on key process risks, adherence to operating
guidelines and statutory compliances. It also recommends improvements for monitoring and enhancing efficiency of operations and ensuring reliability of financial and operational information. The Audit Committee monitors and reviews significant internal audit observations, compliance with accounting standards, risk management and control systems and profitability.
The Company has engaged Chartered Accountancy firms M/s Ernst & Young (EY) and M/s Mahajan & Aibara (MA) for conducting internal audit reviews. They conduct opening meeting with the auditees, understand processes, roll-out the scope and terms of reference, identify control gaps and suggest remediation plans. EY and MA’s engagement also included review of existing design, tests of Internal Controls over Financial Reporting controls (ICFR) for scope in audit areas and for other key processes/functions to support/enable the process of CEO-CFO certification and Director’s certification under Section 134 of the Companies Act, 2013.
CaUTIoNaRY STaTEMENTSStatements in the Management Discussion and Analysis describing the Company’s and its direct and indirect subsidiaries’ objectives, projections, estimates and expectations may be “forward looking statements” within the meaning of applicable laws and regulations. Actual results could differ materially from those expressed or implied. Important factors that could make a difference to the Company’s operations include among others, climatic conditions, economic conditions affecting demand/ supply and price conditions in the domestic and overseas markets in which the Company operates, changes in the Government regulations, tax laws and other statutes and other incidental factors.

88 | 71st Annual Report 2018-19
Statutory ReportsRallis India Limited
1. COMPANY’S PHILOSOPHY ON THE CODE OF GOVERNANCE
The fundamental principle of Corporate Governance is achieving sustained growth ethically and in the best interest of all stakeholders. It is not a mere compliance of laws, rules and regulations, but a commitment to values, best management practices and adherence to the highest ethical principles in all its dealings, to achieve the objects of the Company, enhance stakeholder value and discharge its social responsibility. Above all, it is a way of life, rather than merely a legal compulsion.
The Company has a strong legacy of fair, transparent and ethical governance practices and it believes that good Corporate Governance is essential for achieving long-term corporate goals and to enhance stakeholders’ value. In this pursuit, the Company’s philosophy on the Code of Governance is based on the belief that effective Corporate Governance practices constitute a strong foundation on which successful commercial enterprises are built to last. Good Corporate Governance is indispensable to resilient and vibrant capital markets and is, therefore, an important instrument of investor protection. As a good corporate citizen, the Company lays great emphasis on a corporate culture of conscience, integrity, fairness, transparency, accountability and responsibility for efficient and ethical conduct of its business.
The Company is committed to the Tata Code of Conduct (‘TCoC’). TCoC articulates values and ideals that guide and govern the conduct of the Tata companies as well as its employees in all matters relating to business. This is further strengthened by the adoption of the TCoC for its employees, including the Managing Director. In addition, the Company has adopted a Code of Conduct for its Non-Executive Directors including Code of Conduct for Independent Directors which suitably incorporates the duties of Independent Directors as laid down in the Companies Act, 2013 (‘the Act’). The Company’s Corporate Governance philosophy is also reinforced through adoption of the Code of Conduct for Prevention of Insider Trading, Code of Corporate Disclosure Practices and the Tata Business Excellence Model. The Company has also adopted the Guidelines on Board Effectiveness to fulfill its responsibilities towards its stakeholders.
The Company has adhered to the requirements stipulated under Regulations 17 to 27 read with Para C and D of Schedule V and clauses (b) to (i) of
Corporate Governance Report
sub-regulation (2) of Regulation 46 of SEBI (Listing Obligations and Disclosure Requirements) Regulations, 2015 (‘Listing Regulations’) as applicable, with regard to Corporate Governance.
2. BOARD OF DIRECTORS Composition
The Board of Directors of the Company is the highest governance authority within the management structure of the Company. Further, the Board of Directors of the Company is totally committed to the best practices for effective Corporate Governance.
The Board of Directors, along with its Committees, provides leadership and guidance to the management and directs and supervises the performance of the Company, thereby enhancing stakeholders’ value. The Board has a fiduciary relationship in ensuring that the rights of all stakeholders are protected. The Board composition is in conformity with the Act and the Listing Regulations.
As on 31st March, 2019, the composition of the Board of Directors is as under:
None of the Directors are related to each other.
The Company currently has a right mix of Directors on the Board who possess the requisite qualifications and experience in general corporate management, finance and other allied fields which enable them to contribute effectively to the Company in their capacity as Directors of the Company. Detailed profile of the Directors is available on the Company’s website at http://www.rallis.co.in/POBD.HTM
Board Composition
2 Executive Directors (22%)
5 Independent Directors including 2 women Directors (56%)
2 Non-Executive Non-Independent
Directors (22%)
9Directors
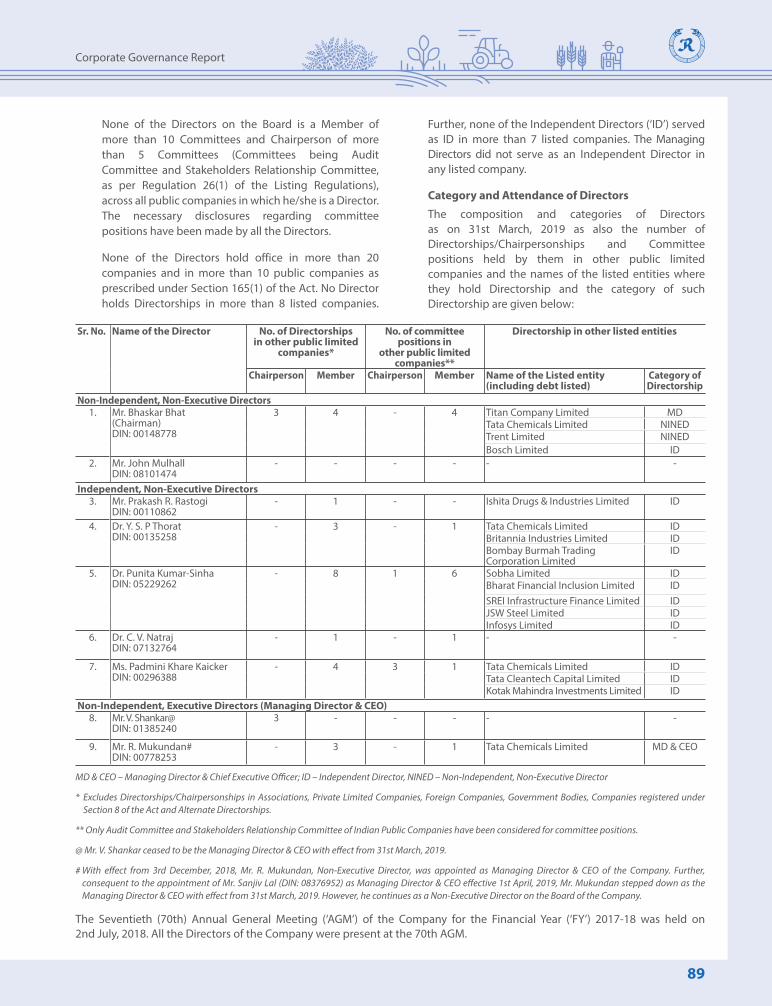
89
Corporate Governance Report
None of the Directors on the Board is a Member of more than 10 Committees and Chairperson of more than 5 Committees (Committees being Audit Committee and Stakeholders Relationship Committee, as per Regulation 26(1) of the Listing Regulations), across all public companies in which he/she is a Director. The necessary disclosures regarding committee positions have been made by all the Directors.
None of the Directors hold office in more than 20 companies and in more than 10 public companies as prescribed under Section 165(1) of the Act. No Director holds Directorships in more than 8 listed companies.
Further, none of the Independent Directors (‘ID’) served as ID in more than 7 listed companies. The Managing Directors did not serve as an Independent Director in any listed company.
Category and Attendance of Directors
The composition and categories of Directors as on 31st March, 2019 as also the number of Directorships/Chairpersonships and Committee positions held by them in other public limited companies and the names of the listed entities where they hold Directorship and the category of such Directorship are given below:
Sr. No. Name of the Director No. of Directorships in other public limited
companies*
No. of committee positions in
other public limited companies**
Directorship in other listed entities
Chairperson Member Chairperson Member Name of the Listed entity (including debt listed)
Category of Directorship
Non-Independent, Non-Executive Directors1. Mr. Bhaskar Bhat
(Chairman)DIN: 00148778
3 4 - 4 Titan Company Limited MDTata Chemicals Limited NINEDTrent Limited NINEDBosch Limited ID
2. Mr. John MulhallDIN: 08101474
- - - - - -
Independent, Non-Executive Directors3. Mr. Prakash R. Rastogi
DIN: 00110862- 1 - - Ishita Drugs & Industries Limited ID
4. Dr. Y. S. P ThoratDIN: 00135258
- 3 - 1 Tata Chemicals Limited IDBritannia Industries Limited IDBombay Burmah Trading Corporation Limited
ID
5. Dr. Punita Kumar-SinhaDIN: 05229262
- 8 1 6 Sobha Limited IDBharat Financial Inclusion Limited IDSREI Infrastructure Finance Limited IDJSW Steel Limited IDInfosys Limited ID
6. Dr. C. V. NatrajDIN: 07132764
- 1 - 1 - -
7. Ms. Padmini Khare KaickerDIN: 00296388
- 4 3 1 Tata Chemicals Limited IDTata Cleantech Capital Limited IDKotak Mahindra Investments Limited ID
Non-Independent, Executive Directors (Managing Director & CEO)8. Mr. V. Shankar@
DIN: 013852403 - - - - -
9. Mr. R. Mukundan#DIN: 00778253
- 3 - 1 Tata Chemicals Limited MD & CEO
MD & CEO – Managing Director & Chief Executive Officer; ID – Independent Director, NINED – Non-Independent, Non-Executive Director
* Excludes Directorships/Chairpersonships in Associations, Private Limited Companies, Foreign Companies, Government Bodies, Companies registered under Section 8 of the Act and Alternate Directorships.
** Only Audit Committee and Stakeholders Relationship Committee of Indian Public Companies have been considered for committee positions.
@ Mr. V. Shankar ceased to be the Managing Director & CEO with effect from 31st March, 2019.
# With effect from 3rd December, 2018, Mr. R. Mukundan, Non-Executive Director, was appointed as Managing Director & CEO of the Company. Further, consequent to the appointment of Mr. Sanjiv Lal (DIN: 08376952) as Managing Director & CEO effective 1st April, 2019, Mr. Mukundan stepped down as the Managing Director & CEO with effect from 31st March, 2019. However, he continues as a Non-Executive Director on the Board of the Company.
The Seventieth (70th) Annual General Meeting (‘AGM’) of the Company for the Financial Year (‘FY’) 2017-18 was held on 2nd July, 2018. All the Directors of the Company were present at the 70th AGM.

90 | 71st Annual Report 2018-19
Statutory ReportsRallis India Limited
The Company held 8 Board Meetings during FY 2018-19 and the gap between two meetings did not exceed 120 days. The details of Meetings attended by the Directors during the year are given below:
Name of the Director
Attendance at the meetings held on No. of meetings attended
Attendance(%)
26th April, 2018
17th July, 2018
23rd October,
2018
3rd December,
2018
17th January,
2019
9th February,
2019
5th March,
2019
18th March,
2019
Mr. Bhaskar Bhat 8 100
Mr. Prakash R. Rastogi LOA 7 87.5
Dr. Y. S. P. Thorat LOA 7 87.5
Dr. Punita Kumar-Sinha 8 100
Dr. C. V. Natraj 8 100
Ms. Padmini Khare Kaicker
LOA 7 87.5
Mr. John Mulhall 8 100
Mr. R. Mukundan 8 100
Mr. V. Shankar 8 100
LOA – Leave of absence
Shareholding of Directors as on 31st March, 2019:
Dr. C. V. Natraj holds 4,831 (0.002%) Equity Shares of the Company. No other Director holds any shares in the Company. The Company has not issued any convertible instruments.
Board Procedure
The annual calendar of Board and Committee Meetings is agreed upon at the beginning of the year. The agenda is circulated well in advance to the Board/Committee members along with comprehensive background information on the items in the agenda to enable the Board and Committees to arrive at appropriate decisions. The agenda and related information is circulated through a highly secure web based application, which can be accessed electronically. This has reduced paper consumption, thereby enhancing the sustainability efforts of the Company. Video conferencing facility is provided to facilitate Directors who are unable to attend the meeting in person.
At Board Meetings, the Managing Director & CEO apprises the Board on the overall performance of the Company. The Board also, inter alia, reviews the strategy, annual business plan and capital expenditure budgets, quarterly, half-yearly and annual financial results, compliance reports on all laws applicable to
the Company, EHS (Environment, Health and Safety) performance, people, process matters, minutes of Board Meetings of subsidiaries and minutes of meetings of Committees of the Board. In addition, the Board is kept informed of all major events, including information listed under Part A of Schedule II to the Listing Regulations. Based on the agenda, members of the senior leadership are invited to attend the Board Meetings, which brings in requisite accountability and provides developmental inputs.
Code of Conduct
The Company has adopted the Tata Code of Conduct for all its employees, including the Managing Director which is available on the website of the Company at http://www.rallis.co.in/TCOC.htm.
The Board has also adopted a Code of Conduct for the Non-Executive Directors of the Company, which incorporates the duties of Independent Directors as laid down in Schedule IV to the Act which is available on the website of the Company at http://www.rallis.co.in/COCNE.htm.
All Board members and Senior Management Personnel (as per Regulation 26(3) of the Listing Regulations) have affirmed compliance with the

91
Corporate Governance Report
applicable Code of Conduct. A declaration to this effect, signed by the Managing Director & CEO forms part of this Report.
Apart from receiving remuneration that they are entitled to under the Act as Non-Executive Directors and reimbursement of expenses incurred in the discharge of their duties, none of the Non-Executive Directors has any other material pecuniary relationship or transactions with the Company, its Promoters, its Directors, its Senior Management or its subsidiaries and associates.
Senior Management of the Company have made disclosures to the Board confirming that there are no material financial and/or commercial transactions between them and the Company that could have potential conflict of interest with the Company at large.
Independent Directors
All Independent Directors of the Company have been appointed as per the provisions of the Act and Listing Regulations. Formal letters of appointment have been issued to Independent Directors. The terms and conditions of their appointment are disclosed on the Company’s website at http://www.rallis.co.in/TCAID.htm.
The Board of Directors confirm that the Independent Directors fulfill the conditions specified in the Act and Listing Regulations and are independent of management.
Separate Meeting of Independent Directors
A separate meeting of Independent Directors of the Company was held on 26th April, 2018 as required under Schedule IV to the Act (Code for Independent Directors) and Regulation 25 (3) of the Listing Regulations. At the Meeting, the Independent Directors:
• Reviewed the performance of Non-Independent Directors and the Board as a whole;
• Reviewed the performance of the Chairman of the Company, taking into account the views of the Managing Director and Non-Executive Directors; and
• Assessed the quality, quantity and timeliness of flow of information between the Company
management and the Board that is necessary for the Board to effectively and reasonably perform its duties.
All the Independent Directors attended the meeting held on 26th April, 2018. Dr. C. V. Natraj chaired the meeting.
Familiarization Programme for Independent Directors
The Company has an orientation programme upon induction of new Directors, as well as other initiatives to update Directors on a continuous basis.
The Company also has an ongoing familiarization programme for its Independent Directors, with the objective of familiarizing them with the Company, its operations and business model, nature of the industry and environment in which it operates, the regulatory environment applicable to it, the CSR projects undertaken by the Company and also the roles, rights and responsibilities of Independent Directors.
During the year under review, certain Directors including Independent Directors visited the Rallis Innovation & Chemistry Hub (RICH) at Bengaluru and met the leadership team there. Further, certain Directors also visited the Rallis Jal Dhan site located at Latur, Maharashtra as a part of CSR activity.
Details of familiarization programmes imparted to Independent Directors are available on the Company’s website at http://www.rallis.co.in/DFPID.htm.
Appointment/Re-appointment of Directors
As required under Regulations 26(4) and 36(3) of the Listing Regulations and Secretarial Standard - 2, particulars of the Directors seeking appointment/ re-appointment are given in the Explanatory Statement to the Notice of the AGM.
Skills, Expertise and Competencies of the Board
The Board of Directors has, based on the recommendations of the Nomination and Remuneration Committee (‘NRC’), identified the following core skills/ expertise/competencies of Directors as required in the context of business of the Company for its effective functioning:

92 | 71st Annual Report 2018-19
Statutory ReportsRallis India Limited
Board Evaluation Evaluation of Individual Directors Committee Evaluation
• Board Structure - qualifications, experience and competencies
• Board Diversity
• Meetings – regularity, frequency, agenda, discussion and recording of minutes
• Functions – strategy, governance, compliances, evaluation of risks, stakeholder value and responsibility, conflict of interest
• Independence of management from the Board, access of Board and management to each other
• Succession plan and professional development
• Professional qualifications and experience
• Knowledge, skills and competencies
• Fulfillment of functions, ability to function as a team
• Attendance
• Commitment, contribution, integrity and independence
In addition to the above, the Chairman of the Board Meetings is also evaluated on key aspects of his role, including effectiveness of leadership and ability to steer meetings, impartiality and ability to keep shareholders’ interests in mind.
• Mandate and composition
• Effectiveness of the Committee
• Structure of the Committee
• Meetings – regularity, frequency, agenda, discussion and dissent, recording of minutes
• Independence of the Committee from the Board and contribution to decisions of the Board
The procedure followed for the performance evaluation of the Board, Committees and Directors is detailed in the Board’s Report.
Skills, expertise and competencies
Leadership experience in managing companies and associations including general management
Experience in human resources and communication
Industry experience including its entire value chain and indepth experience in corporate strategy and planning
Relevant experience and knowledge in the matters of Safety and Corporate Social Responsibility including environment, sustainability, community and values
Expertise in the field of science and technology given the Company’s focus on research and innovation as well as knowledge in the field of Information Technology and digitalisation
Having multiple geography and cross-cultural experience
Experience in finance, tax, risk management, legal, compliance and corporate governance
The Board as a whole possesses the identified skills, expertise and competencies as are required in the context of business of the Company.
Board and Director evaluation and criteria for evaluation
During the year, the Board has carried out an annual evaluation of its own performance, performance of the Directors, as well as the evaluation of the working of its Committees.
The NRC has defined the evaluation criteria, procedure and time schedule for the Performance Evaluation process for the Board, its Committees and Directors. The criteria for Evaluation of Board, Individual Directors and Committees include, inter alia, the following:

93
Corporate Governance Report
3. AUDIT COMMITTEE Terms of reference
The Audit Committee functions in accordance with Section 177 of the Act, Regulation 18 of the Listing Regulations and its Charter adopted by the Board. During the year under review, the Audit Committee Charter was amended to align the role of the Committee with amendments to the Listing Regulations and SEBI (Prohibition of Insider Trading) Regulations, 2015. The terms of reference of the Audit Committee, inter alia, includes:
• Oversight of the Company’s financial reporting process and disclosure of its financial information to ensure that the financial statements are correct, sufficient and credible.
• Discuss and review with the management the annual/ half yearly/ quarterly financial statements and the auditor’s report thereon, before submission to the Board for approval.
• Review of the Company’s accounting policies, internal accounting and financial controls, risk management policies and such other matters.
• Discuss with the statutory auditors, before the audit commences, about the nature and scope of audit, as well as post-audit discussion to ascertain any area of concern.
• Hold timely discussions with the statutory auditors regarding critical accounting policies and practices and significant financial reporting issues and judgments made.
• Recommend to the Board the appointment, re-appointment and, if required, the replacement or removal of statutory auditors, remuneration and terms of appointment of auditors, fixation of audit fees and to approve payment for any other services rendered by the statutory auditors.
• Review and monitor the auditor’s independence, qualification and performance and effectiveness of audit process.
• Review with the management, performance of the statutory and internal auditors.
• Review the adequacy of the internal audit function and the adequacy and efficacy of the internal control systems, including the structure of the internal audit department, approval of the audit plan and its execution, staffing and seniority of the official heading the department, reporting structure, budget, coverage and frequency of internal audit.
• Evaluate internal financial controls and risk management systems.
• Scrutinize inter-corporate loans and investments.
• Review the utilization of loans and/or advances from/ investment by the Company in the subsidiary Companies, exceeding `100 crores or 10% of the asset size of the subsidiary, whichever is lower.
• Discuss any significant findings with internal auditors and follow-up thereon.
• Review the findings of any internal investigations by the internal auditors into matters where there is suspected fraud or irregularity or failure of internal control systems of a material nature and reporting the matter to the Board.
• Look into the reasons for substantial defaults in payments to depositors, debenture holders, shareholders and creditors.
• Approve transactions, including any subsequent modifications, of the Company with related parties.
• Valuation of undertakings or assets of the Company, wherever it is necessary.
• Review and monitor the statement of use and application of funds raised through public offers and related matters.
• Review the functioning of the Whistle Blower mechanism.
• Review the effectiveness of the system for monitoring compliance with laws and regulations and oversee compliance with legal and regulatory requirements, including the Tata Code of Conduct for the Company and its subsidiaries.
• Provide guidance to the Compliance Officer for setting forth policies and implementation of the Code of Conduct for Prevention of Insider Trading and the Code of Corporate Disclosure Practices.
• Review compliance with the provisions of SEBI (Prohibition of Insider Trading) Regulations, 2015, atleast once in a financial year and verify that the systems for Internal Controls are adequate and are operating effectively.
• Oversee financial reporting controls and process for subsidiary companies.
• Approve the appointment of the Chief Financial Officer after assessing the qualifications, experience and background of the candidate.
• Generally, all items listed in Part C of Schedule II to the Listing Regulations and in Section 177 of the Act and any other function as is mentioned in the terms of reference of the Audit Committee.
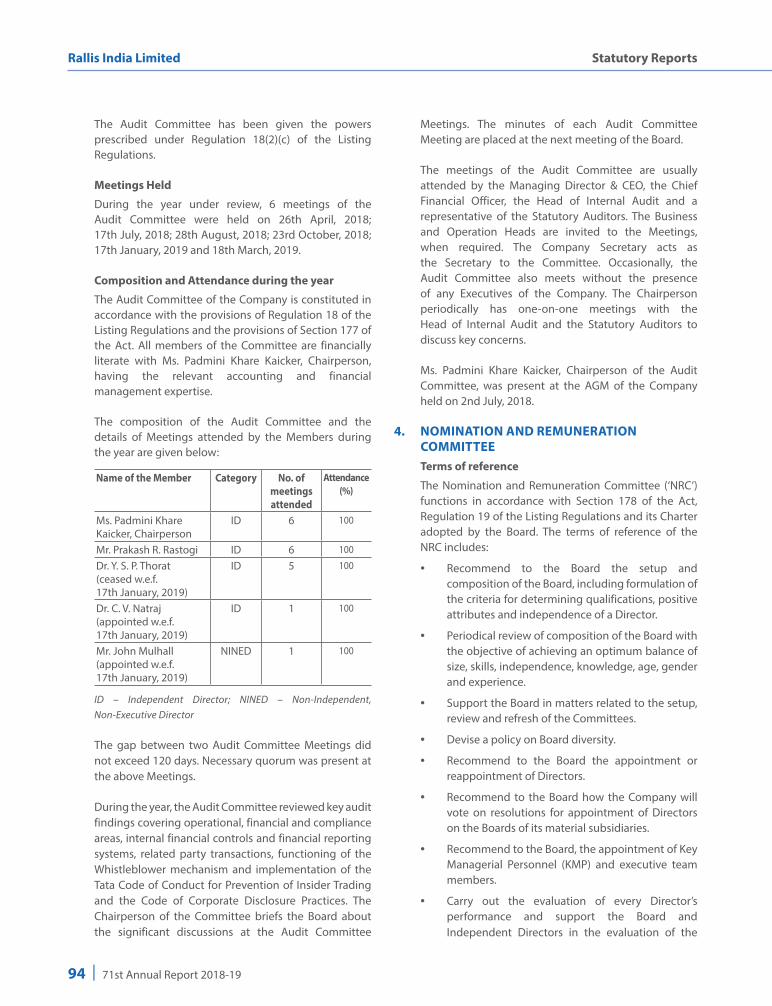
94 | 71st Annual Report 2018-19
Statutory ReportsRallis India Limited
The Audit Committee has been given the powers prescribed under Regulation 18(2)(c) of the Listing Regulations.
Meetings Held
During the year under review, 6 meetings of the Audit Committee were held on 26th April, 2018; 17th July, 2018; 28th August, 2018; 23rd October, 2018; 17th January, 2019 and 18th March, 2019.
Composition and Attendance during the year
The Audit Committee of the Company is constituted in accordance with the provisions of Regulation 18 of the Listing Regulations and the provisions of Section 177 of the Act. All members of the Committee are financially literate with Ms. Padmini Khare Kaicker, Chairperson, having the relevant accounting and financial management expertise.
The composition of the Audit Committee and the details of Meetings attended by the Members during the year are given below:
Name of the Member Category No. of meetings attended
Attendance(%)
Ms. Padmini Khare Kaicker, Chairperson
ID 6 100
Mr. Prakash R. Rastogi ID 6 100
Dr. Y. S. P. Thorat (ceased w.e.f. 17th January, 2019)
ID 5 100
Dr. C. V. Natraj (appointed w.e.f. 17th January, 2019)
ID 1 100
Mr. John Mulhall (appointed w.e.f. 17th January, 2019)
NINED 1 100
ID – Independent Director; NINED – Non-Independent, Non-Executive Director
The gap between two Audit Committee Meetings did not exceed 120 days. Necessary quorum was present at the above Meetings.
During the year, the Audit Committee reviewed key audit findings covering operational, financial and compliance areas, internal financial controls and financial reporting systems, related party transactions, functioning of the Whistleblower mechanism and implementation of the Tata Code of Conduct for Prevention of Insider Trading and the Code of Corporate Disclosure Practices. The Chairperson of the Committee briefs the Board about the significant discussions at the Audit Committee
Meetings. The minutes of each Audit Committee Meeting are placed at the next meeting of the Board.
The meetings of the Audit Committee are usually attended by the Managing Director & CEO, the Chief Financial Officer, the Head of Internal Audit and a representative of the Statutory Auditors. The Business and Operation Heads are invited to the Meetings, when required. The Company Secretary acts as the Secretary to the Committee. Occasionally, the Audit Committee also meets without the presence of any Executives of the Company. The Chairperson periodically has one-on-one meetings with the Head of Internal Audit and the Statutory Auditors to discuss key concerns.
Ms. Padmini Khare Kaicker, Chairperson of the Audit Committee, was present at the AGM of the Company held on 2nd July, 2018.
4. NOMINATION AND REMUNERATION COMMITTEE
Terms of reference
The Nomination and Remuneration Committee (‘NRC’) functions in accordance with Section 178 of the Act, Regulation 19 of the Listing Regulations and its Charter adopted by the Board. The terms of reference of the NRC includes:
• Recommend to the Board the setup and composition of the Board, including formulation of the criteria for determining qualifications, positive attributes and independence of a Director.
• Periodical review of composition of the Board with the objective of achieving an optimum balance of size, skills, independence, knowledge, age, gender and experience.
• Support the Board in matters related to the setup, review and refresh of the Committees.
• Devise a policy on Board diversity.
• Recommend to the Board the appointment or reappointment of Directors.
• Recommend to the Board how the Company will vote on resolutions for appointment of Directors on the Boards of its material subsidiaries.
• Recommend to the Board, the appointment of Key Managerial Personnel (KMP) and executive team members.
• Carry out the evaluation of every Director’s performance and support the Board and Independent Directors in the evaluation of the

95
Corporate Governance Report
performance of the Board, its Committees and individual Directors, including formulation of criteria for evaluation of Independent Directors and the Board.
• Oversee the performance review process for the KMP and executive team with the view that there is an appropriate cascading of goals and targets across the Company.
• Recommend the Remuneration Policy for the Directors, KMP, executive team and other employees.
• On an annual basis, recommend to the Board the remuneration payable to Directors, KMP and executive team of the Company.
• Review matters related to remuneration and benefits payable upon retirement and severance to MD/EDs, KMP and executive team.
• Review matters related to voluntary retirement and early separation schemes for the Company.
• Provide guidelines for remuneration of Directors on material subsidiaries.
• Recommend to the Board how the Company will vote on resolutions for remuneration of Directors on the Boards of its material subsidiaries.
• Assist the Board in fulfilling its corporate governance responsibilities relating to remuneration of the Board, KMP and executive team members.
• Oversee familiarisation programmes for Directors.
• Review HR and People strategy and its alignment with the business strategy periodically, or when a change is made to either.
• Review the efficacy of HR practices, including those for leadership development, rewards and recognition, talent management and succession planning.
• Perform other activities related to the charter as requested by the Board from time to time.
Meetings Held
During the year under review, 6 meetings of the NRC were held on 26th April, 2018; 21st August, 2018; 3rd December, 2018; 17th January, 2019; 5th February, 2019 and 18th March, 2019.
Composition and Attendance during the year The NRC is constituted in accordance with the
provisions of Regulation 19 of the Listing Regulations and the provisions of Section 178 (1) of the Act. The composition of the NRC and the details of Meetings attended by the Members during the year are given below:
Name of the Member Category No. of meetings attended
Attendance(%)
Dr. C. V. Natraj, Chairman ID 6 100
Mr. Bhaskar Bhat NINED 6 100
Mr. Prakash R. Rastogi ID 6 100
Mr. R. Mukundan* NINED 3 100
ID – Independent Director; NINED – Non-Independent, Non-Executive Director* Consequent to the appointment of Mr. R. Mukundan as Managing Director & CEO w.e.f. 3rd December, 2018, he ceased to be a member of NRC.
Dr. C. V. Natraj, Chairman of the NRC, was present at the AGM of the Company held on 2nd July, 2018.
Remuneration of Directors The Company’s Remuneration Policy is aligned
with its philosophy for payment of remuneration to Directors, KMPs and all other employees, based on the commitment of fostering a culture of leadership with trust.
Details of remuneration for FY 2018-19 Managing Director & CEO: The Company pays remuneration by way of salary,
benefits, perquisites and allowances (fixed component) and commission (variable component) to its Managing Director & CEO. Annual increments are recommended by the NRC within the salary scale approved by the Members and are effective 1st April each year. The NRC recommends commission payable to the Managing Director & CEO out of the profits for the financial year within the overall ceilings stipulated in the Act. Specific amount payable as commission is based on the performance criteria laid down by the Board which broadly takes into account the profits earned by the Company for the year and performance of the individual.
Mr. V. Shankar The aggregate value of salary, perquisites, commission
and retirement benefits paid to Mr. V. Shankar, Managing Director & CEO, during FY 2018-19 is ₹ 4,87,42,499 comprising:
Salary : ₹ 79,68,000 Perquisites and : ₹ 1,44,85,432 allowances
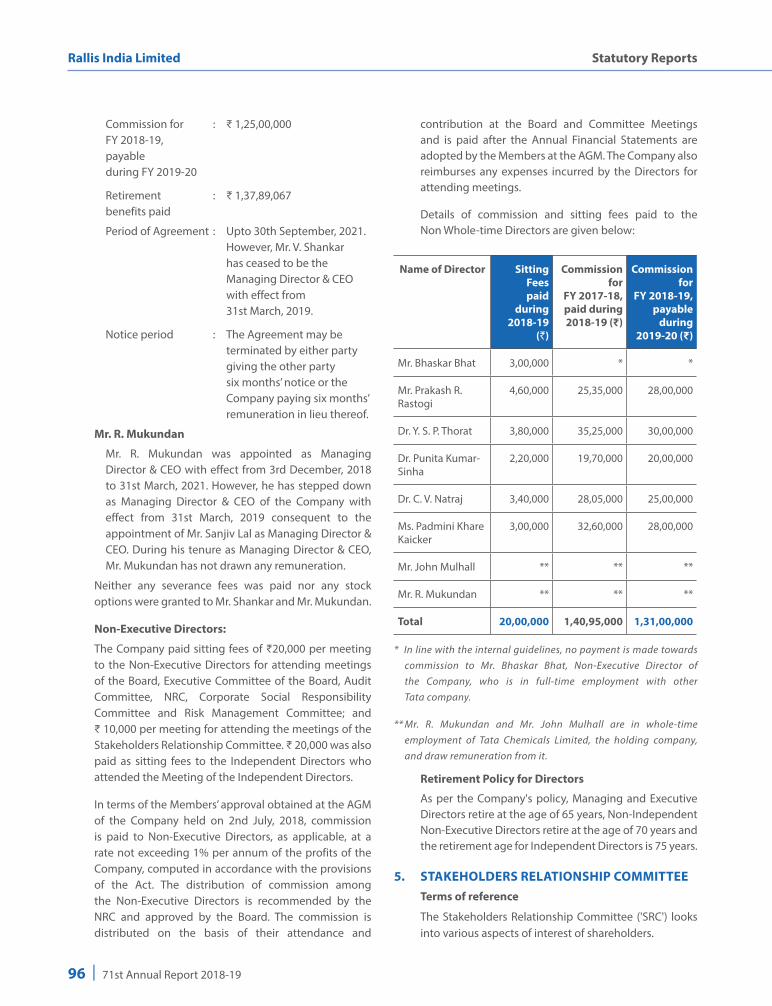
96 | 71st Annual Report 2018-19
Statutory ReportsRallis India Limited
Commission for : ₹ 1,25,00,000 FY 2018-19, payable during FY 2019-20
Retirement : ₹ 1,37,89,067 benefits paid
Period of Agreement : Upto 30th September, 2021. However, Mr. V. Shankar has ceased to be the Managing Director & CEO with effect from 31st March, 2019.
Notice period : The Agreement may be terminated by either party giving the other party six months’ notice or the Company paying six months’ remuneration in lieu thereof.
Mr. R. Mukundan
Mr. R. Mukundan was appointed as Managing Director & CEO with effect from 3rd December, 2018 to 31st March, 2021. However, he has stepped down as Managing Director & CEO of the Company with effect from 31st March, 2019 consequent to the appointment of Mr. Sanjiv Lal as Managing Director & CEO. During his tenure as Managing Director & CEO, Mr. Mukundan has not drawn any remuneration.
Neither any severance fees was paid nor any stock options were granted to Mr. Shankar and Mr. Mukundan.
Non-Executive Directors:
The Company paid sitting fees of ₹20,000 per meeting to the Non-Executive Directors for attending meetings of the Board, Executive Committee of the Board, Audit Committee, NRC, Corporate Social Responsibility Committee and Risk Management Committee; and ₹ 10,000 per meeting for attending the meetings of the Stakeholders Relationship Committee. ₹ 20,000 was also paid as sitting fees to the Independent Directors who attended the Meeting of the Independent Directors.
In terms of the Members’ approval obtained at the AGM of the Company held on 2nd July, 2018, commission is paid to Non-Executive Directors, as applicable, at a rate not exceeding 1% per annum of the profits of the Company, computed in accordance with the provisions of the Act. The distribution of commission among the Non-Executive Directors is recommended by the NRC and approved by the Board. The commission is distributed on the basis of their attendance and
contribution at the Board and Committee Meetings and is paid after the Annual Financial Statements are adopted by the Members at the AGM. The Company also reimburses any expenses incurred by the Directors for attending meetings.
Details of commission and sitting fees paid to the Non Whole-time Directors are given below:
Name of Director Sitting Feespaid
during 2018-19
(`)
Commission for
FY 2017-18, paid during 2018-19 (₹)
Commission for
FY 2018-19, payable
during 2019-20 (₹)
Mr. Bhaskar Bhat 3,00,000 * *
Mr. Prakash R. Rastogi
4,60,000 25,35,000 28,00,000
Dr. Y. S. P. Thorat 3,80,000 35,25,000 30,00,000
Dr. Punita Kumar-Sinha
2,20,000 19,70,000 20,00,000
Dr. C. V. Natraj 3,40,000 28,05,000 25,00,000
Ms. Padmini Khare Kaicker
3,00,000 32,60,000 28,00,000
Mr. John Mulhall ** ** **
Mr. R. Mukundan ** ** **
Total 20,00,000 1,40,95,000 1,31,00,000
* In line with the internal guidelines, no payment is made towards commission to Mr. Bhaskar Bhat, Non-Executive Director of the Company, who is in full-time employment with other Tata company.
** Mr. R. Mukundan and Mr. John Mulhall are in whole-time employment of Tata Chemicals Limited, the holding company, and draw remuneration from it.
Retirement Policy for Directors
As per the Company's policy, Managing and Executive Directors retire at the age of 65 years, Non-Independent Non-Executive Directors retire at the age of 70 years and the retirement age for Independent Directors is 75 years.
5. STAKEHOLDERS RELATIONSHIP COMMITTEE Terms of reference
The Stakeholders Relationship Committee ('SRC') looks into various aspects of interest of shareholders.

97
Corporate Governance Report
During the year under review, the terms of reference of the SRC were amended to align the role of the Committee with amendments to the Listing Regulations. The terms of reference of the SRC includes:
• Review statutory compliance relating to all security holders.
• Consider and resolve the grievances of security holders of the Company, including complaints related to transfer/transmission of securities, non-receipt of annual report/declared dividends/ notices/balance sheet, issue of new/duplicate certificates, general meetings etc.
• Review measures taken for effective exercise of voting rights by shareholders.
• Oversee compliances in respect of dividend payments and transfer of unclaimed amounts to the Investor Education and Protection Fund.
• Oversee compliances in respect of transfer of shares to the Investor Education and Protection Fund, in accordance with the provisions of the Companies Act, 2013 and Rules made thereunder, as applicable from time to time.
• Review the various measures and initiatives taken by the Company for reducing the quantum of unclaimed dividends and ensuring timely receipt of dividend warrants/annual reports/statutory notices by the shareholders of the Company.
• Oversee and review all matters related to the transfer of securities of the Company.
• Approve issue of duplicate certificates of the Company.
• Review movements in shareholding and ownership structures of the Company.
• Ensure setting of proper controls, review adherence to the service standards adopted by the Company in respect of various services being rendered by the Registrar and Share Transfer Agent and oversee performance of the Registrar and Share Transfer Agent.
• Recommend measures for overall improvement of the quality of investor services.
Meetings Held
During the year under review, 2 meetings of the SRC were held on 17th July, 2018 and 17th January, 2019.
Composition and Attendance during the year
The composition of the SRC and the details of the Meetings attended by the Members during the year are given below:
Name of the Member
Category No. of meetings attended
Attendance (%)
Dr. Punita Kumar-Sinha, Chairperson
ID 2 100
Dr. Y. S. P. Thorat ID 2 100
Mr. V. Shankar(ceased w.e.f. 17th January, 2019)
MD & CEO
2 100
Mr. R. Mukundan(appointed w.e.f. 17th January, 2019)
MD & CEO
N. A. N. A.
MD & CEO – Managing Director & Chief Executive Officer; ID – Independent Director
Note: Mr. Sanjiv Lal, MD & CEO was appointed as a member of SRC in place of Mr. R. Mukundan w.e.f. 1st April, 2019.
Dr. Punita Kumar-Sinha, Chairperson of the SRC, was present at the AGM held on 2nd July, 2018.
Name, designation and address of Compliance Officer
Mr. Yashaswin Sheth Company Secretary Rallis India Limited 2nd Floor Sharda Terraces Plot No. 65 Sector 11 CBD Belapur Navi Mumbai - 400 614 Tel. No.: 91 22 6776 1700 Fax No.: 91 22 6776 1775 Email: [email protected]
Status of Investor Complaints
Status of Investor Complaints as on 31st March, 2019 as reported under Regulation 13(3) of the Listing Regulations is as under:

98 | 71st Annual Report 2018-19
Statutory ReportsRallis India Limited
Complaints pending as on : 0 1st April, 2018
Received during the year : 4
Resolved during the year : 4
Pending as on 31st March, 2019 : 0
6. CORPORATE SOCIAL RESPONSIBILITY COMMITTEE
Terms of reference
The terms of reference of the Corporate Social Responsibility (‘CSR’) Committee are as follows:
• Formulate and recommend to the Board, a CSR Policy indicating the activity or activities to be undertaken by the Company as specified in Schedule VII of the Act.
• Recommend the amount to be spent on the CSR activities.
• Monitor the Company’s CSR Policy periodically.
• Oversee the Company’s conduct with regard to its Corporate and societal obligations and its reputation as a responsible corporate citizen.
• Oversee activities impacting the quality of life of various stakeholders.
• Monitor the CSR Policy and expenditure of material subsidiaries.
• Attend to such other matters and functions as may be prescribed from time to time.
The Board has adopted the CSR Policy as formulated and recommended by the Committee. The same is displayed on the website of the Company at http://www.rallis.co.in/CSR_Policy.htm. The Annual Report on CSR activities for the year 2018-19 forms a part of the Board’s Report.
Meetings Held
During the year under review, 2 meetings of the CSR Committee were held on 21st June, 2018 and 18th March, 2019.
Composition and Attendance during the year
The CSR Committee of the Company is constituted in accordance with the provisions of Section 135 of the Act. The composition of the CSR Committee and the details of the Meetings attended by the Members during the year are given below:
Name of the Member
Category No. of meetings attended
Attendance (%)
Mr. John Mulhall, Chairman (appointed w.e.f. 17th January, 2019)
NINED 1 100
Dr. Y. S. P. Thorat* ID 2 100
Mr. P. R. Rastogi ID 2 100
Mr. V. Shankar (ceased w.e.f. 17th January, 2019)
MD & CEO
1 100
MD & CEO – Managing Director & Chief Executive Officer; ID – Independent Director, NINED – Non-Independent, Non-Executive Director
* Dr. Y. S. P. Thorat ceased to be the Chairman of CSR Committee w.e.f. 17th January, 2019. He was present at the AGM of the Company held on 2nd July, 2018.
Note: Mr. Sanjiv Lal, MD & CEO was appointed as a member of CSR Committee w.e.f. 1st April, 2019.
7. RISK MANAGEMENT COMMITTEE Regulation 21 of the Listing Regulations mandates
top 100 listed entities, determined on the basis of market capitalization as at the end of the immediate previous financial year, to constitute a Risk Management Committee (‘RMC’). Although not mandatory for the Company for the year 2018-19, the Company has constituted a RMC of the Board.
Terms of reference
During the year under review, the terms of reference of RMC were amended to align the role of the Committee with amendments to the Listing Regulations. The terms of reference of the RMC includes:
• Approve the Risk Management Policy and plan integration through training and awareness programmes.
• Approve the process for risk identification.
• Set up risk strategy policies, including agreeing on risk tolerance and appetite levels, recognizing contingent risks, inherent and residual risks, including for cyber security.
• Monitor the Company’s compliance with the risk structure. Assess whether current exposure to the risks it faces, including for cyber security, is acceptable and that there is an effective remediation of non-compliance on an on-going basis.

99
Corporate Governance Report
• To approve major decisions affecting the risk profile or exposure and give appropriate directions.
• To consider the effectiveness of decision making process in crisis and emergency situations.
• Balance risks and opportunities.
• Generally, assist the Board in the execution of its responsibility for the governance of risk.
• Attend to such other matters and functions as may be prescribed from time to time.
Meetings Held During the year under review, 4 meetings of the
RMC were held on 23rd April, 2018; 21st June, 2018; 11th December, 2018 and 18th March, 2019.
Composition and Attendance during the year The composition of the RMC and the details of the
Meetings attended by the Members during the year are given below:
Name of the Member
Category No. of meetings attended
Attendance(%)
Dr. C. V. Natraj, Chairman(appointed w.e.f. from 17th January, 2019)
ID 1 100
Dr. Y. S. P Thorat* ID 3 100
Mr. V. Shankar(ceased w.e.f. from 17th January, 2019)
MD & CEO
3 100
Ms. Padmini Khare Kaicker(appointed w.e.f. from 17th January, 2019)
ID 1 100
Mr. John Mulhall(appointed w.e.f. from 17th January, 2019)
NINED 1 100
MD & CEO – Managing Director & Chief Executive Officer; ID – Independent Director, NINED – Non-Independent, Non-Executive Director
* Dr. Y. S. P. Thorat ceased to be the Chairman and Member of RMC w.e.f. 17th January, 2019. He was present at the AGM of the Company held on 2nd July, 2018.
Note: Mr. Sanjiv Lal, MD & CEO, was appointed as a member of the RMC w.e.f. 1st April, 2019.
The Chief Financial Officer and Head - Internal Audit are permanent invitees to the meeting of RMC. Business and Operation Heads are invited to the Meetings when required. The Company Secretary acts as the Secretary to the Committee.
The Company has a well-defined risk management framework in place. The risk management framework of the Company is given in detail in the Board’s Report.
8. EXECUTIVE COMMITTEE OF THE BOARD The Executive Committee of the Board (ECOB) is
responsible for reviewing certain matters before presenting to the Board, items such as business and strategy review, long-term financial projections and cash flows, capital and revenue budgets, acquisitions, divestments and business restructuring proposals. The Committee is also responsible for advising the management on development of business plans and future strategies for the Company.
Meetings Held
During the year under review, 1 meeting of the ECOB was held on 25th April, 2018.
The composition of the ECOB and the details of the Meetings attended by the Members during the year are given below:
Name of the Member No. of meetings attended
Mr. Bhaskar Bhat, Chairman 1Mr. Prakash R. Rastogi 1Mr. R. Mukundan 1Dr. Punita Kumar-Sinha 1
Mr. V. Shankar 1
The Committee has been dissolved with effect from 17th January, 2019.
9. SUBSIDIARY COMPANIES Regulation 16(1)(c) of the Listing Regulations defines
a material subsidiary as a subsidiary, whose income or net worth exceeds 20% of the consolidated income or net worth respectively, of the listed entity and its subsidiaries in the immediately preceding accounting year. During the year under review, the Company did not have any unlisted material subsidiary incorporated in India and was therefore, not required to have an Independent Director of the Company on the Board of such subsidiary, under Regulation 24 of the Listing Regulations. However, two Independent Directors of the Company, viz. Dr. Punita Kumar-Sinha and Dr. C. V. Natraj are appointed as Independent Directors on the Board of its subsidiary, Metahelix Life Sciences Limited.
The Company’s Audit Committee reviews the consolidated financial statements of the Company as well as the financial statements of the subsidiaries,

100 | 71st Annual Report 2018-19
Statutory ReportsRallis India Limited
including the investments made by the subsidiaries. The minutes of the Board Meetings, along with a report of the significant transactions and arrangements of the unlisted subsidiaries of the Company are periodically placed before the Board of Directors of the Company.
10. GENERAL BODY MEETINGS Location, date and time of AGMs held during the
last 3 years and special resolutions passed:
Day, Date and Time
Location Special Resolutions
Monday, 2nd July, 2018 at 3.00 pm
Walchand Hirachand Hall, 4th Floor, Indian Merchants’ Chamber Building, IMC Marg, Churchgate, Mumbai - 400 020.
There was no matter that required passing of Special Resolution.
Friday, 23rd June, 2017 at 3.00 pm
Friday, 24th June, 2016 at 3.00 pm
All resolutions moved at the last AGM were passed by the requisite majority of shareholders.
No Extra Ordinary General Meeting of the shareholders was held during the year. During the year under review, no resolution was put through by Postal Ballot. Further, no special resolution is being proposed to be passed through Postal Ballot.
11. DISCLOSURES Related Party Transactions: During the year under
review, there were no materially significant related party transactions i.e. transactions of the Company of material nature, with its promoters, their subsidiaries, the Directors, the KMP, the management or relatives or other designated persons, that may have a potential conflict with the interests of the Company at large. Declarations have been received from the Senior Management Personnel to this effect.
All related party transactions entered into during the year were on arms’ length basis, in the ordinary course of business and were in compliance with the applicable provisions of the Act and Listing Regulations. The Company has adopted a Related Party Transactions Policy which is in line with the amendments to the Act and the Listing Regulations and the same is displayed on the Company’s website at: http://www.rallis.co.in/Related_Party_TransactionsPolicy.htm
Policy on Material Subsidiaries: The Company has adopted a Policy on Material Subsidiaries and the same is displayed on the Company’s website at the weblink: http://www.rallis.co.in/Material_SubsidiariesPolicy.htm
Statutory Compliance, Penalties and Strictures: The Company is in compliance with the requirements of the Stock Exchanges, SEBI and Statutory Authorities on all matters related to the capital markets. No penalty or strictures were imposed on the Company by these authorities during the last three years.
CEO/CFO Certification: The Managing Director & CEO and the Chief Financial Officer have certified to the Board in accordance with Regulation 17(8) read with Part B of Schedule II to the Listing Regulations pertaining to CEO/ CFO certification for the financial year ended 31st March, 2019.
Whistleblower Policy and Vigil Mechanism: The Company has adopted a Whistleblower Policy, to provide a formal vigil mechanism to the Directors and employees to report their concerns about unethical behaviour, actual or suspected fraud or violation of the Company’s Code of Conduct or Ethics Policy. The Policy provides for adequate safeguards against victimization of employees who avail of the mechanism and also provides for direct access to the Chairperson of the Audit Committee. During the year under review, the Company amended the Whistleblower Policy to provide a clause wherein all employees of the Company are eligible to report any instance of leak of Unpublished Price Sensitive Information. It is affirmed that no personnel of the Company has been denied access to the Audit Committee. The policy is available on the website of the company at http://www.rallis.co.in/ WBPolicy.htm.
Code of Conduct for Prevention of Insider Trading: The Company has adopted the Tata Code of Conduct for Prevention of Insider Trading under the SEBI (Prohibition of Insider Trading) Regulations, 2015 (‘Code’). The Code lays down guidelines for procedures to be followed and disclosures to be made by insiders while trading in the securities of the Company.
Mr. Ashish Mehta, Chief Financial Officer ('CFO') is the Compliance Officer for ensuring compliance
101
Corporate Governance Report
with and for the effective implementation of the Regulations and the Code across the Company.
The Company has also adopted a Code of Corporate Disclosure Practices for ensuring timely and adequate disclosure of Unpublished Price Sensitive Information ('UPSI') by the Company to enable the investor community to take informed investment decisions with regard to the Company’s shares. The CFO has been designated as the Chief Investor Relations Officer to ensure timely, adequate, uniform and universal dissemination of information and disclosure of UPSI.
During the year under review, both the above Codes were amended to align them with the amendments to SEBI (Prohibition of Insider Trading) Regulations, 2015. As per the revised Code, the Company has also adopted Policy on Enquiry in case of leak or suspected leak of UPSI and Policy for Determination of Legitimate Purposes. The Code of Corporate Disclosure Practices along with the Policy for Determination of Legitimate Purposes is also available on the website of the Company at http://www.rallis.co.in/ CCDC.htm.
Accounting treatment in preparation of Financial Statements: The Financial Statements have been prepared in accordance with Indian Accounting Standards (Ind AS) as per the Companies (Indian Accounting Standards) Rules, 2015 notified under Section 133 and other relevant provisions of the Act.
Details of utilisation of funds: The Company has not raised any funds through preferential allotment or qualified institutions placement.
Confirmation by the Board of Directors regarding acceptance of recommendation of all Committees: In terms of the amendments made to the Listing Regulations, the Board of Directors confirm that during the year, it has accepted all recommendations received from all its Committees.
Fees paid to Statutory Auditor: A total fee of ` 1.13 crores was paid by the Company and its subsidiaries, on a consolidated basis, for all services to B S R & Co. LLP, Statutory Auditors and all entities in the network firm/network entity of which they are part.
Prevention, prohibition and redressal of sexual harassment at workplace: Status of complaints in relation to Sexual Harassment of Women at Workplace (Prevention, Prohibition, and Redressal) Act, 2013 for the FY 2018-19 is as follows:
Number of complaints filed during the financial year
: 1
Number of complaints disposed of during the financial year
: 1
Number of complaints pending as on end of the financial year
: 0
Compliance with mandatory and non-mandatory requirements of Listing Regulations: The Company has complied with all mandatory and non-mandatory requirements of the Listing Regulations relating to Corporate Governance and also complied with Clauses (b) to (i) of Regulation 46 (2) relating to dissemination of information on the website of the Company. The status of compliance with the non-mandatory requirements listed in Part E of Schedule II of the Listing Regulations is as under:
• The Non-Executive Chairman maintains a separate office for which the Company is not required to reimburse expenses.
• Half yearly financial performance of the Company is sent to all shareholders.
• The financial statements of the Company are with unmodified audit opinion.
• The Chairman of the Board is a Non-Executive Director and his position is separate from that of the Managing Director & CEO.
• The Internal Auditor reports to the Audit Committee.
12. MEANS OF COMMUNICATION i) The quarterly and the half yearly results published
in the format prescribed by the Listing Regulations read with the Circular issued thereunder are approved and taken on record by the Board of Directors of the Company within one month of the close of the relevant quarter/half year. The approved results are forthwith uploaded on the designated portals of the Stock Exchanges where the Company’s shares are listed viz., NSE Electronic Application Processing System (NEAPS) of the National Stock Exchange of India Limited (NSE) and BSE Online Portal of BSE Limited (BSE). The results are also published within 48 hours in Hindu

102 | 71st Annual Report 2018-19
Statutory ReportsRallis India Limited
Business Line (in English) and Mumbai Lakshadweep (in Marathi) and also displayed on the Company’s website www.rallis.co.in.
ii) The Company publishes the audited annual results within the stipulated period of sixty days from the close of the financial year as required by the Listing Regulations. The annual audited results are also uploaded on NEAPS and BSE Online Portal of NSE and BSE respectively, published in the newspapers and displayed on the Company’s website.
iii) The Company periodically meets or has conference calls with institutional investors and analysts. Official news releases and presentations made to institutional investors and analysts are uploaded on NEAPS and BSE Online Portal of NSE and BSE respectively and posted on the Company’s website.
iv) Comprehensive information about the Company, its business and operations and press releases can be viewed on the Company’s website. The “Investor Relations” section on the website gives information relating to financial results, annual reports, shareholding pattern and presentations made to analysts and at the AGM. Information about unclaimed dividends and details of Equity Shares required to be transferred to the IEPF Demat account are also available in this section.
Members also have the facility of raising their queries/complaints through the Shareholder Query Form available under “Investor Information” in the “Investor Relations” section of the website.
v) The quarterly Shareholding Pattern and Corporate Governance Report of the Company are filed with NSE through NEAPS and with BSE through BSE Online Portal. The Shareholding Pattern is also displayed on the Company’s website under the “Investor Relations” section.
vi) Material events or information as detailed in Regulation 30 of the Listing Regulations are disclosed to the Stock Exchanges by filing them with NSE through NEAPS and with BSE through BSE Online Portal. They are also displayed on the Company’s website under the “Investor Relations” section.
vii) The Company sends an annual reminder to shareholders who have not claimed their dividends. Reminder letters are also sent to those shareholder whose Unclaimed Dividend/Share are liable to be
transfered to the IEPF accounts. Circulars are also sent periodically to shareholders urging them to opt for the electronic mode for receiving dividends.
viii) The Company has uploaded the names of the members and the details of the unclaimed dividend by the members on its website. The members can log in and find out whether their dividend for any of the years is outstanding.
ix) Letters and Reminders to Shareholders
- Updation of PAN and Bank details:
Pursuant to circular issued by SEBI on 20th April, 2018, the Company had sent letters and reminders to shareholders holding shares in physical form for updation of PAN and Bank account details with the Company/its RTA.
- Dematerialisation of shares:
The Securities and Exchange Board of India also issued Circulars during the year thereby mandating transfer of securities only in electronic form effective 1st April, 2019.
Pursuant thereto, the Company sent letters and reminders to those shareholders holding shares in physical form advising them to dematerialise their holding.
x) Management Discussion and Analysis Report forms a part of the Annual Report.
13. GENERAL SHAREHOLDER INFORMATION The Company is registered with the Registrar of
Companies, Maharashtra, Mumbai. The Corporate Identity Number (CIN) allotted to the Company by the Ministry of Corporate Affairs (MCA) is L36992MH1948PLC014083.
Annual General Meeting date, time and venue:
Friday, 28th June, 2019 at 3.00 pm at Walchand Hirachand Hall, 4th Floor, Indian Merchants’ Chamber Building, IMC Marg, Churchgate, Mumbai - 400 020.
Financial Calendar : April to March
Date of book closure : 21st June, 2019 to 28th June, 2019 (both days inclusive)
Dividend payment date : on or after 2nd July, 2019

103
Corporate Governance Report
Listing on Stock : The Company’s Equity Shares Exchanges are listed on the following Stock Exchanges:
BSE Phiroze Jeejeebhoy Towers Dalal Street Mumbai - 400 051
NSE Exchange Plaza, Plot No. C/1, G Block, Bandra-Kurla Complex Bandra (E) Mumbai - 400 001
The Company has paid the listing fees to these Stock Exchanges for the FY 2018-19 and FY 2019-20.
Stock Code on BSE : 500355
Stock Code on NSE : RALLIS EQ Demat International : INE613A01020 Security Identification Number (ISIN) in NSDL and CDSL for Equity Shares
Market Information:
Market price data: High/low, number, value of shares traded and numbers of trades during each month of FY 2018-19:
Month BSE NSE
High(`)
Low(`)
No. of Shares Traded
Value of Shares Traded
(` Lakhs)
No. of Trades
High(`)
Low(`)
No. of Shares Traded
Value of Shares Traded
(` Lakhs)
No. of Trades
April 2018 248.70 218.35 5,23,554 1,219.95 11,259 248.70 218.00 56,66,910 13,220.74 1,14,049
May 2018 226.50 201.40 5,11,777 1,097.21 7,370 226.50 201.75 41,75,988 8,933.24 68,740
June 2018 217.65 181.00 6,13,074 1,233.30 7,522 217.70 186.50 48,08,042 9,709.02 65,161
July 2018 202.65 182.75 5,89,847 1,124.67 11,754 202.85 183.00 66,10,431 12,572.73 1,09,458
August 2018 214.40 189.45 6,25,674 1,267.39 10,367 214.50 189.20 57,17,120 11,575.22 83,000
September 2018
210.70 176.45 3,67,887 727.18 9,169 210.85 176.50 31,21,404 6,149.65 58,960
October 2018 199.00 165.50 2,95,706 529.71 8,079 194.50 165.05 39,28,103 6,989.16 73,846
November 2018
176.40 160.10 4,24,714 712.93 9,096 176.95 159.80 42,83,117 7,163.15 76,317
December 2018
182.20 159.55 8,40,511 1,485.13 12,350 182.35 162.30 1,11,15,124 19,016.30 1,28,915
January 2019 182.00 157.10 11,57,497 1,952.23 16,565 182.00 156.80 77,42,402 12,952.02 1,19,891
February 2019 164.10 148.00 5,45,770 858.69 7,793 164.80 147.60 43,27,362 6,694.01 47,908
March 2019 167.35 146.50 12,04,674 1,948.60 9,559 167.70 145.70 49,47,745 7,955.89 65,865

104 | 71st Annual Report 2018-19
Statutory ReportsRallis India Limited
Registrars and Share Transfer Agents:
Members may correspond with the Company’s Registrars and Share Transfer Agents, TSR Darashaw Limited (TSRDL), quoting their folio numbers/ DP ID and Client ID at the following addresses:
TSR DARASHAW LIMITED6-10 Haji Moosa Patrawala Industrial Estate,20 Dr. E. Moses Road, Mahalaxmi, Mumbai - 400 011.Tel. No.: 91 22 6656 8484 | Fax No.: 91 22 6656 8494E-mail: [email protected]: www.tsrdarashaw.comBusiness Hours: 10.00 a.m. to 3.30 p.m. (Monday to Friday)
Branches of TSRDL:
For the convenience of shareholders based in the following cities, transfer documents and letters will also be accepted at the following Branch Offices/ agencies of TSRDL:
TSR Darashaw Limited,503, Barton Centre, (5th Floor),84, Mahatma Gandhi Road,Bengaluru - 560 001.Tel.: 91 80 2532 0321 | Fax: 91 80 2558 0019 Email: [email protected]
TSR Darashaw Limited,Tata Centre, 1st Floor,43, J. L. Nehru Road, Kolkata - 700 071.Tel.: 91 33 2288 3087 | Fax: 91 33 2288 3062Email: [email protected]
TSR Darashaw Limited, 2/42, Ansari Road, 1st Floor, Daryaganj, Sant Vihar, New Delhi - 110 002.Tel.: 91 11 2327 1805 | Fax: 91 11 2327 1802 Email: [email protected]
TSR Darashaw Limited,“E” Road, Northern Town, Bistupur,Jamshedpur - 831 001.Tel.: 91 657 242 6616 | Fax: 91 657 242 6937Email: [email protected]
Agent of TSRDL:Shah Consultancy Services Limited,3, Sumatinath Complex, 2nd Dhal,Pritam Nagar, Ellisbridge,Ahmedabad - 380 006.Telefax: 91 79 2657 6038Email: [email protected]
Share Transfer System:The transfers are normally processed within 10-12 days from the date of receipt, if the documents are complete in all respects. The Company Secretary has been empowered to approve the transfer of shares.
Effective 1st April, 2019, SEBI has amended Regulation 40 of the Listing Regulations, which deals with transfer or transmission or transposition of securities. According to this amendment, the requests for effecting the transfer of listed securities shall not be processed unless the securities are held in dematerialised form with a Depository. Therefore, for effecting any transfer, the securities shall mandatorily be required to be in demat form.
According to SEBI, this amendment will bring the following benefits:• It shall curb fraud and manipulation risk in physical
transfer of securities by unscrupulous entities.• Transfer of securities only in demat form will improve ease,
convenience and safety of transactions for investors.
Secretarial Audit and other certificates:• Parikh & Associates, Practicing Company Secretaries
have conducted the Secretarial Audit of the Company for FY 2018-19. Their Audit Report confirms that the
The market share price data in comparison to broad-based indices like BSE Sensex and Nifty in FY 2018-19 are given below:Month Rallis closing price at BSE BSE Sensex Rallis closing price at NSE NIFTYApril 2018 230.72 34,145.68 230.68 10,472.93 May 2018 213.10 35,079.56 213.12 10,664.45 June 2018 200.10 35,405.14 200.11 10,742.97 July 2018 188.70 36,406.38 188.69 10,991.16 August 2018 200.00 38,061.53 200.10 11,498.44 September 2018 195.57 37,397.50 195.73 11,297.06 October 2018 178.90 34,518.84 178.86 10,383.81 November 2018 167.83 35,298.95 167.66 10,621.79 December 2018 172.27 35,868.71 172.03 10,778.44 January 2019 168.26 36,053.00 168.10 10,809.46 February 2019 154.39 36,138.34 154.40 10,833.84 March 2019 160.67 37,634.96 160.54 11,317.24

105
Corporate Governance Report
Company has complied with its Memorandum and Articles of Association, the applicable provisions of the Act and the Rules made thereunder, Listing Regulations, applicable SEBI Regulations and other laws applicable to the Company. The Secretarial Audit Report forms part of the Board’s Report.
• Pursuant to Regulation 40 (9) of the Listing Regulations, certificates have been issued on a half-yearly basis, by a Company Secretary in practice, certifying due compliance of share transfer formalities by the Company.
• A Company Secretary in practice carries out a quarterly Reconciliation of Share Capital Audit, to reconcile the total admitted capital with National Securities Depository Limited (NSDL) and Central Depository Services (India) Limited (CDSL) and the total issued and listed capital. The audit confirms that the total issued/ paid-up capital is in agreement with the aggregate of
the total number of shares in physical form and the total number of shares in dematerialized form (held with NSDL and CDSL).
• In accordance with the SEBI Circular dated 8th February, 2019, the Company has obtained an Annual Secretarial Compliance Report from Ms. Jigyasa N. Ved of M/s. Parikh & Associates, Practicing Company Secretary confirming compliances with all applicable SEBI Regulations, Circulars and Guidelines for the year ended 31st March, 2019.
• Ms. Jigyasa N. Ved of M/s. Parikh & Associates, Practicing Company Secretary has issued a certificate confirming that none of the Directors on the Board of the Company have been debarred or disqualified from being appointed or continuing as directors of companies by SEBI/Ministry of Corporate Affairs or any such statutory authority.
Distribution of shareholding as on 31st March, 2019:
Holding of Nominal Value: ₹ 1
Sr. No.
Range Holding Amount (`) % to Capital No. of Holders % to Total Holders
1 1 to 500 62,47,260 62,47,260 3.21 56,932 88.18
2 501 to 1000 30,34,416 30,34,416 1.56 3,839 5.95
3 1001 to 2000 27,48,341 27,48,341 1.41 1,825 2.83
4 2001 to 3000 17,69,899 17,69,899 0.91 676 1.05
5 3001 to 4000 10,06,480 10,06,480 0.52 277 0.43
6 4001 to 5000 11,21,944 11,21,944 0.58 239 0.37
7 5001 to 10000 29,59,458 29,59,458 1.52 407 0.63
8 Greater than 10000 17,55,81,092 17,55,81,092 90.29 364 0.56
Total 19,44,68,890 19,44,68,890 100.00 64,559 100.00
Shareholding pattern as on 31st March, 2019:
Sr. No.
Category of Shareholders Total Holding Percentage
1 Tata Companies 9,74,16,610 50.092 Government/Other Public Financial Institutions and Insurance Companies 1,17,14,783 6.023 Foreign Institutional Investors and Foreign Companies 77,75,464 4.004 Mutual Funds and Nationalized Banks 2,63,75,583 13.565 Alternative Investment Funds 4,78,728 0.256 Foreign Banks and Other Banks 2,89,697 0.157 Other Bodies Corporate and Trusts 68,45,917 3.528 Non Resident Individuals 20,13,732 1.049 Individuals 4,08,28,696 20.99
10 IEPF Suspense Account 7,29,680 0.38Total 19,44,68,890 100.00

106 | 71st Annual Report 2018-19
Statutory ReportsRallis India Limited
Dematerialisation of shares and liquidity:
The Company’s shares are compulsorily traded in dematerialised form and are available for trading on both the Depositories, viz. NSDL and CDSL.
Percentage of shares held in physical and dematerialised form as on 31st March, 2019:
Credit Rating:
CRISIL has given the credit rating of CRISIL AA+/ STABLE for long term and CRISIL A1+ for short term financial instruments of the Company.
Plant locations:
(i) GIDC Estate, Plot No. 3301, Ankleshwar - 393 002, Dist. Bharuch, Gujarat.
(ii) GIDC Estate, Plot No. 2808, Ankleshwar - 393 002, Dist. Bharuch, Gujarat.
(iii) GIDC Estate, Plot No. 3000, Ankleshwar - 393 002, Dist. Bharuch, Gujarat.
(iv) C 5/6, MIDC Industrial Area, Phase III, Shivani, Akola - 444 104, Maharashtra.
(v) Plot No.D-26, Lote Parashuram, MIDC, Near Hotel Vakratunda, Taluka Khed, Dist. Ratnagiri - 415 722, Maharashtra.
(vi) Plot Nos. Z/110 and Z/112, Dahej SEZ Part - II, P.O. Lakhigam, Taluka Vagra, Dist. Bharuch 392 130, Gujarat.
(vii) Plot No. C44, Port Road, Dahej, Dist. Bharuch - 392 130, Gujarat.
Investor correspondence address:
Rallis India LimitedSecretarial Department2nd Floor Sharda TerracesPlot No. 65 Sector No. 11CBD BelapurNavi Mumbai - 400 614
OR
TSR Darashaw LimitedUnit: Rallis India Limited6-10 Haji Moosa Patrawala Industrial Estate,20 Dr. E. Moses Road,Mahalaxmi,Mumbai - 400 011.
CDSL 8.08 % Physical
0.90 %
NSDL 91.02 %
Dematerialisation of Shares as on 31st March, 2019
The Company’s shares are regularly traded on BSE and NSE.
Outstanding ADRs/ GDRs/ Warrants or any convertible instruments, conversion date and likely impact on equity: The Company does not have any outstanding ADRs/ GDRs/ Warrants or any convertible instruments.
Commodity price risk or foreign exchange risk and hedging activities:Commodity price risk and hedging activities: The Company purchases a variety of commodities related to raw materials and finished products and the associated commodity price risks is managed through commercial negotiation with customers and suppliers. The Company does not have any exposure hedged through Commodity derivatives.
Foreign exchange risk and hedging activities: During the year, the Company has managed foreign exchange risk and hedged to the extent considered necessary. Net open exposures are reviewed regularly and covered through forward contracts. The details of foreign currency exposure are disclosed in Note No. 38 to the Standalone Financial Statements.

107
Corporate Governance Report
To,The Members of Rallis India Limited
Declaration by the Managing Director & CEO
I, Sanjiv Lal, Managing Director & CEO of Rallis India Limited hereby declare that all the members of the Board of Directors and Senior Management Personnel have affirmed compliance with the Code of Conduct, as applicable to them, for the year ended 31st March, 2019.
Sanjiv Lal Managing Director & CEOMumbai, 25th April, 2019
---------------------------------------------------------------------------------------------------------------------------------------------------------------------------
Practising Company Secretaries’ Certificate on Corporate Governance
TO THE MEMBERS OFRALLIS INDIA LIMITED
We have examined the compliance of the conditions of Corporate Governance by Rallis India Limited (‘the Company’) for the year ended on 31st March, 2019, as stipulated under Regulations 17 to 27, clauses (b) to (i) of sub-regulation (2) of Regulation 46 and para C, D & E of Schedule V of the Securities and Exchange Board of India (Listing Obligations and Disclosure Requirements) Regulations, 2015 (“SEBI Listing Regulations”).
The compliance of the conditions of Corporate Governance is the responsibility of the management. Our examination was limited to the review of procedures and implementation thereof, as adopted by the Company for ensuring compliance with conditions of Corporate Governance. It is neither an audit nor an expression of opinion on the financial statements of the Company.
In our opinion and to the best of our information and according to the explanations given to us, and the representations made by the Directors and the management, we certify that the Company has complied with the conditions of Corporate Governance as stipulated in the SEBI Listing Regulations for the year ended on 31st March, 2019.
We further state that such compliance is neither an assurance as to the future viability of the Company nor of the efficiency or effectiveness with which the management has conducted the affairs of the Company.
For Parikh & AssociatesPractising Company Secretaries
Jigyasa N. VedFCS: 6488 CP: 6018
Mumbai, 25th April, 2019

108 | 71st Annual Report 2018-19
Statutory ReportsRallis India Limited
INTRODUCTIONThe Company believes that sustainable business is founded on good Corporate Governance (business principles), with a triple bottom line focus i.e. economic, environmental and social performance creating value for all stakeholders, driven by robust business processes and continued growth. The Company focuses on efficient deployment of resources, including people, processes and materials, for the production of safe and eco-efficient products, with a view to creating value for all its stakeholders. This ensures that we embed balance in our engagement with all stakeholders, keeping the community at the core of whatever we do.
SECTION A: GENERAL INFORMATION ABOUT THE COMPANY1. Corporate Identity Number (CIN) of the Company:
L36992MH1948PLC014083
2. Name of the Company: Rallis India Limited
3. Registered address: 156/157 15th Floor Nariman Bhavan 227 Nariman Point Mumbai - 400 021
4. Website: www.rallis.co.in
5. E-mail id: [email protected]
6. Financial Year reported: 2018-19
7. Sector(s) that the Company is engaged in (industrial activity code-wise):
Agri-Inputs; National Industrial Classification (NIC) Code: 3808
8. Three key products/services that the Company manufactures/provides (as in balance sheet):
The Company principally manufactures “agri inputs”, comprising crop protection products, plant growth nutrients, organic compost and seeds and provides agri-solutions under its Rallis Samrudh Krishi® (RSK) initiative.
9. Total number of locations where business activity is undertaken by the Company:
(a) Number of International Locations (5 major): Nil
(b) Number of national locations: The Company’s manufacturing operations are situated at four locations, viz. Ankleshwar and Dahej in Gujarat and Lote and Akola in Maharashtra.
Business Responsibility Report[As per Regulation 34(2)(f) of the SEBI (Listing Obligations and Disclosure Requirements) Regulations, 2015]
10. Markets served by the Company: The markets for the Company’s products are across India. Globally, it serves markets in Asia, Latin America and Africa, with some sales in Europe.
SECTION B: FINANCIAL DETAILS OF THE COMPANY 1. Paid up Capital (₹): 19.45 crores
2. Total Turnover (Revenue from operations) (₹): 1,671.50 crores (standalone)
3. Total profit after taxes (₹): 128.98 crores (standalone)
4. Total spending on Corporate Social Responsibility (CSR) as percentage of profit after tax: ₹ 3.86 crores, which is more than 2% of the average net profit of the Company for the last three financial years.
5. List of activities in which expenditure in 4 above has been incurred:
(a) Water Harvesting (Jal Dhan)
(b) Farmer Safety “You are Safe” campaign
(c) Model Village development (Rural Development, Health and Sanitation)
(d) Education (RUBY) programme
(e) Environment (Greening)
(f ) Skill development (TARA) initiative
Tata Group Affirmative Action (AA) Policy: The Company works towards inclusion of socially disadvantaged and marginalised sections of society (Scheduled Castes and Scheduled Tribes). The AA interventions focus on Education, Employment, Employability, Entrepreneurship and Essential Enablers.
SECTION C: OTHER DETAILS1. Does the Company have any Subsidiary Company/
Companies?
Yes, the Company has 4 subsidiaries as on 31st March, 2019, of which 3 are direct subsidiaries and 1 is an indirect subsidiary (i.e. subsidiary of the Company’s subsidiary).
2. Do the Subsidiary Company/Companies participate in the BR initiatives of the Parent Company? If yes, then indicate the number of such Subsidiary Company (ies).

109
Business Responsibility Report
Of the 3 Indian subsidiaries of the Company, Metahelix Life Sciences Limited (Metahelix) has its own CSR activities in its area of operations. Operations of another Indian subsidiary are not at a scale that can support CSR activities, whereas the third Indian subsidiary has applied to the Registrar of Companies for removal of its name from the Register of Companies. The indirect subsidiary (i.e. subsidiary of Metahelix) is a foreign subsidiary.
3. Do any other entity/entities (e.g. suppliers, distributors etc.) that the Company does business with, participate in the BR initiatives of the Company? If yes, then indicate the percentage of such entity/ entities? [<30%, 30-60%, > 60%]
Yes, a few of our distributors continued their participation in Jal Dhan initiatives in Maharashtra. They participate and help in identifying the location, interaction with the community people, monitoring the progress of the project and provide their valuable feedback to further strengthen the project (less than 30%).
SECTION D: BR INFORMATION1. Details of Director/Directors responsible for BR:
(a) Details of Director/Directors responsible for implementation of the BR policy/policies:
1. DIN Number: 08376952
2. Name: Mr. Sanjiv Lal
3. Designation: Managing Director & CEO
(b) Details of the BR head:
1. Name: Mr. Alok Chandra
2. Designation: Vice President - Human Resources & Corporate Sustainability
3. Telephone Number: 91 22 6776 1674
4. E-mail id: [email protected]
2. Principle-wise (as per NVGs) BR Policy/policies:
The National Voluntary Guidelines on Social, Environmental and Economic Responsibilities of Business released by the Ministry of Corporate Affairs has adopted nine areas of Business Responsibility. These are as follows:
P1 Businesses should conduct and govern themselves with Ethics, Transparency and Accountability.
P2 Businesses should provide goods and services that are safe and contribute to sustainability throughout their life cycle.
P3 Businesses should promote the well-being of all employees.
P4 Businesses should respect the interests of, and be responsive towards all stakeholders, especially those who are disadvantaged, vulnerable and marginalized.
P5 Businesses should respect and promote human rights.
P6 Businesses should respect, protect and make efforts to restore the environment.
P7 Businesses, when engaged in influencing public and regulatory policy, should do so in a responsible manner.
P8 Businesses should support inclusive growth and equitable development.
P9 Businesses should engage with and provide value to their customers and consumers in a responsible manner.
(a) Details of compliance (Reply in Y/N):
No. Questions P1 P2 P3 P4 P5 P6 P7 P8 P9
1 Do you have a policy/policies for: Y Y Y Y Y Y Y Y Y
2 Has the policy been formulated in consultation with the relevant stakeholders?
Y Y Y Y Y Y Y Y Y
3 Does the policy conform to any national/international standards? If yes, specify? (50 words)
Y Y Y Y Y Y Y Y Y
The spirit and intent of the Tata Code of Conduct (TCoC) and all applicable national laws are captured in the policies articulated by the Company. In addition, they reflect the purpose and intent of the United Nations Global Compact, International Standards such as Responsible Care Logo, ISO 14001 and OHSAS 18001/ ISO 45001.
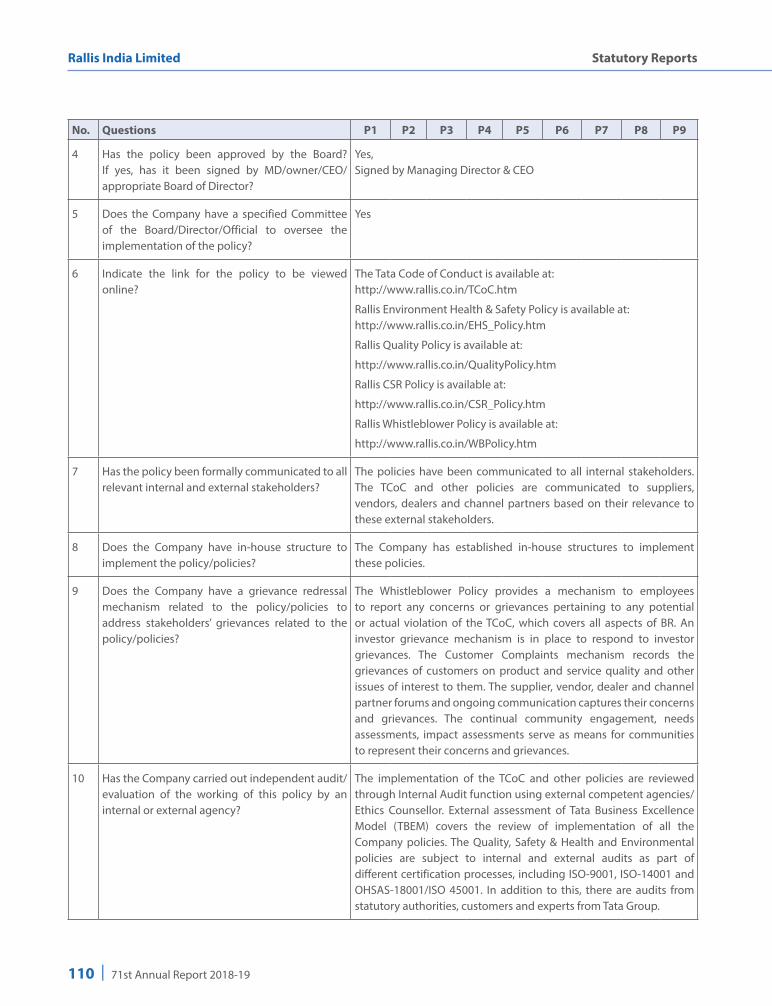
110 | 71st Annual Report 2018-19
Statutory ReportsRallis India Limited
No. Questions P1 P2 P3 P4 P5 P6 P7 P8 P9
4 Has the policy been approved by the Board? If yes, has it been signed by MD/owner/CEO/appropriate Board of Director?
Yes,Signed by Managing Director & CEO
5 Does the Company have a specified Committee of the Board/Director/Official to oversee the implementation of the policy?
Yes
6 Indicate the link for the policy to be viewed online?
The Tata Code of Conduct is available at: http://www.rallis.co.in/TCoC.htm
Rallis Environment Health & Safety Policy is available at: http://www.rallis.co.in/EHS_Policy.htm
Rallis Quality Policy is available at:
http://www.rallis.co.in/QualityPolicy.htm
Rallis CSR Policy is available at:
http://www.rallis.co.in/CSR_Policy.htm
Rallis Whistleblower Policy is available at:
http://www.rallis.co.in/WBPolicy.htm
7 Has the policy been formally communicated to all relevant internal and external stakeholders?
The policies have been communicated to all internal stakeholders. The TCoC and other policies are communicated to suppliers, vendors, dealers and channel partners based on their relevance to these external stakeholders.
8 Does the Company have in-house structure to implement the policy/policies?
The Company has established in-house structures to implement these policies.
9 Does the Company have a grievance redressal mechanism related to the policy/policies to address stakeholders’ grievances related to the policy/policies?
The Whistleblower Policy provides a mechanism to employees to report any concerns or grievances pertaining to any potential or actual violation of the TCoC, which covers all aspects of BR. An investor grievance mechanism is in place to respond to investor grievances. The Customer Complaints mechanism records the grievances of customers on product and service quality and other issues of interest to them. The supplier, vendor, dealer and channel partner forums and ongoing communication captures their concerns and grievances. The continual community engagement, needs assessments, impact assessments serve as means for communities to represent their concerns and grievances.
10 Has the Company carried out independent audit/ evaluation of the working of this policy by an internal or external agency?
The implementation of the TCoC and other policies are reviewed through Internal Audit function using external competent agencies/ Ethics Counsellor. External assessment of Tata Business Excellence Model (TBEM) covers the review of implementation of all the Company policies. The Quality, Safety & Health and Environmental policies are subject to internal and external audits as part of different certification processes, including ISO-9001, ISO-14001 and OHSAS-18001/ISO 45001. In addition to this, there are audits from statutory authorities, customers and experts from Tata Group.
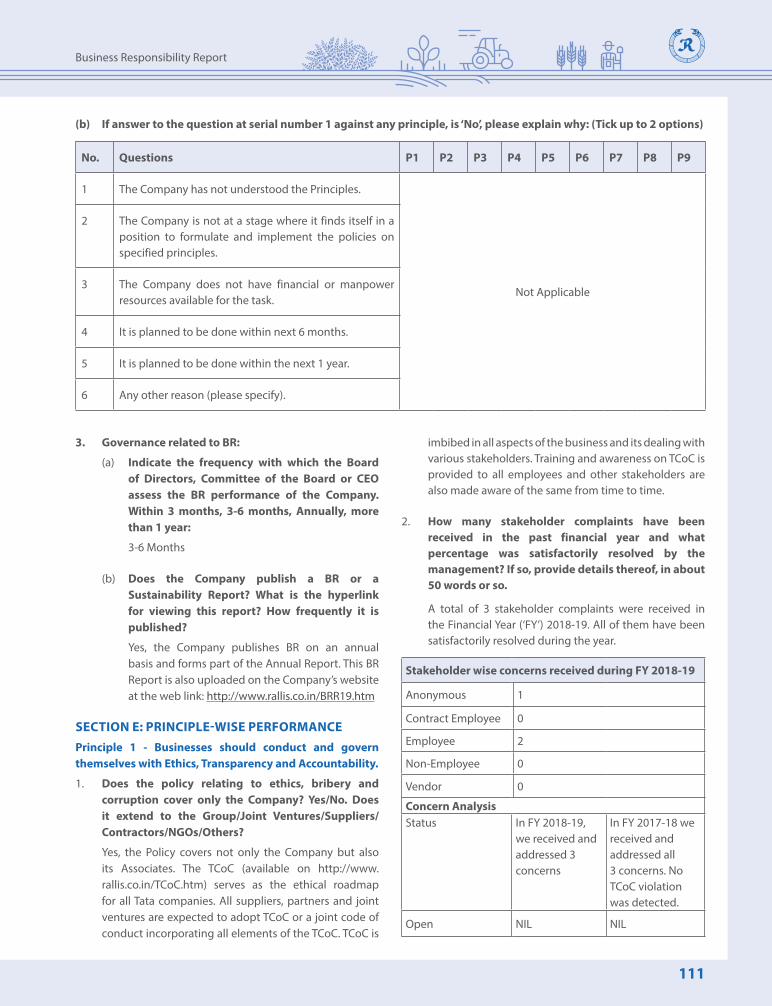
111
Business Responsibility Report
(b) If answer to the question at serial number 1 against any principle, is ‘No’, please explain why: (Tick up to 2 options)
No. Questions P1 P2 P3 P4 P5 P6 P7 P8 P9
1 The Company has not understood the Principles.
Not Applicable
2 The Company is not at a stage where it finds itself in a position to formulate and implement the policies on specified principles.
3 The Company does not have financial or manpower resources available for the task.
4 It is planned to be done within next 6 months.
5 It is planned to be done within the next 1 year.
6 Any other reason (please specify).
3. Governance related to BR:
(a) Indicate the frequency with which the Board of Directors, Committee of the Board or CEO assess the BR performance of the Company. Within 3 months, 3-6 months, Annually, more than 1 year:
3-6 Months
(b) Does the Company publish a BR or a Sustainability Report? What is the hyperlink for viewing this report? How frequently it is published?
Yes, the Company publishes BR on an annual basis and forms part of the Annual Report. This BR Report is also uploaded on the Company’s website at the web link: http://www.rallis.co.in/BRR19.htm
SECTION E: PRINCIPLE-WISE PERFORMANCEPrinciple 1 - Businesses should conduct and govern themselves with Ethics, Transparency and Accountability.
1. Does the policy relating to ethics, bribery and corruption cover only the Company? Yes/No. Does it extend to the Group/Joint Ventures/Suppliers/Contractors/NGOs/Others?
Yes, the Policy covers not only the Company but also its Associates. The TCoC (available on http://www.rallis.co.in/TCoC.htm) serves as the ethical roadmap for all Tata companies. All suppliers, partners and joint ventures are expected to adopt TCoC or a joint code of conduct incorporating all elements of the TCoC. TCoC is
imbibed in all aspects of the business and its dealing with various stakeholders. Training and awareness on TCoC is provided to all employees and other stakeholders are also made aware of the same from time to time.
2. How many stakeholder complaints have been received in the past financial year and what percentage was satisfactorily resolved by the management? If so, provide details thereof, in about 50 words or so.
A total of 3 stakeholder complaints were received in the Financial Year (‘FY’) 2018-19. All of them have been satisfactorily resolved during the year.
Stakeholder wise concerns received during FY 2018-19
Anonymous 1
Contract Employee 0
Employee 2
Non-Employee 0
Vendor 0
Concern AnalysisStatus In FY 2018-19,
we received and addressed 3 concerns
In FY 20 17-18 we received and addressed all 3 concerns. No TCoC violation was detected.
Open NIL NIL
112 | 71st Annual Report 2018-19
Statutory ReportsRallis India Limited
Principle 2 - Businesses should provide goods and services that are safe and contribute to sustainability throughout their life cycle.
1. List up to 3 of your products or services whose design has incorporated social or environmental concerns, risks and/or opportunities.
i) OLIVER: A systemic post-emergent herbicide formulated using Haloxyfop-methyl into 10.5% EC is very effective against all major grassy weeds in Soybean.
ii) Retention of water by soil: A new solution developed in the form of hydrogel to support water retention in the field which will be useful in agriculture, reducing drought stress in plants, making better use of irrigation water and fertiliser.
iii) Collaboration with Public Private Partnership for Integrated Agriculture Development (PPP-lAD), Government of Karnataka under Pulses Productivity Improvement Programme and Value Chain, to study on Red gram and Bengal gram for 3 years (2018-19 to 2020-21) at Gulbarga, Bidar and Bijapur which help to promote key products to farmers.
iv) Supported RSK through Executive Partners and Drishti for pest prediction.
Customer centric initiatives - Rallis Hi-Tech Farm: The Company’s Hi-Tech Farm in Karnataka is established to meet the following objectives:
• Demonstrate technical superiority, knowledge and competence as a technology leader and expert.
• Adopt latest technologies such as farm automation and aerial application-UAV-Drone, drip irrigation, etc.
• Optimized Package of Practices (PoPs), IPM and agronomy practices.
• Use of digital interventions.
• On high value and complex crops -
a) Demonstrated paddy PoP with one Metahelix hybrid on 1 acre with > 50% higher yield.
b) Demonstrated banana PoP with tissue culture banana on 1 acre for maximising the yield.
c) Demonstrated maize PoP with popular hybrid on 1 acre with >10% higher yield in the summer.
Drone for Plant protection application: Collaborative project with Group Technology and Innovation Office (‘GTIO’) is in progress on variety of crops to manage major pests.
2. For each such product, provide the following details in respect of resource use (energy, water, raw material etc.) per unit of product (optional):
(a) Reduction during sourcing/ production/ distribution achieved since the previous year throughout the value chain?
The Company has taken up energy conservation programmes involving our own team and experts from outside. After successful implementation of recommendations, every manufacturing unit has registered savings in terms of KWh and utility specific consumptions.
(b) Reduction during usage by consumers (energy, water) has been achieved since the previous year?
One initiative of the Company, “SRI” (System for Rice Intensification), to educate farmers has not only improved the productivity of rice, but has also potentially saved almost 50% water in rice production.
3. Does the Company have procedures in place for sustainable sourcing (including transportation)? If yes, what percentage of your inputs was sourced sustainably? Also, provide details thereof, in about 50 words or so.
As a Responsible Care Company, sourcing is covered under distribution code, which addresses efforts towards sustainable sourcing. The Company has initiated efforts in reducing the carbon footprint in sourcing and supply chain. Few examples are:
• Export of Key products are shifted to jumbo bags compared to earlier practice of exporting in drums. This has increased volume per consignment and optimum utilisation of container space. Sourcing team is working on developing alternate vendors for import substitutes to reduce import dependency on a particular country. Till date success is achieved to reduce import dependence thus by lead time and carbon footprint for more than 50% imported items.

113
Business Responsibility Report
• Outbound logistics is also concentrating more on consolidation of supplies by maximum transport space utilisation and thus reducing number of trips and logistics cost.
4. Has the Company taken any steps to procure goods and services from local and small producers, including communities surrounding their place of work? If yes, what steps have been taken to improve their capacity and capability of local and small vendors?
Yes, the Company has a vendor development programme, which encourages local contractors and service providers and offers them opportunities. Additionally, the Company has also promoted skills and livelihood development in the neighbouring community through various training and community development programmes. Under Tata Affirmative Action (‘AA’) programme, the Company provides support to people from socially backward community background, including from the Scheduled Castes and Tribes.
5. Does the Company have a mechanism to recycle products and waste? If yes, what is the percentage of recycling of products and waste (separately as <5%, 5-10%, >10%). Also, provide details thereof, in about 50 words or so.
One of the focus areas under the Company’s Corporate Sustainability Model is “Waste reduction and reuse”. One of the long term plans is to make all units, zero liquid discharge units. In this direction, substantial work has been done in all the units, by adoption of newer technologies and processes. The Ankleshwar Unit has achieved 100% recycling of treated water on consistent basis. In this year, Dahej unit also built capacity to recycle treated water.
Principle 3 - Businesses should promote the well-being of all employees.
1. Please indicate the total number of employees: 1,001 as on 31st March, 2019.
2. Please indicate the total number of employees hired on temporary/contractual/casual basis: 1,965 as on 31st March, 2019.
3. Please indicate the number of permanent women employees: 33 as on 31st March, 2019.
4. Please indicate the number of permanent employees with disabilities: None as on 31st March, 2019.
5. Do you have an employee association that is recognised by management: Yes, Rasayanki Kamdar Sangh, Ankleshwar.
6. What percentage of your permanent employees are members of this recognised employee association: 6.8%. Union employees are 65 out of 1,001 employees as on 31st March, 2019.
7. Please indicate the number of complaints relating to child labour, forced labour, involuntary labour, sexual harassment in the last financial year and pending, as on the end of the financial year:
(i) Child labour/forced labour/involuntary labour: No complaints as on 31st March, 2019.
(ii) Sexual harassment: One complaint received, investigated and appropriate action taken during the financial year. No complaint pending as on 31st March, 2019.
(iii) Discriminatory employment: No complaints as on 31st March, 2019.
8. What percentage of your under mentioned employees were given safety and skill up-gradation training in the last year?
100% employees were covered for various safety trainings as on 31st March, 2019.
Principle 4 - Businesses should respect the interests of, and be responsive towards all stakeholders, especially those who are disadvantaged, vulnerable and marginalised.
1. Has the Company mapped its internal and external stakeholders?
Yes, the Company has mapped its stakeholders as part of its stakeholder engagement process.
2. Out of the above, has the Company identified the disadvantaged, vulnerable and marginalised stakeholders?
Yes.
3. Are there any special initiatives taken by the Company to engage with the disadvantaged, vulnerable and marginalised stakeholders? If so, provide details thereof, in about 50 words or so.
While developing our CSR strategy, the Company has ensured that all communities benefit from its CSR activities, with special focus on groups that are
114 | 71st Annual Report 2018-19
Statutory ReportsRallis India Limited
socially and economically marginalised, including rural unemployed youth, women, scheduled castes and tribes. We focus on Affirmative Action (‘AA’) initiatives, with 25% of total CSR budget allocated to AA action, with emphasis on Employability through Skill development and Education. Based on need assessment in the AA community, it was felt that basic needs like potable water, water for irrigation, electricity, sanitation, farmer safety etc. requires immediate attention. Hence, we will focus on Essential amenity, in addition to Employability and Education.
Principle 5 - Businesses should respect and promote human rights.
1. Does the policy of the Company on human rights cover only the Company or extend to the Group/ Joint Ventures/Suppliers/Contractors/NGOs/Others?
The Company follows the principles of the International Declaration of Human Rights. Its policies support, respect and protect the human rights of its direct as well as indirect employees. The TCoC, adopted by the Company, which covers our Associates, addresses these aspects. All suppliers, partners and joint ventures are expected to adhere to these principles covered under the TCoC.
2. How many stakeholder complaints have been received in the past financial year and what percent was satisfactorily resolved by the management?
None pertaining to human rights violation.
Principle 6 - Businesses should respect, protect and make efforts to restore the environment.
1. Does the policy related to Principle 6 cover only the Company or extends to the Group/Joint Ventures/ Suppliers/Contractors/NGOs/others.
The Company’s EHS Policy focuses on preventing/ minimising adverse environmental impacts, so far as is reasonably practicable, through continual improvements in environment management systems, processes, practices and effective environment management and mitigation strategies, responding sensitively to the environmental concerns of the communities and taking necessary measures for implementing product stewardship practices. While the EHS Policy is applicable to the Company and its employees, the Company is committed to enhance awareness on environment sustainability, focusing on the “3R”, i.e. Reduce, Reuse and Recycle amongst its employees, associates and
supply chain partners through effective engagement, communication, consultation and training.
2. Does the Company have strategies/initiatives to address global environmental issues such as climate change, global warming, etc.? Y/N. If yes, please give hyperlink for webpage, etc.
Yes, the Company has adopted Tata Group’s Climate Change Policy to guide Organisational efforts towards mitigating and adapting to climate change. The Company is aligning itself with India’s commitment to combating Climate Change, i.e. Intended Nationally Determined Contributions (INDC) and Tata Group climate change initiatives. In this direction, the Company has a long term plan to achieve the following:
• 50% energy from renewable sources by the year 2021-22.
• 10% reduction in energy consumption by the year 2019-20. Base year 2013-14.
• Planting two lakh saplings on 100% survival basis by the year 2021-22.
• At least 50% thermal energy from bio mass in each Unit by the year 2021-22.
The Tata Group’s Climate Change Policy is available at: http://www.rallis.co.in/Climate_Change_Policy.htm
3. Does the Company identify and assess potential environmental risks? Y/N
The Company makes all efforts to identify environmental aspects and manage its impact. Further, it also strives to continually improve its environmental performance, driven by its Environment Health & Safety Policy. All our manufacturing plants are certified to ISO 14001 Environmental Management Systems (‘EMS’) standard. 2 of our manufacturing Units at Gujarat (Ankleshwar and Dahej) are certified for ISO-50001. As part of EMS implementation, potential environmental risks are identified and appropriate mitigation strategies to reduce the risks are in place.
4. Does the Company have any project related to Clean Development Mechanism? If so, provide details thereof, in about 50 words or so. Also, if yes, whether any environmental compliance report is filed?
The Company has not registered any projects under Clean Development Mechanism.

115
Business Responsibility Report
5. Has the Company undertaken any other initiatives on - clean technology, energy efficiency, renewable energy, etc.? Y/N. If yes, please give hyperlink for web page, etc.
Yes, under its long term sustainability plans, the Company has initiated a number of green initiatives, including setting up solar power generation, moving to biomass fuelled boilers, etc. For more information, visit http://www.rallis.co.in/Greening.htm
Sunshine (Solar) Plant at Dahej is part of our long term sustainability plan of “50% power generation using renewable source of energy”. The Companies has set up a 4.4 MWp Solar Power Plant at Dahej that established connectivity with the national grid on 24th December, 2015.
Entire power generated from the solar plant is meant for captive consumption at Ankleshwar and Dahej Units. Based on the climatic simulation data, “Sunshine” is expected to generate around 7.5 million units per annum. The solar plant is a humble contribution to the commitment of the Government of India towards scale up plan of 1,00,000 MW of Grid Connected Solar Power by the year 2022.
6. Are the emissions/ waste generated by the Company within the permissible limits given by CPCB/SPCB for the financial year being reported?
Yes. All manufacturing plants comply with the prescribed permissible limits for air emissions, effluent quality and discharge, solid and hazardous waste generation and disposal as per their Regulatory Consents/ Authorisations.
7. Number of show cause/legal notices received from CPCB/SPCB which are pending (i.e. not resolved to satisfaction) as on end of financial year.
As on 31st March, 2019, there is no pending show cause or legal notice received from CPCB or SPCB, to the best of the Company’s knowledge and understanding. There is no show cause/legal notice pending resolution by CPCB/SPCB.
Principle 7 - Businesses, when engaged in influencing public and regulatory policy, should do so in a responsible manner.
1. Is the Company a member of any trade and chamber or association? If Yes, name only those major ones that your business deals with.
Yes. The Company is part of:
i. CropLife India
ii. Crop Care Federation of India
iii. Pesticides Manufacturers & Formulators Association of India
iv. Confederation of Indian Industry (CII)
v. Federation of Indian Chambers of Commerce & Industry (FICCI)
vi. Indian Chemical Council (ICC)
vii. Bombay Chambers of Commerce and Industry (BCCI)
2. Have you advocated/lobbied through above associations for the advancement or improvement of public good? Yes/No. If yes specify the broad areas.
Yes, we do from time to time take up issues through the Associations on matters of public interest.
If yes, specify the broad areas (drop box: Governance and Administration, Economic Reforms, Inclusive Development Polices, Energy Security, Water, Food Security, Sustainable Business Principles, Others)
The Company has participated in industry body consultations in the following areas: • Policy formulation for environment protection• Responsible Care guidelines• Policy formulation for pesticide industry
Tata Code of Conduct is the guide that the Company uses for advocacy.
Principle 8 - Businesses should support inclusive growth and equitable development.
1. Does the Company have specified programmes/ initiatives/projects in pursuit of the policy related to Principle 8? If yes, details thereof.
As per the Company’s Sustainability Model, we have taken Employability embedded with Education as the major focus area. Under Employability, the Company has 2 programmes, namely Tata Rallis Agri Input Training Scheme (TRAITS) and Fixed Term Trainees (FTT) to have a visible impact on society. These intervention nurtures and equips youth and gives them an opportunity in the Company and elsewhere, with skill sets that are in demand across Organisations.

116 | 71st Annual Report 2018-19
Statutory ReportsRallis India Limited
The Company implements Education interventions under its RUBY (Rallis Ujjwal Bhavishya Yojana) initiative, where focus is on improving the quality of education and capacity building by imparting training, live demonstration, experimentation and informal education to students, with a view to enhancing basic education, continuity with an ultimate objective to enhance employability.
Under CSR initiatives, various educational activities have been taken up across locations, focusing on holistic development of students and providing educational aids to deprived students. The Company is also engaged in developing 4 Government aided schools into Model Schools.
During FY 2018-19, we have covered 32 schools under our Education projects, benefiting over 8,600 students, of which 4,700 were from among background deserving Affirmative Action.
2. Are the programmes/projects undertaken through in-house team/own foundation/external NGO/government structures/any other organisation?
The Company is committed to improve quality of lives of people in the community it serves through long term stakeholder value creation, with special focus on empowerment of communities in rural India. CSR activities in the Company are implemented by the in-house CSR team, through participatory approach involving beneficiaries, involving NGOs, experts or through Tata Group Focus Initiatives. Volunteering by the employees is focused on and this is engrained into the team at the Company.
3. Have you done any impact assessment of your initiative?
Yes, the Company has done impact assessment for its 3 Tribal Model villages, 2 at Jawahar (Palghar District) namely Kalampada, Kirmire and 1 at Raigad district namely Kelcha Mal through external competent agency, Institute of Social Transformation, Pune.
4. What is the Company’s direct contribution to community development projects - Amount in INR and the details of the projects undertaken?
The Company has spent ` 3.86 crores, which is more than 2% of the average net profit of the Company for the last three financial years. Our key CSR projects are focused on the following:
i. Natural Resource Management (Rain Water harvesting and conservation)
ii. Education
iii. Model Tribal Village
iv. Greening
v. Skill
vi. Farmer Safety
Under the Tata Group Affirmative Action (AA) Policy, the Company works towards inclusion of socially disadvantaged and marginalised sections of society (Scheduled Castes and Scheduled Tribes). The AA interventions focus on Education, Employment, Employability, Entrepreneurship and Essential Amenities.
Under Natural Resource Management projects, the main thrust is to combat the impact of climate change in rain-fed areas, through activities relating to rainwater harvesting, soil conservation, desilting, deepening and water resources conservation, which would include both cultivated and uncultivated lands. This intervention was started in Lote (Konkan Region of Maharashtra), where an Integrated Watershed Project was designed, focusing on harvesting rain water to make villagers water sufficient, motivate small farmers to opt for second crop from available water and focus on overall development of villagers. Water conservation work focuses on desilting, deepening and repairing existing structures and creating new structures like check dams. The Company has scaled-up its water conservation project in Marathwada region of Maharashtra. The geographical coverage of Jal Dhan during the FY 2018-19 is in 47 villages, 16 tehsils and 8 districts of Maharashtra.
Through Jal Dhan project more than 1,53,000 people have been benefited across Maharashtra, out of which 43,000 belongs to Affirmative community. The positive impact was seen by way of increase in ground water levels, increased water availability, sparing time and efforts of women spent in fetching water, enabling farmers to go for second crop, thus increasing incomes and improving livelihoods.
Along with water conservation, the Company has also focused on afforestation, to increase ground water level and soil conservation. In the last 5 years, the Company has planted more than 80,000 trees with 90% survival rate.

117
Business Responsibility Report
Under Model tribal village initiative, in the year 2018-19, the Company has worked in 5 villages to convert them into model villages. Tribal model village concept focuses on basic amenities, capacity building, education, economic empowerment, health and entitlements. Under health intervention, the Company conducts health camp in the villages every quarter and has identified 2 persons per village and trained them as Aarogya Doots, who supports the health intervention programme.
Going forward, these projects will be further intensified by covering additional areas in Maharashtra, Gujarat and other States.
5. Have you taken steps to ensure that this community development initiative is successfully adopted by the community? Please explain in 50 words, or so.
Yes. Most of our programmes are participatory in nature and focuses on institution development and capacity building. For example, Jal Dhan Project under Integrated Resource Management Project, in which we have constructed rain water harvesting structures and planted tree saplings, has enabled the community by providing sustainable water solutions for irrigation and producing hydro power for street lighting. By involving community based institutions in construction of water harvesting structures, the community members have developed a sense of ownership as they are involved in planning and implementation of the Projects.
Principle 9 - Businesses should engage with and provide value to their customers and consumers in a responsible manner.
1. What percentage of customer complaints/consumer cases are pending as on the end of financial year.
Product and packaging related customer complaints are listed below. All complaints are resolved and addressed, none are pending for resolution.
Complaint Type
Domestic International Total % Resolution
External 51 7 58 100
Internal 5 - 5 100
Total 56 7 63 100
2. Does the Company display product information on the product label, over and above what is mandated as per local laws? Yes/No/N.A./Remarks (additional information).
The Company displays what is required as per regulatory requirements. We comply with the requirements of the Insecticides Act, 1968; Insecticide Rules, 1971; Fertiliser (Control) Order 1985; Seeds Act, 1966; Seeds Rules, 1968; Legal Metrology Act, 2009 and Legal Metrology (Packaged Commodities) Rules, 2011 on respective product labels.
3. Is there any case filed by any stakeholder against the Company regarding unfair trade practices, irresponsible advertising and/or anti-competitive behaviour during the last five years and pending as on end of financial year? If so, provide details thereof, in about 50 words or so.
In the last five years, no case has been filed against the Company, and there is no pending case as on end of the financial year, regarding unfair trade practices, irresponsible advertising and/or anti-competitive behaviour.
4. Did the Company carry out any consumer survey/ consumer satisfaction trends?
The Company carries out Farmer and Channel partners’ satisfaction survey once every 2 years. The last survey was concluded in FY 2016-17. Next Survey is scheduled in June 2019. In FY 2018-19, the Company employed Net Promoter Score Survey, as a tool to collect customer feedback. More than 18,000 farmers were contacted across 18 key states and feedback was sought on products and services.

118 | 71st Annual Report 2018-19
Statutory ReportsRallis India Limited
Financial Statements

119
Standalone
Report on the Audit of the Standalone Financial StatementsOpinion
We have audited the accompanying standalone financial statements of Rallis India Limited (“the Company”), which comprise the standalone balance sheet as at 31 March 2019, the standalone statement of profit and loss (including other comprehensive income), the standalone statement of changes in equity and the standalone statement of cash flows for the year then ended, and notes to the standalone financial statements, including a summary of the significant accounting policies and other explanatory information (hereinafter referred to as “standalone financial statements”).
In our opinion and to the best of our information and according to the explanations given to us, the aforesaid standalone financial statements give the information required by the Companies Act, 2013 (‘the Act’) in the manner so required and give a true and fair view in conformity with the accounting principles generally accepted in India, of the state of affairs of the Company as at 31 March 2019, its profit and other comprehensive income, changes in equity and its cash flows for the year ended on that date.
Independent Auditors’ Report To the Members of Rallis India Limited
Basis for Opinion
We conducted our audit of the standalone financial statements in accordance with the Standards on Auditing (SAs) specified under Section 143 (10) of the Act. Our responsibilities under those SAs are further described in the Auditors’ Responsibility for the Audit of the Standalone Financial Statements section of our report. We are independent of the Company in accordance with the Code of Ethics issued by the Institute of Chartered Accountants of India together with the ethical requirements that are relevant to our audit of the standalone financial statements under the provisions of the Act and Rules thereunder, and we have fulfilled our other ethical responsibilities in accordance with these requirements and the Code of Ethics. We believe that the audit evidence we have obtained is sufficient and appropriate to provide a basis for our opinion.
Key Audit Matters
Key audit matters are those matters that, in our professional judgment, were of most significance in our audit of the standalone financial statements of the current period. These matters were addressed in the context of our audit of the standalone financial statements as a whole, and in forming our opinion thereon, and we do not provide a separate opinion on these matters.
Revenue recognitionThe Key Audit Matter How the matter was addressed in our auditRevenue is measured based on transaction price, which is the consideration, adjusted for rebates, discounts, incentives (scheme allowances) and estimated sales returns. As disclosed in Note 3.14 to the standalone financial statements, revenue is recognised upon transfer of control of promised goods to customers in an amount that reflects the consideration which the Company expects to receive in exchange for those goods.
Sales return estimationAs disclosed in Note 3.14 to the standalone financial statements, revenue is recognised net of sales returns.
Estimation of sales returns involves significant judgement and estimates due to its dependency on various internal and external factors.
Estimation of sales return amount together with the level of judgement involved makes its accounting treatment a significant matter for our audit.
Our audit procedures included following:
- Understanding the process followed by the management for the purpose of identifying and determining the amount of provision of sales returns and accrual for rebates and schemes;
- Checking of completeness and accuracy of the data used by the management for the purpose of calculation of the provision for sales returns and checking of its arithmetical accuracy;
- Comparison between the estimate of the provision for sales returns created in the past with subsequent actual sales returns and analysis of the nature of any deviations to corroborate the effectiveness of the management estimation process;
- Considering the appropriateness of the Company’s accounting policies regarding revenue recognition as they relate to accounting for rebates, discounts and scheme allowances;
- Testing the Company’s process and controls over the calculation of rebates, discounts and scheme allowance;

120 | 71st Annual Report 2018-19
Rallis India Limited Financial Statements
The Key Audit Matter How the matter was addressed in our audit
Accrual for rebates and schemes Revenue is recognised net of rebates, discounts, incentives (scheme allowances) and estimated sales returns owed to the customers based on the arrangement with customers.
The recognition and measurement of rebates, discounts and schemes allowances, including establishing an appropriate accrual at year end, involves significant judgement and estimates, particularly the expected level of claims of each of the customers.
The value of rebates, discounts and schemes allowances together with the level of judgement involved make its accounting treatment a significant matter for our audit.
- Selecting a samples of revenue transactions and scheme circular to re-check that rebates, discounts and scheme allowance were calculated in accordance with the eligibility criteria mentioned in the scheme circular;
- Selecting a sample of claims submitted by customers along with claim form and verifying it with the accrual made in the books of account; and
- Considering the assumptions and judgements used by the Company in calculating rebates, discounts and schemes allowances, including the level of expected claims, by reviewing historical trends of claims.
Investment in subsidiariesThe Key Audit Matter How the matter was addressed in our audit
The carrying amount of the investments in subsidiaries held at cost less impairment represents 16% of the Company’s total assets.
Recoverability of investments in subsidiaries un-dertakingWe do not consider the valuation of these investments to be at a high risk of significant misstatement, or to be subject to a significant level of judgment, except for the investment valuations based on projected cash flows which involve significant estimates and judgment, due to the inherent uncertainty involved in forecasting future cash flows. Further due to their materiality in the context of total assets of the Company, this is considered to be significant to our overall audit strategy and planning.
Our audit procedures included the following:
- Comparing the carrying amount of investments with the relevant subsidiary balance sheet to identify whether their net assets, being an approximation of their minimum recoverable amount, were in excess of their carrying amount and assessing whether those subsidiaries have historically been profit-making;
- For the investments where the carrying amount exceeded the net asset value, comparing the carrying amount of the investment with the expected value of the business based on a suitable multiple of the subsidiaries earnings or discounted cash flow analysis;
- Testing the assumptions and understanding the cash flows based on our knowledge of the Company and the markets in which the subsidiaries operate; and
- Considering the adequacy of disclosures in the standalone financial statements relating to the valuation of investments in subsidiaries.
Other Information
The Company’s Management and Board of Directors are responsible for the other information. The other information comprises the information included in the Company’s annual report, but does not include the financial statements and our auditors’ report thereon.
Our opinion on the standalone financial statements does not cover the other information and we do not express any form of assurance conclusion thereon.
In connection with our audit of the standalone financial statements, our responsibility is to read the other information and, in doing so, consider whether the other information
121
Standalone
is materially inconsistent with the standalone financial statements or our knowledge obtained in the audit or otherwise appears to be materially misstated. If, based on the work we have performed, we conclude that there is a material misstatement of this other information, we are required to report that fact. We have nothing to report in this regard.
Management’s Responsibility for the Standalone Financial Statements
The Company’s Management and Board of Directors is responsible for the matters stated in Section 134 (5) of the Act, with respect to the preparation of these standalone financial statements that give a true and fair view of the state of affairs, profit / loss and other comprehensive income, changes in equity and cash flows of the Company in accordance with the accounting principles generally accepted in India, including the Indian Accounting Standards (Ind AS) prescribed under Section 133 of the Act. This responsibility also includes maintenance of adequate accounting records in accordance with the provisions of the Act for safeguarding the assets of the Company and for preventing and detecting frauds and other irregularities; selection and application of appropriate accounting policies; making judgments and estimates that are reasonable and prudent; and design, implementation and maintenance of adequate internal financial controls that were operating effectively for ensuring the accuracy and completeness of the accounting records, relevant to the preparation and presentation of the standalone financial statements that give a true and fair view and are free from material misstatement, whether due to fraud or error.
In preparing the standalone financial statements, management and Board of Directors are responsible for assessing the Company’s ability to continue as a going concern, disclosing, as applicable, matters related to going concern and using the going concern basis of accounting unless management either intends to liquidate the Company or to cease operations, or has no realistic alternative but to do so.
Board of Directors is also responsible for overseeing the Company’s financial reporting process.
Auditors’ Responsibility for the Audit of the Standalone Financial Statements
Our objectives are to obtain reasonable assurance about whether the standalone financial statements as a whole
are free from material misstatement, whether due to fraud or error, and to issue an auditors’ report that includes our opinion. Reasonable assurance is a high level of assurance, but is not a guarantee that an audit conducted in accordance with SAs will always detect a material misstatement when it exists. Misstaments can arise from fraud or error and are considered material if, individually or in the aggregate, they could reasonably be expected to influence the economic decisions of users taken on the basis of these standalone financial statements.
As part of an audit in accordance with SAs, we exercise professional judgment and maintain professional skepticism throughout the audit. We also:
• Identify and assess the risks of material misstatement of the standalone financial statements, whether due to fraud or error, design and perform audit procedures responsive to those risks, and obtain audit evidence that is sufficient and appropriate to provide a basis for our opinion. The risk of not detecting a material misstatement resulting from fraud is higher than for one resulting from error, as fraud may involve collusion, forgery, intentional omissions, misrepresentations, or the override of internal control.
• Obtain an understanding of internal control relevant to the audit in order to design audit procedures that are appropriate in the circumstances. Under Section 143(3)(i) of the Act, we are also responsible for expressing our opinion on whether the Company has adequate internal financial controls system in place and the operating effectiveness of such controls.
• Evaluate the appropriateness of accounting policies used and the reasonableness of accounting estimates and related disclosures made by management.
• Conclude on the appropriateness of management’s use of the going concern basis of accounting and, based on the audit evidence obtained, whether a material uncertainty exists related to events or conditions that may cast significant doubt on the Company’s ability to continue as a going concern. If we conclude that a material uncertainty exists, we are required to draw attention in our auditor’s report to the related disclosures in the standalone financial statements or,

122 | 71st Annual Report 2018-19
Rallis India Limited Financial Statements
if such disclosures are inadequate, to modify our opinion. Our conclusions are based on the audit evidence obtained up to the date of our auditor’s report. However, future events or conditions may cause the Company to cease to continue as a going concern.
• Evaluate the overall presentation, structure and content of the standalone financial statements, including the disclosures, and whether the standalone financial statements represent the underlying transactions and events in a manner that achieves fair presentation.
We communicate with those charged with governance regarding, among other matters, the planned scope and timing of the audit and significant audit findings, including any significant deficiencies in internal control that we identify during our audit.
We also provide those charged with governance with a statement that we have complied with relevant ethical requirements regarding independence, and to communicate with them all relationships and other matters that may reasonably be thought to bear on our independence, and where applicable, related safeguards.
From the matters communicated with those charged with governance, we determine those matters that were of most significance in the audit of the standalone financial statements of the current period and are therefore the key audit matters. We describe these matters in our auditors’ report unless law or regulation precludes public disclosure about the matter or when, in extremely rare circumstances, we determine that a matter should not be communicated in our report because the adverse consequences of doing so would reasonably be expected to outweigh the public interest benefits of such communication.
Report on Other Legal and Regulatory Requirements
As required by the Companies (Auditor’s Report) Order, 2016 (‘the Order’), issued by the Central Government of India in terms of Section 143 (11) of the Act, we give in “Annexure A”, a statement on the matters specified in the paragraphs 3 and 4 of the Order, to the extent applicable.
(A) As required by Section 143 (3) of the Act, we report that:
(a) we have sought and obtained all the information and explanations, which to the best of our knowledge and belief, were necessary for the purposes of our audit;
(b) in our opinion, proper books of account as required by law have been kept by the Company so far as it appears from our examination of those books;
(c) the standalone balance sheet, the standalone statement of profit and loss (including other comprehensive income), the standalone statement of changes in equity and the standalone statement of cash flows dealt with by this report are in agreement with the books of account;
(d) in our opinion, the aforesaid standalone financial statements comply with the Indian Accounting Standards (Ind AS) prescribed under Section 133 of the Act;
(e) on the basis of the written representations received from the directors as on 31 March 2019 taken on record by the Board of Directors, none of the directors are disqualified as on 31 March 2019 from being appointed as a director in terms of Section 164 (2) of the Act; and
(f ) with respect to the adequacy of the internal financial controls with reference to the standalone financial statements of the Company and the operating effectiveness of such controls, refer to our separate Report in “Annexure B”.
(B) With respect to the other matters to be included in the Auditors’ Report in accordance with Rule 11 of the Companies (Audit and Auditors) Rules, 2014, in our opinion and to the best of our information and according to the explanations given to us:
i. the Company has disclosed the impact of pending litigations on its financial position in its standalone financial statements – Refer Note 40 to the standalone financial statements;

123
Standalone
ii. the Company did not have any long-term contracts, including derivative contracts, for which there were any material foreseeable losses;
iii. there has been no delay in transferring amounts, required to be transferred, to the Investor Education and Protection Fund by the Company during the year ended 31 March 2019; and
iv. the disclosures in the standalone financial statements regarding holdings as well as dealings in Specified Bank Notes during the period from 8 November 2016 to 30 December 2016 have not been made in these standalone financial statements since they do not pertain to the financial year ended 31 March 2019.
(C) With respect to the matter to be included in the Auditors’ Report under Section 197(16):
In our opinion and according to the information and explanations given to us, the remuneration paid by the Company to its directors during the current year is in accordance with the provisions of Section 197 of the Act. The remuneration paid to any director is not in excess of the limit laid down under Section 197 of the Act. The Ministry of Corporate Affairs has not prescribed other details under Section 197(16) which are required to be commented upon by us.
For B S R & Co. LLP
Chartered Accountants
Firm’s Registration No: 101248W/W-100022
Aniruddha Godbole
Mumbai Partner
25 April 2019 Membership No: 105149

124 | 71st Annual Report 2018-19
Rallis India Limited Financial Statements
Annexure A to the Independent Auditors’ Report – 31 March, 2019
With reference to the Annexure A referred to in the Independent Auditors’ Report to the members of the Company on the standalone financial statements for the year ended 31 March 2019, we report the following:
(i) (a) The Company has maintained proper records showing full particulars, including quantitative details and situation of property, plant and equipment and investment properties.
(b) The Company has a regular programme of physical verification of its property, plant and equipment and investment properties by which the property, plant and equipment and investment properties are verified by the management according to a phased programme designed to cover all the items over a period of three years. In our opinion, this periodicity of physical verification is reasonable having regard to the size of the Company and
the nature of its assets. In accordance with the policy, the Company has physically verified certain property, plant and equipment during the year and we are informed that no material discrepancies were noticed on such verification and the same have been dealt with in books of accounts.
(c) According to the information and explanations given to us and on the basis of our examination of the records of the Company, the title deeds of immovable properties (other than leasehold land) as disclosed in Note 4 and Note 5 to the standalone financial statements, are held in the name of the Company and in respect of leasehold lands, we have verified the lease agreements duly registered with the appropriate authorities as disclosed in Note 4 and Note 5 to the standalone financial statements, except the following:
Land / Building
No of cases Leasehold / Freehold
Gross block (` in lakhs)
Net block(` in lakhs)
Remarks
Building 12 Freehold 2.83 0.82 The agreements were not available for verification.
Building 2 Freehold 57.35 24.68 The Company has filed a declaration suit with regards to the title and is awaiting a decree. The certificate for shares held in the Cooperative Housing Society have been verified.
Land 1 Freehold 226.04 226.04 The said land is in the name of Rallis Hybrid Seeds Limited, an erstwhile company that was merged with the Company under Section 391 to 394 of the Companies Act, 1956 in terms of the approval of the Honorable High Court(s)
Land 1 Leasehold 1 - The agreement was not available for verification.
Land 1 Leasehold 1,623.05 1,451.28 The plot has been allotted and is in the possession of the Company. The lease deeds has not yet been executed by lessors.
(ii) The inventory, except for goods-in-transit and stocks lying with third parties, has been physically verified by the management during the year. In our opinion, the frequency of such verification is reasonable. In respect of stocks lying with third parties at the year-end, written confirmations have been obtained. The discrepancies noticed on verification between the physical stocks and the book records were not material and have been dealt with in books of account.
(iii) According to the information and explanations given to us, the Company has not granted any loans, secured or unsecured, to companies, firms, limited liability partnerships or other parties covered in the register maintained under Section 189 of the Companies Act, 2013 (‘the Act’). Accordingly, paragraphs 3 (iii) (a), (b) and (c) of the Order are not applicable to the Company.
(iv) In our opinion and according to the information and explanation given to us, the Company has not granted

125
Standalone
(` in lakhs)Name of Act Nature of Dues Amount
DemandedAmount not
Deposited Under Dispute
Period to which amount relates
Forum where dispute is pending
Sales Tax and Value Added Tax
Tax, Penalty and Interest
606.53 519.66 2000-01, 2001-02, 2005-06 to 2010-11, 2012-13 to 2014-15
Joint Commissioner (Appeals)
246.43 237.85 1990-91, 2000-01, 2001-02, 2006-07 to 2010-11, 2013-14
Additional Commissioner
513.23 263.51 1983-84, 1992-93, 1994-95, 1996-97 to 2001-02, 2003-04 to 2004-05, 2006-07 to 2013-14, 2014-15
Deputy Commissioner
any loans, or provided any guarantees or security to the parties covered under Section 185 of the Act. The Company has complied with the provisions of Section 186 of the Act in respect of the investments made.
(v) In our opinion, and according to the information and explanations given to us, the Company has not accepted deposits as per the directives issued by the Reserve Bank of India and the provisions of Sections 73 to 76 or any other relevant provisions of the Act and the rules framed thereunder. Accordingly, paragraph 3 (v) of the Order is not applicable to the Company.
(vi) We have broadly reviewed the books of accounts maintained by the Company pursuant to the rules prescribed by the Central Government for the maintenance of cost records under Section 148(1) of the Act and are of the opinion that prima facie, the prescribed accounts and records have been made and maintained.
(vii) (a) According to the information and explanations given to us and on the basis of our examination of the records of the Company, amounts deducted / accrued in the books of account in respect of undisputed statutory dues including Income-tax, Duty of customs, Provident fund, Employees’ State Insurance, Goods and Services tax, Cess and other material statutory dues have been regularly
deposited during the year with the appropriate authorities. According to the information and explanations given to us and on the basis of our examination of the records of the Company, amounts deducted / accrued in the books of account in respect of undisputed statutory dues including Profession tax have generally been regularly deposited during the year with the appropriate authorities, though there have been slight delays in few cases. As explained to us, the Company did not have any dues on account of wealth tax.
According to the information and explanations given to us, no undisputed amounts payable in respect of Provident fund, Employees’ State Insurance, Profession tax, Income-tax, Duty of customs, Goods and Services tax, Cess and other material statutory dues were in arrears as at 31 March 2019 for a period of more than six months from the date they became payable. Also, refer note 40 (c) to the standalone financial statements.
(b) According to the information and explanations given to us, there are no dues of Income-tax, Duty of customs, Duty of excise, Sales tax, Service tax, Value added tax and Goods and Services tax as at 31 March 2019, which have not been deposited with the appropriate authorities on account of any dispute, except as stated below:

126 | 71st Annual Report 2018-19
Rallis India Limited Financial Statements
(` in lakhs)Name of Act Nature of Dues Amount
DemandedAmount not
Deposited Under Dispute
Period to which amount relates
Forum where dispute is pending
95.46 58.89 1993-94, 1998-99, 1999-00, 2001-02, 2003-04, 2004-05, 2007-08 to 2009-10, 2014-15
Assistant Commissioner
180.42 118.14 1992-93, 1995-96 to 1999-2000, 2001-02, 2003-04, 2009-10, 2011-12, 2012-13, 2015-16
Tribunal
74.42 30.92 1990-91, 1996-97, 1997-98, 2001-02, 2002-03, 2012-13
Commercial Tax Officer
The Central Excise Act, 1944
Tax, Penalty and Interest
62.80 62.80 1999-2001 Joint Commissioner (Appeals)
87.83 62.69 1999-00, 2001-02, 2011-14, 2014-15, 2016-17, 2017-18
Deputy Commissioner
665.31 519.55 1986-87, 1996-97 to 2000-01, 2001-02, 2002-2004, 2016-17
Tribunal
The Finance Act, 1994
Tax, Penalty and Interest
6.74 6.74 2006-08, 2010-11 Assistant Commissioner
138.39 138.39 2007-13 to 2010-2014, 2014-16, 2016-17
Superintendent of Excise and Customs
10.23 10.23 2005-06 to 2009-10 Joint Commissioner
42.35 21.18 2009-10 Tribunal
Customs Act, 1962 Tax 144.10 144.10 1999-00 Tribunal
Income Tax Act, 1961
Income Tax 46.91 46.91 2016-17 Commissioner of Income Tax (Appeal)
(viii) In our opinion and according to the information and explanations given to us, the Company has not defaulted in repayment of loans to banks and government. The Company did not have any outstanding dues to financial institutions and debenture holders during the year.
(ix) According to the information and explanations given to us and based on our examination of the records of the Company, the Company has not raised any moneys
by way of initial public offer or further public offer (including debt instruments) and has not obtained any term loans during the year. Accordingly, paragraph 3 (ix) of the Order is not applicable to the Company.
(x) During the course of our examination of the books and records of the Company, carried out in accordance with the generally accepted auditing practices in India, and according to the information and explanations given

127
Standalone
to us, we have neither come across any instance of material fraud by the Company or on the Company by its officers or employees, noticed or reported during the year, nor have we been informed of any such case by the management.
(xi) According to the information and explanations given to us and based on our examination of the records of the Company, the Company has paid / provided for managerial remuneration in accordance with the requisite approvals mandated by the provisions of Section 197 read with Schedule V to the Act.
(xii) In our opinion and according to the information and explanations given to us, the Company is not a Nidhi company and the Nidhi Rules, 2014 are not applicable to it. Accordingly, paragraph 3 (xii) of the Order is not applicable to the Company.
(xiii) According to the information and explanations given to us and based on our examination of the records of the Company, transactions with the related parties are in compliance with Sections 177 and 188 of the Act where applicable and details of such transactions have
been disclosed in the standalone financial statements as required by applicable Ind AS.
(xiv) According to the information and explanations given to us and based on our examination of the records of the Company, the Company has not made any preferential allotment or private placement of shares or fully or partly convertible debentures during the year. Accordingly, paragraph 3 (xiv) of the Order is not applicable to the Company.
(xv) According to the information and explanations given to us and based on our examination of the records of the Company, the Company has not entered into any non-cash transactions with directors or persons connected with them. Accordingly, paragraph 3 (xv) of the Order is not applicable to the Company.
(xvi) In our opinion and according to the information and explanations given to us, the Company is not required to be registered under Section 45-IA of the Reserve Bank of India Act, 1934. Accordingly, paragraph 3 (xvi) of the Order is not applicable to the Company.
For B S R & Co. LLPChartered Accountants
Firm’s Registration No : 101248W/W-100022
Aniruddha GodboleMumbai Partner25 April 2019 Membership No: 105149

128 | 71st Annual Report 2018-19
Rallis India Limited Financial Statements
Annexure B to the Independent Auditors’ Report – 31 March, 2019
Report on the Internal Financial Controls with reference to the aforesaid standalone financial statements under Clause (i) of Sub-section 3 of Section 143 of the Companies Act, 2013 (“the Act”)
(Referred to in paragraph (A)(f) under ‘Report on Other Legal and Regulatory Requirements’ section of our report of even date)
Opinion
We have audited the internal financial controls with reference to standalone financial statements of Rallis India Limited (“the Company”) as of 31 March 2019 in conjunction with our audit of the standalone financial statements of the Company for the year ended on that date.
In our opinion, the Company has, in all material respects, adequate internal financial controls with reference to standalone financial statements and such internal financial controls were operating effectively as at 31 March 2019, based on the internal financial controls with reference to standalone financial statements criteria established by the Company considering the essential components of internal control stated in the Guidance Note on Audit of Internal Financial Controls Over Financial Reporting issued by the Institute of Chartered Accountants of India (the “Guidance Note”).
Management’s Responsibility for Internal Financial Controls
The Company’s management and the Board of Directors are responsible for establishing and maintaining internal financial controls based on the internal controls with reference to standalone financial statements criteria established by the Company considering the essential components of internal control stated in the Guidance Note. These responsibilities include the design, implementation and maintenance of adequate internal financial controls that were operating effectively for ensuring the orderly and efficient conduct of its business, including adherence to company’s policies, the safeguarding of its assets, the prevention and detection of frauds and errors, the accuracy and completeness of the accounting records, and the timely preparation of reliable financial information, as required under the Companies Act, 2013.
Auditors’ Responsibility
Our responsibility is to express an opinion on the Company's internal financial controls with respect to standalone financial statements based on our audit. We conducted our audit in accordance with the Guidance Note and the Standards on Auditing, prescribed under Section 143(10) of the Act, to the extent applicable to an audit of internal financial controls with reference to standalone financial statements. Those Standards and the Guidance Note require that we comply with ethical requirements and plan and perform the audit to obtain reasonable assurance about whether adequate internal financial controls with reference to standalone financial statements were established and maintained and whether such controls operated effectively in all material respects.
Our audit involves performing procedures to obtain audit evidence about the adequacy of the internal financial controls system with respect to standalone financial statements and their operating effectiveness. Our audit of internal financial controls with respect to standalone financial statements included obtaining an understanding of internal financial controls with respect to standalone financial statements, assessing the risk that a material weakness exists, and testing and evaluating the design and operating effectiveness of internal control based on the assessed risk. The procedures selected depend on the auditors’ judgement, including the assessment of the risks of material misstatement of the standalone financial statements, whether due to fraud or error.
We believe that the audit evidence we have obtained is sufficient and appropriate to provide a basis for our audit opinion on the Company’s internal financial controls system with reference to standalone financial statements.
Meaning of Internal Financial Controls with reference to Standalone Financial Statements
A company’s internal financial controls with reference to financial statements is a process designed to provide reasonable assurance regarding the reliability of financial reporting and the preparation of financial statements for

129
Standalone
external purposes in accordance with generally accepted accounting principles. A company’s internal financial controls with reference to financial statements include those policies and procedures that (1) pertain to the maintenance of records that, in reasonable detail, accurately and fairly reflect the transactions and dispositions of the assets of the company; (2) provide reasonable assurance that transactions are recorded as necessary to permit preparation of financial statements in accordance with generally accepted accounting principles, and that receipts and expenditures of the company are being made only in accordance with authorisations of management and directors of the company; and (3) provide reasonable assurance regarding prevention or timely detection of unauthorised acquisition, use, or disposition of the company’s assets that could have a material effect on the financial statements.
Inherent Limitations of Internal Financial Controls with reference to Standalone Financial Statements
Because of the inherent limitations of internal financial controls with reference to standalone financial statements, including the possibility of collusion or improper management override of controls, material misstatements due to error or fraud may occur and not be detected. Also, projections of any evaluation of the internal financial controls with reference to standalone financial statements to future periods are subject to the risk that the internal financial control with reference to standalone financial statements may become inadequate because of changes in conditions, or that the degree of compliance with the policies or procedures may deteriorate.
For B S R & Co. LLPChartered Accountants
Firm’s Registration No : 101248W/W-100022
Aniruddha GodboleMumbai Partner25 April 2019 Membership No: 105149

130 | 71st Annual Report 2018-19
Rallis India Limited Financial Statements
Notes As at 31 March, 2019
As at 31 March, 2018
ASSETSNon-current assetsa) Property, plant and equipment 4 34,930.38 34,275.35 b) Capital work-in-progress 4 1,278.49 1,206.45 c) Investment property 5 549.86 557.97 d) Other intangible assets 6 293.38 252.98 e) Intangible assets under development 6 1,184.50 1,261.55 f ) Financial assets i) Investments 7 30,949.85 30,955.04 ii) Loans 8 484.51 385.27 iii) Other financial assets 9 21.42 58.65 g) Income-tax assets (Net) 10 6,166.11 6,250.30 h) Other non-current assets 14 3,158.52 3,260.35 Total non-current assets 79,017.02 78,463.91 Current assetsa) Inventories 11 42,978.32 37,485.94 b) Financial assets i) Investments 7 5,949.34 8,014.43 ii) Trade receivables 12 41,697.36 36,532.91 iii) Cash and cash equivalents 13.1 3,490.93 272.57 iv) Bank balances other than (iii) above 13.2 257.39 296.59 v) Other financial assets 9 458.10 551.14 c) Other current assets 14 11,669.64 10,463.20
106,501.08 93,616.78 Assets classified as held for sale 15 - 1,264.90 Total current assets 106,501.08 94,881.68 Total assets 185,518.10 173,345.59 EQUITY AND LIABILITIESEquitya) Equity share capital 16 1,944.71 1,944.71 b) Other equity 17 122,891.02 115,939.97 Total equity 124,835.73 117,884.68 LiabilitiesNon-current liabilitiesa) Financial liabilities Borrowings 18 1,466.50 1,790.56 b) Provisions 23 2,028.49 1,431.68 c) Deferred tax liabilities (Net) 20 3,816.21 4,052.59 Total non-current liabilities 7,311.20 7,274.83 Current liabilitiesa) Financial liabilities i) Borrowings 19 5,295.86 14.59 ii) Trade payables 21 -total outstanding dues of micro enterprises and small enterprises 275.59 481.21 -total outstanding dues of creditors other than micro enterprises and small enterprises 35,681.23 36,384.16 iii) Other financial liabilities 22 8,789.10 7,737.02 b) Other current liabilities 24 1,429.44 1,959.39 c) Provisions 23 1,549.02 1,380.52 d) Income-tax liabilities (Net) 10 350.93 229.19 Total current liabilities 53,371.17 48,186.08 Total liabilities 60,682.37 55,460.91 Total equity and liabilities 185,518.10 173,345.59 See accompanying notes to the standalone financial statements 1 to 51
Standalone Balance Sheet as at 31 March, 2019All amounts are in ` lakhs unless otherwise stated
As per our report of even date attached
For B S R & Co. LLPChartered Accountants Firm’s Registration No. 101248W/W-100022
For and on behalf of the Board of Directors of Rallis India Limited PRAKASH R. RASTOGI(DIN: 00110862)
BHASKAR BHAT(DIN: 00148778)
Chairman
R. MUKUNDAN(DIN: 00778253)
SANJIV LAL (DIN: 08376952)
Managing Director & CEO
PUNITA KUMAR-SINHA (DIN: 05229262)
ASHISH MEHTA(M. No. 53039)
Chief Financial Officer
ANIRUDDHA GODBOLE PartnerMembership No. 105149
C.V. NATRAJ (DIN: 07132764)
DirectorsYASHASWIN SHETH (M. No. A15388)
Company Secretary
PADMINI KHARE KAICKER (DIN: 00296388)
Mumbai, 25 April, 2019 JOHN MULHALL (DIN: 08101474)
Mumbai, 25 April, 2019

131
Standalone
Standalone Statement of Profit and Loss for the year ended 31 March, 2019 All amounts are in ` lakhs except for earning per equity share information
As per our report of even date attached
For B S R & Co. LLPChartered Accountants Firm’s Registration No. 101248W/W-100022
For and on behalf of the Board of Directors of Rallis India Limited PRAKASH R. RASTOGI(DIN: 00110862)
BHASKAR BHAT(DIN: 00148778)
Chairman
R. MUKUNDAN(DIN: 00778253)
SANJIV LAL (DIN: 08376952)
Managing Director & CEO
PUNITA KUMAR-SINHA (DIN: 05229262)
ASHISH MEHTA(M. No. 53039)
Chief Financial Officer
ANIRUDDHA GODBOLE PartnerMembership No. 105149
C.V. NATRAJ (DIN: 07132764)
DirectorsYASHASWIN SHETH (M. No. A15388)
Company Secretary
PADMINI KHARE KAICKER (DIN: 00296388)
Mumbai, 25 April, 2019 JOHN MULHALL (DIN: 08101474)
Mumbai, 25 April, 2019
Notes For the year ended 31 March, 2019
For the year ended 31 March, 2018
I Revenue from operations 25 167,150.38 151,593.74
II Other income 26 2,571.99 893.39
III Total Income (I+II) 169,722.37 152,487.13
IV Expenses
Cost of materials consumed 27 93,955.70 70,405.75
Purchases of stock-in-trade 28 14,894.57 23,601.33
Changes in inventories of finished goods, stock-in-trade and work-in-progress 29 (7,237.86) (7,306.27)
Excise duty on sale of goods - 1,751.64
Employee benefits expense 30 13,846.64 12,565.34
Finance costs 31 486.34 329.47
Depreciation and amortisation expense 32 3,928.12 4,057.39
Other expenses 33 31,060.71 27,956.73
Total expenses (IV) 150,934.22 133,361.38
V Profit before tax (III-IV) 18,788.15 19,125.75
VI Tax expense
(1) Current tax 10 6,125.68 5,895.11
(2) Deferred tax 10 (235.36) (917.95)
Total tax expense (VI) 5,890.32 4,977.16
VII Profit for the year (V-VI) 12,897.83 14,148.59
VIII Other comprehensive income
Item that will not be reclassified to profit or loss :
a) Remeasurement of the employee defined benefit plans 81.19 247.28
b) Equity instruments through other comprehensive income (141.41) (196.96)
c) Income tax relating to items that will not be reclassified to profit or loss (25.50) (66.17)
Total other comprehensive income (net of taxes) (85.72) (15.85)
IX Total comprehensive income for the year (VII + VIII) 12,812.11 14,132.74
Earnings per equity share (of ` 1 each) 34
(1) Basic (In `) 6.63 7.28
(2) Diluted (In `) 6.63 7.28
See accompanying notes to the standalone financial statements 1 to 51

132 | 71st Annual Report 2018-19
Rallis India Limited Financial Statements
Standalone Statement of Changes in Equity for the year ended 31 March, 2019All amounts are in ` lakhs unless otherwise stated
A. Equity share capital
Balance as at 1 April, 2017 1,944.71
Changes in Equity Share Capital during the year -
Balance as at 31 March, 2018 1,944.71
Changes in Equity Share Capital during the year -
Balance as at 31 March, 2019 1,944.71
B. Other equity
Particulars
Other equity
Total other equity
Reserves & Surplus Other
Comprehensive Income
Securities premium
reserve
Retained earnings
Capital reserve
Capital redemption
reserve
General reserve
Equity instrument
through OCI
As at 1 April, 2017 8,793.88 74,755.94 1,243.10 8,151.77 17,649.93 0.39 110,595.01
Profit for the year - 14,148.59 - - - - 14,148.59
Other Comprehensive Income (Net of taxes) - 181.11 - - - (196.96) (15.85)
Total Comprehensive Income - 14,329.70 - - - (196.96) 14,132.74
Transfer to / (from) retained earnings - (196.96) - - - 196.96 -
Payment of dividends - (7,292.58) - - - - (7,292.58)
Payment of dividend distribution tax - (1,495.20) - - - - (1,495.20)
At 31 March, 2018 8,793.88 80,100.90 1,243.10 8,151.77 17,649.93 0.39 115,939.97
Profit for the year - 12,897.83 - - - - 12,897.83
Other Comprehensive Income (Net of taxes) - 55.69 - - - (141.41) (85.72)
Total Comprehensive Income - 12,953.52 - - - (141.41) 12,812.11
Transfer to / (from) retained earnings - (141.22) - - - 141.22 -
Payment of dividends - (4,861.72) - - - - (4,861.72)
Payment of dividend distribution tax - (999.34) - - - - (999.34)
At 31 March, 2019 8,793.88 87,052.14 1,243.10 8,151.77 17,649.93 0.20 122,891.02
As per our report of even date attached
For B S R & Co. LLPChartered Accountants Firm’s Registration No. 101248W/W-100022
For and on behalf of the Board of Directors of Rallis India Limited PRAKASH R. RASTOGI(DIN: 00110862)
BHASKAR BHAT(DIN: 00148778)
Chairman
R. MUKUNDAN(DIN: 00778253)
SANJIV LAL (DIN: 08376952)
Managing Director & CEO
PUNITA KUMAR-SINHA (DIN: 05229262)
ASHISH MEHTA(M. No. 53039)
Chief Financial Officer
ANIRUDDHA GODBOLE PartnerMembership No. 105149
C.V. NATRAJ (DIN: 07132764)
DirectorsYASHASWIN SHETH (M. No. A15388)
Company Secretary
PADMINI KHARE KAICKER (DIN: 00296388)
Mumbai, 25 April, 2019 JOHN MULHALL (DIN: 08101474)
Mumbai, 25 April, 2019

133
Standalone
Standalone Statement of Cash Flows for the year ended 31 March, 2019All amounts are in ` lakhs unless otherwise stated
For the year ended 31 March, 2019
For the year ended 31 March, 2018
A CASH FLOW FROM OPERATING ACTIVITIES:Profit before tax 18,788.15 19,125.75 Adjustments for : Finance costs 486.34 329.47 Depreciation and amortisation expense 3,928.12 4,057.39 Interest income (104.03) (54.50) Dividend income (283.63) (464.17) Credit balances written back (358.50) (230.29) Allowance for doubtful debts (net) 47.49 147.37 Allowance for doubtful advances 31.98 2.57 Investment write off 24.60 - Impairment of Intangible assets and intangible assets under development 138.52 - Bad debts 212.44 - Provision for indirect tax matters 10.00 33.50 Provision/(reversal) for Directors pension liability 722.92 - Provision/(reversal) for supplemental pay (41.52) (110.97) Provision/(reversal) for gratuity 107.77 83.57 Provision for compensated absences 21.83 111.86 Net unrealised foreign exchange (gain) / loss (416.96) 209.18 (Gain)/loss on disposal of property, plant and equipment 59.43 (12.51)Operating profit before working capital changes 23,374.95 23,228.22
Movements in working capital: (Increase)/decrease in trade receivables (5,810.26) (13,783.98) (Increase)/decrease in inventories (5,492.38) (13,037.07) (Increase)/decrease other financial assets (168.69) (120.72) (Increase)/decrease other assets (986.27) (4,649.84) Increase/(decrease) trade payables 252.79 13,780.89 Increase/(decrease) in other financial liabilities 780.26 663.48 Increase/(decrease) in other liabilities (529.95) (693.08)CASH GENERATED FROM OPERATIONS 11,420.45 5,387.90 Income taxes paid (Net of refunds) (5,920.77) (5,888.81)NET CASH FLOWS GENERATED / (USED IN) FROM OPERATING ACTIVITIES (A) 5,499.68 (500.91)
B CASH FLOW FROM INVESTING ACTIVITIES: Interest received 103.02 49.22 Dividend received 283.63 464.17 Purchase of current investments (11,781.27) (10,700.97) Payment for purchase of investment in equity shares (19.60) (337.64) Proceeds from sale of investments from equity shares - 1,314.64 Proceeds from sale of current investments 13,846.36 23,643.90 Payments for purchase of property , plant and equipment (including adjustments on account of capital work-in-progress, capital creditors and capital advances)
(3,259.00) (4,733.24)
Payments for intangible assets (177.20) (194.35) Proceeds from disposal of property , plant and equipment 32.88 25.63 Investments in bank deposits 74.33 (1.86)
NET CASH FLOWS (USED IN) / GENERATED FROM INVESTING ACTIVITIES (B) (896.85) 9,529.50

134 | 71st Annual Report 2018-19
Rallis India Limited Financial Statements
For the year ended 31 March, 2019
For the year ended 31 March, 2018
C CASH FLOW FROM FINANCING ACTIVITIES: Repayment of long-term borrowings (including current maturities) (308.49) (29.01) Proceeds from short-term borrowings 10,700.00 - Repayment of short-term borrowings (9,000.00) - Repayment of finance lease obligations (7.78) (9.73) Dividend paid on equity shares (including dividend distribution tax) (5,853.45) (8,766.66) Interest paid (488.41) (327.21) Bank balances in dividend account (7.61) (21.12)NET CASH FLOWS (USED IN) FINANCING ACTIVITIES (C) (4,965.74) (9,153.73)NET (DECREASE) / INCREASE IN CASH AND CASH EQUIVALENTS (A) + (B) + (C) (362.91) (125.14)CASH AND CASH EQUIVALENTS AT THE BEGINNING OF THE YEAR Cash in hand 2.15 2.55 Balances with banks in current account and deposit account 270.42 390.39 Bank overdrafts and cash credit facility (secured)* (14.59) (9.82)CASH AND CASH EQUIVALENTS AS PER NOTE 13.1 257.98 383.12
Net Cash and cash equivalents as per Cash flow statement (104.93) 257.98
CASH AND CASH EQUIVALENTS AT THE END OF THE YEAR Cash in hand 2.74 2.15 Balances with banks in current account and deposit account 3,488.19 270.42 Bank overdrafts and cash credit facility (secured)* (3,595.86) (14.59)CASH AND CASH EQUIVALENTS AS PER NOTE 13.1 (104.93) 257.98
Debt reconciliation statement in accordance with Ind AS 7Opening balancesLong-term borrowings (including current maturities) 2,106.82 2,145.56 Short-term borrowings (excluding bank overdrafts and cash credit facility) - -
MovementsLong-term borrowings (including current maturities) (316.27) (38.74)Short-term borrowings (excluding bank overdrafts and cash credit facility) 1,700.00 -
Closing balancesLong-term borrowings (including current maturities) 1,790.55 2,106.82 Short-term borrowings (excluding bank overdrafts and cash credit facility) 1,700.00 -* Bank overdrafts and cash credit facility are part of cash management system of the Company. Hence, considered as part of cash and cash equivalents.See accompanying notes to the standalone financial statements 1 to 51
Standalone Statement of Cash Flows for the year ended 31 March, 2019All amounts are in ` lakhs unless otherwise stated
As per our report of even date attached
For B S R & Co. LLPChartered Accountants Firm’s Registration No. 101248W/W-100022
For and on behalf of the Board of Directors of Rallis India Limited PRAKASH R. RASTOGI(DIN: 00110862)
BHASKAR BHAT(DIN: 00148778)
Chairman
R. MUKUNDAN(DIN: 00778253)
SANJIV LAL (DIN: 08376952)
Managing Director & CEO
PUNITA KUMAR-SINHA (DIN: 05229262)
ASHISH MEHTA(M. No. 53039)
Chief Financial Officer
ANIRUDDHA GODBOLE PartnerMembership No. 105149
C.V. NATRAJ (DIN: 07132764)
DirectorsYASHASWIN SHETH (M. No. A15388)
Company Secretary
PADMINI KHARE KAICKER (DIN: 00296388)
Mumbai, 25 April, 2019 JOHN MULHALL (DIN: 08101474)
Mumbai, 25 April, 2019

135
Standalone
1. Corporate Information Rallis India Limited (the ‘’Company’’) is a public limited
company domiciled in India and is incorporated under the provisions of the Companies Act applicable in India. The Company’s shares are listed on National Stock Exchange and Bombay Stock Exchange. It has been engaged primarily in the business of manufacture and marketing of Agri Inputs. The Company has its manufacturing facilities in India and sells both in India and across the globe. The Company’s registered office is at 156/157, 15th Floor, Nariman Bhavan, 227 Nariman Point, Mumbai 400 021.
Tata Chemicals Limited (“Tata Chemicals”) owns 50.06% of the Company’s equity share capital as at 31 March 2019.
The financial statements for the year ended 31 March, 2019 were approved by the Board of Directors and authorised for issue on 25 April, 2019.
2. Recent accounting pronouncement Standards issued but not yet effective
Ministry of Corporate Affairs (“MCA”) through Companies (Indian Accounting Standards) Amendment Rules, 2019 has notified the following new Ind AS which the Company has not applied as they are effective for annual periods beginning on or after April 1, 2019:
IND AS 116-Leases:
The new standard on leases sets out the principles for the recognition, measurement, presentation and disclosure of the leases. The core objective of this standard is to ensure that lessees and lessors provide relevant information in a manner that faithfully represent those transactions.
The Company is required to adopt Ind AS 116, Leases from 1 April, 2019. Ind AS 116 introduces a single, on-balance sheet lease accounting model for lessees. A lessee recognises a right-of-use asset representing its right to use the underlying asset and a lease liability representing its obligation to make lease payments. There are recognition exemptions for short-term leases and leases of low-value items. Lessor accounting remains similar to the current standard – i.e. lessors continue to classify leases as finance or operating leases. It replaces existing leases guidance, Ind AS 17, Leases.
Notes to the standalone financial statements for the year ended 31 March, 2019
The Company has completed an initial assessment of the potential impact on its standalone financial statements but has not yet completed its detailed assessment. The quantitative impact of adoption of Ind AS 116 on the standalone financial statements in the period of initial application is not reasonably estimable as at present.
- the total assets and liabilities on the balance sheet will increase with a decrease in net total assets, due to the depreciation of right of use assets being on a straight-line basis whilst the lease liability reduces by the principal amount of repayments;
- Interest expense will increase due to the unwinding of the effective interest rate implicit in the lease liability. Interest expense will be greater earlier in a lease’s life, due to the higher principal value, causing profit variability over the term of lease. This effect may be partially mitigated due to the number of leases held by the Company at various stages of their terms; and
- operating cash flows will be higher and financing cash flows will be lower, as repayment of the principal portion of all lease liabilities will be classified as financing activities.
The Company plans to apply Ind AS 116 initially on 1 April 2019, using the modified retrospective approach. Therefore, the cumulative effect of adopting Ind AS 116 will be recognised as an adjustment to the opening balance of retained earnings at 1 April 2019, with no restatement of comparative information.
The Company plans to apply the practical expedient to grandfather the definition of a lease on transition. This means that it will apply Ind AS 116 to all contracts entered into before 1 April 2019 and identified as leases in accordance with Ind AS 17.
In addition to the above, the following amendments to existing standards have been issued, are not yet effective and are not expected to have a significant impact on the Company’s standalone financial statements:
- Amendments to Ind AS 103, Business Combinations, and Ind AS 111, Joint Arrangements: This interpretation clarifies how an entity accounts for increasing its interest in a joint operation that meets the definition of a business.
136 | 71st Annual Report 2018-19
Rallis India Limited Financial Statements
Notes to the standalone financial statements for the year ended 31 March, 2019
- Amendments to Ind AS 109, Financial Instruments: amendments relating to the classification of particular pre payable financial assets.
- Amendments to Ind AS 12, Income Taxes, clarify that all income tax consequences of dividends (including payments on financial instruments classified as equity) are recognized consistently with the transactions that generated the distributable profits – i.e. in profit or loss, other comprehensive income or equity. Further Appendix C, uncertainty over income tax treatments has been added to clarify how entities should reflect uncertainties over income tax treatments, in particular when assessing the outcome a tax authority might reach with full knowledge and information if it were to make an examination.
- Amendment to Ind AS 19, Employee Benefits - The amendment to Ind AS 19 clarifies that on amendment, curtailment or settlement of a defined benefit plan, the current service cost and net interest for the remainder of the annual reporting period are calculated using updated actuarial assumptions – i.e. consistent with the calculation of a gain or loss on the plan amendment, curtailment or settlement. This amendment also clarifies that an entity first determines any past service cost, or a gain or loss on settlement, without considering the effect of the asset ceiling. This amount is recognized in profit or loss. The entity then determines the effect of the asset ceiling after plan amendment, curtailment or settlement. Any change in that effect is recognized in other comprehensive income (except for amounts included in net interest).
- Amendments to Ind AS 23, Borrowing Costs, clarify that the general borrowings pool used to calculate eligible borrowing costs excludes only borrowings that specifically finance qualifying assets that are still under development or construction.
Impact on adoption of above changes in standards is not material.
3. Significant accounting policies3.1 Statement of compliance
The Standalone financial statements have been prepared in accordance with Indian Accounting Standards (Ind AS) as per the Companies (Indian Accounting Standards) Rules, 2015 notified under Section 133 of Companies
Act, 2013, (the ‘Act’) and other relevant provisions of the Act.
3.2 Basis of preparation and measurement
The Standalone financial statements have been prepared on the historical cost basis, except for certain financial instruments which are measured at fair values at the end of each reporting period. Historical cost is based on the fair value of the consideration given in exchange for goods and services.
Fair value is the price that would be received to sell an asset or paid to transfer a liability in an orderly transaction between market participants at the measurement date, regardless of whether that price is directly observable or estimated using another valuation technique.
The fair value of an asset or a liability is measured using the assumptions that market participants would use when pricing the asset or liability, assuming that market participants act in their economic best interest.
A fair value measurement of a non-financial asset takes into account a market participant’s ability to generate economic benefits by using the asset in its highest and best use or by selling it to another market participant that would use the asset in its highest and best use.
The Company uses valuation techniques that are appropriate in the circumstances and for which sufficient data are available to measure fair value, maximising the use of relevant observable inputs and minimising the use of unobservable inputs.
All assets and liabilities for which fair value is measured or disclosed in the Standalone sinancial statements are categorised within the fair value hierarchy, described as follows, based on the lowest level input that is significant to the fair value measurement as a whole:
• Level 1 - Quoted (unadjusted) market prices in active markets for identical assets or liabilities
• Level 2 - Valuation techniques for which the lowest level input that is significant to the fair value measurement is directly or indirectly observable
• Level 3 - Valuation techniques for which the lowest level input that is significant to the fair value measurement is unobservable

137
Standalone
3.3 Functional and presentation currency
The Standalone financial statements are presented in Indian Rupees (INR), which is also the Company’s functional currency. All amounts have been rounded-off to the nearest ` lakhs, unless otherwise indicated.
3.4 Foreign currency translation
On initial recognition, all foreign currency transactions are translated into the functional currency using the exchange rates prevailing on the date of the transaction. As at the reporting date, foreign currency monetary assets and liabilities are translated at the exchange rate prevailing on the Balance Sheet date and the exchange gains or losses are recognised in the Standalone Statement of Profit and Loss.
3.5 Property plant and equipment (PPE)(a) Recognition and measurement
On adoption of Ind AS, the Company retained the carrying value for all of its property, plant and equipment as recognised in the financial statements as at the date of transition to Ind ASs, measured as per the previous GAAP and used that as its deemed cost as permitted by Ind AS 101 ‘First-time Adoption of Indian Accounting Standards’.
PPE are initially recognised at cost. The initial cost of PPE comprises its purchase price, including non-refundable duties and taxes net of any trade discounts and rebates. The cost of PPE includes interest on borrowings (borrowing cost) directly attributable to acquisition, construction or production of qualifying assets. Subsequent to initial recognition, PPE are stated at cost less accumulated depreciation (other than freehold land, which are stated at cost) and impairment losses, if any.
Subsequent costs are included in the asset’s carrying amount or recognised as a separate asset, as appropriate, only when it is probable that future economic benefits associated with the item will flow to the Company and the cost of the item can be measured reliably. The
carrying amount of any component accounted for as a separate asset is derecognised when replaced. All other repairs and maintenance are charged to profit or loss during the reporting period in which they are incurred.
Assets held under finance leases are depreciated over their expected useful lives on the same basis as owned assets. However, when there is no reasonable certainty that ownership will be obtained by the end of the lease term, assets are depreciated over the shorter of the lease term and useful lives.
The residual values, useful life and depreciation method are reviewed at each financial year-end to ensure that the amount, method and period of depreciation are consistent with previous estimates and the expected pattern of consumption of the future economic benefits embodied in the items of property, plant and equipment.
An item of property, plant and equipment is derecognised upon disposal or when no future economic benefits are expected to arise from the continued use of the asset. Any gain or loss arising on disposal or retirement of an item of property, plant and equipment is determined as the difference between sales proceeds and the carrying amount of the asset and is recognised in profit or loss. Fully depreciated assets still in use are retained in Standalone financial statements.
(b) Depreciation
Depreciation is recognised so as to write off the cost of assets (other than freehold land and capital work in progress) less their residual values over the useful lives, using the straight- line method (“SLM”). Management believes based on a technical evaluation (which is based on technical advice, taking into account the nature of the asset, the estimated usage of the asset, the operating conditions of the asset, past history of replacement, anticipated technological changes, manufacturers warranties and maintenance support, etc.) that the useful lives of the assets reflect the periods
Notes to the standalone financial statements for the year ended 31 March, 2019
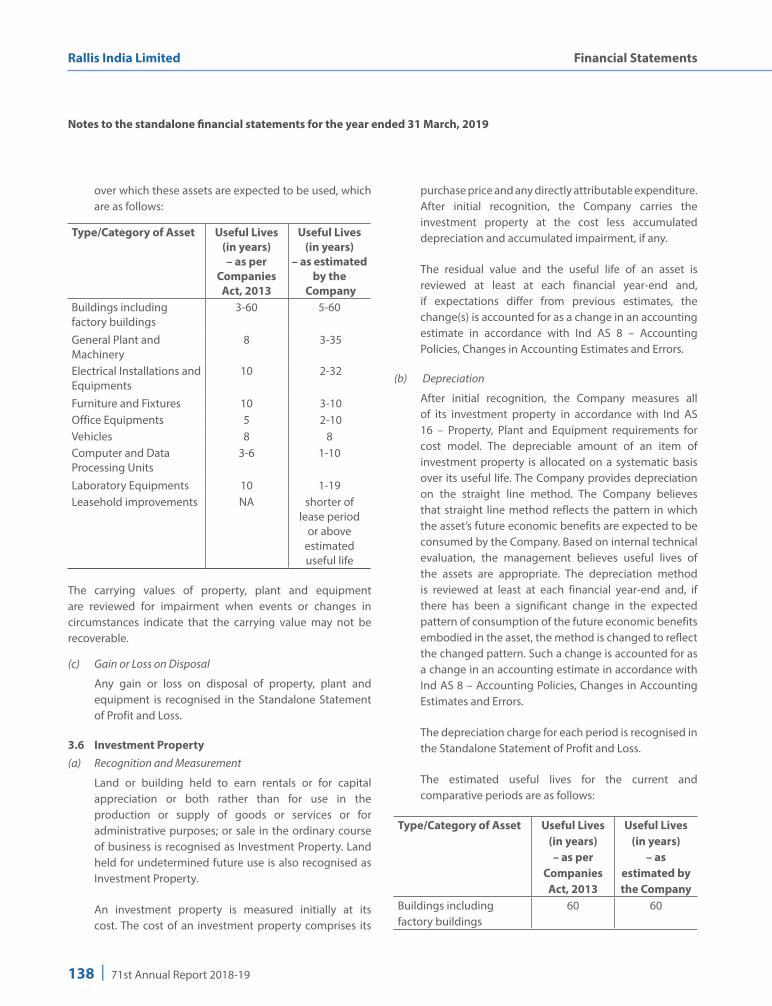
138 | 71st Annual Report 2018-19
Rallis India Limited Financial Statements
over which these assets are expected to be used, which are as follows:
Type/Category of Asset Useful Lives(in years)– as per
Companies Act, 2013
Useful Lives(in years)
– as estimated by the
CompanyBuildings including factory buildings
3-60 5-60
General Plant and Machinery
8 3-35
Electrical Installations and Equipments
10 2-32
Furniture and Fixtures 10 3-10Office Equipments 5 2-10Vehicles 8 8Computer and Data Processing Units
3-6 1-10
Laboratory Equipments 10 1-19Leasehold improvements NA shorter of
lease period or above
estimated useful life
The carrying values of property, plant and equipment are reviewed for impairment when events or changes in circumstances indicate that the carrying value may not be recoverable.
(c) Gain or Loss on Disposal
Any gain or loss on disposal of property, plant and equipment is recognised in the Standalone Statement of Profit and Loss.
3.6 Investment Property(a) Recognition and Measurement
Land or building held to earn rentals or for capital appreciation or both rather than for use in the production or supply of goods or services or for administrative purposes; or sale in the ordinary course of business is recognised as Investment Property. Land held for undetermined future use is also recognised as Investment Property.
An investment property is measured initially at its cost. The cost of an investment property comprises its
purchase price and any directly attributable expenditure. After initial recognition, the Company carries the investment property at the cost less accumulated depreciation and accumulated impairment, if any.
The residual value and the useful life of an asset is reviewed at least at each financial year-end and, if expectations differ from previous estimates, the change(s) is accounted for as a change in an accounting estimate in accordance with Ind AS 8 – Accounting Policies, Changes in Accounting Estimates and Errors.
(b) Depreciation
After initial recognition, the Company measures all of its investment property in accordance with Ind AS 16 – Property, Plant and Equipment requirements for cost model. The depreciable amount of an item of investment property is allocated on a systematic basis over its useful life. The Company provides depreciation on the straight line method. The Company believes that straight line method reflects the pattern in which the asset’s future economic benefits are expected to be consumed by the Company. Based on internal technical evaluation, the management believes useful lives of the assets are appropriate. The depreciation method is reviewed at least at each financial year-end and, if there has been a significant change in the expected pattern of consumption of the future economic benefits embodied in the asset, the method is changed to reflect the changed pattern. Such a change is accounted for as a change in an accounting estimate in accordance with Ind AS 8 – Accounting Policies, Changes in Accounting Estimates and Errors.
The depreciation charge for each period is recognised in the Standalone Statement of Profit and Loss.
The estimated useful lives for the current and comparative periods are as follows:
Type/Category of Asset Useful Lives(in years)– as per
Companies Act, 2013
Useful Lives(in years)
– as estimated by the Company
Buildings including factory buildings
60 60
Notes to the standalone financial statements for the year ended 31 March, 2019
139
Standalone
(c) Fair Value
Fair value of investment property is based on a valuation by an independent valuer who holds a recognised and relevant professional qualification and has recent experience in the location and category of the investment property being valued. The fair value of investment property is disclosed in the Note 5.
(d) Gain or Loss on Disposal
Any gain or loss on disposal of an Investment Property is recognised in the Standalone Statement of Profit and Loss.
3.7 Other intangible assets
Other intangible assets are measured on initial recognition at cost and subsequently are carried at cost less accumulated amortisation and accumulated impairment losses, if any.
An intangible asset is derecognised on disposal, or when no future economic benefits are expected from use or disposal. Gains or losses on derecognition are determined by comparing proceeds with carrying amount. These are included in profit or loss within other gains/(losses).
The Company amortises intangible assets with a finite useful life using the straight-line method over the following range of useful lives:
Type/Category of Asset Useful Lives (in years) – as estimated by the
CompanyProduct registrations 4Licenses and commercial rights 4Computer software 1-10
The estimated useful life is reviewed annually by the management.
3.8 Capital work-in-progress and intangible assets under development
Capital work-in-progress/intangible assets under development are carried at cost, comprising direct cost, related incidental expenses and attributable borrowing cost.
3.9 Non-derivative financial instruments
Financial assets and liabilities are recognised when the Company becomes a party to the contractual provisions
of the instrument. Financial assets and liabilities are initially measured at fair value. Transaction costs that are directly attributable to the acquisition or issue of financial assets and financial liabilities (other than financial assets and financial liabilities at fair value through profit or loss) are added to or deducted from the fair value measured on initial recognition of financial asset or financial liability.
Cash and cash equivalents
The Company considers all highly liquid financial instruments, which are readily convertible into known amounts of cash that are subject to an insignificant risk of change in value and having original maturities of three months or less from the date of purchase, to be cash equivalents. Cash and cash equivalents consist of balances with banks which are unrestricted for withdrawal and usage.
Financial assets at amortised cost
Financial assets are subsequently measured at amortised cost if these financial assets are held within a business whose objective is to hold these assets in order to collect contractual cash flows and the contractual terms of the financial asset give rise on specified dates to cash flows that are solely payments of principal and interest on the principal amount outstanding.
Financial assets at fair value through other comprehensive income (FVTOCI)
Financial assets are measured at fair value through other comprehensive income if these financial assets are held within a business whose objective is achieved by both collecting contractual cash flows that give rise on specified dates to solely payments of principal and interest on the principal amount outstanding and by selling financial assets.
The Company has made an irrevocable election to present subsequent changes in the fair value of equity investments not held for trading in Other Comprehensive Income.
Financial assets at fair value through profit or loss (FVTPL)
Financial assets are measured at fair value through profit or loss unless it is measured at amortised cost or at fair value through other comprehensive income on initial
Notes to the standalone financial statements for the year ended 31 March, 2019

140 | 71st Annual Report 2018-19
Rallis India Limited Financial Statements
recognition. The transaction costs directly attributable to the acquisition of financial assets and liabilities at fair value through profit or loss are immediately recognised in profit or loss.
Financial liabilities
Financial liabilities are measured at amortised cost using the effective interest method.
Equity instruments
An equity instrument is a contract that evidences residual interest in the assets of the Company after deducting all of its liabilities. Equity instruments recognised by the Company are measured at the proceeds received net off direct issue cost.
Offsetting of financial instruments
Financial assets and financial liabilities are offset and the net amount is reported in financial statements if there is a currently enforceable legal right to offset the recognised amounts and there is an intention to settle on a net basis, to realise the assets and settle the liabilities simultaneously.
3.10 Investments in subsidiaries
A subsidiary is an entity that is controlled by the Company.
The Company accounts for the investments in equity shares of subsidiaries at cost in accordance with Ind AS 27- Separate Financial Statements.
3.11 Derivative financial instruments
The Company enters into certain derivative contracts to hedge risks which are not designated as hedges. Such contracts are accounted for at fair value through profit or loss and are included in other gains/ (losses).
3.12 Impairment
Financial assets (other than at fair value)
The Company assesses on a forward looking basis the expected credit losses associated with its assets carried at amortised cost and FVTOCI debt instruments. The impairment methodology applied depends on whether there has been a significant increase in credit risk.
For trade receivables only, the Company applies the simplified approach permitted by Ind AS 109 Financial
Instruments, which requires expected lifetime losses to be recognised from initial recognition of the receivables.
PPE and intangibles assets
Property, plant and equipment and intangible assets with finite life are evaluated for recoverability whenever there is any indication that their carrying amounts may not be recoverable. If any such indication exists, the recoverable amount (i.e. higher of the fair value less cost to sell and the value-in-use) is determined on an individual asset basis unless the asset does not generate cash flows that are largely independent of those from other assets. In such cases, the recoverable amount is determined for the cash generating unit (CGU) to which the asset belongs.
If the recoverable amount of an asset (or CGU) is estimated to be less than its carrying amount, the carrying amount of the asset (or CGU) is reduced to its recoverable amount. An impairment loss is recognised in the Standalone Statement of Profit and Loss.
An impairment loss is reversed if there has been a change in the estimates used to determine the recoverable amount. Such a reversal is made only to the extent that the asset’s carrying amount does not exceed the carrying amount that would have been determined, net of depreciation or amortisation, if no impairment loss had been recognised.
3.13 Inventories
Inventories are valued at lower of cost (on weighted average basis) and net realisable value after providing for obsolescence and other losses, where considered necessary. Cost includes all charges in bringing the goods to their present location and condition, including octroi and other levies, transit insurance and receiving charges. Work-in-progress and finished goods include appropriate proportion of overheads. Net realisable value is the estimated selling price in the ordinary course of business, less the estimated costs of completion and the estimated costs necessary to make the sale.
3.14 Revenue recognition
Revenue is recognised upon transfer of control of promised goods to customers in an amount that reflects the consideration which the Company expects to receive in exchange for those goods.
Notes to the standalone financial statements for the year ended 31 March, 2019

141
Standalone
Revenue from the sale of goods is recognised at the point in time when control is transferred to the customer which is usually on dispatch / delivery.
Revenue is measured based on the transaction price, which is the consideration, adjusted for volume discounts, rebates, scheme allowances, price concessions, incentives, and returns, if any, as specified in the contracts with the customers. Revenue excludes taxes collected from customers on behalf of the government. Accruals for discounts/incentives and returns are estimated (using the most likely method) based on accumulated experience and underlying schemes and agreements with customers. Due to the short nature of credit period given to customers, there is no financing component in the contract.
The Company has adopted Ind AS 115 Revenue from contracts with customers, with effect from April 1, 2018. Ind AS 115 establishes principles for reporting information about the nature, amount, timing and uncertainty of revenues and cash flows arising from the contracts with its customers and replaces Ind AS 18 Revenue and Ind AS 11 Construction Contracts.
The Company has adopted Ind AS 115 using the cumulative effect method whereby the effect of applying this standard is recognised at the date of initial application (i.e. 1 April, 2018). Accordingly, the comparative information in the Standalone Statement of profit and loss is not restated. Impact on adoption of Ind AS 115 is not material.
3.14.1 Rendering of services
Income recognition for services takes place as and when the services are performed in accordance with IND AS 115
3.14.2 Interest Income
Interest income from financial assets is recognised when it is probable that economic benefits will flow to the Company and the amount of income can be measured reliably. Interest income is accrued on a time basis, by reference to the principal outstanding and at the effective interest rate applicable, which is the rate that exactly discounts estimated future cash receipts through the expected life of the financial assets to that asset’s net carrying amount on initial recognition.
3.14.3 Dividend
Dividend income from investments is recognised when the shareholder’s right to receive payment has been established (provided that it is probable that the economic benefits will flow to the Company and the amount of income can be measured reliably).
3.14.4 Insurance claims
Insurance claims are accounted for on the basis of claims admitted and to the extent that there is no uncertainty in receiving the claims.
3.14.5 Royalty on trademark license arrangements:
Royalty income is recognised on an accrual basis (provided that it is probable that the economic benefits will flow to the Company and the amount of revenue can be measured reliably). Such arrangements are based on sales made by the licensee and are recognised by reference to the compensation terms under the underlying arrangement.
3.15 Research and development expenses
Research expenditure is charged to the Standalone Statement of Profit and Loss. Development costs of products are also charged to the Standalone Statement of Profit and Loss unless a product’s technical feasibility has been established, in which case such expenditure is capitalised. Tangible assets used in research and development are capitalised.
3.16 Leases
Leases are classified as finance leases whenever the terms of lease transfer substantially all the risks and rewards of ownership to the lessee. Leases where a significant portion of the risks and rewards of ownership are retained by the lessor are classified as operating leases.
(i) Operating Lease:
Operating lease payments are recognised as an expense in the Statement of Profit and Loss on a straight-line basis over the lease term except where another systematic basis is more representative of the time pattern in which economic benefits from leased assets are consumed. The aggregate benefit of incentives (excluding inflationary increases where rentals are structured solely to
Notes to the standalone financial statements for the year ended 31 March, 2019

142 | 71st Annual Report 2018-19
Rallis India Limited Financial Statements
increase in line with the expected general inflation to compensate for the lessor’s inflationary cost increases, such increases are recognised in the year in which the benefits accrue) provided by the lessor is recognised as a reduction of rental expense over the lease term on a straight-line basis.
(ii) Finance Lease:
Assets held under finance leases are initially recognised as assets of the Company at their fair value at the inception of the lease or, if lower, at the present value of the minimum lease payments. The corresponding liability to the lessor is included in the Balance Sheet as a finance lease obligation.
Assets held under finance leases are depreciated over their expected useful lives on the same basis as owned assets or, where shorter, the term of the relevant lease. Lease payments are apportioned between finance expenses and reduction of the lease obligation so as to achieve a constant rate of interest on the remaining balance of the liability. Finance expenses are recognized immediately in profit or loss, unless they are directly attributable to qualifying assets, in which case they are capitalized in accordance with the Company’s general policy on borrowing costs. Contingent rentals are recognised as expenses in the periods in which they are incurred.
3.17 Non-current assets held for sale
Non-current assets and disposal groups are classified as held for sale if their carrying amount will be recovered principally through a sale transaction rather than through continuing use. This condition is regarded as met only when the asset (or disposal group) is available for immediate sale in its present condition subject only to terms that are usual and customary for sales of such asset (or disposal group) and its sale is highly probable. Management must be committed to the sale, which should be expected to qualify for recognition as a completed sale within one year from the date of classification.
When the Company is committed to a sale plan involving disposal of an investment, the investment that will be disposed of is classified as held for sale when the criteria described above are met.
Non-current assets (and disposal groups) classified as held for sale are measured at the lower of their carrying amount and fair value less costs to sell.
3.18 Employee benefit expenses
Employee benefits consist of contribution to provident fund, superannuation fund, gratuity fund, compensated absences, supplemental pay and director pension liability.
3.18.1.1 Post-employment benefit plans
Defined Contribution plans
Payments to defined contribution retirement benefit scheme for eligible employees in the form of superannuation fund are charged as an expense as they fall due. Such benefits are classified as Defined Contribution Schemes as the Company does not carry any further obligations, apart from the contributions made.
Defined benefit plans
The Company operates various defined benefit plans- gratuity fund, supplemental pay and director pension liability.
The Company also makes contribution towards provident fund, in substance a defined contribution retirement benefit plan. The provident fund is administered by the Trustees of the Rallis India Limited Provident Fund. The rules of the Company’s provident fund administered by the Trust, require that if the Board of Trustees are unable to pay interest at the rate declared by the Employees’ Provident Fund by the Government under para 60 of the Employees’ Provident Fund Scheme, 1952 for the reason that the return on investment is less or for any other reason, then the deficiency shall be made good by the Company. Having regard to the assets of the fund and the return on the investments, the Company does not expect any deficiency as at the year end.
The liability or asset recognised in the balance sheet in respect of its defined benefit plans is the present value of the defined benefit obligation at the end of the reporting period less the fair value of plan assets. The defined benefit obligation is calculated annually by actuaries using the projected unit credit method.
Notes to the standalone financial statements for the year ended 31 March, 2019

143
Standalone
The present value of the said obligation is determined by discounting the estimated future cash outflows, using market yields of government bonds that have tenure approximating the tenures of the related liability.
The interest income / (expense) are calculated by applying the discount rate to the net defined benefit liability or asset. The net interest income / (expense) on the net defined benefit liability or asset is recognised in the Standalone Statement of Profit and loss.
Remeasurement gains and losses arising from experience adjustments and changes in actuarial assumptions are recognised in the period in which they occur, directly in other comprehensive income. They are included in retained earnings in the Standalone Statement of Changes in Equity and in the Standalone Balance Sheet.
Changes in the present value of the defined benefit obligation resulting from plan amendments or curtailments are recognised immediately in profit or loss as past service cost.
3.18.2 Short term employee benefit
Compensated absences which accrue to employees and which can be carried to future periods but are expected to be encashed or availed in twelve months immediately following the year end are reported as expenses during the year in which the employees perform the services that the benefit covers and the liabilities are reported at the undiscounted amount of the benefits after deducting amounts already paid. Where there are restrictions on availment of encashment of such accrued benefit or where the availment or encashment is otherwise not expected to wholly occur in the next twelve months, the liability on account of the benefit is actuarially determined using the projected unit credit method.
3.19 Borrowing cost
Borrowing costs are interest and ancillary costs incurred in connection with the arrangement of borrowings. General and specific borrowing costs attributable to acquisition and construction of any qualifying asset (one that takes a substantial period of time to get ready for its designated use or sale) are capitalised until such time as the assets are substantially ready for their intended
use or sale, and included as part of the cost of that asset. Investment income earned on the temporary investment of specific borrowings pending their expenditure on qualifying assets is deducted from the borrowing costs eligible for capitalisation. All the other borrowing costs are recognised in the Statement of Profit and Loss within Finance costs of the period in which they are incurred.
3.20 Segment reporting
Operating segments are defined as components of an enterprise for which discrete financial information is available that is evaluated regularly by the chief operating decision maker, in deciding how to allocate resources and assessing performance. The Company’s chief operating decision maker is the Managing Director & CEO of the Company.
Segment revenue, segment expenses, segment assets and segment liabilities have been identified to segments on the basis of their relationship to the operating activities of the segment. Inter segment revenue is accounted on the basis of transactions which are primarily determined based on market / fair value factors. Revenue, expenses, assets and liabilities which relate to the Company as a whole and are not allocable to segments on a reasonable basis have been included under “unallocated revenue / expenses / assets / liabilities”.
3.21 Income tax
Income tax expense comprises current tax expense and the net change in the deferred tax asset or liability during the year. Current and deferred taxes are recognised in Standalone Statement of Profit and Loss, except when they relate to items that are recognised in other comprehensive income or directly in equity, in which case, the current and deferred tax are also recognised in other comprehensive income or directly in equity, respectively.
Current tax
Current tax is measured at the amount of tax expected to be payable on the taxable income for the year as determined in accordance with the provisions of the Income Tax Act, 1961.
Notes to the standalone financial statements for the year ended 31 March, 2019

144 | 71st Annual Report 2018-19
Rallis India Limited Financial Statements
Current tax assets and current tax liabilities are offset when there is a legally enforceable right to set off the recognized amounts and there is an intention to settle the asset and the liability on a net basis.
Deferred tax
Deferred income tax assets and liabilities are recognised for deductible and taxable temporary differences arising between the tax base of assets and liabilities and their carrying amount, except when the deferred income tax arises from the initial recognition of an asset or liability in a transaction that is not a business combination and affects neither accounting nor taxable profit or loss at the time of the transaction.
Deferred tax assets are recognised only to the extent that it is probable that either future taxable profits or reversal of deferred tax liabilities will be available, against which the deductible temporary differences, and the carry forward of unused tax credits and unused tax losses can be utilised.
The carrying amount of a deferred tax asset shall be reviewed at the end of each reporting date and reduced to the extent that it is no longer probable that sufficient taxable profit will be available to allow all or part of the deferred income tax asset to be utilised.
Deferred tax assets and liabilities are measured using the tax rates and tax laws that have been enacted or substantively enacted by the end of the reporting period and are expected to apply when the related deferred tax asset is realised or the deferred tax liability is settled.
Deferred tax assets and liabilities are offset when there is a legally enforceable right to offset current tax assets and liabilities and when the deferred tax balances relate to the same taxation authority.
3.22 Accounting of Provisions, Contingent Liabilities and Contingent Assets
Provisions are recognised, when there is a present legal or constructive obligation as a result of past events, where it is probable that there will be outflow of resources to settle the obligation and when a reliable estimate of the amount of the obligation can be made. Where a provision is measured using the cash flows estimated to settle the present obligation, its carrying amount is the present value of those cash flows. Where
the effect is material, the provision is discounted to net present value using an appropriate current market-based pre-tax discount rate and the unwinding of the discount is included in finance costs.
Contingent liabilities are recognised only when there is a possible obligation arising from past events, due to occurrence or non-occurrence of one or more uncertain future events, not wholly within the control of the Company, or where any present obligation cannot be measured in terms of future outflow of resources, or where a reliable estimate of the obligation cannot be made. Obligations are assessed on an ongoing basis and only those having a largely probable outflow of resources are provided for.
Contingent assets are not disclosed in the financial statements unless an inflow of economic benefits is probable.
3.23 Dividend to Equity shareholders
Dividend to equity shareholders is recognised as a liability and deducted from shareholders’ Equity, in the period in which the dividends are approved by the equity shareholders in the general meeting.
3.24 Earnings per share (EPS)
Basic EPS is computed by dividing the Profit or loss attributable to the equity shareholders of the Company by the weighted average number of Ordinary shares outstanding during the year. Diluted EPS is computed by adjusting the profit or loss attributable to the ordinary equity shareholders and the weighted average number of ordinary equity shares, for the effects of all dilutive potential Ordinary shares.
3 A. Critical accounting judgements and key sources of estimation uncertainty
The preparation of the financial statements in conformity with the Ind AS requires management to make judgements, estimates and assumptions that affect the application of accounting policies and the reported amounts of assets, liabilities and disclosures as at date of the financial statements and the reported amounts of the revenues and expenses for the years presented. The estimates and associated assumptions are based on historical experience and other factors that are considered to be relevant. Actual results may differ
Notes to the standalone financial statements for the year ended 31 March, 2019
145
Standalone
from these estimates under different assumptions and conditions.
The estimates and underlying assumptions are reviewed on an ongoing basis. Revisions to accounting estimates are recognized in the period in which the estimate is revised if the revision affects only that period, or in the period of the revision and future periods if the revision affects both current and future periods.
(i) Critical Judgements
In the process of applying the Company’s accounting policies, management has made the following judgements, which have the most significant effect on the amounts recognisd in the financial statements:
Discount rate used to determine the carrying amount of the Company’s employee defined benefit obligation
In determining the appropriate discount rate for plans operated in India, the management considers the interest rates of government bonds in currencies consistent with the currencies of the post-employment benefit obligation.
Contingences and commitments
In the normal course of business, contingent liabilities may arise from litigations and other claims against the Company. Where the potential liabilities have a low probability of crystallising or are very difficult to quantify reliably, we treat them as contingent liabilities. Such liabilities are disclosed in the notes but are not provided for in the financial statements. Although there can be no assurance regarding the final outcome of the legal proceedings, we do not expect them to have a materially adverse impact on our financial position or profitability.
(ii) Key sources of estimation uncertainty
The key assumptions concerning the future, and other key sources of estimation uncertainty at the end of the reporting period, that have a significant risk of causing a material adjustment to the carrying amounts of assets and liabilities within the next financial year are discussed below:
Useful lives of property, plant and equipment
As described in Note 3.5, the Company reviews the estimated useful lives and residual values of property,
plant and equipment at the end of each reporting period. During the current financial year, the management has reassessed the useful lives of certain property, plant and equipment and the impact of the change is not material for the year. There were no changes in residual values of the property, plant and equipment.
Allowances for doubtful debts
The Company makes allowances for doubtful debts based on an assessment of the recoverability of trade and other receivables. The identification of doubtful debts requires use of judgments and estimates. Where the expectation is different from the original estimate, such difference will impact the carrying value of the trade and other receivables and doubtful debts expenses in the period in which such estimate has been changed.
Allowances for inventories
Management reviews the inventory age listing on a periodic basis. This review involves comparison of the carrying value of the aged inventory items with the respective net realizable value. The purpose is to ascertain whether an allowance is required to be made in the financial statements for any obsolete and slow-moving items. Management is satisfied that adequate allowance for obsolete and slow-moving inventories has been made in the financial statements.
Liability for sales return
In making judgment for liability for sales return, the management considered the detailed criteria for the recognition of revenue from the sale of goods set out in Ind AS 115 and in particular, whether the Company had transferred to the buyer the significant risk and rewards of ownership of the goods. Following the detailed quantification of the Company’s liability towards sales return, the management is satisfied that significant risk and rewards have been transferred and that recognition of the revenue in the current year is appropriate, in conjunction with the recognition of an appropriate liability for sales return.
Accruals for estimated product returns, which are based on historical experience of actual sales returns and adjustment on account of current market scenario is considered by Company to be reliable estimate of future sales returns.
Notes to the standalone financial statements for the year ended 31 March, 2019
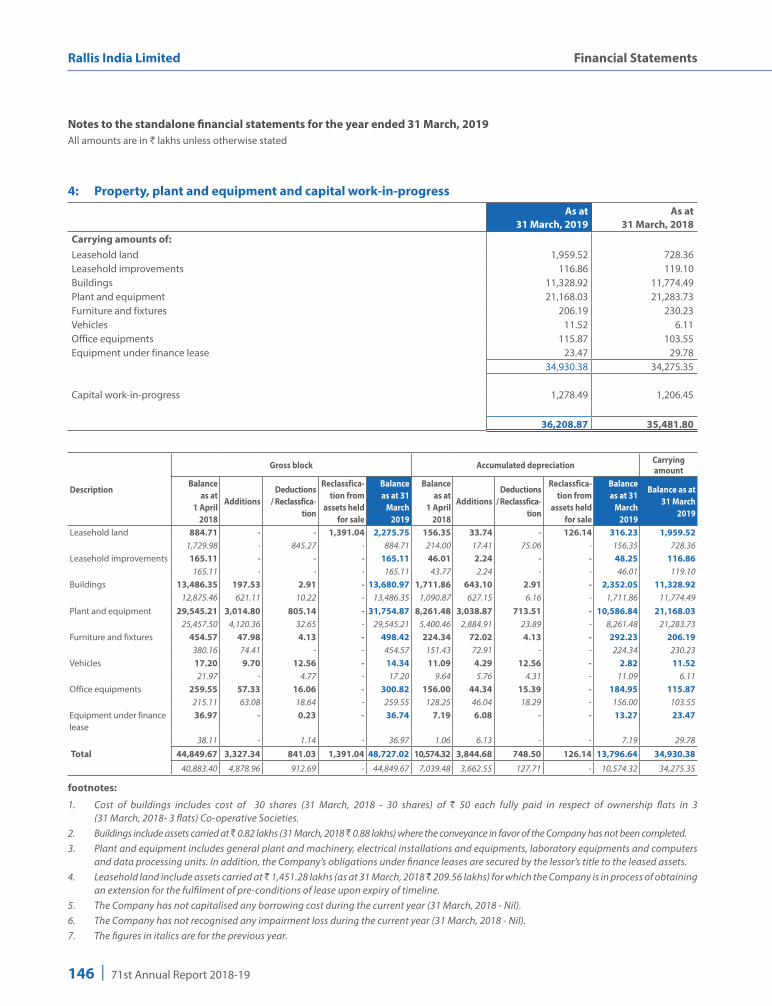
146 | 71st Annual Report 2018-19
Rallis India Limited Financial Statements
Notes to the standalone financial statements for the year ended 31 March, 2019All amounts are in ` lakhs unless otherwise stated
4: Property, plant and equipment and capital work-in-progressAs at
31 March, 2019As at
31 March, 2018Carrying amounts of:Leasehold land 1,959.52 728.36 Leasehold improvements 116.86 119.10 Buildings 11,328.92 11,774.49 Plant and equipment 21,168.03 21,283.73 Furniture and fixtures 206.19 230.23 Vehicles 11.52 6.11 Office equipments 115.87 103.55 Equipment under finance lease 23.47 29.78
34,930.38 34,275.35
Capital work-in-progress 1,278.49 1,206.45
36,208.87 35,481.80
Description
Gross block Accumulated depreciation Carrying amount
Balance as at
1 April 2018
AdditionsDeductions
/ Reclassfica-tion
Reclassfica-tion from
assets held for sale
Balance as at 31
March 2019
Balance as at
1 April 2018
AdditionsDeductions
/ Reclassfica-tion
Reclassfica-tion from
assets held for sale
Balance as at 31
March 2019
Balance as at 31 March
2019
Leasehold land 884.71 - - 1,391.04 2,275.75 156.35 33.74 - 126.14 316.23 1,959.52 1,729.98 - 845.27 - 884.71 214.00 17.41 75.06 - 156.35 728.36
Leasehold improvements 165.11 - - - 165.11 46.01 2.24 - - 48.25 116.86 165.11 - - - 165.11 43.77 2.24 - - 46.01 119.10
Buildings 13,486.35 197.53 2.91 - 13,680.97 1,711.86 643.10 2.91 - 2,352.05 11,328.92 12,875.46 621.11 10.22 - 13,486.35 1,090.87 627.15 6.16 - 1,711.86 11,774.49
Plant and equipment 29,545.21 3,014.80 805.14 - 31,754.87 8,261.48 3,038.87 713.51 - 10,586.84 21,168.03 25,457.50 4,120.36 32.65 - 29,545.21 5,400.46 2,884.91 23.89 - 8,261.48 21,283.73
Furniture and fixtures 454.57 47.98 4.13 - 498.42 224.34 72.02 4.13 - 292.23 206.19 380.16 74.41 - - 454.57 151.43 72.91 - - 224.34 230.23
Vehicles 17.20 9.70 12.56 - 14.34 11.09 4.29 12.56 - 2.82 11.52 21.97 - 4.77 - 17.20 9.64 5.76 4.31 - 11.09 6.11
Office equipments 259.55 57.33 16.06 - 300.82 156.00 44.34 15.39 - 184.95 115.87 215.11 63.08 18.64 - 259.55 128.25 46.04 18.29 - 156.00 103.55
Equipment under finance lease
36.97 - 0.23 - 36.74 7.19 6.08 - - 13.27 23.47
38.11 - 1.14 - 36.97 1.06 6.13 - - 7.19 29.78 Total 44,849.67 3,327.34 841.03 1,391.04 48,727.02 10,574.32 3,844.68 748.50 126.14 13,796.64 34,930.38
40,883.40 4,878.96 912.69 - 44,849.67 7,039.48 3,662.55 127.71 - 10,574.32 34,275.35
footnotes:
1. Cost of buildings includes cost of 30 shares (31 March, 2018 - 30 shares) of ` 50 each fully paid in respect of ownership flats in 3 (31 March, 2018- 3 flats) Co-operative Societies.
2. Buildings include assets carried at ` 0.82 lakhs (31 March, 2018 ` 0.88 lakhs) where the conveyance in favor of the Company has not been completed.3. Plant and equipment includes general plant and machinery, electrical installations and equipments, laboratory equipments and computers
and data processing units. In addition, the Company’s obligations under finance leases are secured by the lessor’s title to the leased assets.4. Leasehold land include assets carried at ̀ 1,451.28 lakhs (as at 31 March, 2018 ̀ 209.56 lakhs) for which the Company is in process of obtaining
an extension for the fulfilment of pre-conditions of lease upon expiry of timeline.5. The Company has not capitalised any borrowing cost during the current year (31 March, 2018 - Nil).6. The Company has not recognised any impairment loss during the current year (31 March, 2018 - Nil).7. The figures in italics are for the previous year.

147
Standalone
Notes to the standalone financial statements for the year ended 31 March, 2019All amounts are in ` lakhs unless otherwise stated
5: Investment propertyAs at
31 March, 2019As at
31 March, 2018Carrying amounts of:Freehold land 244.91 244.91 Buildings 304.95 313.06 Total 549.86 557.97
Description
Gross block Accumulated depreciationCarrying amount
Balance as at 1 April
2018Additions Deductions
Balance as at 31 March
2019
Balance as at 1 April
2018Additions Deductions
Balance as at 31 March
2019
Balance as at 31 March
2019Freehold land 244.91 - - 244.91 - - - - 244.91
244.91 - - 244.91 - - - - 244.91 Buildings 337.19 - - 337.19 24.13 8.11 - 32.24 304.95
337.19 - - 337.19 16.03 8.10 - 24.13 313.06 Total 582.10 - - 582.10 24.13 8.11 - 32.24 549.86
582.10 - - 582.10 16.03 8.10 - 24.13 557.97
footnotes:
1. Buildings includes 10 flats (31 March, 2018 - 10 flats)which are classified as Investment property by the Company in accordance with IND AS-40 “Investment Property’’.
2. Cost of buildings includes cost of 35 shares (31 March, 2018 - 35 shares) of ` 50 each fully paid and cost of 7 shares (31 March, 2018- 7 shares) of ` 100 each fully paid in respect of ownership flats in 7 (31 March, 2018- 7 flats) Co-operative Societies.
3. The Company has not capitalised any borrowing cost during the current year (31 March, 2018 - Nil).
4. The Company has not recognised any impairment loss during the current year (31 March, 2018 - Nil).
5. Total fair value of Investment Property is ` 31,356.16 lakhs (31 March, 2018 ` 31,356.16 lakhs).
6. The figures in italics are for the previous year.
Fair Value HeirarchyThe fair value of investment property has been determined by external independent property valuers, having appropriate recognised professional qualification and recent experience in the location and category of the property being valued.
The fair value measurement for all of the investment property has been categoried as a level 3 fair value based on the inputs to the valuation techniques used.
Description of Valuation Technique used:The Company obtains Independent Valuations of its investment property as per requirement of Ind AS 40. The fair value of the investment property have been derived using the Direct Comparison Method.The direct comparison approach involves a comparison of the investment property to similar properties that have actually been sold in arms-length distance from investment property or are offered for sale in the same region. This approach demonstrates what buyers have historically been willing to pay (and sellers willing to accept) for similar properties in an open and competitive market, and is particularly useful in estimating the value of the land and properties that are typically traded on a unit basis. This approach leads to a reasonable estimation of the prevailing price. Given that the comparable instances are located in close proximity to the investment property; these instances have been assessed for their locational comparative advantages and disadvantages while arriving at the indicative price assessment for investment property.
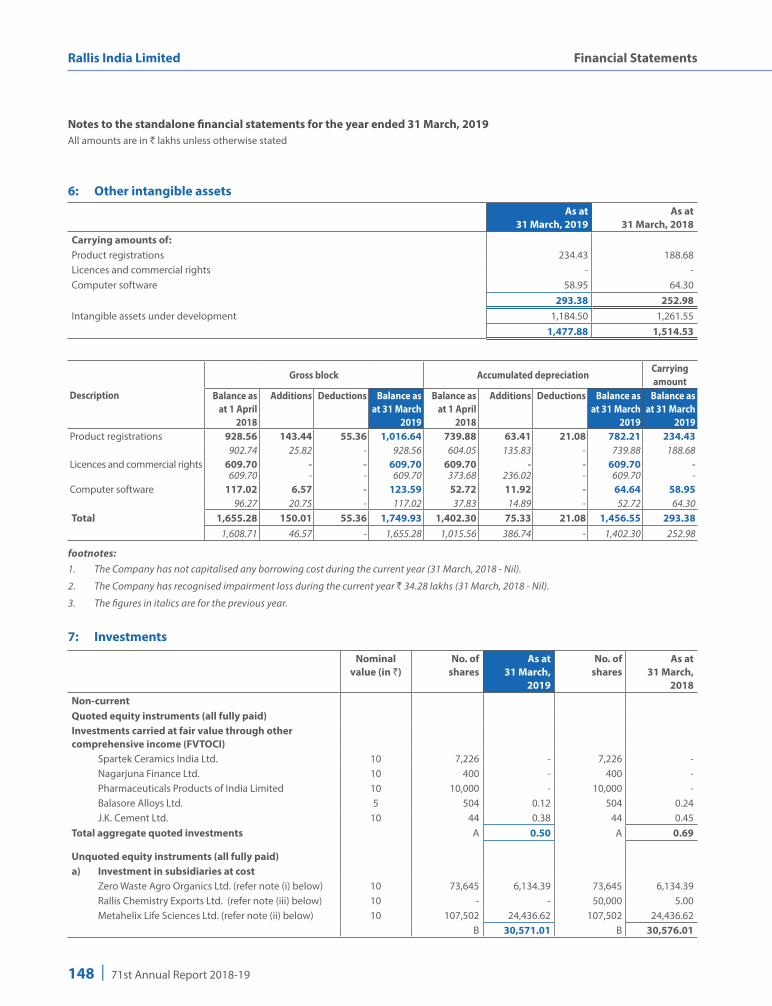
148 | 71st Annual Report 2018-19
Rallis India Limited Financial Statements
Notes to the standalone financial statements for the year ended 31 March, 2019All amounts are in ` lakhs unless otherwise stated
6: Other intangible assetsAs at
31 March, 2019As at
31 March, 2018Carrying amounts of:Product registrations 234.43 188.68 Licences and commercial rights - - Computer software 58.95 64.30
293.38 252.98 Intangible assets under development 1,184.50 1,261.55
1,477.88 1,514.53
Description
Gross block Accumulated depreciationCarrying amount
Balance as at 1 April
2018
Additions Deductions Balance as at 31 March
2019
Balance as at 1 April
2018
Additions Deductions Balance as at 31 March
2019
Balance as at 31 March
2019Product registrations 928.56 143.44 55.36 1,016.64 739.88 63.41 21.08 782.21 234.43
902.74 25.82 - 928.56 604.05 135.83 - 739.88 188.68 Licences and commercial rights 609.70 - - 609.70 609.70 - - 609.70 -
609.70 - - 609.70 373.68 236.02 - 609.70 - Computer software 117.02 6.57 - 123.59 52.72 11.92 - 64.64 58.95
96.27 20.75 - 117.02 37.83 14.89 - 52.72 64.30 Total 1,655.28 150.01 55.36 1,749.93 1,402.30 75.33 21.08 1,456.55 293.38
1,608.71 46.57 - 1,655.28 1,015.56 386.74 - 1,402.30 252.98
footnotes:1. The Company has not capitalised any borrowing cost during the current year (31 March, 2018 - Nil).
2. The Company has recognised impairment loss during the current year ` 34.28 lakhs (31 March, 2018 - Nil).
3. The figures in italics are for the previous year.
7: Investments
Nominal value (in `)
No. of shares
As at 31 March,
2019
No. of shares
As at 31 March,
2018Non-currentQuoted equity instruments (all fully paid)Investments carried at fair value through other comprehensive income (FVTOCI) Spartek Ceramics India Ltd. 10 7,226 - 7,226 - Nagarjuna Finance Ltd. 10 400 - 400 - Pharmaceuticals Products of India Limited 10 10,000 - 10,000 - Balasore Alloys Ltd. 5 504 0.12 504 0.24 J.K. Cement Ltd. 10 44 0.38 44 0.45 Total aggregate quoted investments A 0.50 A 0.69
Unquoted equity instruments (all fully paid)a) Investment in subsidiaries at cost Zero Waste Agro Organics Ltd. (refer note (i) below) 10 73,645 6,134.39 73,645 6,134.39 Rallis Chemistry Exports Ltd. (refer note (iii) below) 10 - - 50,000 5.00 Metahelix Life Sciences Ltd. (refer note (ii) below) 10 107,502 24,436.62 107,502 24,436.62
B 30,571.01 B 30,576.01

149
Standalone
Notes to the standalone financial statements for the year ended 31 March, 2019All amounts are in ` lakhs unless otherwise stated
Nominal value (in `)
No. of shares
As at 31 March,
2019
No. of shares
As at 31 March,
2018b) Investments carried at fair value through other
comprehensive income (FVTOCI) Gk Chemicals and Fertilizers Limited (formerly known
as Aich Aar Chemicals Pvt. Ltd.)10 124,002 - 124,002 -
Biotech Consortium India Ltd. 10 50,000 5.00 50,000 5.00 Indian Potash Ltd. 10 54,000 0.90 54,000 0.90 Bharuch Enviro Infrastructure Ltd. 10 36,750 3.68 36,750 3.68 Narmada Clean Tech Ltd. (formerly known as Bharuch
Eco-Aqua Infrastructure Ltd.) 10 300,364 30.04 300,364 30.04
Cuddalore SIPCOT Industries Common Utilities Ltd.# 100 113 - 113 - Patancheru Enviro-Tech Ltd. 10 10,822 1.08 10,822 1.08 Impetis Biosciences Ltd 10 568,414 337.64 568,414 337.64 Amba Trading & Manufacturing Company Private Ltd. 10 130,000 - 130,000 - Associated Inds. (Assam) Ltd.# 10 30,000 - 30,000 - Uniscans & Sonics Ltd.# 10 96 - 96 - Caps Rallis (Private) Ltd. (Nominal value of Zim. $ 2 each) 2,100,000 - 2,100,000 -
C 378.34 C 378.34 Total aggregate unquoted investments (B+C) 30,949.35 (B+C) 30,954.35 Total non-current investments (A+B+C) 30,949.85 (A+B+C) 30,955.04
footnote:
# Amount is less than ` 0.01 lakh.
Note:
(i) During the year ended 31 March, 2018, the Board of Directors of the Company had approved the Scheme of Amalgamation (“Scheme”) under the provisions of Section 234 read with Sections 230 to 232 of the Companies Act, 2013 for the merger of Zero Waste Agro Organics Limited, a wholly owned subsidiary of the Company, with the Company, subject to necessary statutory and regulatory approvals, including the National Company Law Tribunal (‘NCLT’).
(ii) During the year ended 31 March, 2019, the Board of Directors of the Company have approved the Scheme of Amalgamation (“Scheme”) under the provisions of Section 234 read with Sections 230 to 232 of the Companies Act, 2013 for the merger of Metahelix Life Sciences Ltd, a wholly owned subsidiary of the Company, with the Company, subject to necessary statutory and regulatory approvals, including the National Company Law Tribunal (‘NCLT’).
(iii) During the year ended 31 March, 2019, Rallis Chemistry Exports Ltd. has made an application to the Registrar of Companies for removal of its name from the Register of Companies, hence investment has been written off from books of accounts.
Current Units As at 31 March,
2019
Units As at 31 March,
2018Investment in mutual funds - unquotedInvestments carried at fair value through profit and loss (FVTPL) Tata Money Market Fund - Regular Plan - Daily Dividend - - 2,35,343.25 2,357.00 Tata Liquid Fund - Regular Plan - Daily Dividend - - 1,24,115.25 1,383.29 HDFC Liquid Fund - Regular Plan - Dividend - Daily Reinvestment 2,87,436.95 2,931.34 15,293.05 155.96 HDFC Cash Management Fund - Saving Plan - Daily Dividend
Reinvestment - - 45,916.65 488.39
Kotak Liquid - Regular Plan - Daily Dividend 1,23,854.16 1,515.08 - - ICICI Prudential Liquid Fund - Daily Dividend 10,08,305.48 1,010.19 - - Birla Sunlife Cash Plus - Daily Dividend - Regular Plan - Reinvestment - - 20,94,852.09 2,100.55 SBI Liquid Fund - Regular Plan - Daily Dividend 49,112.33 492.72 1,52,428.55 1,529.24

150 | 71st Annual Report 2018-19
Rallis India Limited Financial Statements
Current Units As at 31 March,
2019
Units As at 31 March,
2018Total current investments D 5,949.34 D 8,014.43 Aggregate book value of quoted investments 0.50 0.69
Aggregate market value of quoted investments 0.50 0.69
Aggregate carrying value of unquoted investments (B+C+D) 36,898.69 (B+C+D) 38,968.78
Aggregate amount of impairment in value of investments - -
Notes to the standalone financial statements for the year ended 31 March, 2019All amounts are in ` lakhs unless otherwise stated
8: Loans* (Unsecured, considered good)
As at 31 March, 2019
As at 31 March, 2018
Non-currentSecurity deposits 484.51 385.27 Total 484.51 385.27
* There is no amount due from director, other officer of the Company or firms in which any director is a partner or private companies in which any director is a director or member at anytime during the reporting period.
9: Other financial assets (at amortised cost)* (Unsecured)
As at 31 March, 2019
As at 31 March, 2018
(i) Non-current In other deposit accounts - original maturity more than 12 months 19.24 46.76 Interest accrued on fixed deposits with bank 2.18 11.89 Total 21.42 58.65
(ii) Current a) Advances/deposits considered doubtful of recovery (refer note 1) 3,946.60 3,933.25 Less: Provision for doubtful loans and advances (3,946.60) (3,933.25) b) Interest accrued on fixed deposits with bank 14.90 4.18 c) Derivative assets Forward exchange contracts for hedging 79.32 171.02 d) Others 363.88 375.94 Total 458.10 551.14
* There is no amount due from director, other officer of the Company or firms in which any director is a partner or private companies in which any director is a director or member at anytime during the reporting period.
Note 1:
Includes a sum of ` Nil (as at 31 March, 2018 ` 18.61 lakhs) being amount due from Rallis Chemistry Exports Ltd., a wholly owned subsidiary. The maximum amount outstanding during the year was ` 18.61 lakhs (as at 31 March, 2018 ` 18.61 lakhs).

151
Standalone
Notes to the standalone financial statements for the year ended 31 March, 2019All amounts are in ` lakhs unless otherwise stated
10: Income TaxesAs at
31 March, 2019As at
31 March, 201810.1: Income-tax assets and liabilities Income-tax assets (Net) Advance income tax (Net of provisions for tax ` 20,956.73 lakhs
(31 March, 2018 ` 19,813.94 lakhs) 6,166.11 6,250.30
6,166.11 6,250.30 Income-tax liabilities (Net) Provision for current tax (Net of advance tax ` 29,726.85 lakhs
(31 March, 2018 ` 29,548.75 lakhs) 350.93 229.19
350.93 229.19
For the year ended 31 March, 2019
For the year ended 31 March, 2018
10.2: Income tax recognised in profit or loss Current tax: Current income tax charge 6,135.95 6,035.71 Adjustments in respect of current income tax of prior years (10.27) (140.60) Total (A) 6,125.68 5,895.11 Deferred tax: In respect of current year (235.36) (917.95) Total (B) (235.36) (917.95) Income tax expense recognised in the Statement of Profit and Loss (A+B) 5,890.32 4,977.16
Income tax recognised in Other Comprehensive Income Income tax expenses on remeasurements of employee defined benefit plans 26.52 78.05 Deferred tax expense on remeasurements of employee defined benefit plans (1.02) (11.88) Total tax expense recognised in Other Comprehensive Income 25.50 66.17
Reconciliation of the tax expense and the accounting profit for the year is as follows:-
Particulars For the year ended 31 March, 2019
For the year ended 31 March, 2018
Profit before tax 18,788.15 19,125.75 Income tax expense calculated @34.944% (PY @ 34.608%) 6,565.33 6,619.04 Effect of income that is exempt fom taxation (99.11) (160.64)Effect of expenses that are not deductible in determining taxable profit 145.53 145.06 Effect of concessions (research & developments and others allowances) (814.05) (851.62)Effect of lower tax rates for the long term capital gain 87.40 (743.45)Others 15.49 109.37
5,900.59 5,117.76 Adjustments recognised in the current year in relation to the current tax of prior years (10.27) (140.60)Income tax expense recognised in the Standalone Statement of Profit and Loss 5,890.32 4,977.16
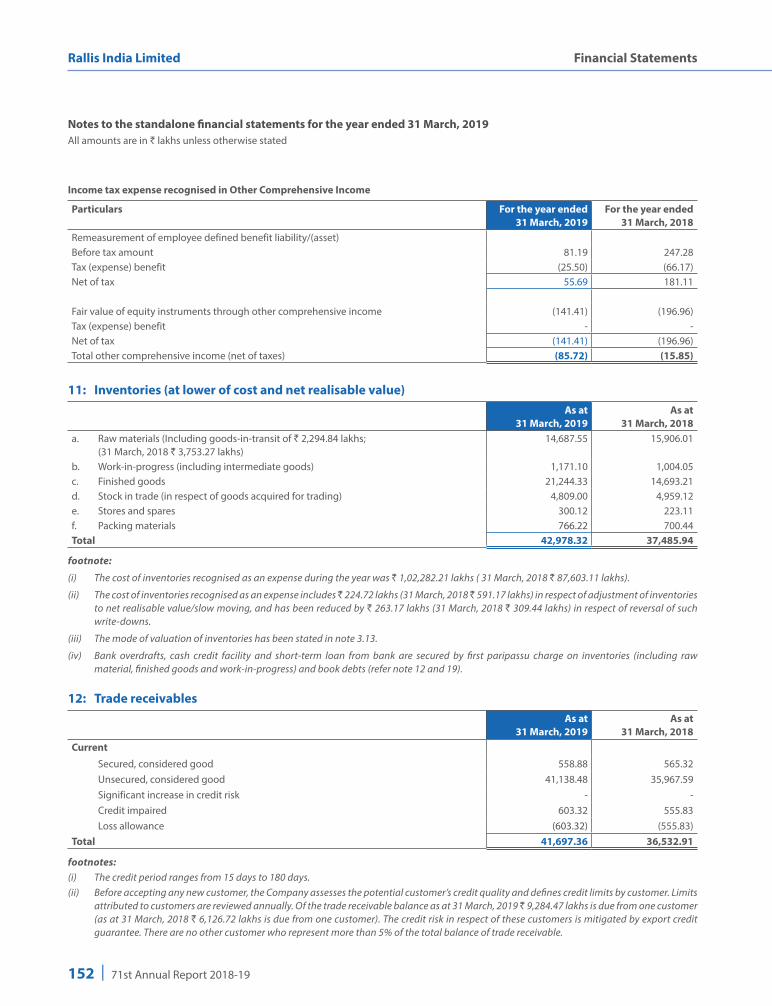
152 | 71st Annual Report 2018-19
Rallis India Limited Financial Statements
Income tax expense recognised in Other Comprehensive Income
Particulars For the year ended 31 March, 2019
For the year ended 31 March, 2018
Remeasurement of employee defined benefit liability/(asset)Before tax amount 81.19 247.28 Tax (expense) benefit (25.50) (66.17)Net of tax 55.69 181.11
Fair value of equity instruments through other comprehensive income (141.41) (196.96)Tax (expense) benefit - - Net of tax (141.41) (196.96)Total other comprehensive income (net of taxes) (85.72) (15.85)
11: Inventories (at lower of cost and net realisable value)As at
31 March, 2019As at
31 March, 2018a. Raw materials (Including goods-in-transit of ` 2,294.84 lakhs;
(31 March, 2018 ` 3,753.27 lakhs) 14,687.55 15,906.01
b. Work-in-progress (including intermediate goods) 1,171.10 1,004.05 c. Finished goods 21,244.33 14,693.21 d. Stock in trade (in respect of goods acquired for trading) 4,809.00 4,959.12 e. Stores and spares 300.12 223.11 f. Packing materials 766.22 700.44 Total 42,978.32 37,485.94
footnote:
(i) The cost of inventories recognised as an expense during the year was ` 1,02,282.21 lakhs ( 31 March, 2018 ` 87,603.11 lakhs).
(ii) The cost of inventories recognised as an expense includes ̀ 224.72 lakhs (31 March, 2018 ̀ 591.17 lakhs) in respect of adjustment of inventories to net realisable value/slow moving, and has been reduced by ` 263.17 lakhs (31 March, 2018 ` 309.44 lakhs) in respect of reversal of such write-downs.
(iii) The mode of valuation of inventories has been stated in note 3.13.
(iv) Bank overdrafts, cash credit facility and short-term loan from bank are secured by first paripassu charge on inventories (including raw material, finished goods and work-in-progress) and book debts (refer note 12 and 19).
12: Trade receivablesAs at
31 March, 2019As at
31 March, 2018Current
Secured, considered good 558.88 565.32 Unsecured, considered good 41,138.48 35,967.59 Significant increase in credit risk - - Credit impaired 603.32 555.83 Loss allowance (603.32) (555.83)Total 41,697.36 36,532.91
footnotes: (i) The credit period ranges from 15 days to 180 days.(ii) Before accepting any new customer, the Company assesses the potential customer’s credit quality and defines credit limits by customer. Limits
attributed to customers are reviewed annually. Of the trade receivable balance as at 31 March, 2019 ` 9,284.47 lakhs is due from one customer (as at 31 March, 2018 ` 6,126.72 lakhs is due from one customer). The credit risk in respect of these customers is mitigated by export credit guarantee. There are no other customer who represent more than 5% of the total balance of trade receivable.
Notes to the standalone financial statements for the year ended 31 March, 2019All amounts are in ` lakhs unless otherwise stated
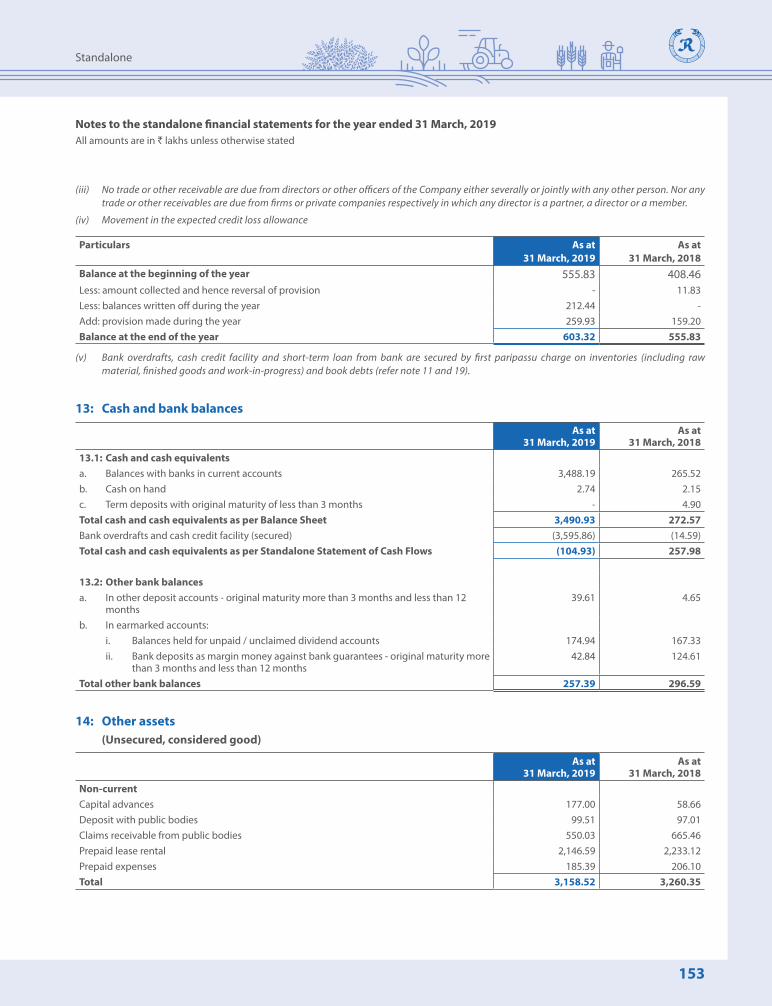
153
Standalone
(iii) No trade or other receivable are due from directors or other officers of the Company either severally or jointly with any other person. Nor any trade or other receivables are due from firms or private companies respectively in which any director is a partner, a director or a member.
(iv) Movement in the expected credit loss allowance
Particulars As at 31 March, 2019
As at 31 March, 2018
Balance at the beginning of the year 555.83 408.46Less: amount collected and hence reversal of provision - 11.83 Less: balances written off during the year 212.44 - Add: provision made during the year 259.93 159.20Balance at the end of the year 603.32 555.83
(v) Bank overdrafts, cash credit facility and short-term loan from bank are secured by first paripassu charge on inventories (including raw material, finished goods and work-in-progress) and book debts (refer note 11 and 19).
13: Cash and bank balances
As at 31 March, 2019
As at 31 March, 2018
13.1: Cash and cash equivalentsa. Balances with banks in current accounts 3,488.19 265.52 b. Cash on hand 2.74 2.15 c. Term deposits with original maturity of less than 3 months - 4.90 Total cash and cash equivalents as per Balance Sheet 3,490.93 272.57 Bank overdrafts and cash credit facility (secured) (3,595.86) (14.59)Total cash and cash equivalents as per Standalone Statement of Cash Flows (104.93) 257.98
13.2: Other bank balancesa. In other deposit accounts - original maturity more than 3 months and less than 12
months 39.61 4.65
b. In earmarked accounts: i. Balances held for unpaid / unclaimed dividend accounts 174.94 167.33 ii. Bank deposits as margin money against bank guarantees - original maturity more
than 3 months and less than 12 months 42.84 124.61
Total other bank balances 257.39 296.59
14: Other assets (Unsecured, considered good)
As at 31 March, 2019
As at 31 March, 2018
Non-currentCapital advances 177.00 58.66 Deposit with public bodies 99.51 97.01 Claims receivable from public bodies 550.03 665.46 Prepaid lease rental 2,146.59 2,233.12 Prepaid expenses 185.39 206.10 Total 3,158.52 3,260.35
Notes to the standalone financial statements for the year ended 31 March, 2019All amounts are in ` lakhs unless otherwise stated
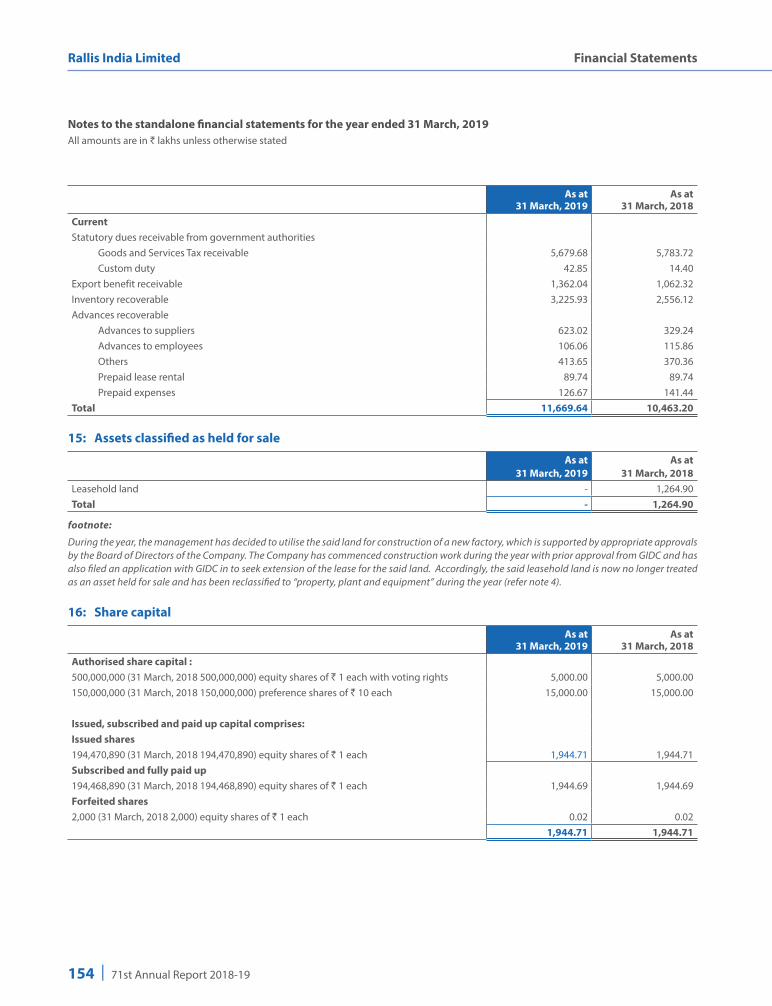
154 | 71st Annual Report 2018-19
Rallis India Limited Financial Statements
As at 31 March, 2019
As at 31 March, 2018
CurrentStatutory dues receivable from government authorities Goods and Services Tax receivable 5,679.68 5,783.72 Custom duty 42.85 14.40 Export benefit receivable 1,362.04 1,062.32 Inventory recoverable 3,225.93 2,556.12 Advances recoverable Advances to suppliers 623.02 329.24 Advances to employees 106.06 115.86 Others 413.65 370.36 Prepaid lease rental 89.74 89.74 Prepaid expenses 126.67 141.44 Total 11,669.64 10,463.20
15: Assets classified as held for sale
As at 31 March, 2019
As at 31 March, 2018
Leasehold land - 1,264.90 Total - 1,264.90
footnote:
During the year, the management has decided to utilise the said land for construction of a new factory, which is supported by appropriate approvals by the Board of Directors of the Company. The Company has commenced construction work during the year with prior approval from GIDC and has also filed an application with GIDC in to seek extension of the lease for the said land. Accordingly, the said leasehold land is now no longer treated as an asset held for sale and has been reclassified to “property, plant and equipment” during the year (refer note 4).
16: Share capital
As at 31 March, 2019
As at 31 March, 2018
Authorised share capital :500,000,000 (31 March, 2018 500,000,000) equity shares of ` 1 each with voting rights 5,000.00 5,000.00150,000,000 (31 March, 2018 150,000,000) preference shares of ` 10 each 15,000.00 15,000.00
Issued, subscribed and paid up capital comprises:Issued shares194,470,890 (31 March, 2018 194,470,890) equity shares of ` 1 each 1,944.71 1,944.71 Subscribed and fully paid up194,468,890 (31 March, 2018 194,468,890) equity shares of ` 1 each 1,944.69 1,944.69 Forfeited shares2,000 (31 March, 2018 2,000) equity shares of ` 1 each 0.02 0.02
1,944.71 1,944.71
Notes to the standalone financial statements for the year ended 31 March, 2019All amounts are in ` lakhs unless otherwise stated

155
Standalone
footnotes:
a. Reconciliation of the number of shares and amount outstanding at the beginning and at the end of the year:
Fully paid equity shares
Number of shares
Amount of share capital
Balance at 31 March, 2018 19,44,68,890 1,944.69 Movements during the year - - Balance at 31 March, 2019 19,44,68,890 1,944.69
b. The Company has issued one class of equity shares having a par value of `1 per share. Each shareholder is eligible for one vote per share held. The dividend proposed by the Board of Directors is subject to the approval of the shareholders in the ensuing Annual General Meeting, except in case of interim dividend. In the event of liquidation, the equity shareholders are eligible to receive the remaining assets of the Company after distribution of all preferential amounts, in proportion to their shareholding.
c. Details of shares held by the Holding Company
Number of fully paid equity shares
Amount of share capital
Tata Chemicals LimitedAs at 31 March, 2018 9,73,41,610 973.42 As at 31 March, 2019 9,73,41,610 973.42
d. Details of shares held by each shareholder holding more than 5% shares in the Company:
Number of fully paid equity shares
% holding of equity shares
Tata Chemicals LimitedAs at 31 March, 2018 9,73,41,610 50.06%As at 31 March, 2019 9,73,41,610 50.06%
Rakesh JhunjhunwalaAs at 31 March, 2018 1,88,05,820 9.67%As at 31 March, 2019 1,79,80,820 9.25%
e. As per records of the Company as at 31 March, 2019, no calls remain unpaid by the directors and officers of the Company.
17: Other equityAs at
31 March, 2019As at
31 March, 2018General reserve 17,649.93 17,649.93 Securities premium 8,793.88 8,793.88 Retained earnings 87,052.14 80,100.90 Capital redemption reserve 8,151.77 8,151.77 Capital reserve 1,243.10 1,243.10 Reserve for equity instruments through Other Comprehensive Income 0.20 0.39
1,22,891.02 1,15,939.97
Notes to the standalone financial statements for the year ended 31 March, 2019All amounts are in ` lakhs unless otherwise stated

156 | 71st Annual Report 2018-19
Rallis India Limited Financial Statements
17.1: General reserve
As at 31 March, 2019
As at 31 March, 2018
Balance at beginning of year 17,649.93 17,649.93 Balance at the end of year 17,649.93 17,649.93
General reserve is used from time to time to transfer profits from retained earnings for appropriation purposes. As the general reserve is created by a transfer from one component of equity to another and is not an item of other comprehensive income , items included in the general reserve will not be reclassified subsequently to profit or loss.
17.2: Securities premium
As at 31 March, 2019
As at 31 March, 2018
Balance at beginning of year 8,793.88 8,793.88 Balance at the end of year 8,793.88 8,793.88
Amount received on issue of shares in excess of the par value has been classified as security share premium.
17.3: Retained earningsAs at
31 March, 2019As at
31 March, 2018Balance at beginning of year 80,100.90 74,755.94 Other Comprehensive Income arising from remeasurement of employee defined benefit obligation (Net of taxes)
55.69 181.11
Profit for the year 12,897.83 14,148.59 Transfer from equity instruments through Other Comprehensive Income (141.22) (196.96)Payment of dividend on equity shares- Final (4,861.72) (7,292.58)Payment of dividend distribution tax on equity shares-Final (999.34) (1,495.20)Balance at the end of year 87,052.14 80,100.90
17.4: Capital redemption reserve
As at 31 March, 2019
As at 31 March, 2018
Balance at beginning of year 8,151.77 8,151.77 Balance at the end of year 8,151.77 8,151.77
Capital redemption reserve is created out of profits on redemption of capital.
17.5: Capital reserve
As at 31 March, 2019
As at 31 March, 2018
Balance at beginning of year 1,243.10 1,243.10 Balance at the end of year 1,243.10 1,243.10
Capital reserve includes profit on amalgamation of entities.
Notes to the standalone financial statements for the year ended 31 March, 2019All amounts are in ` lakhs unless otherwise stated

157
Standalone
17.6: Reserve for equity instruments through Other Comprehensive IncomeAs at
31 March, 2019As at
31 March, 2018Balance at beginning of year 0.39 0.39 Additions during the year (141.41) (196.96)Transfer to retained earnings 141.22 196.96 Balance at the end of year 0.20 0.39
The Company has elected to recognise changes in the fair value of investments in equity instruments in other comprehensive income. These changes are accumulated within the FVTOCI equity investments within equity. The balance in Other Comprehensive Income is transferred to retained earnings on disposal of the investment.
18: Non-current borrowingsAs at
31 March, 2019As at
31 March, 2018Secured - at amortised costFinance lease obligation (refer note (iii)) 11.72 20.34
Unsecured - at amortised costTerm loan from bank (refer note (ii)) 900.00 1,200.00 Sales tax deferral under a state government scheme (refer note(i)) 554.78 570.22 Total 1,466.50 1,790.56
Summary of borrowing arrangements
(i) Sales tax deferral scheme:
The loan is repayable in annual installments which ranges from a maximum of ` 113.11 lakhs to a minimum of ` 14.73 lakhs over the period stretching from 1 April, 2019 to 31 March, 2027. The amount outstanding is free of interest.
The balance outstanding as at 31 March, 2019 is ` 569.51 lakhs (as at 31 March, 2018 ` 578.00 lakhs) of which ` 14.73 lakhs (as at 31 March, 2018 ` 7.78 lakhs) has been grouped under note 22- other current financial liabilities, which are payable in next 12 months
(ii) The terms of repayment of term loan is stated belowAs at 31 March, 2019
Particulars Amount outstanding
Terms of Repayment Rate of interest
Unsecured term loan from bank 1,200.00 The loan is repayable in 20 equal quarterly installments. The repayment begins after a moratorium period of 24 months. The first repayment of ` 75.00 lakhs falls due in May 2018 and the last installment in Feb 2023.
8.35% to 8.85%
As at 31 March, 2018
Particulars Amount outstanding
Terms of Repayment Rate of interest
Unsecured term loan from bank 1,500.00 The loan is repayable in 20 quarterly installments. The repayment begins after a moratorium period of 24 months. The first repayment of ` 75.00 lakhs falls due in May 2018.
8.35%
The balance outstanding as at 31 March, 2019 is ` 1,200 lakhs (as at 31 March, 2018 ` 1,500 lakhs) of which ` 300 lakhs (as at 31 March, 2018 ` 300 lakhs) has been grouped under note 22- other current financial liabilities, which are payable in next 12 months.
Notes to the standalone financial statements for the year ended 31 March, 2019All amounts are in ` lakhs unless otherwise stated

158 | 71st Annual Report 2018-19
Rallis India Limited Financial Statements
(iii) Finance lease obligation:
Secured by the assets leased. The borrowing is fixed interest rate debt (8.85%) with repayment periods not exceeding 4 years.
The balance outstanding as at 31 March, 2019 is ` 21.04 lakhs (as at 31 March, 2018 ` 28.82 lakhs) of which ` 9.32 lakhs (as at 31 March, 2018 ` 8.48 lakhs) has been grouped under note 22- other current financial liabilities, which are payable in next 12 months.
19: Current borrowingsAs at
31 March, 2019As at
31 March, 2018SecuredLoans repayable on demand from banks Bank overdrafts and cash credit facility (refer note (i) and (ii) 3,595.86 14.59 Short-term loan from bank (refer note (iii)) 1,700.00 - Total 5,295.86 14.59
footnotes:
(i) These bank overdrafts and cash credit facility are secured by first paripassu charge on inventories (including raw material, finished goods and work-in-progress) and book debts (refer note 11 and 12).
(ii) The weighted average effective interest rate on the bank loans is 8.57% p.a.(for 31 March, 2018 8.56% p.a.).
(iii) The terms of repayment of short-term loan is stated below
Particulars Amount outstanding
Terms of Repayment Rate of interest
Secured short-term loan from bank is secured by first paripassu charge on inventories (including raw material, finished goods and work-in-progress) and book debts (refer note 11 and 12)
1,700.00 The loan is repayable in 30 days from the date of availment
8.35%
20: Deferred tax balancesThe following is the analysis of deferred tax liabilities/(assets) presented in the Balance sheet
As at 31 March, 2019
As at 31 March, 2018
Deferred tax liabilities 5,518.82 5,813.70Deferred tax assets (1,702.61) (1,761.11)Total 3,816.21 4,052.59
2018-19 -Deferred tax liabilities/(assets) in relation to:
Opening balance
Recognised in Statement of
Profit and Loss
Recognised in Statement
of OCI
Closing balance
Allowance for doubtful debts and advances (726.57) (21.26) - (747.83)Defined benefit obligation (291.09) (6.61) (1.02) (298.72)Tax adjustment on account of indexation of land
(190.11) 87.42 - (102.69)
Long-term capital loss on sale of equity instrument (553.36) - - (553.36)Difference between WDV as per books and income tax 5,785.86 (294.91) - 5,490.95 Others 27.86 - - 27.86 Total 4,052.59 (235.36) (1.02) 3,816.21
Notes to the standalone financial statements for the year ended 31 March, 2019All amounts are in ` lakhs unless otherwise stated
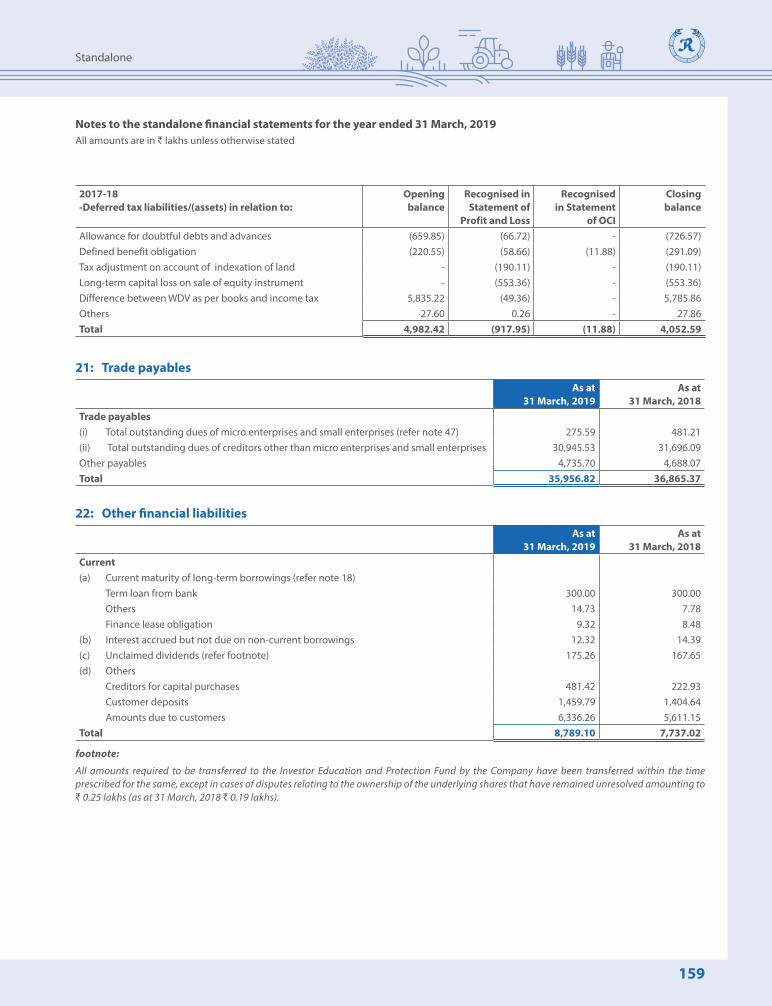
159
Standalone
2017-18 -Deferred tax liabilities/(assets) in relation to:
Opening balance
Recognised in Statement of
Profit and Loss
Recognised in Statement
of OCI
Closing balance
Allowance for doubtful debts and advances (659.85) (66.72) - (726.57)Defined benefit obligation (220.55) (58.66) (11.88) (291.09)Tax adjustment on account of indexation of land - (190.11) - (190.11)Long-term capital loss on sale of equity instrument - (553.36) - (553.36)Difference between WDV as per books and income tax 5,835.22 (49.36) - 5,785.86 Others 27.60 0.26 - 27.86 Total 4,982.42 (917.95) (11.88) 4,052.59
21: Trade payablesAs at
31 March, 2019As at
31 March, 2018Trade payables(i) Total outstanding dues of micro enterprises and small enterprises (refer note 47) 275.59 481.21 (ii) Total outstanding dues of creditors other than micro enterprises and small enterprises 30,945.53 31,696.09 Other payables 4,735.70 4,688.07 Total 35,956.82 36,865.37
22: Other financial liabilitiesAs at
31 March, 2019As at
31 March, 2018Current(a) Current maturity of long-term borrowings (refer note 18) Term loan from bank 300.00 300.00 Others 14.73 7.78 Finance lease obligation 9.32 8.48 (b) Interest accrued but not due on non-current borrowings 12.32 14.39 (c) Unclaimed dividends (refer footnote) 175.26 167.65 (d) Others Creditors for capital purchases 481.42 222.93 Customer deposits 1,459.79 1,404.64 Amounts due to customers 6,336.26 5,611.15 Total 8,789.10 7,737.02
footnote:
All amounts required to be transferred to the Investor Education and Protection Fund by the Company have been transferred within the time prescribed for the same, except in cases of disputes relating to the ownership of the underlying shares that have remained unresolved amounting to ` 0.25 lakhs (as at 31 March, 2018 ` 0.19 lakhs).
Notes to the standalone financial statements for the year ended 31 March, 2019All amounts are in ` lakhs unless otherwise stated

160 | 71st Annual Report 2018-19
Rallis India Limited Financial Statements
23: ProvisionsAs at
31 March, 2019As at
31 March, 2018Non-currentSupplemental pay (refer note 2) 1,364.89 1,431.68 Directors pension liability (refer note 2) 663.60 - Total 2,028.49 1,431.68
CurrentSupplemental pay (refer note 2) 220.93 195.66 Directors pension liability (refer note 2) 59.32 - Gratuity (refer note 2) 176.59 124.51 Compensated absences (refer note 2) 854.86 833.03 Provisions for indirect taxes (refer note 1) 237.32 227.32 Total 1,549.02 1,380.52
Note 1: Provision held in respect of indirect tax matters in dispute
On an evaluation of each of its disputed claims, the Company holds an overall provision for contingency in respect of certain indirect tax matters in dispute which, as at the year-end, aggregates ₹ 237.32 lakhs ( as at 31 March, 2018 ₹ 227.32 lakhs). The movement during the year is as under:
Particulars As at 31 March, 2019
As at 31 March, 2018
Opening Balance as at 1 April 227.32 193.82 Additional provisions made during the year 10.00 33.50 Total 237.32 227.32 Payments made adjusted against above sum - - Closing Balance as at 31 March 237.32 227.32
Note 2:
The provision for employee benefits includes gratuity, supplemental pay on retirement, director pension liability and compensated absences. The increase/decrease in the carrying amount of the provision for the current year is mainly on account of net impact of incremental charge for current year and benefits paid in the current year due to retirement and resignation of employees . For other disclosures, refer note 37.
24: Other current liabilitiesAs at
31 March, 2019As at
31 March, 2018Provident fund and other employee deductions 187.13 166.26 Goods and Services Tax payable 47.31 314.11 Other taxes (other than income tax payable) 61.43 90.66 Tax deducted at source 221.97 123.62 Advance received from customers 712.25 1,067.44 Payable to employees 66.35 64.30 Other liabilities 133.00 133.00 Total 1,429.44 1,959.39
Notes to the standalone financial statements for the year ended 31 March, 2019All amounts are in ` lakhs unless otherwise stated

161
Standalone
25: Revenue from operationsFor the year ended
31 March, 2019 For the year ended
31 March, 2018 Sale of products 1,66,436.64 1,50,076.03Sale of services 55.35 53.24Other operating income 658.39 1,464.47Total 1,67,150.38 1,51,593.74
26: Other incomeFor the year ended
31 March, 2019 For the year ended
31 March, 2018 a) Interest income Interest Income on bank deposits carried at amortised cost 39.65 13.43 Interest income on security deposits carried at amortised cost 64.38 41.07 Interest income on income tax refund received 33.97 13.60b) Dividend income Dividend on current investment in mutual fund carried at FVTPL 281.27 462.54 Dividend from equity instruments measured at FVTOCI 2.36 1.63c) Other non-operating income Insurance claim 81.47 20.01 Rental income 119.97 123.66 Export benefits 1,278.08 - Miscellaneous income 670.84 178.75d) Other gains and losses Net gain on foreign currency transactions and translation - 26.19 Profit on disposal of property, plant and equipment (Net) - 12.51 Total 2,571.99 893.39
27: Cost of materials consumedFor the year ended
31 March, 2019 For the year ended
31 March, 2018 Inventories at the beginning of the year 15,906.01 7,915.72 Add: Purchases 86,615.14 72,390.87
1,02,521.15 80,306.59 Less: Inventories at end of year 14,687.55 15,906.01 Cost of raw materials and components consumed 87,833.60 64,400.58 Packing materials consumed 6,122.10 6,005.17 Total 93,955.70 70,405.75
28: Purchases of stock-in-tradeFor the year ended
31 March, 2019 For the year ended
31 March, 2018 Agri Inputs 14,894.57 23,601.33 Total 14,894.57 23,601.33
Notes to the standalone financial statements for the year ended 31 March, 2019All amounts are in ` lakhs unless otherwise stated

162 | 71st Annual Report 2018-19
Rallis India Limited Financial Statements
29: Changes in inventories of finished goods, stock-in-trade and work in-progress For the year ended
31 March, 2019 For the year ended
31 March, 2018 Opening stockFinished goods - own manufactured 14,693.21 10,008.58 Stock-in-trade 4,959.12 2,473.44 Work in-progress (including intermediate goods) 1,004.05 3,353.22
20,656.38 15,835.24 Closing stockFinished goods - own manufactured 21,244.33 14,693.21 Stock-in-trade 4,809.00 4,959.12 Work in-progress (including intermediate goods) 1,171.10 1,004.05
27,224.43 20,656.38 Changes in excise duty on inventory of finished goods - (1,582.83)Movement in inventory recoverable (669.81) (902.30)Net (Increase)/decrease (7237.86) (7306.27)
30: Employee benefits expense*For the year ended
31 March, 2019 For the year ended
31 March, 2018 Salaries, wages and bonus 12,227.87 10,892.16 Wages and salaries 9,831.12 8,747.05 Allowances 2,254.28 1,949.59 Compensated absences 142.47 195.52 Contribution to provident and other funds (refer note 37) 661.23 612.14 Staff welfare expenses 957.54 1,061.04 Total 13,846.64 12,565.34
* This is net of recoveries of ` 82.37 lakhs (31 March, 2018 ` 13.06 lakhs) in respect of employees working in other group companies.
31: Finance costsFor the year ended
31 March, 2019 For the year ended
31 March, 2018 Interest on long-term loan from bank 116.04 129.39 Interest on bank overdrafts, cash credit facility and short-term loan from bank 368.07 197.27 Finance charges paid under finance leases 2.23 2.81 Total 486.34 329.47
32: Depreciation and amortisation expenseFor the year ended
31 March, 2019 For the year ended
31 March, 2018 Depreciation of property, plant and equipment (refer note 4) 3,844.68 3,662.55 Depreciation of investment property (refer note 5) 8.11 8.10 Amortisation of intangible assets (refer note 6) 75.33 386.74 Total 3,928.12 4,057.39
Notes to the standalone financial statements for the year ended 31 March, 2019All amounts are in ` lakhs unless otherwise stated

163
Standalone
33: Other expensesFor the year ended
31 March, 2019 For the year ended
31 March, 2018 Freight, handling and packing 5,803.11 5,868.60 Travelling and conveyance 1,196.16 1,101.24 Power and fuel 6,182.64 5,305.05 Brand equity contribution 229.08 206.00 Repairs and maintenance Plant and equipment 967.26 779.66 Property 225.63 175.70 Others 443.99 439.70 Stores and spares consumed 627.71 527.88 Rates and taxes 540.70 599.67 Commission 100.49 90.40 Insurance charges 274.06 296.68 Rent (refer note 36) 1,839.44 1,770.45 Bank charges 279.33 226.85 Director fees and commission 276.00 461.77 Bad debts 212.44 - Allowance for doubtful debts (Net) 47.49 147.37 Allowance for doubtful advances 31.98 2.57 Impairment of Intangible assets and intangible assets under development 138.52 - Investment written off (refer note 7) 24.60 - Loss on sale of property, plant and equipment (Net) 59.43 - Selling expenses 3,152.39 3,097.92 Legal and professional fees 1,240.23 943.93 Net loss on foreign currency transactions and translation 605.74 - Other expenses (refer note 43, 48 and 49) 6,562.29 5,915.29 Total 31,060.71 27,956.73
34: Earnings per shareFor the year ended
31 March, 2019 For the year ended
31 March, 2018 Profit for the year 12,897.83 14,148.59 Weighted average number of equity shares 19,44,68,890 19,44,68,890 Basic /diluted earnings per share 6.63 7.28
35: Segment informationProducts and services from which reportable segments derive their revenues
Information reported to the chief operating decision maker (CODM) for the purpose of resources allocation and assessment of segment performance focuses on the types of goods or services delivered or provided. No operating segments have been aggregated in arriving at the reportable segments of the Company.
The Company has determined its business segment as “Agri -Inputs” comprising of Pesticides, Plant Growth Nutrients, Organic Compost and Seeds .The other segment includes “Polymer” and other non reportable elements.
Notes to the standalone financial statements for the year ended 31 March, 2019All amounts are in ` lakhs unless otherwise stated

164 | 71st Annual Report 2018-19
Rallis India Limited Financial Statements
Segment revenue and results
The following is an analysis of the Company’s revenue and results from operations by reportable segment.
Segment Segment revenue Segment resultsFor the year ended
31 March, 2019 For the year ended
31 March, 2018For the year ended
31 March, 2019For the year ended
31 March, 2018Agri Inputs 1,63,335.98 1,48,051.14 16,920.49 18,444.04 Others 3,814.40 3,542.60 924.17 706.18 Total 1,67,150.38 1,51,593.74 17,844.66 19,150.22 Other income 2,571.99 893.39 Central administration cost, director fees and commission
(1,142.16) (588.39)
Finance costs (486.34) (329.47)Profit before tax 18,788.15 19,125.75
Notes:
(i) Segment revenue consist of sales of products including excise duty in previous year.
(ii) Segment revenue reported above represents revenue generated from external customers. There were no inter-segment sales in the current year (31 March, 2018 ` Nil). The accounting policies of the reportable segments are the same as described in note 3.20.
(iii) Segment profit represents the profit before tax earned by each segment without allocation of central administration cost and director fees and commission, other income, as well as finance costs. This is the measure reported to the chief operating decision maker for the purposes of resource allocation and assessment of segment performance.
Segment assets and liabilities
Particulars As at 31 March, 2019
As at 31 March, 2018
Segment assetsAgri Inputs 1,38,877.23 1,23,148.23 Others 1,891.83 2,034.09 Total segment assets 1,40,769.06 1,25,182.32 Assets classified as held for sale - 1,264.90 Unallocated 44,749.04 46,898.37 Total assets 1,85,518.10 1,73,345.59
Particulars As at 31 March, 2019
As at 31 March, 2018
Segment liabilitiesAgri Inputs 46,766.27 47,073.93 Others 166.22 174.41 Total segment liabilities 46,932.49 47,248.34 Unallocated 13,749.88 8,212.57 Total liabilities 60,682.37 55,460.91
Details of capital expenditure incurred
Particulars As at 31 March, 2019
As at 31 March, 2018
Agri Inputs 3,464.51 4,910.66 Others 12.84 14.87 Unallocated - - Total 3,477.35 4,925.53
Notes to the standalone financial statements for the year ended 31 March, 2019All amounts are in ` lakhs unless otherwise stated

165
Standalone
For the purpose of monitoring segment performance and allocation resources between segments:- All assets are allocated to reportable segments other than investments, other financial assets, non current tax assets, fixed
deposits and interest accrued thereon.
- All liabilities are allocated to reportable segments other than borrowings, other financial liabilities, interest accrued on loans, provision for supplemental pay, Director pension liability, unpaid dividend, current and deferred tax liabilities.
Geographical informationThe Company operates in two principal geographical areas - India and outside India
The Company’s revenue from continuing operations from external customers by location of operations and information about its non-current assets* by location of assets are detailed below:
Particulars Revenue from external customers Non-current assets*For the year ended
31 March, 2019For the year ended
31 March, 2018As at
31 March, 2019As at
31 March, 2018India 1,02,097.55 1,03,801.70 47,561.24 47,064.95 Asia (Other than India) 37,345.04 33,633.38 - - North America 12,777.89 5,272.17 - - South America 10,764.80 4,470.47 - - Africa 3,043.88 3,014.28 - - Europe 35.21 482.48 - - Australia 1,086.01 919.26 - -
1,67,150.38 1,51,593.74 47,561.24 47,064.95
* Non-current assets exclude those relating to financial assets.
Information about major customers
One customer contributed to the Company’s revenue in year 2018-19 more than 10% (` 22,149.40 Lakhs) and no single customer contributed 10% or more to the Company’s revenue in year 2017-18.
36: Lease arrangementsOperating lease arrangementsCompany as LesseeThe Company has procured motor vehicles and computer network under non-cancellable operating leases. Lease rent charged to the Standalone Statement of Profit and Loss during the year is ` 840.87 lakhs (31 March, 2018 ` 762.04 lakhs)net of amount recovered from employees ` 5.69 lakhs (31 March, 2018 ` 5.11 lakhs). Disclosures in respect of non-cancellable leases are given below:
Amounts recognised as an expense (refer note 33)
Particulars For the year ended 31 March, 2019
For the year ended 31 March, 2018
Minimum lease payments 840.87 762.04 Total 840.87 762.04
Non-cancellable operating lease commitments
Particulars For the year ended 31 March, 2019
For the year ended 31 March, 2018
Not later than 1 year 664.12 639.50 Later than 1 year and not later than 5 years 824.00 690.42 Later than 5 years - - Total 1,488.12 1,329.92
Notes to the standalone financial statements for the year ended 31 March, 2019All amounts are in ` lakhs unless otherwise stated
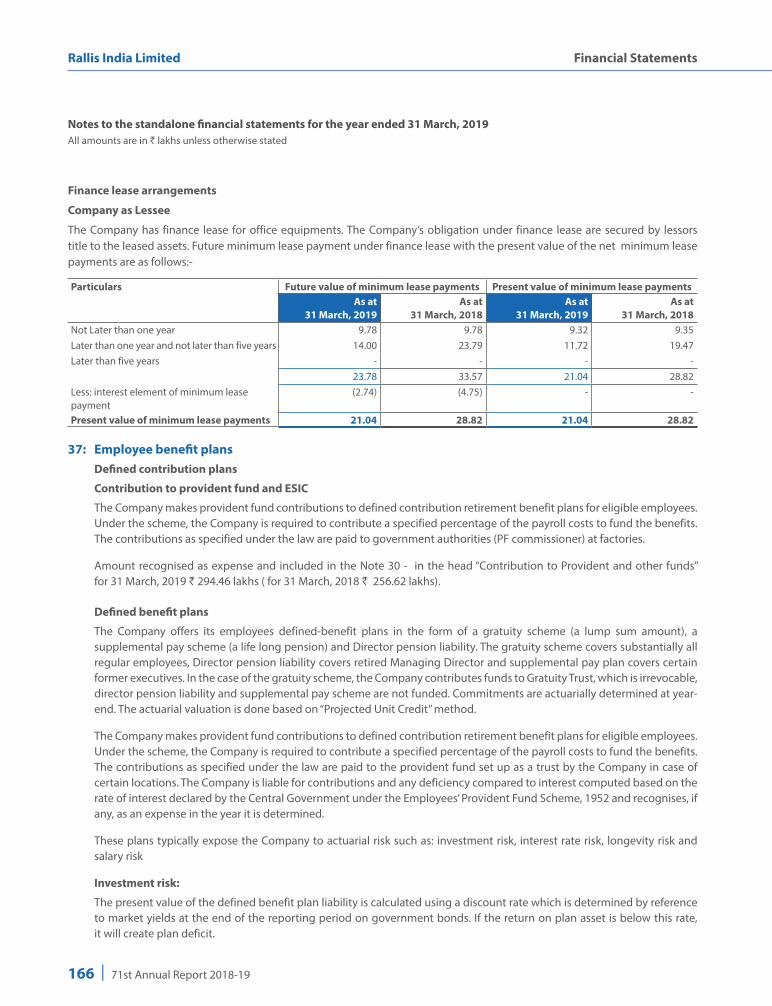
166 | 71st Annual Report 2018-19
Rallis India Limited Financial Statements
Finance lease arrangements
Company as Lessee
The Company has finance lease for office equipments. The Company’s obligation under finance lease are secured by lessors title to the leased assets. Future minimum lease payment under finance lease with the present value of the net minimum lease payments are as follows:-
Particulars Future value of minimum lease payments Present value of minimum lease paymentsAs at
31 March, 2019 As at
31 March, 2018As at
31 March, 2019As at
31 March, 2018Not Later than one year 9.78 9.78 9.32 9.35 Later than one year and not later than five years 14.00 23.79 11.72 19.47 Later than five years - - - -
23.78 33.57 21.04 28.82 Less: interest element of minimum lease payment
(2.74) (4.75) - -
Present value of minimum lease payments 21.04 28.82 21.04 28.82
37: Employee benefit plans Defined contribution plans
Contribution to provident fund and ESIC
The Company makes provident fund contributions to defined contribution retirement benefit plans for eligible employees. Under the scheme, the Company is required to contribute a specified percentage of the payroll costs to fund the benefits. The contributions as specified under the law are paid to government authorities (PF commissioner) at factories.
Amount recognised as expense and included in the Note 30 - in the head “Contribution to Provident and other funds” for 31 March, 2019 ` 294.46 lakhs ( for 31 March, 2018 ` 256.62 lakhs).
Defined benefit plans
The Company offers its employees defined-benefit plans in the form of a gratuity scheme (a lump sum amount), a supplemental pay scheme (a life long pension) and Director pension liability. The gratuity scheme covers substantially all regular employees, Director pension liability covers retired Managing Director and supplemental pay plan covers certain former executives. In the case of the gratuity scheme, the Company contributes funds to Gratuity Trust, which is irrevocable, director pension liability and supplemental pay scheme are not funded. Commitments are actuarially determined at year-end. The actuarial valuation is done based on “Projected Unit Credit” method.
The Company makes provident fund contributions to defined contribution retirement benefit plans for eligible employees. Under the scheme, the Company is required to contribute a specified percentage of the payroll costs to fund the benefits. The contributions as specified under the law are paid to the provident fund set up as a trust by the Company in case of certain locations. The Company is liable for contributions and any deficiency compared to interest computed based on the rate of interest declared by the Central Government under the Employees’ Provident Fund Scheme, 1952 and recognises, if any, as an expense in the year it is determined.
These plans typically expose the Company to actuarial risk such as: investment risk, interest rate risk, longevity risk and salary risk
Investment risk:
The present value of the defined benefit plan liability is calculated using a discount rate which is determined by reference to market yields at the end of the reporting period on government bonds. If the return on plan asset is below this rate, it will create plan deficit.
Notes to the standalone financial statements for the year ended 31 March, 2019All amounts are in ` lakhs unless otherwise stated
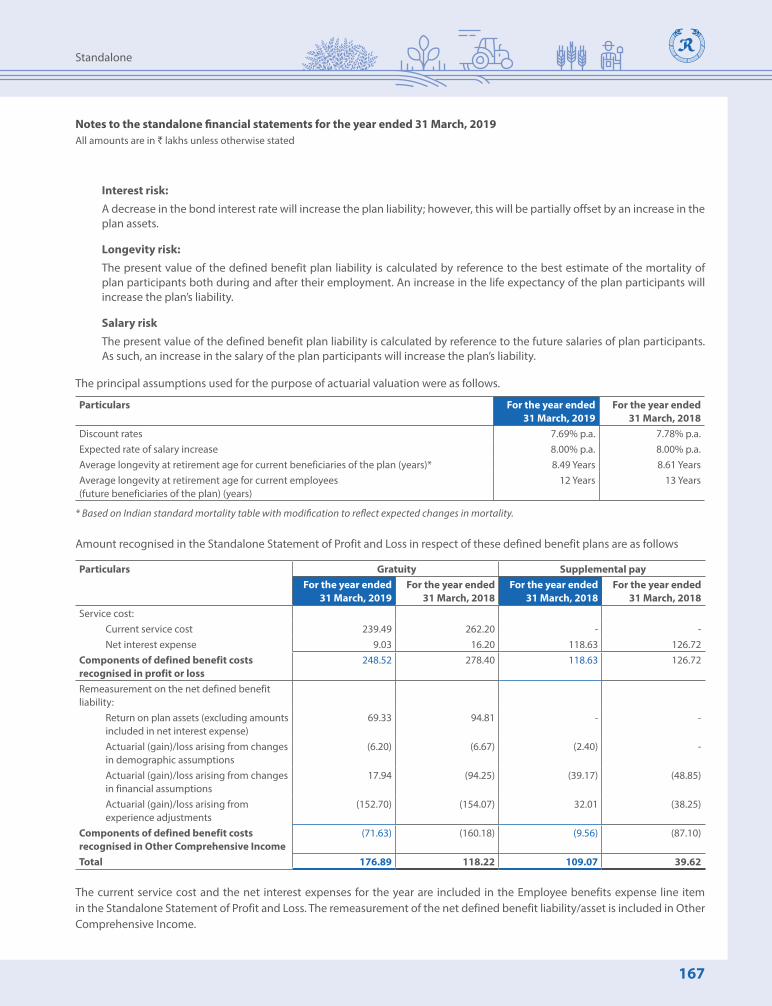
167
Standalone
Interest risk: A decrease in the bond interest rate will increase the plan liability; however, this will be partially offset by an increase in the
plan assets.
Longevity risk: The present value of the defined benefit plan liability is calculated by reference to the best estimate of the mortality of
plan participants both during and after their employment. An increase in the life expectancy of the plan participants will increase the plan’s liability.
Salary risk The present value of the defined benefit plan liability is calculated by reference to the future salaries of plan participants.
As such, an increase in the salary of the plan participants will increase the plan’s liability.
The principal assumptions used for the purpose of actuarial valuation were as follows.
Particulars For the year ended 31 March, 2019
For the year ended 31 March, 2018
Discount rates 7.69% p.a. 7.78% p.a.Expected rate of salary increase 8.00% p.a. 8.00% p.a.Average longevity at retirement age for current beneficiaries of the plan (years)* 8.49 Years 8.61 YearsAverage longevity at retirement age for current employees (future beneficiaries of the plan) (years)
12 Years 13 Years
* Based on Indian standard mortality table with modification to reflect expected changes in mortality.
Amount recognised in the Standalone Statement of Profit and Loss in respect of these defined benefit plans are as follows
Particulars Gratuity Supplemental pay For the year ended
31 March, 2019For the year ended
31 March, 2018For the year ended
31 March, 2018For the year ended
31 March, 2018Service cost: Current service cost 239.49 262.20 - - Net interest expense 9.03 16.20 118.63 126.72 Components of defined benefit costs recognised in profit or loss
248.52 278.40 118.63 126.72
Remeasurement on the net defined benefit liability: Return on plan assets (excluding amounts
included in net interest expense) 69.33 94.81 - -
Actuarial (gain)/loss arising from changes in demographic assumptions
(6.20) (6.67) (2.40) -
Actuarial (gain)/loss arising from changes in financial assumptions
17.94 (94.25) (39.17) (48.85)
Actuarial (gain)/loss arising from experience adjustments
(152.70) (154.07) 32.01 (38.25)
Components of defined benefit costs recognised in Other Comprehensive Income
(71.63) (160.18) (9.56) (87.10)
Total 176.89 118.22 109.07 39.62
The current service cost and the net interest expenses for the year are included in the Employee benefits expense line item in the Standalone Statement of Profit and Loss. The remeasurement of the net defined benefit liability/asset is included in Other Comprehensive Income.
Notes to the standalone financial statements for the year ended 31 March, 2019All amounts are in ` lakhs unless otherwise stated
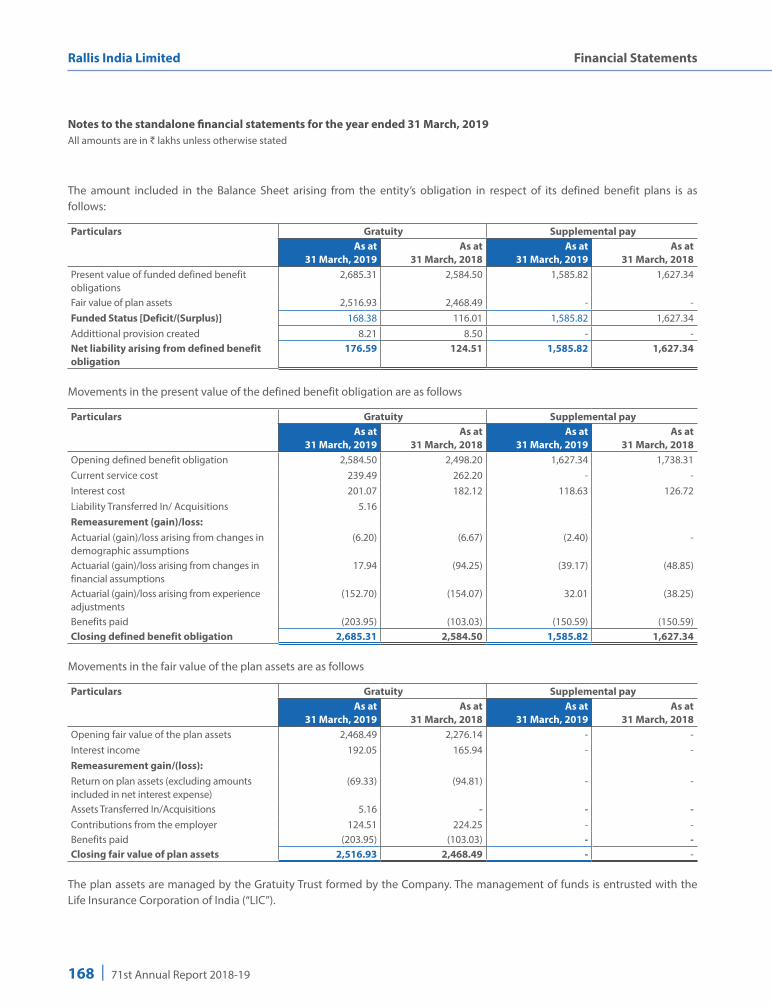
168 | 71st Annual Report 2018-19
Rallis India Limited Financial Statements
The amount included in the Balance Sheet arising from the entity’s obligation in respect of its defined benefit plans is as follows:
Particulars Gratuity Supplemental pay As at
31 March, 2019As at
31 March, 2018As at
31 March, 2019As at
31 March, 2018Present value of funded defined benefit obligations
2,685.31 2,584.50 1,585.82 1,627.34
Fair value of plan assets 2,516.93 2,468.49 - - Funded Status [Deficit/(Surplus)] 168.38 116.01 1,585.82 1,627.34 Addittional provision created 8.21 8.50 - - Net liability arising from defined benefit obligation
176.59 124.51 1,585.82 1,627.34
Movements in the present value of the defined benefit obligation are as follows
Particulars Gratuity Supplemental pay As at
31 March, 2019As at
31 March, 2018As at
31 March, 2019As at
31 March, 2018Opening defined benefit obligation 2,584.50 2,498.20 1,627.34 1,738.31 Current service cost 239.49 262.20 - - Interest cost 201.07 182.12 118.63 126.72 Liability Transferred In/ Acquisitions 5.16 Remeasurement (gain)/loss:Actuarial (gain)/loss arising from changes in demographic assumptions
(6.20) (6.67) (2.40) -
Actuarial (gain)/loss arising from changes in financial assumptions
17.94 (94.25) (39.17) (48.85)
Actuarial (gain)/loss arising from experience adjustments
(152.70) (154.07) 32.01 (38.25)
Benefits paid (203.95) (103.03) (150.59) (150.59)Closing defined benefit obligation 2,685.31 2,584.50 1,585.82 1,627.34
Movements in the fair value of the plan assets are as follows
Particulars Gratuity Supplemental pay As at
31 March, 2019As at
31 March, 2018As at
31 March, 2019As at
31 March, 2018Opening fair value of the plan assets 2,468.49 2,276.14 - - Interest income 192.05 165.94 - - Remeasurement gain/(loss):Return on plan assets (excluding amounts included in net interest expense)
(69.33) (94.81) - -
Assets Transferred In/Acquisitions 5.16 - - - Contributions from the employer 124.51 224.25 - - Benefits paid (203.95) (103.03) - - Closing fair value of plan assets 2,516.93 2,468.49 - -
The plan assets are managed by the Gratuity Trust formed by the Company. The management of funds is entrusted with the Life Insurance Corporation of India (“LIC”).
Notes to the standalone financial statements for the year ended 31 March, 2019All amounts are in ` lakhs unless otherwise stated
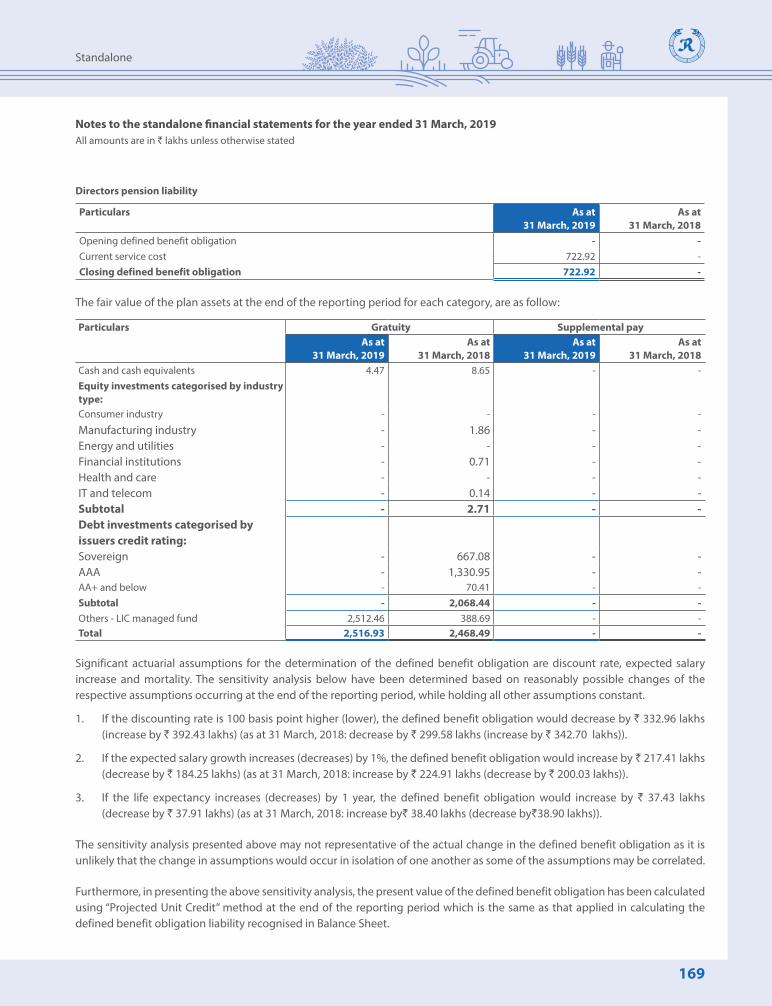
169
Standalone
Directors pension liability
Particulars As at 31 March, 2019
As at 31 March, 2018
Opening defined benefit obligation - - Current service cost 722.92 - Closing defined benefit obligation 722.92 -
The fair value of the plan assets at the end of the reporting period for each category, are as follow:
Particulars Gratuity Supplemental pay As at
31 March, 2019As at
31 March, 2018As at
31 March, 2019As at
31 March, 2018Cash and cash equivalents 4.47 8.65 - - Equity investments categorised by industry type:Consumer industry - - - -
Manufacturing industry - 1.86 - - Energy and utilities - - - - Financial institutions - 0.71 - - Health and care - - - - IT and telecom - 0.14 - - Subtotal - 2.71 - - Debt investments categorised by issuers credit rating:Sovereign - 667.08 - - AAA - 1,330.95 - - AA+ and below - 70.41 - - Subtotal - 2,068.44 - - Others - LIC managed fund 2,512.46 388.69 - - Total 2,516.93 2,468.49 - -
Significant actuarial assumptions for the determination of the defined benefit obligation are discount rate, expected salary increase and mortality. The sensitivity analysis below have been determined based on reasonably possible changes of the respective assumptions occurring at the end of the reporting period, while holding all other assumptions constant.
1. If the discounting rate is 100 basis point higher (lower), the defined benefit obligation would decrease by ` 332.96 lakhs (increase by ` 392.43 lakhs) (as at 31 March, 2018: decrease by ` 299.58 lakhs (increase by ` 342.70 lakhs)).
2. If the expected salary growth increases (decreases) by 1%, the defined benefit obligation would increase by ` 217.41 lakhs (decrease by ` 184.25 lakhs) (as at 31 March, 2018: increase by ` 224.91 lakhs (decrease by ` 200.03 lakhs)).
3. If the life expectancy increases (decreases) by 1 year, the defined benefit obligation would increase by ` 37.43 lakhs (decrease by ` 37.91 lakhs) (as at 31 March, 2018: increase by` 38.40 lakhs (decrease by`38.90 lakhs)).
The sensitivity analysis presented above may not representative of the actual change in the defined benefit obligation as it is unlikely that the change in assumptions would occur in isolation of one another as some of the assumptions may be correlated.
Furthermore, in presenting the above sensitivity analysis, the present value of the defined benefit obligation has been calculated using “Projected Unit Credit” method at the end of the reporting period which is the same as that applied in calculating the defined benefit obligation liability recognised in Balance Sheet.
Notes to the standalone financial statements for the year ended 31 March, 2019All amounts are in ` lakhs unless otherwise stated
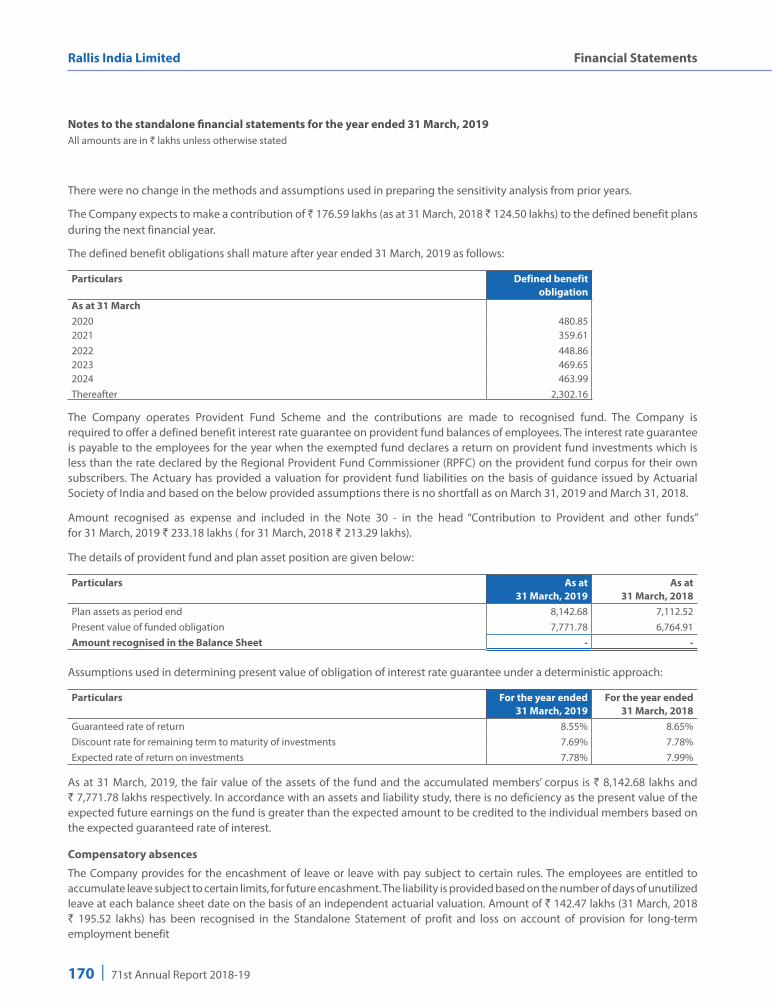
170 | 71st Annual Report 2018-19
Rallis India Limited Financial Statements
There were no change in the methods and assumptions used in preparing the sensitivity analysis from prior years.
The Company expects to make a contribution of ` 176.59 lakhs (as at 31 March, 2018 ` 124.50 lakhs) to the defined benefit plans during the next financial year.
The defined benefit obligations shall mature after year ended 31 March, 2019 as follows:
Particulars Defined benefit obligation
As at 31 March2020 480.85 2021 359.61 2022 448.86 2023 469.65 2024 463.99 Thereafter 2,302.16
The Company operates Provident Fund Scheme and the contributions are made to recognised fund. The Company is required to offer a defined benefit interest rate guarantee on provident fund balances of employees. The interest rate guarantee is payable to the employees for the year when the exempted fund declares a return on provident fund investments which is less than the rate declared by the Regional Provident Fund Commissioner (RPFC) on the provident fund corpus for their own subscribers. The Actuary has provided a valuation for provident fund liabilities on the basis of guidance issued by Actuarial Society of India and based on the below provided assumptions there is no shortfall as on March 31, 2019 and March 31, 2018.
Amount recognised as expense and included in the Note 30 - in the head “Contribution to Provident and other funds” for 31 March, 2019 ` 233.18 lakhs ( for 31 March, 2018 ` 213.29 lakhs).
The details of provident fund and plan asset position are given below:
Particulars As at 31 March, 2019
As at 31 March, 2018
Plan assets as period end 8,142.68 7,112.52 Present value of funded obligation 7,771.78 6,764.91 Amount recognised in the Balance Sheet - -
Assumptions used in determining present value of obligation of interest rate guarantee under a deterministic approach:
Particulars For the year ended 31 March, 2019
For the year ended 31 March, 2018
Guaranteed rate of return 8.55% 8.65%Discount rate for remaining term to maturity of investments 7.69% 7.78%Expected rate of return on investments 7.78% 7.99%
As at 31 March, 2019, the fair value of the assets of the fund and the accumulated members’ corpus is ` 8,142.68 lakhs and ` 7,771.78 lakhs respectively. In accordance with an assets and liability study, there is no deficiency as the present value of the expected future earnings on the fund is greater than the expected amount to be credited to the individual members based on the expected guaranteed rate of interest.
Compensatory absences
The Company provides for the encashment of leave or leave with pay subject to certain rules. The employees are entitled to accumulate leave subject to certain limits, for future encashment. The liability is provided based on the number of days of unutilized leave at each balance sheet date on the basis of an independent actuarial valuation. Amount of ` 142.47 lakhs (31 March, 2018 ` 195.52 lakhs) has been recognised in the Standalone Statement of profit and loss on account of provision for long-term employment benefit
Notes to the standalone financial statements for the year ended 31 March, 2019All amounts are in ` lakhs unless otherwise stated

171
Standalone
38: Financial instruments Capital management
The Company manages its capital to ensure that the Company will be able to continue as going concern while maximising the return to stakeholders through optimisation of debt and equity balance.
The capital structure of the Company consists of net debt (borrowings as detailed in notes 18,19 and 22 offset by cash and bank balances) and total equity of the Company.
The Company is not subject to any externally imposed capital requirements.
Gearing Ratio
The gearing ratio at the end of the reporting period was as follows
Particulars As at 31 March, 2019
As at 31 March, 2018
Debt (i) 7,086.41 2,121.41 Cash and bank balances (3,748.32) (569.16)Net debt 3,338.09 1,552.25 Total equity 1,24,835.73 1,17,884.68 Net debt to equity ratio 2.67% 1.32%
(i) Debt is defined as long-term borrowings, short-term borrowings and current maturities of long term borrowings (excluding financial guarantee contracts), as described in notes 18,19 and 22.
Fair value hierarchy
The following table shows the carrying amounts and fair values of financial assets and financial liabilities, including their levels in the fair value hierarchy. It does not include fair value information for financial assets and financial liabilities not measured at fair value if the carrying amount is a reasonable approximation of fair value.
As at 31 March, 2019
Particulars
Carrying amount Fair value measurement usingTotal FVTPL FVTOCI Amortised
costTotal Quoted
prices in active market
(Level 1)
Significant observable
inputs (Level 2)
Significant unobservable
inputs (Level 3)
Financial assetsCash and cash equivalents 3,490.93 - - 3,490.93 - - - -Other bank balances 257.39 - - 257.39 - - - -Non-current investments(excluding investment in subsidiaries)
378.84 - 378.84 - 378.84 0.50 - 378.34
Current investments 5,949.34 5,949.34 - - 5,949.34 - 5,949.34 - Loans 484.51 - - 484.51 484.51 - - 484.51 Other non current financial assets 21.42 - - 21.42 21.42 - - 21.42 Trade receivables 41,697.36 - - 41,697.36 - - - -Other current financial assets 458.10 79.32 - 378.78 79.32 - 79.32 -Financial liabilitiesNon-current borrowings (excluding current portion)
1,466.50 - - 1,466.50 1,466.50 - - 1,466.50
Current borrowings 5,295.86 - - 5,295.86 - - - -Trade payables 35,956.82 - - 35,956.82 - - - -Other current financial liabilities 8,789.10 - - 8,789.10 - - - -
There have been no transfers among Level 1, Level 2 and Level 3 during the year.
Notes to the standalone financial statements for the year ended 31 March, 2019All amounts are in ` lakhs unless otherwise stated

172 | 71st Annual Report 2018-19
Rallis India Limited Financial Statements
As at 31 March, 2018
Particulars
Carrying amount Fair value measurement usingTotal FVTPL FVTOCI Amortised
costTotal Quoted
prices in active market
(Level 1)
Significant observable
inputs (Level 2)
Significant unobservable
inputs (Level 3)
Financial assetsCash and cash equivalents 272.57 - - 272.57 - - - -Other bank balances 296.59 - - 296.59 - - - -Non-current investments(excluding investment in subsidiaries)
379.03 - 379.03 - 379.03 0.69 - 378.34
Current investments 8,014.43 8,014.43 - - 8,014.43 - 8,014.43 - Loans 385.27 - - 385.27 385.27 - - 385.27 Other non current financial assets 58.65 - - 58.65 58.65 - - 58.65 Trade receivables 36,532.91 - - 36,532.91 - - - -Other current financial assets 551.14 171.02 - 380.12 171.02 - 171.02 -Financial liabilitiesNon-current borrowings (excluding current portion)
1,790.56 - - 1,790.56 1,790.56 - - 1,790.56
Current borrowings 14.59 - - 14.59 - - - -Trade payables 36,865.37 - - 36,865.37 - - - -Other current financial liabilities 7,737.02 - - 7,737.02 - - - -
There have been no transfers among Level 1, Level 2 and Level 3 during the previous year.
Measurement of fair valuesValuation techniques and significant unobservable inputs
The following tables show the valuation techniques used in measuring Level 2 and Level 3 fair values, as well as the significant unobservable inputs used
Financial instruments measured at fair value
Type Valuation technique Significant unobservable inputs
Inter-relationship between significant unobservable inputs and fair value measurement
Non current financial assets and liabilities measured at amortised cost
Discounted cash flows: The valuation model considers the present value of expected receipt/payment discounted using appropriate discounting rates.
Not applicable Not applicable
Forward contracts for foreign exchange contracts
Forward pricing: The fair value is determined using quoted forward exchange rates at the reporting date and present value calculations based on high credit quality yield curves in the respective currency.
Not applicable Not applicable
Current investments -in mutual funds
The fair values of investments in mutual fund units is based on the net asset value (‘NAV’) as stated by the issuers of these mutual fund units in the published statements as at Balance Sheet date. NAV represents the price at which the issuer will issue further units of mutual fund and the price at which issuers will redeem such units from the investors
Not applicable Not applicable
Non-current investments (excluding investment in subsidiaries)
Discounted cash flows: The valuation model considers the present value of expected cash flows discounted using appropriate discounting rates.
Not applicable Not applicable
Notes to the standalone financial statements for the year ended 31 March, 2019All amounts are in ` lakhs unless otherwise stated

173
Standalone
Reconciliation of fair value measurement of investment in unquoted equity instrument classified as FVTOCI (Level 3):
Particulars As at 31 March, 2019
As at 31 March, 2018
Opening balance 378.34 40.70 Remeasurement recognised in OCI - - Purchases - 337.64 Sales - - Closing balance 378.34 378.34
Financial risk management objectives
The Company’s corporate treasury function provides services to the business, co-ordinates access to domestic financial markets, monitors and manages the financial risk relating to the operation of the Company through internal risk reports which analyse exposures by degree and magnitude of risks. These risks include market risk (including currency risk, interest rate risk and other price risk), credit risk and liquidity risk.
The use of financial derivatives is governed by the Company’s policies approved by the board of directors, which provide written principles on foreign exchange risk, interest rate risk, credit risk, the use of financial derivatives and non-derivatives financial instruments, and the investment of excess liquidity. Compliance with policies and exposure limits is reviewed by the internal auditors on a continuous basis. The Company does not enter into or trade financial instrument, including derivative financial instruments, for speculative purposes.
The corporate treasury function reports quarterly to the Company’s risk management committee, an independent body that monitors risks and policies implemented to mitigate risk exposures.
Market risk
The Company’s activities expose it primarily to the financial risk of changes in foreign currency exchange rates. The Company enters into a variety of derivative financial instruments to manage its exposure to foreign currency risk including:
Forward foreign exchange contracts to hedge the exchange rate risk arising on imports and exports.
Foreign currency risk management
The Company undertakes transactions denominated in foreign currencies; consequently, exposures to exchange rate fluctuations arise. Exchange rate exposures are managed within approved policy parameters utilising forward foreign exchange contracts.
The carrying amounts of the Company’s foreign currency dominated monetary assets and monetary liabilities at the end of the reporting period are as follows:
Particulars Liabilities (Foreign currency) Assets (Foreign currency)As at
31 March, 2019As at
31 March, 2018As at
31 March, 2019As at
31 March, 2018In US Dollars (USD) 217.49 201.64 278.71 205.73 In Australian Dollars (AUD) 0.01 0.01 - 18.11 In Euro (EUR) - - 0.44 0.59 In Japanese Yen (JPY) 679.00 4,939.75 - - In Great Britain Pound (GBP) 0.02 0.03 - - In SWISS Franc (CHF) - - 0.02 -
Notes to the standalone financial statements for the year ended 31 March, 2019All amounts are in ` lakhs unless otherwise stated

174 | 71st Annual Report 2018-19
Rallis India Limited Financial Statements
Particulars Liabilities (INR) Assets (INR)As at
31 March, 2019As at
31 March, 2018As at
31 March, 2019As at
31 March, 2018In US Dollars (USD) 15,040.82 13,141.86 19,274.02 13,408.36 In Australian Dollars (AUD) 0.33 0.34 - 906.06 In Euro (EUR) - - 34.06 47.47 In Japanese Yen (JPY) 423.81 3,038.19 - - In Great Britain Pound (GBP) 2.10 2.54 - - In SWISS Franc (CHF) - - 1.09 -
Foreign currency sensitivity analysis
The Company is mainly exposed to the currency : USD, EUR, JPY and GBP.
The following table details the Company’s sensitivity to a 5% increase and decrease in the ` against the relevant foreign currencies. 5% is the sensitivity rate used when reporting foreign currency risk internally to key management personnel and represents management’s assessment of the reasonably possible change in foreign exchange rates. This is mainly attributable to the exposure outstanding on receivables and payables in the Company at the end of the reporting period. The sensitivity analysis includes only outstanding foreign currency denominated monetary items and adjusts their translation at the period end for a 5% charge in foreign currency rate. A positive number below indicates an increase in the profit or equity where the ` strengthens 5% against the relevant currency. For a 5% weakening of the ` against the relevant currency, there would be a comparable impact on the profit or equity , and the balances below would be negative.
Impact on profit / (loss) and total equity
Particulars USD impactAs at
31 March, 2019As at
31 March, 2018Increase in exchange rate by 5% 211.66 13.32 Decrease in exchange rate by 5% (211.66) (13.32)
Particulars AUD impactAs at
31 March, 2019As at
31 March, 2018Increase in exchange rate by 5% (0.02) 45.29 Decrease in exchange rate by 5% 0.02 (45.29)
Particulars EUR impactAs at
31 March, 2019As at
31 March, 2018Increase in exchange rate by 5% 1.70 2.37 Decrease in exchange rate by 5% (1.70) (2.37)
Particulars JPY impactAs at
31 March, 2019As at
31 March, 2018Increase in exchange rate by 5% (21.19) (151.91)Decrease in exchange rate by 5% 21.19 151.91
Notes to the standalone financial statements for the year ended 31 March, 2019All amounts are in ` lakhs unless otherwise stated

175
Standalone
Particulars GBP impactAs at
31 March, 2019As at
31 March, 2018Increase in exchange rate by 5% (0.11) (0.13)Decrease in exchange rate by 5% 0.11 0.13
Particulars SWISS Franc (CHF) impactAs at
31 March, 2019As at
31 March, 2018Increase in exchange rate by 5% 0.05 - Decrease in exchange rate by 5% (0.05) -
The Company, in accordance with its risk management policies and procedures, enters into foreign currency forward contracts to manage its exposure in foreign exchange rate variations. The counter party is generally a bank. These contracts are for a period between one day and one year. The above sensitivity does not include the impact of foreign currency forward contracts which largly mitigate the risk.
Derivative instruments:
The Company uses foreign currency forward contracts to hedge its risks associated with foreign currency fluctuations relating to accounts receivable and accounts payable. The use of foreign currency forward contracts is governed by the Company’s strategy approved by the Board of Directors, which provide principles on the use of such forward contracts consistent with the Company’s Risk Management Policy. The Company does not use forward contracts for speculative purposes.
The following forward exchange contracts are outstanding as at balance sheet date:
Particulars As at 31 March, 2019 As at 31 March, 2018Number of
contracts` lakhs Foreign currency
in lakhsNumber of
contracts` lakhs Foreign currency
in lakhsReceivables 6 3,550.22 USD 51.34 1 411.32 USD 6.31 Payable 1 423.81 JPY 679.00 4 2,997.14 JPY 4,873.00
Note: USD= US Dollar; JPY = Japanese Yen
The line item in the Balance Sheet that includes the above hedging instruments are “other financial assets and other financial liabilities.
Equity risk
There is no material equity risk relating to the Company’s equity investments which are detailed in note 7 “Other investments”. The Company’s equity investments majorly comprises of strategic investments rather than trading purposes.
Interest risk
Interest rate risk is the risk that the fair value or future cash flows of a financial instrument that will fluctuate because of changes in market rates. The Company’s exposure to the risk of changes in market rates relates primarily to the Company’s non-current debt obligation with floating interest rates. The Company’s policy is generally to undertake non-current borrowing using facilities that carry floating interest rate. Moreover,the short-term borrowings of the Company do not have a significant fair value or cash flow interest rate risk due to their short tenure.
Notes to the standalone financial statements for the year ended 31 March, 2019All amounts are in ` lakhs unless otherwise stated

176 | 71st Annual Report 2018-19
Rallis India Limited Financial Statements
At the end of reporting period, the Company had the following variable interest rate borrowings and fixed interest rate financial assets:
Particulars As at 31 March, 2019
As at 31 March, 2018
Non-current variable interest rate borrowings 1,221.04 1,528.82 Current variable interest rate borrowings 5,295.86 14.59Fixed interest rate financial assets 101.69 180.92
Cash flow sensitivity analysis for variable rate instrumentNon-current variable interest rate borrowingsIf the interest rate is 100 basis point higher (lower), the impact on profit or loss would be decreased by ` 23.86 lakhs (increased by ` 23.86 lakhs) (as at 31 March, 2018: decreased by ` 37.42 lakhs (increased by ` 37.42 lakhs)).
Current variable interest rate borrowingsIf the interest rate is 100 basis point higher (lower), the impact on profit or loss would be decreased by ` 1.16 lakhs (increased by ` 1.16 lakhs) (as at 31 March, 2018: decreased by ` Nil (increased by ` Nil)).
Credit risk managementCredit risk refers to the risk that a counter party will default on its contractual obligation resulting in financial loss to the Company. The Company uses its own trading records to evaluate the credit worthiness of its customers.The Company’s exposure are continuously monitored and the aggregate value of transactions concluded, are spread amongst approved counter parties (refer note 12- Trade receivable).
The credit risk on investment in mutual funds and derivative financial instruments is limited because the counter parties are reputed banks or funds sponsored by reputed bank.
Liquidity risk managementUltimate responsibility for liquidity risk management rests with the Board of Directors, which has established an appropriate liquidity risk management framework for the management of the Company’s short-term, medium-term and long-term funding and liquidity management requirements. The Company manages liquidity risk by maintaining adequate reserves, banking facilities and reserve borrowing facilities, by continuously monitoring forecast and actual cash flows, and by matching the maturity profiles of financial assets and liabilities.
All current financial liabilities are repayable within one year. The contractual maturities of non-current liabilities are disclosed in note no. 18.
Liquidity risk tableThe following table detail the Company’s remaining contractual maturity for its non-derivative financial liabilities with agreed repayment periods. The tables have been drawn up based on the undiscounted cash flows of financial liabilities based on the earliest date on which the company can be required to pay.
Particulars Less than 1 year
1-5 years More than 5 year
Total Carrying amount
As at 31 March, 2019Borrowings including future interest payable 5,722.59 1,388.32 196.34 7,307.25 7,086.41 Trade payables 35,956.82 - - 35,956.82 35,956.82 Other financial liabilities 8,465.05 - - 8,465.05 8,465.05
50,144.46 1,388.32 196.34 51,729.12 51,508.28
As at 31 March, 2018Borrowings including future interest payable 444.28 1,607.49 382.12 2,433.89 2,121.41 Trade payables 36,865.37 - - 36,865.37 36,865.37 Other financial liabilities 7,420.76 - - 7,420.76 7,420.76
44,730.41 1,607.49 382.12 46,720.02 46,407.54
Notes to the standalone financial statements for the year ended 31 March, 2019All amounts are in ` lakhs unless otherwise stated

177
Standalone
39: Related party transactionsDetails of transactions between the Company and other related party are disclosed below.
1. Holding Company
Name of holding Country HoldingAs at
31 March, 2019As at
31 March, 2018Tata Chemicals Ltd. India 50.06% 50.06%
2. List of Subsidiaries
Name of subsidiaries Country HoldingAs at
31 March, 2019As at
31 March, 2018DirectRallis Chemistry Exports Ltd.* India - 100.00%Metahelix Life Science Ltd. India 100.00% 100.00%Zero Waste Agro Organics Ltd. India 100.00% 100.00%IndirectPT. Metahelix Lifesciences Indonesia Indonesia 65.77% 65.77%
* During the year ended 31 March, 2019, Rallis Chemistry Exports Ltd. has made an application to the Registrar of Companies for removal of its name from the Register of Companies, hence investment has been written off from books of accounts,however it is continued to be subsidiary of the Company till the time removal of its name from the Register of Companies.
3. Other related parties
Rallis India Limited Provident Fund
Rallis India Limited Management Staff Gratuity Fund
Rallis India Limited Senior Assistants Super Annuation Scheme
Rallis Executive Staff Super Annuation Fund
Rallis India Limited Non-Management Staff Gratuity Fund
4. Key Management Personnel
Mr. V. Shankar, Managing Director and CEO (upto 31 March, 2019)
Mr. R. Mukundan, Managing Director and CEO (w.e.f. 3 December, 2018 till 31 March, 2019)
5. Promoter Group
Tata Sons Private Limited
Notes to the standalone financial statements for the year ended 31 March, 2019All amounts are in ` lakhs unless otherwise stated
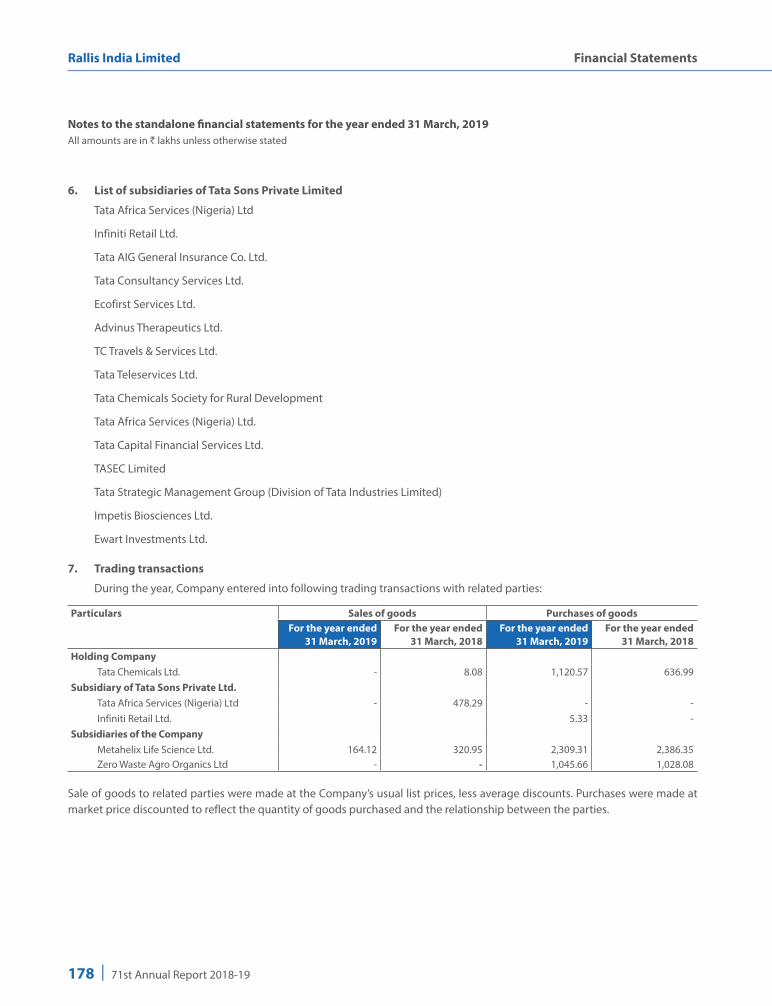
178 | 71st Annual Report 2018-19
Rallis India Limited Financial Statements
6. List of subsidiaries of Tata Sons Private Limited
Tata Africa Services (Nigeria) Ltd
Infiniti Retail Ltd.
Tata AIG General Insurance Co. Ltd.
Tata Consultancy Services Ltd.
Ecofirst Services Ltd.
Advinus Therapeutics Ltd.
TC Travels & Services Ltd.
Tata Teleservices Ltd.
Tata Chemicals Society for Rural Development
Tata Africa Services (Nigeria) Ltd.
Tata Capital Financial Services Ltd.
TASEC Limited
Tata Strategic Management Group (Division of Tata Industries Limited)
Impetis Biosciences Ltd.
Ewart Investments Ltd.
7. Trading transactions
During the year, Company entered into following trading transactions with related parties:
Particulars Sales of goods Purchases of goodsFor the year ended
31 March, 2019For the year ended
31 March, 2018For the year ended
31 March, 2019For the year ended
31 March, 2018Holding Company Tata Chemicals Ltd. - 8.08 1,120.57 636.99Subsidiary of Tata Sons Private Ltd. Tata Africa Services (Nigeria) Ltd - 478.29 - - Infiniti Retail Ltd. 5.33 - Subsidiaries of the Company Metahelix Life Science Ltd. 164.12 320.95 2,309.31 2,386.35 Zero Waste Agro Organics Ltd - - 1,045.66 1,028.08
Sale of goods to related parties were made at the Company’s usual list prices, less average discounts. Purchases were made at market price discounted to reflect the quantity of goods purchased and the relationship between the parties.
Notes to the standalone financial statements for the year ended 31 March, 2019All amounts are in ` lakhs unless otherwise stated
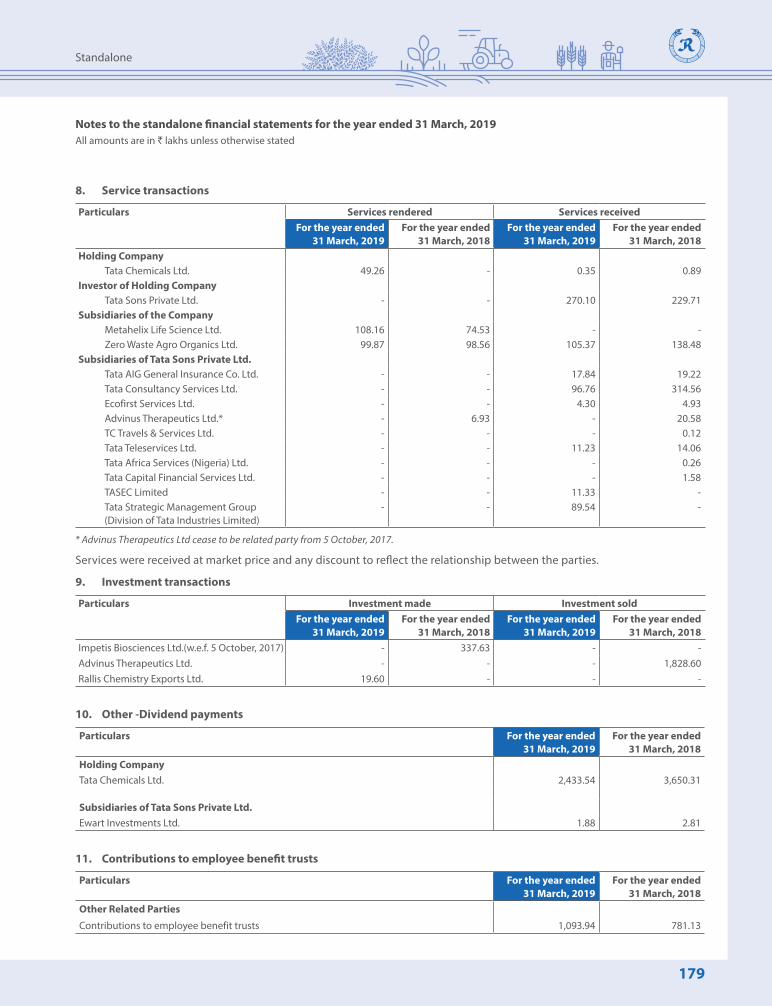
179
Standalone
8. Service transactions
Particulars Services rendered Services receivedFor the year ended
31 March, 2019For the year ended
31 March, 2018For the year ended
31 March, 2019For the year ended
31 March, 2018Holding Company Tata Chemicals Ltd. 49.26 - 0.35 0.89 Investor of Holding Company Tata Sons Private Ltd. - - 270.10 229.71Subsidiaries of the Company Metahelix Life Science Ltd. 108.16 74.53 - - Zero Waste Agro Organics Ltd. 99.87 98.56 105.37 138.48Subsidiaries of Tata Sons Private Ltd. Tata AIG General Insurance Co. Ltd. - - 17.84 19.22 Tata Consultancy Services Ltd. - - 96.76 314.56 Ecofirst Services Ltd. - - 4.30 4.93 Advinus Therapeutics Ltd.* - 6.93 - 20.58 TC Travels & Services Ltd. - - - 0.12 Tata Teleservices Ltd. - - 11.23 14.06 Tata Africa Services (Nigeria) Ltd. - - - 0.26 Tata Capital Financial Services Ltd. - - - 1.58 TASEC Limited - - 11.33 - Tata Strategic Management Group
(Division of Tata Industries Limited) - - 89.54 -
* Advinus Therapeutics Ltd cease to be related party from 5 October, 2017.
Services were received at market price and any discount to reflect the relationship between the parties.
9. Investment transactions
Particulars Investment made Investment soldFor the year ended
31 March, 2019For the year ended
31 March, 2018For the year ended
31 March, 2019For the year ended
31 March, 2018Impetis Biosciences Ltd.(w.e.f. 5 October, 2017) - 337.63 - - Advinus Therapeutics Ltd. - - - 1,828.60 Rallis Chemistry Exports Ltd. 19.60 - - -
10. Other -Dividend payments
Particulars For the year ended 31 March, 2019
For the year ended 31 March, 2018
Holding CompanyTata Chemicals Ltd. 2,433.54 3,650.31
Subsidiaries of Tata Sons Private Ltd.Ewart Investments Ltd. 1.88 2.81
11. Contributions to employee benefit trusts
Particulars For the year ended 31 March, 2019
For the year ended 31 March, 2018
Other Related Parties
Contributions to employee benefit trusts 1,093.94 781.13
Notes to the standalone financial statements for the year ended 31 March, 2019All amounts are in ` lakhs unless otherwise stated

180 | 71st Annual Report 2018-19
Rallis India Limited Financial Statements
The following balances were outstanding at the end of the reporting period:-
Particulars Amounts owed by related parties Amounts owed to related partiesAs at
31 March, 2019As at
31 March, 2018As at
31 March, 2019As at
31 March, 2018Holding Company Tata Chemicals Ltd. 49.26 - 70.60 17.79 Subsidiaries of the Company Metahelix Life Science Ltd. 106.78 122.27 101.87 94.78 Zero Waste Agro Organics Ltd. - - 160.57 256.73Subsidiaries of Tata Sons Private Limited Tata AIG General Insurance Co. Ltd. 0.70 0.44 - - Tata Consultancy Services Ltd. - - - 6.67 Tata Teleservices (Maharashtra) Ltd. - - 0.02 0.24 Tata Consulting Engineers Ltd. 11.79 - - - Tata Strategic Management Group
(Division of Tata Industries Limited) - - 59.24 -
The amounts outstanding are unsecured and will be settled in cash. No guarantees have been given or taken during the year except as below. No expense has been recognised in the current or prior years for bad & doubtful debts in respect of the amounts owed by related parties.
It does not include balances which were provided in earlier years (refer note 9).
The Company had issued a corporate guarantee to debenture trustee in respect of issuance of debentures of ` 27,000.00 lakhs by Advinus Therapeutics Ltd. (Advinus), to the extent of 16.89% of the total subscription of debentures issued by Advinus. The guarantee had been released during the previous year on 5 October, 2017. The Company’s maximum exposure in this respect is ` Nil as at 31 March, 2019 ( as at 31 March, 2018: ` Nil).
12. Compensation of key management personnel
The remuneration of key management personnel during the year was as follows:
Particulars For the year ended 31 March, 2019
For the year ended 31 March, 2018
Short term benefits 366.31 389.36 Post-Employment benefits ( PF + Superannuation) 21.51 20.09
The remuneration of key management personnel is determined by the remuneration committee having regard to the performance of individuals and market trends. It is exclusive of gratuity and compensated absence.
40: Contingent liabilities The Company is involved in a number of appellate, judicial and arbitration proceedings (including those described below) concerning matters arising in the course of conduct of the Company’s businesses. Some of these proceedings in respect of matters under litigation are in early stages, and in some other cases, the claims are indeterminate. A summary of claims asserted on the Company in respect of these cases have been summarised below.
Notes to the standalone financial statements for the year ended 31 March, 2019All amounts are in ` lakhs unless otherwise stated

181
Standalone
a. Tax contingencies
Amounts in respect of claims asserted by various revenue authorities on the Company, in respect of taxes, which are in dispute, have been tabulated below:
Nature of tax As at 31 March, 2019
As at 31 March, 2018
Sales tax 1,311.47 1,370.75 Excise duty 515.35 525.70 Customs duty 144.10 144.10 Income tax 6,542.32 6,299.72 Service tax 61.01 60.26
The management believes that the claims made are untenable and is contesting them. As of the reporting date, the management is unable to determine the ultimate outcome of above matters. However, in the event the revenue authorities succeed with enforcement of their assessments, the Company may be required to pay some or all of the asserted claims and the consequential interest and penalties, which would reduce net income and could have a material adverse effect on net income in the respective reported period.
b. Amount in respect of other claims
Nature of claim For the year ended 31 March, 2019
For the year ended 31 March, 2018
Matters relating to employee benefits 94.26 103.11 Others (claims related to contractual disputes) 55.07 65.53
Management is generally unable to reasonably estimate a range of possible loss for proceedings or disputes other than those included in the estimate above, including where:
(i) plaintiffs / parties have not claimed an amount of money damages, unless management can otherwise determine an appropriate amount;
(ii) the proceedings are in early stages;
(iii) there is uncertainty as to the outcome of pending appeals or motions or negotiations;
(iv) there are significant factual issues to be resolved; and/or
(v) there are novel legal issues presented.
However, in respect of the above matters, management does not believe, based on currently available information, that the outcomes of the litigation, will have a material adverse effect on the Company’s financial condition, though the outcomes could be material to the Company’s operating results for any particular period, depending, in part, upon the operating results for such period.
c. “The Hon’ble Supreme Court of India (“SC”) by their order dated February 28, 2019, in the case of Surya Roshani Limited & others v/s EPFO, set out the principles based on which allowances paid to the employees should be identified for inclusion in basic wages for the purposes of computation of Provident Fund contribution. Subsequently, a review petition against this decision has been filed and is pending before the SC for disposal.
In view of the management, the liability for the period from date of the SC order to 31 March 2019 is not significant and has been provided in the books of account. Further, pending decision on the subject review petition and directions from the EPFO, the impact for the past period, if any, is not ascertainable and consequently no effect has been given in the accounts.
Notes to the standalone financial statements for the year ended 31 March, 2019All amounts are in ` lakhs unless otherwise stated

182 | 71st Annual Report 2018-19
Rallis India Limited Financial Statements
41: Commitments(i) Estimated amount of contracts remaining to be executed on capital account of property, plant and equipment is ̀ 1,454.11
lakhs as at 31 March, 2019 (as at 31 March, 2018: ` 483.46 lakhs) and Other intangible assets is ` 6.41 lakhs as at 31 March, 2019 (as at 31 March, 2018: ` 89.05 lakhs) against which advances paid aggregate ` 84.07 lakhs as at 31 March, 2019 (as at 31 March, 2018: ` 53.50 lakhs).
(ii) For lease commitments refer note no 36.
42: Research and development expenditure The Company has incurred the following expenses on research and development activity:
Particulars (Refer footnote) For the year ended 31 March, 2019
For the year ended 31 March, 2018
On property, plant and equipment 124.54 65.78 On items which have been expensed during the year - Materials 127.55 138.36 - Employee benefits expense 910.32 964.70 - Professional fees 43.64 55.75 - Consumables 24.38 27.54 - Finance costs 0.57 1.05 - Travelling expenses 53.52 70.65 - Rent 40.60 38.28 - Depreciation and amortisation expense 236.48 350.59 - Others 393.94 211.38 Expenses - External agency 19.38 20.85 Total 1,974.92 1,944.93
During the year, the Company has also incurred ₹ 4.60 lakhs (31 March, 2018 ₹ 43.58) towards capital research and development expenditure which is included under capital work-in-progress. The total amount included in capital work-in-progress as at 31 March 2019 is ₹ 1,278.49 lakhs (as at 31 March, 2018 ₹ 1,206.45 lakhs).
footnote:
The above figures include the amounts based on separate accounts for the Research and Developments (“R&D”) Centre recognised by the Department of Scientific & Industrial Research (“DSIR”), Ministry of Science and Technology for in-house research (consonance with the DSIR guidelines for in-house R & D Centre will be evaluated at the time of filing the return with DSIR).
43: Other expenses include Auditors’ Remuneration as under:
Particulars For the year ended 31 March, 2019
For the year ended 31 March, 2018
(a) To statutory auditors For audit 42.80 40.00 For limited review of quarterly results 15.00 15.00 For taxation matters 6.00 5.00 For other services 21.65 5.52 Reimbursement of expenses 4.05 1.68
Recoverable taxes which is being claimed for set-off as input credit has not been included in the expenditure above.
Notes to the standalone financial statements for the year ended 31 March, 2019All amounts are in ` lakhs unless otherwise stated
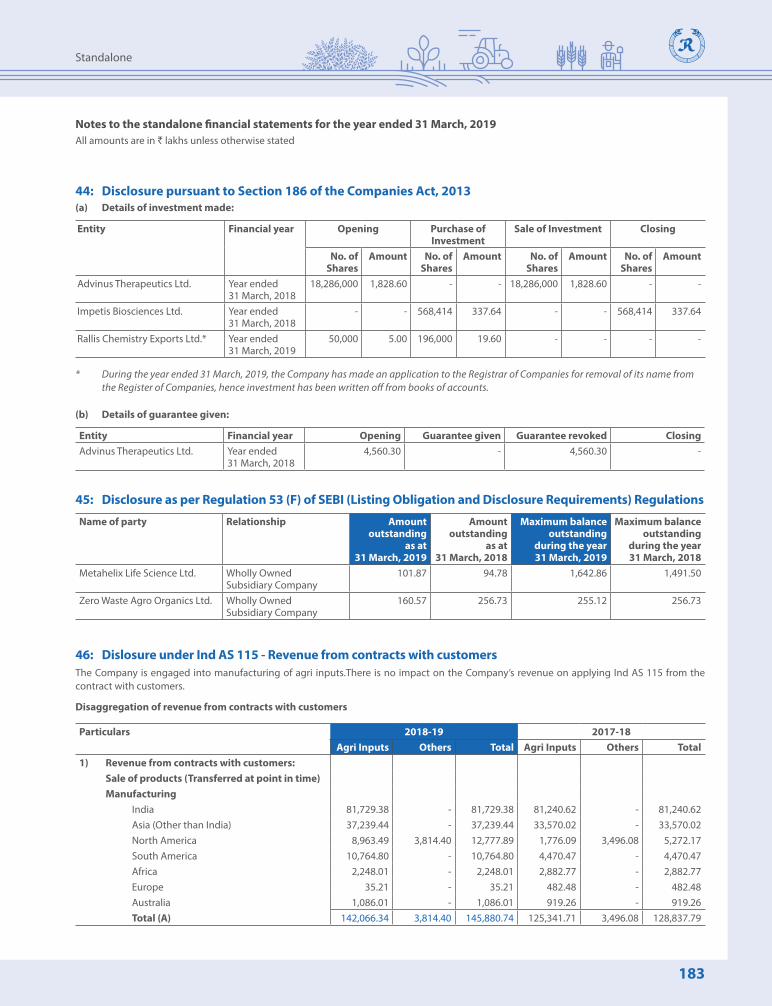
183
Standalone
44: Disclosure pursuant to Section 186 of the Companies Act, 2013(a) Details of investment made:
Entity Financial year Opening Purchase of Investment
Sale of Investment Closing
No. of Shares
Amount No. of Shares
Amount No. of Shares
Amount No. of Shares
Amount
Advinus Therapeutics Ltd. Year ended 31 March, 2018
18,286,000 1,828.60 - - 18,286,000 1,828.60 - -
Impetis Biosciences Ltd. Year ended 31 March, 2018
- - 568,414 337.64 - - 568,414 337.64
Rallis Chemistry Exports Ltd.* Year ended 31 March, 2019
50,000 5.00 196,000 19.60 - - - -
* During the year ended 31 March, 2019, the Company has made an application to the Registrar of Companies for removal of its name from the Register of Companies, hence investment has been written off from books of accounts.
(b) Details of guarantee given:
Entity Financial year Opening Guarantee given Guarantee revoked ClosingAdvinus Therapeutics Ltd. Year ended
31 March, 2018 4,560.30 - 4,560.30 -
45: Disclosure as per Regulation 53 (F) of SEBI (Listing Obligation and Disclosure Requirements) Regulations
Name of party Relationship Amount outstanding
as at 31 March, 2019
Amount outstanding
as at 31 March, 2018
Maximum balance outstanding
during the year 31 March, 2019
Maximum balance outstanding
during the year 31 March, 2018
Metahelix Life Science Ltd. Wholly Owned Subsidiary Company
101.87 94.78 1,642.86 1,491.50
Zero Waste Agro Organics Ltd. Wholly Owned Subsidiary Company
160.57 256.73 255.12 256.73
46: Dislosure under Ind AS 115 - Revenue from contracts with customersThe Company is engaged into manufacturing of agri inputs.There is no impact on the Company’s revenue on applying Ind AS 115 from the contract with customers.
Disaggregation of revenue from contracts with customers
Particulars 2018-19 2017-18Agri Inputs Others Total Agri Inputs Others Total
1) Revenue from contracts with customers: Sale of products (Transferred at point in time) Manufacturing India 81,729.38 - 81,729.38 81,240.62 - 81,240.62 Asia (Other than India) 37,239.44 - 37,239.44 33,570.02 - 33,570.02 North America 8,963.49 3,814.40 12,777.89 1,776.09 3,496.08 5,272.17 South America 10,764.80 - 10,764.80 4,470.47 - 4,470.47 Africa 2,248.01 - 2,248.01 2,882.77 - 2,882.77 Europe 35.21 - 35.21 482.48 - 482.48 Australia 1,086.01 - 1,086.01 919.26 - 919.26 Total (A) 142,066.34 3,814.40 145,880.74 125,341.71 3,496.08 128,837.79
Notes to the standalone financial statements for the year ended 31 March, 2019All amounts are in ` lakhs unless otherwise stated
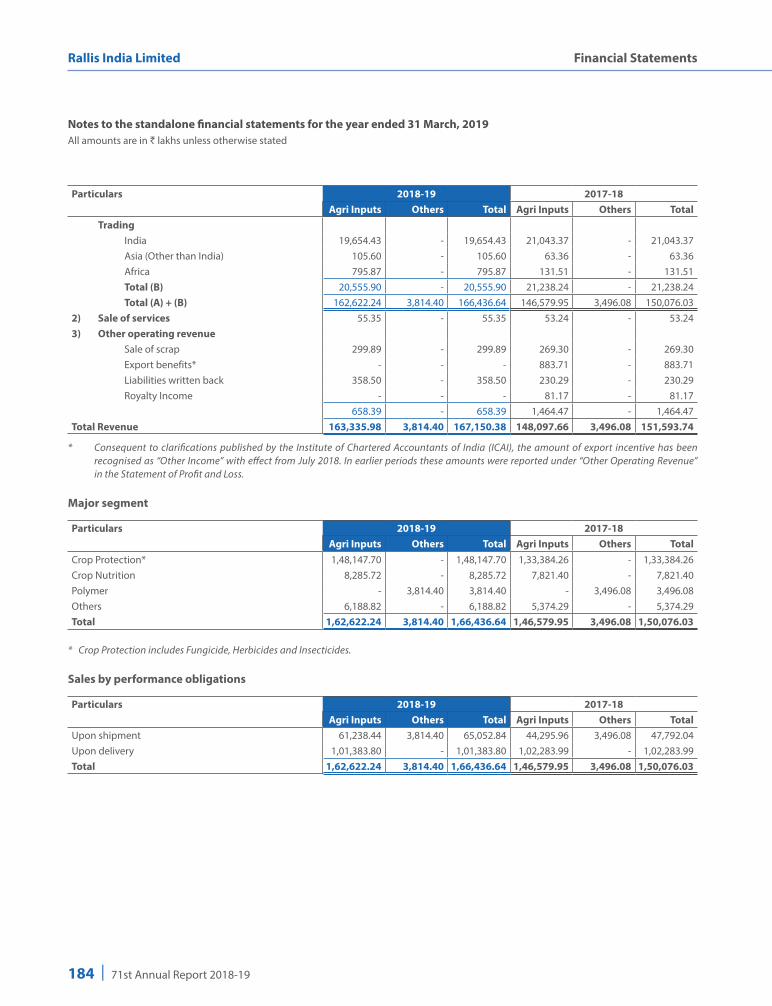
184 | 71st Annual Report 2018-19
Rallis India Limited Financial Statements
Notes to the standalone financial statements for the year ended 31 March, 2019All amounts are in ` lakhs unless otherwise stated
Particulars 2018-19 2017-18Agri Inputs Others Total Agri Inputs Others Total
Trading India 19,654.43 - 19,654.43 21,043.37 - 21,043.37 Asia (Other than India) 105.60 - 105.60 63.36 - 63.36 Africa 795.87 - 795.87 131.51 - 131.51 Total (B) 20,555.90 - 20,555.90 21,238.24 - 21,238.24 Total (A) + (B) 162,622.24 3,814.40 166,436.64 146,579.95 3,496.08 150,076.03 2) Sale of services 55.35 - 55.35 53.24 - 53.24 3) Other operating revenue Sale of scrap 299.89 - 299.89 269.30 - 269.30 Export benefits* - - - 883.71 - 883.71 Liabilities written back 358.50 - 358.50 230.29 - 230.29 Royalty Income - - - 81.17 - 81.17
658.39 - 658.39 1,464.47 - 1,464.47 Total Revenue 163,335.98 3,814.40 167,150.38 148,097.66 3,496.08 151,593.74
* Consequent to clarifications published by the Institute of Chartered Accountants of India (ICAI), the amount of export incentive has been recognised as “Other Income” with effect from July 2018. In earlier periods these amounts were reported under “Other Operating Revenue” in the Statement of Profit and Loss.
Major segment
Particulars 2018-19 2017-18Agri Inputs Others Total Agri Inputs Others Total
Crop Protection* 1,48,147.70 - 1,48,147.70 1,33,384.26 - 1,33,384.26Crop Nutrition 8,285.72 - 8,285.72 7,821.40 - 7,821.40 Polymer - 3,814.40 3,814.40 - 3,496.08 3,496.08 Others 6,188.82 - 6,188.82 5,374.29 - 5,374.29 Total 1,62,622.24 3,814.40 1,66,436.64 1,46,579.95 3,496.08 1,50,076.03
* Crop Protection includes Fungicide, Herbicides and Insecticides.
Sales by performance obligations
Particulars 2018-19 2017-18Agri Inputs Others Total Agri Inputs Others Total
Upon shipment 61,238.44 3,814.40 65,052.84 44,295.96 3,496.08 47,792.04 Upon delivery 1,01,383.80 - 1,01,383.80 1,02,283.99 - 1,02,283.99Total 1,62,622.24 3,814.40 1,66,436.64 1,46,579.95 3,496.08 1,50,076.03
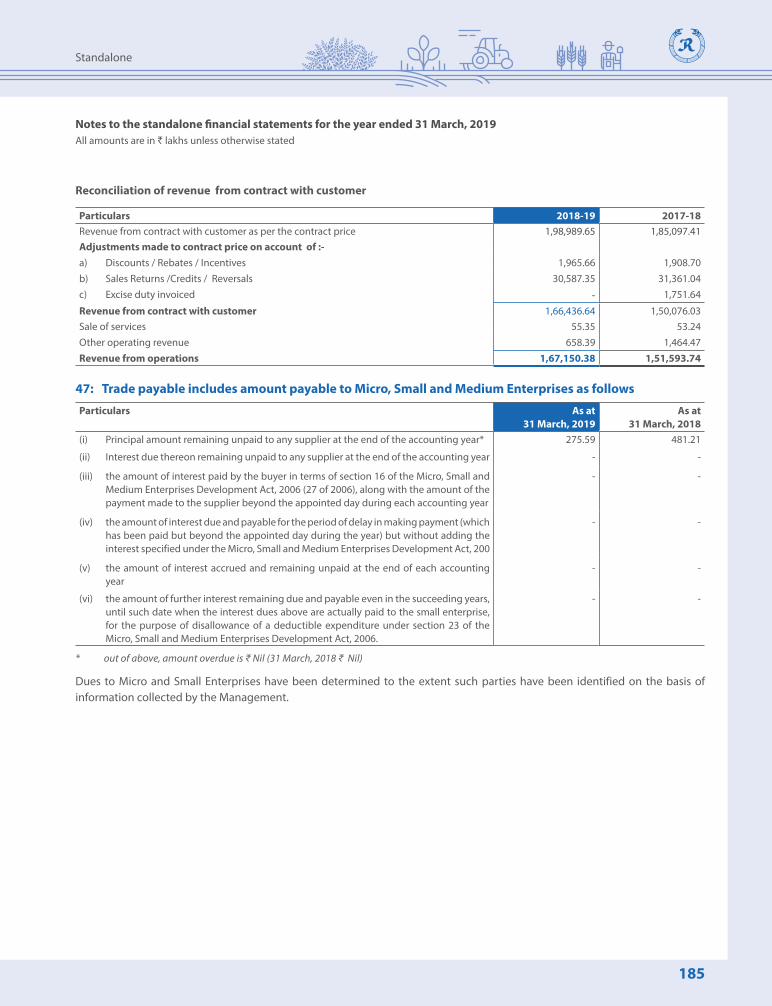
185
Standalone
Notes to the standalone financial statements for the year ended 31 March, 2019All amounts are in ` lakhs unless otherwise stated
Reconciliation of revenue from contract with customer
Particulars 2018-19 2017-18Revenue from contract with customer as per the contract price 1,98,989.65 1,85,097.41Adjustments made to contract price on account of :-a) Discounts / Rebates / Incentives 1,965.66 1,908.70 b) Sales Returns /Credits / Reversals 30,587.35 31,361.04 c) Excise duty invoiced - 1,751.64
Revenue from contract with customer 1,66,436.64 1,50,076.03 Sale of services 55.35 53.24 Other operating revenue 658.39 1,464.47 Revenue from operations 1,67,150.38 1,51,593.74
47: Trade payable includes amount payable to Micro, Small and Medium Enterprises as follows
Particulars As at 31 March, 2019
As at 31 March, 2018
(i) Principal amount remaining unpaid to any supplier at the end of the accounting year* 275.59 481.21
(ii) Interest due thereon remaining unpaid to any supplier at the end of the accounting year - -
(iii) the amount of interest paid by the buyer in terms of section 16 of the Micro, Small and Medium Enterprises Development Act, 2006 (27 of 2006), along with the amount of the payment made to the supplier beyond the appointed day during each accounting year
- -
(iv) the amount of interest due and payable for the period of delay in making payment (which has been paid but beyond the appointed day during the year) but without adding the interest specified under the Micro, Small and Medium Enterprises Development Act, 200
- -
(v) the amount of interest accrued and remaining unpaid at the end of each accounting year
- -
(vi) the amount of further interest remaining due and payable even in the succeeding years, until such date when the interest dues above are actually paid to the small enterprise, for the purpose of disallowance of a deductible expenditure under section 23 of the Micro, Small and Medium Enterprises Development Act, 2006.
- -
* out of above, amount overdue is ₹ Nil (31 March, 2018 ₹ Nil)
Dues to Micro and Small Enterprises have been determined to the extent such parties have been identified on the basis of information collected by the Management.

186 | 71st Annual Report 2018-19
Rallis India Limited Financial Statements
48: The gross amount required to be spent by the Company during the year towards Corporate Social Responsibility (CSR) as per the provision of section 135 of the Companies Act, 2013 amounts to ₹ 384.70 lakhs (31 March, 2018 ₹ 388.00 lakhs). Amount spent during the year on CSR activities (included in Note 30 and Note 33 of the Statement of Profit and Loss) as under
Particulars For the year ended 31 March, 2019
For the year ended 31 March, 2018
Amount spent for the year
Employee benefits expense 19.23 19.10 Other expenses (for healthcare, education, women empowerment, skill development , disaster relief , etc.)
366.86 381.85
386.09 400.95 In cash 386.09 400.95 Yet to be paid in cash - -
386.09 400.95
49: The Company made a contribution to an electoral trust of ` 500 lakhs (31 March, 2018 ` Nil) which is included in other expenses.
50: Subsequent event The Board of Directors at its meeting held on 25 April, 2019 has recommended a dividend of ` 2.50 per equity share
(31 March, 2018 ` 2.50 per equity share), subject to shareholders approval at annual general meeting.
51: The MCA wide notification dated 11 October, 2018 has amended Schedule Ill to the Companies Act, 2013 in respect of certain disclosures. The Company has incorporated appropriate changes in the above results.
As per our report of even date attached
For B S R & Co. LLPChartered Accountants Firm’s Registration No. 101248W/W-100022
For and on behalf of the Board of Directors of Rallis India Limited PRAKASH R. RASTOGI(DIN: 00110862)
BHASKAR BHAT(DIN: 00148778)
Chairman
R. MUKUNDAN(DIN: 00778253)
SANJIV LAL (DIN: 08376952)
Managing Director & CEO
PUNITA KUMAR-SINHA (DIN: 05229262)
ASHISH MEHTA(M. No. 53039)
Chief Financial Officer
ANIRUDDHA GODBOLE PartnerMembership No. 105149
C.V. NATRAJ (DIN: 07132764)
DirectorsYASHASWIN SHETH (M. No. A15388)
Company Secretary
PADMINI KHARE KAICKER (DIN: 00296388)
Mumbai, 25 April, 2019 JOHN MULHALL (DIN: 08101474)
Mumbai, 25 April, 2019

187
Consolidated
Report on the audit of the Consolidated Financial Statements
Opinion
We have audited the accompanying consolidated financial statements of Rallis India Limited (hereinafter referred to as ‘the Holding Company’) and its subsidiaries (the Holding Company and its subsidiaries together referred to as “the Group”), which comprise the consolidated balance sheet as at 31 March 2019, the consolidated statement of profit and loss (including other comprehensive income), the consolidated statement of changes in equity and the consolidated statement of cash flows for the year then ended, and notes to the consolidated financial statements, including a summary of significant accounting policies and other explanatory information (hereinafter referred to as “the consolidated financial statements”).
In our opinion and to the best of our information and according to the explanations given to us, and based on the consideration of reports of other auditors on separate financial statements of such subsidiaries as were audited by the other auditors, the aforesaid consolidated financial statements give the information required by the Companies Act, 2013 (‘the Act’) in the manner so required and give a true and fair view in conformity with the accounting principles generally accepted in India, of the consolidated state of affairs of the Group as at 31 March 2019, of its consolidated profit
Independent Auditors’ Report To the Members of Rallis India Limited
and other comprehensive income, consolidated changes in equity and consolidated cash flows for the year then ended.
Basis for Opinion
We conducted our audit of the consolidated financial statements in accordance with the Standards on Auditing (SAs) specified under Section 143 (10) of the Act. Our responsibilities under those SAs are further described in the Auditors’ Responsibility for the Audit of the Consolidated Financial Statements section of our report. We are independent of the Group in accordance with the Code of Ethics issued by the Institute of Chartered Accountants of India, and we have fulfilled our other ethical responsibilities in accordance with provisions of the Act. We believe that the audit evidence we have obtained and evidence obtained by the other auditors in terms of their reports referred to in the ‘Other Matters’ paragraph below, is sufficient and appropriate to provide a basis for our opinion on the consolidated financial statements.
Key Audit Matters
Key audit matters are those matters that, in our professional judgment, were of most significance in our audit of the consolidated financial statements of the current period. These matters were addressed in the context of our audit of the consolidated financial statements as a whole, and in forming our opinion thereon, and we do not provide a separate opinion on these matters.
Revenue recognitionThe Key Audit Matter How the matter was addressed in our auditRevenue is measured based on transaction price, which is the consideration, adjusted for rebates, discounts, incentives (scheme allowances) and estimated sales returns. As disclosed in Note 3.16 to the consolidated financial statements, revenue is recognised upon transfer of control of promised goods to customers in an amount that reflects the consideration which the Group expects to receive in exchange for those goods.
Sales return estimationAs disclosed in Note 3.16 to the consolidated financial statements, revenue is recognised net of sales returns.
Estimation of sales returns involves significant judgement and estimates due to its dependency on various internal and external factors.
Estimation of sales return amount together with the level of judgement involved makes its accounting treatment a significant matter for our audit.
Our audit procedures included following:
- Understanding the process followed by the management for the purpose of identifying and determining the amount of provision of sales returns and accrual for rebates and schemes;
- Checking of completeness and accuracy of the data used by the management for the purpose of calculation of the provision for sales returns and checking of its arithmetical accuracy;
- Comparison between the estimate of the provision for sales returns created in the past with subsequent actual sales returns and analysis of the nature of any deviations to corroborate the effectiveness of the management estimation process;
- Considering the appropriateness of the Group’s accounting policies regarding revenue recognition as they relate to accounting for rebates, discounts and scheme allowances;
- Testing the Group’s process and controls over the calculation of rebates, discounts and scheme allowance;

188 | 71st Annual Report 2018-19
Rallis India Limited Financial Statements
The Key Audit Matter How the matter was addressed in our auditAccrual for rebates and schemesRevenue is recognised net of rebates, discounts, incentives (scheme allowances) and estimated sales returns owed to the customers based on the arrangement with customers.
The recognition and measurement of rebates, discounts and schemes allowances, including establishing an appropriate accrual at year end, involves significant judgement and estimates, particularly the expected level of claims of each of the customers.
The value of rebates, discounts and schemes allowances together with the level of judgement involved make its accounting treatment a significant matter for our audit.
- Selecting a samples of revenue transactions and scheme circular to re-check that rebates, discounts and scheme allowance were calculated in accordance with the eligibility criteria mentioned in the scheme circular;
- Selecting a sample of claims submitted by customers along with claim form and verifying it with the accrual made in the books of account; and
- Considering the assumptions and judgements used by the Group in calculating rebates, discounts and schemes allowances, including the level of expected claims, by reviewing historical trends of claims.
Impairment testing of other intangible assets and intangible assets under developmentThe Key Audit Matter How the matter was addressed in our auditThe Group’s intangible assets comprised goodwill and product registrations.
The carrying amount of the intangible assets and intangible assets under development represents 2.18% of the Group’s total assets.
Impairment testing of goodwillAs required by Ind AS - 36 ‘Impairment of Assets’, the Group annually tests the amount of goodwill for impairment where indicators of impairment exist using a discounted cash flow model to estimate the recoverable value. This impairment test is significant to our audit because the assessment process is complex and judgement is based on assumptions such as expected growth rate, expected profitability and future market or economic conditions.
Other intangible assets and intangible assets under developmentThe Group applies for product registrations in different countries to sell its products. The Group capitalises costs incurred to apply for product registrations.
The value of intangible assets was identified as a key audit matter as the Group’s annual impairment assessment contains significant judgments involving forecasting and discounting future cash flows. It also involves likelihood of obtaining product registration.
The impairment assessment is based on each product registrations value in use.
Due to significance and magnitude of the costs capitalised this was considered a key audit matter.
Our audit procedures in respect of impairment testing of goodwill included the following:
- Review the appropriateness of management’s basis to identify relevant CGUs for which Goodwill is being tested;
- Testing the mathematical accuracy of the discounted cash flow model and evaluation of the assumptions and methodologies used by the Group;
- In respect of forecasts, we:
• Assessed the subsidiaries current year actual results incomparison with prior year forecasts to assess forecast accuracy;
• Assessed the Group’s assumptions for growth rate in theimpairment model in comparison to economic and industry forecast; and
• Assessedthediscountratesthroughcomparingthecostofcapital for the Group with comparable business.
- We assessed the adequacy of the Group’s disclosures of those assumptions used for impairment testing of goodwill.
Our audit procedures in respect of impairment testing of intangible assets (including those under development) included the following:
- Inquired with management about its intention and probability to obtain product registrations in the respective geographies;
- Compared management’s assessment with the past trend product registrations awarded; and
- Testing the mathematical accuracy of the discounted cash flow model and evaluation of the assumptions and methodologies used by the Group.

189
Consolidated
Other InformationThe Holding Company’s Management and Board of Directors are responsible for the other information. The other information comprises the information included in the Holding Company’s annual report, but does not include the financial statements and our auditors’ report thereon.
Our opinion on the consolidated financial statements does not cover the other information and we do not express any form of assurance conclusion thereon.
In connection with our audit of the consolidated financial statements, our responsibility is to read the other information and, in doing so, consider whether the other information is materially inconsistent with the consolidated financial statements or our knowledge obtained in the audit or otherwise appears to be materially misstated. If, based on the work done / audit report of other auditors, we conclude that there is a material misstatement of this other information, we are required to report that fact. We have nothing to report in this regard.
Responsibilities of Management and Those Charged with Governance for the Consolidated Financial StatementsThe Holding Company’s Management and Board of Directors are responsible for the preparation and presentation of these consolidated financial statements in terms of the requirements of the Act that give a true and fair view of the consolidated state of affairs, consolidated profit / loss and other comprehensive income, consolidated statement of changes in equity and consolidated cash flows of the Group in accordance with the accounting principles generally accepted in India, including the Indian Accounting Standards (Ind AS) prescribed under Section 133 of the Act. The respective Board of Directors of the companies included in the Group are responsible for maintenance of adequate accounting records in accordance with the provisions of the Act for safeguarding the assets of each company and for preventing and detecting frauds and other irregularities; the selection and application of appropriate accounting policies; making judgments and estimates that are reasonable and prudent; and design, implementation and maintenance of adequate internal financial controls that were operating effectively for ensuring the accuracy and completeness of the accounting records, relevant to the preparation and presentation of the consolidated financial statements that give a true and fair view and are free from material misstatement, whether due to fraud or error which have been used for the purpose of preparation of the consolidated financial statements by the Directors of the Holding Company, as aforesaid.
In preparing the consolidated financial statements, the respective Management and Board of Directors of the
companies included in the Group are responsible for assessing the ability of the Group to continue as a going concern, disclosing, as applicable, matters related to going concern and using the going concern basis of accounting unless management either intends to liquidate the Group (Holding Company and subsidiaries) or to cease operations, or has no realistic alternative but to do so.
The respective Board of Directors of the companies included in the Group is responsible for overseeing the financial reporting process of each company.
Auditors’ Responsibility for the Audit of the Consolidated Financial StatementsOur objective is to obtain reasonable assurance about whether the consolidated financial statements as a whole are free from material misstatement, whether due to fraud or error, and to issue an auditors’ report that includes our opinion. Reasonable assurance is a high level of assurance, but is not a guarantee that an audit conducted in accordance with SAs will always detect a material misstatement when it exists. Misstatements can arise from fraud or error and are considered material if, individually or in the aggregate, they could reasonably be expected to influence the economic decisions of users taken on the basis of these consolidated financial statements.
As part of an audit in accordance with SAs, we exercise professional judgment and maintain professional skepticism throughout the audit. We also:
• Identify and assess the risks ofmaterialmisstatementof the consolidated financial statements, whether due to fraud or error, design and perform audit procedures responsive to those risks, and obtain audit evidence that is sufficient and appropriate to provide a basis for our opinion. The risk of not detecting a material misstatement resulting from fraud is higher than for one resulting from error, as fraud may involve collusion, forgery, intentional omissions, misrepresentations, or the override of internal control.
• Obtainanunderstandingofinternalcontrolrelevanttothe audit in order to design audit procedures that are appropriate in the circumstances. Under Section 143(3)(i) of the Act, we are also responsible for expressing our opinion on whether the Group has adequate internal financial controls system in place and the operating effectiveness of such controls.
• Evaluate the appropriateness of accounting policiesused and the reasonableness of accounting estimates and related disclosures made by management.

190 | 71st Annual Report 2018-19
Rallis India Limited Financial Statements
• Concludeontheappropriateness of management’s use of the going concern basis of accounting in preparation of consolidated financial statements and, based on the audit evidence obtained, whether a material uncertainty exists related to events or conditions that may cast significant doubt on the appropriateness of this assumption. If we conclude that a material uncertainty exists, we are required to draw attention in our auditor’s report to the related disclosures in the consolidated financial statements or, if such disclosures are inadequate, to modify our opinion. Our conclusions are based on the audit evidence obtained up to the date of our auditor’s report. However, future events or conditions may cause the Group (Holding Company and subsidiaries) to cease to continue as a going concern.
• Evaluatetheoverallpresentation,structureandcontentof the consolidated financial statements, including the disclosures, and whether the consolidated financial statements represent the underlying transactions and events in a manner that achieves fair presentation.
• Obtainsufficientappropriateauditevidenceregardingfinancial information of such entities or business activities within the Group to express an opinion on the consolidated financial statements, of which we are the independent auditors. We are responsible for direction, supervision and performance of the audit of the financial information of such entities.
For the other entities included in the consolidated financial statements, which have been audited by other auditors, such other auditors remain responsible for the direction, supervision and performance of the audits carried out by them. We remain solely responsible for our audit opinion. Our responsibilities in this regard are further described in para (a) of the section titled ‘Other Matters’ in this audit report.
We believe that the audit evidence obtained by us along with the consideration of audit reports of the other auditors referred to in sub-paragraph (a) of the Other Matters paragraph below, is sufficient and appropriate to provide a basis for our audit opinion on the consolidated financial statements.
We communicate with those charged with governance of the Holding Company and such other entities included in the consolidated financial statements of which we are the independent auditors regarding, among other matters, the planned scope and timing of the audit and significant audit findings, including any significant deficiencies in internal control that we identify during our audit.
We also provide those charged with governance with a statement that we have complied with relevant ethical
requirements regarding independence, and to communicate with them all relationships and other matters that may reasonably be thought to bear on our independence, and where applicable, related safeguards.
From the matters communicated with those charged with governance, we determine those matters that were of most significance in the audit of the consolidated financial statements of the current period and are therefore the key audit matters. We describe these matters in our auditors’ report unless law or regulation precludes public disclosure about the matter or when, in extremely rare circumstances, we determine that a matter should not be communicated in our report because the adverse consequences of doing so would reasonably be expected to outweigh the public interest benefits of such communication.
Other Matters a) We have not audited the financial statements of Rallis
Chemistry Exports Limited, Zero Waste Agro-Organics Limited and PT Metahelix Life Sciences Indonesia whose financial statement reflect total assets of ` 2,362.11 lakhs as at 31 March 2019, total revenue of ` 1,244.62 lakhs and net cash flows amounting to ` 3.65 lakhs for the year ended on that date, as considered in the consolidated financial statements. These standalone financial statements have been audited by other auditors whose reports have been furnished to us by the Management and our opinion on the consolidated financial statements, in so far as it relates to the amounts and disclosures included in respect of these subsidiaries, and our report in terms of Section 143 (3) of the Act, in so far as it relates to the aforesaid subsidiaries, is based solely on the reports of the other auditors.
b) One subsidiary is located outside India whose financial statements and other financial information have been prepared in accordance with accounting principles generally accepted in that country and which have been audited by other auditor under generally accepted auditing standards applicable in that country. The Holding Company’s management has converted the financial statements of such subsidiary located outside India from accounting principles generally accepted in that country to accounting principles generally accepted in India. We have audited this conversion adjustment made by the Holding Company’s management. Our opinion in so far as it related to the balances and affairs of such subsidiary located outside India is based on the report of other auditors and the conversion adjustments prepared by the management of the Holding Company and audited by us.
191
Consolidated
Our opinion on the consolidated financial statements, and our report on Other Legal and Regulatory Requirements below, is not modified in respect of the above matters with respect to our reliance on the work done and the reports of the other auditors.
Report on Other Legal and Regulatory Requirements(A) As required by Section 143 (3) of the Act, based on
our audit and on the consideration of reports of other auditors on separate financial statements and other financial information of such subsidiaries, as were audited by other auditors, as noted in the ‘Other Matters’ paragraph, we report, to the extent applicable, that:
(a) We have sought and obtained all the information and explanations, which to the best of our knowledge and belief, were necessary for the purposes of our audit of the aforesaid consolidated financial statements;
(b) In our opinion, proper books of account as required by law relating to preparation of the aforesaid consolidated financial statements have been kept so far as it appears from our examination of those books and the reports of the other auditors;
(c) The consolidated balance sheet, the consolidated statement of profit and loss (including other comprehensive income), the consolidated statement of changes in equity and the consolidated statement of cash flows dealt with by this report are in agreement with the relevant books of account maintained for the purpose of preparation of the consolidated financial statements;
(d) in our opinion, the aforesaid consolidated financial statements comply with the Indian Accounting Standards (Ind AS) prescribed under Section 133 of the Act;
(e) on the basis of the written representations received from the directors of the Holding Company as on 31 March 2019 taken on record by the Board of Directors of the Holding Company and the reports of the statutory auditors of its subsidiary companies incorporated in India, none of the directors of the Group companies incorporated in India are disqualified as on 31 March 2019 from being appointed as a director in terms of Section 164 (2) of the Act; and
(f ) with respect to adequacy of the internal financial controls with reference to financial statements of the Holding Company and its subsidiary
companies incorporated in India and the operating effectiveness of such controls, refer to our separate Report in “Annexure A”.
(B) with respect to the other matters to be included in the Auditors’ Report in accordance with Rule 11 of the Companies (Audit and Auditors) Rules, 2014, in our opinion and to the best of our information and according to the explanations given to us and based on the consideration of the report of the other auditors on separate financial statements and also the other financial information of the subsidiaries, as noted in the ‘Other Matters’ paragraph:
i. the consolidated financial statements disclose the impact of pending litigations on the consolidated financial position of the Group – Refer Note 41 to the consolidated financial statements;
ii. the Holding Company and its subsidiary companies did not have any long-term contracts, including derivative contracts, for which there were any material foreseeable losses; and
iii. there has been no delay in transferring amounts, required to be transferred, to the Investor Education and Protection Fund by the Holding Company and its subsidiary companies incorporated in India during the year ended 31 March 2019.
(C) With respect to the matter to be included in the Auditors’ Report under Section 197(16):
In our opinion and according to the information and explanations given to us and based on the reports of the statutory auditors of such subsidiary companies incorporated in India which were not audited by us, the remuneration paid during the current year by the Holding Company and its subsidiary companies incorporated in India to its directors is in accordance with the provisions of Section 197 of the Act. The remuneration paid to any director by the Holding Company and its subsidiary companies incorporated in India is not in excess of the limit laid down under Section 197 of the Act. The Ministry of Corporate Affairs has not prescribed other details under Section 197(16) which are required to be commented upon by us.
For B S R & Co. LLPChartered Accountants
Firm’s Registration No: 101248W/W-100022
Aniruddha GodboleMumbai Partner25 April, 2019 Membership No: 105149

192 | 71st Annual Report 2018-19
Rallis India Limited Financial Statements
Annexure A to the Independent Auditors’ Report – 31 March, 2019
Report on the Internal Financial Controls with reference to the aforesaid consolidated financial statements under Clause (i) of Sub-section 3 of Section 143 of the Companies Act, 2013 (“the Act”)
(Referred to in paragraph (A)(f) under ‘Report on Other Legal and Regulatory Requirements’ section of our report of even date)
Opinion
In conjunction with our audit of the consolidated financial statements of Rallis India Limited (“the Holding Company”) as of and for the year ended 31 March 2019, we have audited the internal financial controls with reference to consolidated financial statements of the Holding Company and its subsidiary companies incorporated in India (the Holding Company and its subsidiary companies incorporated in India together referred to as the “Group”), as of that date.
In our opinion, the Holding Company and such subsidiary companies incorporated in India, have, in all material respects, adequate internal financial controls with reference to consolidated financial statements and such internal financial controls were operating effectively as at 31 March 2019, based on the internal financial controls with reference to consolidated financial statements criteria established by such companies considering the essential components of such internal controls stated in the Guidance Note on Audit of Internal Financial Controls Over Financial Reporting issued by the Institute of Chartered Accountants of India (the “Guidance Note”).
Management’s Responsibility for Internal Financial Controls
The respective company’s management and the Board of Directors are responsible for establishing and maintaining internal financial controls with reference to consolidated financial statements based on the criteria established by the respective company considering the essential components of internal control stated in the Guidance Note. These responsibilities include the design, implementation and maintenance of adequate internal financial controls that were operating effectively for ensuring the orderly and efficient conduct of its business, including adherence to
the respective company’s policies, the safeguarding of its assets, the prevention and detection of frauds and errors, the accuracy and completeness of the accounting records, and the timely preparation of reliable financial information, as required under the Act.
Auditors’ Responsibility
Our responsibility is to express an opinion on the internal financial controls with reference to consolidated financial statements based on our audit. We conducted our audit in accordance with the Guidance Note and the Standards on Auditing, prescribed under section 143(10) of the Act, to the extent applicable to an audit of internal financial controls with reference to consolidated financial statements. Those Standards and the Guidance Note require that we comply with ethical requirements and plan and perform the audit to obtain reasonable assurance about whether adequate internal financial controls with reference to consolidated financial statements were established and maintained and if such controls operated effectively in all material respects.
Our audit involves performing procedures to obtain audit evidence about the adequacy of the internal financial controls with reference to consolidated financial statements and their operating effectiveness. Our audit of internal financial controls with reference to consolidated financial statements included obtaining an understanding of internal financial controls with reference to consolidated financial statements, assessing the risk that a material weakness exists, and testing and evaluating the design and operating effectiveness of the internal controls based on the assessed risk. The procedures selected depend on the auditor’s judgement, including the assessment of the risks of material misstatement of the consolidated financial statements, whether due to fraud or error.
We believe that the audit evidence we have obtained and the audit evidence obtained by the other auditors of the relevant subsidiary companies incorporated in India, in terms of their reports referred to in the Other Matters paragraph below, is sufficient and appropriate to provide a basis for our audit opinion on the internal financial controls with reference to consolidated financial statements.

193
Consolidated
Meaning of Internal Financial Controls with reference to consolidated financial statements
A company’s internal financial control with reference to financial statements is a process designed to provide reasonable assurance regarding the reliability of financial reporting and the preparation of financial statements for external purposes in accordance with generally accepted accounting principles. A company’s internal financial control reference to financial statements includes those policies and procedures that (1) pertain to the maintenance of records that, in reasonable detail, accurately and fairly reflect the transactions and dispositions of the assets of the company; (2) provide reasonable assurance that transactions are recorded as necessary to permit preparation of financial statements in accordance with generally accepted accounting principles, and that receipts and expenditures of the company are being made only in accordance with authorizations of management and directors of the company; and (3) provide reasonable assurance regarding prevention or timely detection of unauthorised acquisition, use, or disposition of the company’s assets that could have a material effect on the financial statements.
Inherent Limitations of Internal Financial Controls with reference to consolidated financial statements
Because of the inherent limitations of internal financial controls with reference to consolidated financial statements, including the possibility of collusion or improper management override of controls, material misstatements due to error or fraud may occur and not be detected. Also, projections of any evaluation of the internal financial controls with reference to consolidated financial statements to future periods are subject to the risk that the internal financial controls with reference to consolidated financial statements may become inadequate because of changes in conditions, or that the degree of compliance with the policies or procedures may deteriorate.
Other Matters
Our aforesaid report under clause (i) of sub-section 3 of Section 143 of the Act on the adequacy and operating effectiveness of the internal financial controls with reference to consolidated financial statements insofar as it relates to subsidiary companies incorporated in India, is based solely on the report of the auditors of the subsidiary companies incorporated in India.
For B S R & Co. LLPChartered Accountants
Firm’s Registration No : 101248W/W-100022
Aniruddha GodboleMumbai Partner25 April, 2019 Membership No: 105149

194 | 71st Annual Report 2018-19
Rallis India Limited Financial Statements
Notes As at 31 March, 2019
As at 31 March, 2018
ASSETSNon-current assetsa) Property, plant and equipment 4 36,976.98 36,403.41 b) Capital work-in-progress 4 1,287.69 1,234.39 c) Investment property 5 549.86 557.97 d) Goodwill 6.1 19,582.31 19,582.31 e) Other intangible assets 6.2 968.35 822.77 f ) Intangible assets under development 6.2 3,782.88 3,497.49 g) Financial assets i) Investments 7 378.84 379.03 ii) Loans 8 674.09 645.41 iii) Other financial assets 9 42.17 58.65 h) Income-tax assets (Net) 10 7,519.64 7,209.21 i) Deferred tax assets (Net) 23 2,171.70 2,078.14 j) Other non-current assets 14 3,178.52 3,283.06 Total non-current assets 77,113.03 75,751.84 Current assetsa) Inventories 11 67,355.35 57,218.28 b) Financial assets i) Investments 7 10,548.14 9,180.69 ii) Loans 8 93.33 111.61 iii) Trade receivables 12 44,906.94 39,967.30 iv) Cash and cash equivalents 13.1 4,184.99 2,892.61 v) Bank balances other than (iv) above 13.2 389.81 446.58 vi) Other financial assets 9 460.54 561.71 c) Other current assets 14 13,380.80 12,463.65
1,41,319.90 1,22,842.43 Assets classified as held for sale 15 - 1,264.90 Total current assets 1,41,319.90 1,24,107.33 Total assets 2,18,432.93 1,99,859.17
1,41,319.90
EQUITY AND LIABILITIESEquitya) Equity share capital 16 1,944.71 1,944.71 b) Other equity 17 1,26,648.01 1,17,112.65 Equity attributable to owners of the Company 1,28,592.72 1,19,057.36 Non-controlling interest 18 184.18 110.63 Total equity 1,28,776.90 1,19,167.99 LiabilitiesNon-current liabilitiesa) Financial Liabilities Borrowings 19 1,580.16 1,987.78 b) Other financial liabilities 21 640.50 606.56 c) Provisions 22 2,188.88 1,588.55 d) Deferred tax liabilities (Net) 23 3,816.21 4,052.61 e) Other non-current liabilities 25 9.81 11.32 Total non-current liabilities 8,235.56 8,246.82 Current liabilitiesa) Financial liabilities i) Borrowings 20 5,295.86 14.59 ii) Trade payables 24 -total outstanding dues of micro enterprises and small enterprises 288.82 481.44 -total outstanding dues of creditors other than micro enterprises and small enterprises 53,192.78 52,127.30 iii) Other financial liabilities 21 10,679.62 9,010.32 b) Other current liabilities 25 9,911.25 9,030.19 c) Provisions 22 1,624.99 1,451.53 d) Income-tax liabilities (Net) 10 427.15 328.99 Total current liabilities 81,420.47 72,444.36 Total liabilities 89,656.03 80,691.18 Total equity and liabilities 2,18,432.93 1,99,859.17 See accompanying notes to the consolidated financial statements 1 to 51
Consolidated Balance Sheet as at 31 March, 2019All amounts are in ` lakhs unless otherwise stated
As per our report of even date attached
For B S R & Co. LLPChartered Accountants Firm’s Registration No. 101248W/W-100022
For and on behalf of the Board of Directors of Rallis India Limited PRAKASH R. RASTOGI(DIN: 00110862)
BHASKAR BHAT(DIN: 00148778)
Chairman
R. MUKUNDAN(DIN: 00778253)
SANJIV LAL (DIN: 08376952)
Managing Director & CEO
PUNITA KUMAR-SINHA (DIN: 05229262)
ASHISH MEHTA(M. No. 53039)
Chief Financial Officer
ANIRUDDHA GODBOLE PartnerMembership No. 105149
C.V. NATRAJ (DIN: 07132764)
DirectorsYASHASWIN SHETH (M. No. A15388)
Company Secretary
PADMINI KHARE KAICKER (DIN: 00296388)
Mumbai, 25 April, 2019 JOHN MULHALL (DIN: 08101474)
Mumbai, 25 April, 2019

195
Consolidated
Consolidated Statement of Profit and Loss for the year ended 31 March, 2019 All amounts are in ` lakhs except for earning per equity share information
Notes For the year ended 31 March, 2019
For the year ended 31 March, 2018
I Revenue from operations 26 1,98,395.89 1,80,846.33 II Other income 27 3,065.26 1,317.50 III Total Income (I+II) 2,01,461.15 1,82,163.83
IV ExPENSESCost of materials consumed 28 1,19,529.09 90,177.47 Purchases of stock-in-trade 29 11,642.09 20,178.15 Changes in inventories of finished goods, stock-in-trade and work-in-progress 30 (14,018.10) (10,118.61)Excise duty on sale of goods - 1,751.64 Employee benefits expense 31 18,063.56 16,489.93 Finance costs 32 524.74 430.53 Depreciation and amortisation expense 33 4,607.81 4,631.08 Other expenses 34 39,085.53 35,921.38 Total expenses (IV) 1,79,434.71 1,59,461.57
V Profit before tax (III-IV) 22,026.44 22,702.26
VI Tax expense 10(1) Current tax 6,875.99 6,631.68(2) Deferred tax (327.94) (631.11)Total tax expense (VI) 6,548.05 6,000.57
VII Profit for the year (V-VI) 15,478.39 16,701.69
VIII OTHER COMPREHENSIVE INCOMEItems that will not be reclassified to profit or loss :a) Remeasurements of the employee defined benefit plans 20.74 241.34 b) Equity instruments through other comprehensive income (141.41) (196.96)c) Income tax relating to item that will not be reclassified to profit or loss (24.65) (66.36)Items that will be reclassified to profit or lossExchange differences in translating the financial statements of a foreign operation (2.69) (10.53)
Total other comprehensive income (net of taxes) (148.01) (32.51)
Ix Total comprehensive income for the year 15,330.38 16,669.18
x Profit for the year attributable to:Owners of the Company 15,538.45 16,761.22 Non-controlling interests (60.06) (59.53)
15,478.39 16,701.69 xI Other comprehensive income attributable to:
Owners of the Company (148.01) (32.51)Non-controlling interests - -
(148.01) (32.51)xII Total comprehensive income attributable to:
Owners of the Company 15,390.44 16,728.71 Non-controlling interests (60.06) (59.53)
15,330.38 16,669.18 Earnings per equity share (of ` 1 each) 35(1) Basic (In `) 7.99 8.62 (2) Diluted (In `) 7.99 8.62 See accompanying notes to the consolidated financial statements 1 to 51
As per our report of even date attached
For B S R & Co. LLPChartered Accountants Firm’s Registration No. 101248W/W-100022
For and on behalf of the Board of Directors of Rallis India Limited PRAKASH R. RASTOGI(DIN: 00110862)
BHASKAR BHAT(DIN: 00148778)
Chairman
R. MUKUNDAN(DIN: 00778253)
SANJIV LAL (DIN: 08376952)
Managing Director & CEO
PUNITA KUMAR-SINHA (DIN: 05229262)
ASHISH MEHTA(M. No. 53039)
Chief Financial Officer
ANIRUDDHA GODBOLE PartnerMembership No. 105149
C.V. NATRAJ (DIN: 07132764)
DirectorsYASHASWIN SHETH (M. No. A15388)
Company Secretary
PADMINI KHARE KAICKER (DIN: 00296388)
Mumbai, 25 April, 2019 JOHN MULHALL (DIN: 08101474)
Mumbai, 25 April, 2019

196 | 71st Annual Report 2018-19
Rallis India Limited Financial Statements
Consolidated Statement of changes in equity for the year ended 31 March, 2019All amounts are in ` lakhs unless otherwise stated
A. Equity share capital
Balance as at 1 April, 2017 1,944.71
Changes in Equity Share Capital during 2017-2018 -
Balance as at 31 March, 2018 1,944.71
Changes in Equity Share Capital during 2018-2019 -
Balance as at 31 March, 2019 1,944.71
B. Other equity
Attributable to the owners of the company Non-controlling
interests TotalSecurities premium reserve
Retained earnings
Capital reserve
Capital redemption
reserve
General reserve
Equity instrument
through OCI
Foreign currency
translation reserve
Total
Balance as at 1 April, 2017 8,793.88 73,332.65 1,243.10 8,151.77 17,649.93 0.39 - 1,09,171.72 43.06 1,11,159.49
Profit for the year - 16,761.22 - - - - - 16,761.22 (59.53) 16,701.69
Other comprehensive income (Net of taxes) - 174.98 - - - (196.96) (10.53) (32.51) - (32.51)
Total comprehensive income - 16,936.20 - - - (196.96) (10.53) 16,728.71 (59.53) 16,669.18
Transfer to / (from) retained earnings - (196.96) - - - 196.96 - - - -
Payment of dividends - (7,292.58) - - - - - (7,292.58) - (7,292.58)
Payment of dividend distribution tax - (1,495.20) - - - - - (1,495.20) - (1,495.20)
Movement in non-controlling interests - - - - - - - - 127.10 127.10
Balance as at 31 March, 2018 8,793.88 81,284.11 1,243.10 8,151.77 17,649.93 0.39 (10.53) 1,17,112.65 110.63 1,19,167.99
Profit for the year - 15,538.45 - - - - - 15,538.45 (60.06) 15,478.39
Other comprehensive income (Net of taxes) - (3.91) - - - (141.41) (2.69) (148.01) - (148.01)
Total comprehensive income - 15,534.54 - - - (141.41) (2.69) 15,390.44 (60.06) 15,330.38
Transfer to / (from) retained earnings (141.22) 141.22 - - - -
Payment of dividends - (4,861.72) - - - - - (4,861.72) - (4,861.72)
Payment of dividend distribution tax - (999.34) - - - - - (999.34) - (999.34)
Others 5.98 - 5.98 5.98
Movement in non-controlling interests - - - - - - - - 133.61 133.61
Balance as at 31 March, 2019 8,793.88 90,822.35 1,243.10 8,151.77 17,649.93 0.20 (13.22) 1,26,648.01 184.18 1,28,776.90
As per our report of even date attached
For B S R & Co. LLPChartered Accountants Firm’s Registration No. 101248W/W-100022
For and on behalf of the Board of Directors of Rallis India Limited PRAKASH R. RASTOGI(DIN: 00110862)
BHASKAR BHAT(DIN: 00148778)
Chairman
R. MUKUNDAN(DIN: 00778253)
SANJIV LAL (DIN: 08376952)
Managing Director & CEO
PUNITA KUMAR-SINHA (DIN: 05229262)
ASHISH MEHTA(M. No. 53039)
Chief Financial Officer
ANIRUDDHA GODBOLE PartnerMembership No. 105149
C.V. NATRAJ (DIN: 07132764)
DirectorsYASHASWIN SHETH (M. No. A15388)
Company Secretary
PADMINI KHARE KAICKER (DIN: 00296388)
Mumbai, 25 April, 2019 JOHN MULHALL (DIN: 08101474)
Mumbai, 25 April, 2019

197
Consolidated
Consolidated Statement of Cash Flows for the year ended 31 March, 2019All amounts are in ` lakhs unless otherwise stated
For the year ended 31 March, 2019
For the year ended 31 March, 2018
A CASH FLOW FROM OPERATING ACTIVITIES: Profit before tax 22,026.44 22,702.26Adjustments for : Finance costs 524.74 430.53 Depreciation and amortisation expense 4,607.81 4,631.08 Interest income (288.93) (206.69) Dividend Income (283.63) (464.17) Gain on redemption of current investments (66.97) - Net gain on financial assets designated at fair value through profit and loss (17.39) - Credit balances written back (390.17) (230.29) Allowance for doubtful debts(Net) 291.53 186.12 Allowance for doubtful advances 31.98 2.57 Investment write off 24.60 - Impairment of Intangible assets and intangible assets under development 308.48 - Bad debts 242.25 - Provision for indirect tax matters 10.00 33.50 Provision/(reversal) for directors pension liability 722.92 - Provision/(reversal) for supplemental pay (41.52) (110.97) Provision/(reversal) for gratuity 32.76 79.63 Provision for compensated absences 43.03 118.20 Net unrealised foreign exchange (gain) / loss (421.41) 217.35 Loss/(Gain) on disposal of property, plant and equipment 59.67 (6.35) Operating profit before working capital changes 27,416.19 27,382.77
Movements in working capital: (Increase)/decrease in Trade and other receivables (5,859.30) (13,466.64) (Increase)/decrease in Inventories (10,137.07) (17,780.72) (Increase)/decrease in Loans (10.40) 45.91 (Increase)/decrease other financial assets (63.43) (162.50) (Increase)/decrease other assets (694.27) (5,793.89) Increase/(decrease) trade payables 2,071.32 19,448.76 Increase/(decrease) in other financial liabilities 1,493.38 721.49 Increase/(decrease) in other liabilities 879.55 493.21CASH GENERATED FROM OPERATIONS 15,095.97 10,888.39 Income taxes paid (Net of refunds) (7,090.28) (6,749.86) NET CASH FLOWS GENERATED FROM OPERATING ACTIVITIES (A) 8,005.69 4,138.53
B CASH FLOW FROM INVESTING ACTIVITIES: Interest received 296.80 190.84 Dividend received 283.63 464.17
Payments for property , plant and equipment (including Adjustments on account of capital work-in-progress, capital creditors and capital advances) "
(3,378.92) (4,833.90)
Payments for intangible assets (1,274.88) (938.71) Proceeds from disposal of property , plant and equipment 33.16 34.47 Payment for purchase of investment in equity shares (19.60) (337.64) Proceeds from sale of investments from equity share - 1,314.64 Purchase of current investments (15,179.03) (10,772.34) Proceeds from sale of current investments 13,895.94 23,643.90 Proceeds from issue of shares to miniority shareholder 133.61 127.10 Investments in bank deposits 64.38 (12.69)NET CASH FLOWS (USED IN)/GENERATED FROM INVESTING ACTIVITIES (B) (5,144.91) 8,879.84
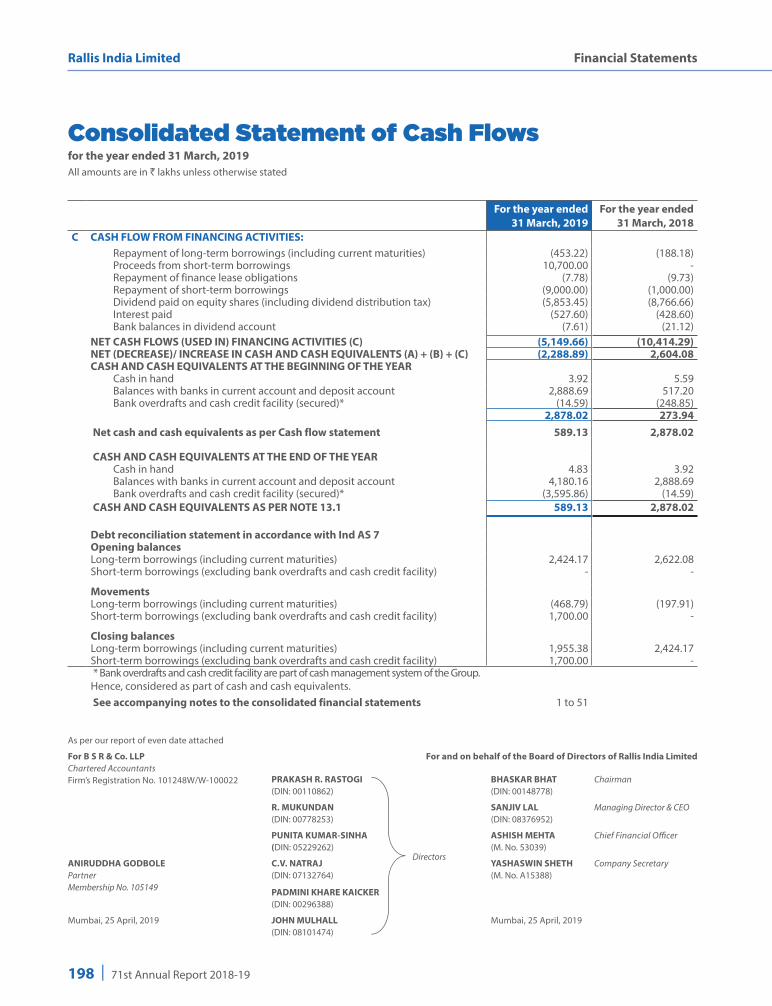
198 | 71st Annual Report 2018-19
Rallis India Limited Financial Statements
For the year ended 31 March, 2019
For the year ended 31 March, 2018
C CASH FLOW FROM FINANCING ACTIVITIES: Repayment of long-term borrowings (including current maturities) (453.22) (188.18) Proceeds from short-term borrowings 10,700.00 - Repayment of finance lease obligations (7.78) (9.73) Repayment of short-term borrowings (9,000.00) (1,000.00) Dividend paid on equity shares (including dividend distribution tax) (5,853.45) (8,766.66) Interest paid (527.60) (428.60) Bank balances in dividend account (7.61) (21.12)NET CASH FLOWS (USED IN) FINANCING ACTIVITIES (C) (5,149.66) (10,414.29)NET (DECREASE)/ INCREASE IN CASH AND CASH EQUIVALENTS (A) + (B) + (C) (2,288.89) 2,604.08CASH AND CASH EQUIVALENTS AT THE BEGINNING OF THE YEAR Cash in hand 3.92 5.59 Balances with banks in current account and deposit account 2,888.69 517.20 Bank overdrafts and cash credit facility (secured)* (14.59) (248.85)
2,878.02 273.94 Net cash and cash equivalents as per Cash flow statement 589.13 2,878.02
CASH AND CASH EQUIVALENTS AT THE END OF THE YEAR Cash in hand 4.83 3.92 Balances with banks in current account and deposit account 4,180.16 2,888.69 Bank overdrafts and cash credit facility (secured)* (3,595.86) (14.59) CASH AND CASH EQUIVALENTS AS PER NOTE 13.1 589.13 2,878.02
Debt reconciliation statement in accordance with Ind AS 7Opening balancesLong-term borrowings (including current maturities) 2,424.17 2,622.08Short-term borrowings (excluding bank overdrafts and cash credit facility) - -
MovementsLong-term borrowings (including current maturities) (468.79) (197.91)Short-term borrowings (excluding bank overdrafts and cash credit facility) 1,700.00 -
Closing balancesLong-term borrowings (including current maturities) 1,955.38 2,424.17Short-term borrowings (excluding bank overdrafts and cash credit facility) 1,700.00 - * Bank overdrafts and cash credit facility are part of cash management system of the Group. Hence, considered as part of cash and cash equivalents. See accompanying notes to the consolidated financial statements 1 to 51
Consolidated Statement of Cash Flows for the year ended 31 March, 2019All amounts are in ` lakhs unless otherwise stated
As per our report of even date attached
For B S R & Co. LLPChartered Accountants Firm’s Registration No. 101248W/W-100022
For and on behalf of the Board of Directors of Rallis India Limited PRAKASH R. RASTOGI(DIN: 00110862)
BHASKAR BHAT(DIN: 00148778)
Chairman
R. MUKUNDAN(DIN: 00778253)
SANJIV LAL (DIN: 08376952)
Managing Director & CEO
PUNITA KUMAR-SINHA (DIN: 05229262)
ASHISH MEHTA(M. No. 53039)
Chief Financial Officer
ANIRUDDHA GODBOLE PartnerMembership No. 105149
C.V. NATRAJ (DIN: 07132764)
DirectorsYASHASWIN SHETH (M. No. A15388)
Company Secretary
PADMINI KHARE KAICKER (DIN: 00296388)
Mumbai, 25 April, 2019 JOHN MULHALL (DIN: 08101474)
Mumbai, 25 April, 2019
199
Consolidated
1. Corporate Information Rallis India Limited (the ‘’Holding Company’’) is a public
limited company domiciled in India and is incorporated under the provisions of the Companies Act applicable in India. The Company’s shares are listed on National Stock Exchange and Bombay Stock Exchange. Its parent and ultimate holding Group is Tata Chemicals Limited. The principal activity of the Group and its subsidiaries (hereinafter referred to as the “Group”) is manufacture and marketing of Agri Inputs.
The Company’s registered office is at 156/157, 15th Floor, Nariman Bhavan, 227 Nariman Point, Mumbai - 400 021.
The financial statements for the year ended 31 March, 2019 were approved by the Board of Directors and authorised for issue on 25 April, 2019.
2. Recent accounting pronouncement Standards issued but not yet effective
Ministry of Corporate Affairs (“MCA”) through Companies (Indian Accounting Standards) Amendment Rules, 2019 has notified the following new Ind AS which the Group has not applied as they are effective for annual periods beginning on or after April 1, 2019:
IND AS 116-Leases :
The new standard on leases sets out the principles for the recognition, measurement, presentation and disclosure of the leases. The core objective of this standard is to ensure that lessees and lessors provide relevant information in a manner that faithfully represent those transactions.
The Group is required to adopt Ind AS 116, Leases from 1 April 2019. Ind AS 116 introduces a single, on-balance sheet lease accounting model for lessees. A lessee recognises a right-of-use asset representing its right to use the underlying asset and a lease liability representing its obligation to make lease payments. There are recognition exemptions for short-term leases and leases of low-value items. Lessor accounting remains similar to the current standard – i.e. lessors continue to classify leases as finance or operating leases. It replaces existing leases guidance, Ind AS 17, Leases.
Notes to the Consolidated financial statements for the year ended 31 March, 2019
The Group has completed an initial assessment of the potential impact on its consolidated financial statements but has not yet completed its detailed assessment. The quantitative impact of adoption of Ind AS 116 on the consolidated financial statements in the period of initial application is not reasonably estimable as at present.
- the total assets and liabilities on the balance sheet will increase with a decrease in net total assets, due to the depreciation of right of use assets being on a straight-line basis whilst the lease liability reduces by the principal amount of repayments;
- Interest expense will increase due to the unwinding of the effective interest rate implicit in the lease liability. Interest expense will be greater earlier in a lease’s life, due to the higher principal value, causing profit variability over the term of lease. This effect may be partially mitigated due to the number of leases held by the Group at various stages of their terms; and
- operating cash flows will be higher and financing cash flows will be lower, as repayment of the principal portion of all lease liabilities will be classified as financing activities.
The Group plans to apply Ind AS 116 initially on 1 April 2019, using the modified retrospective approach. Therefore, the cumulative effect of adopting Ind AS 116 will be recognised as an adjustment to the opening balance of retained earnings at 1 April 2019, with no restatement of comparative information.
The Group plans to apply the practical expedient to grandfather the definition of a lease on transition. This means that it will apply Ind AS 116 to all contracts entered into before 1 April 2019 and identified as leases in accordance with Ind AS 17.
In addition to the above, the following amendments to existing standards have been issued, are not yet effective and are not expected to have a significant impact on the Group’s consolidated financial statements:
- Amendments to Ind AS 103, Business Combinations, and Ind AS 111, Joint Arrangements: This interpretation clarifies how an entity accounts for increasing its interest in a joint operation that meets the definition of a business.

200 | 71st Annual Report 2018-19
Rallis India Limited Financial Statements
Notes to the Consolidated financial statements for the year ended 31 March, 2019
- Amendments to Ind AS 109, Financial Instruments: amendments relating to the classification of particular pre payable financial assets.
- Amendments to Ind AS 12, Income Taxes, clarify that all income tax consequences of dividends (including payments on financial instruments classified as equity) are recognized consistently with the transactions that generated the distributable profits – i.e. in profit or loss, other comprehensive income or equity. Further Appendix C, uncertainty over income tax treatments has been added to clarify how entities should reflect uncertainties over income tax treatments, in particular when assessing the outcome a tax authority might reach with full knowledge and information if it were to make an examination.
- Amendment to Ind AS 19, Employee Benefits - The amendment to Ind AS 19 clarifies that on amendment, curtailment or settlement of a defined benefit plan, the current service cost and net interest for the remainder of the annual reporting period are calculated using updated actuarial assumptions – i.e. consistent with the calculation of a gain or loss on the plan amendment, curtailment or settlement. This amendment also clarifies that an entity first determines any past service cost, or a gain or loss on settlement, without considering the effect of the asset ceiling. This amount is recognized in profit or loss. The entity then determines the effect of the asset ceiling after plan amendment, curtailment or settlement. Any change in that effect is recognized in other comprehensive income (except for amounts included in net interest).
- Amendments to Ind AS 23, Borrowing Costs, clarify that the general borrowings pool used to calculate eligible borrowing costs excludes only borrowings that specifically finance qualifying assets that are still under development or construction.
Impact on adoption of above changes in standards is not material.
3. SIGNIFICANT ACCOUNTING POLICIES3.1 Statement of compliance
The Consolidated Financial Statements of the Group have been prepared in accordance with Indian Accounting Standards (Ind AS) as per the Companies
(Indian Accounting Standards) Rules, 2015 notified under Section 133 of Companies Act, 2013, (the ‘Act’) and other relevant provisions of the Act.
3.2 Basis of preparation and measurement
The Consolidated Financial Statements have been prepared on the historical cost basis, except for certain financial instruments which are measured at fair values at the end of each reporting period. Historical cost is based on the fair value of the consideration given in exchange for goods and services.
Fair value is the price that would be received to sell an asset or paid to transfer a liability in an orderly transaction between market participants at the measurement date, regardless of whether that price is directly observable or estimated using another valuation technique.
The fair value of an asset or a liability is measured using the assumptions that market participants would use when pricing the asset or liability, assuming that market participants act in their economic best interest.
A fair value measurement of a non-financial asset takes into account a market participant’s ability to generate economic benefits by using the asset in its highest and best use or by selling it to another market participant that would use the asset in its highest and best use.
The Group uses valuation techniques that are appropriate in the circumstances and for which sufficient data are available to measure fair value, maximising the use of relevant observable inputs and minimising the use of unobservable inputs.
All assets and liabilities for which fair value is measured or disclosed in the Consolidated Financial Statements are categorised within the fair value hierarchy, described as follows, based on the lowest level input that is significant to the fair value measurement as a whole:
Level 1 - Quoted (unadjusted) market prices in active markets for identical assets or liabilities
Level 2 - Valuation techniques for which the lowest level input that is significant to the fair value measurement is directly or indirectly observable
Level 3 — Valuation techniques for which the lowest level input that is significant to the fair value measurement is unobservable

201
Consolidated
3.3 Basis of consolidation
The consolidated financial statements incorporate the financial statements of the Company controlled by the Company and its subsidiaries. Control is achieved when the Group:
has power over the investee;
is exposed, or has rights, to variable returns from its involvement with the investee; and
has the ability to use its power to affect its returns.
The Group reassesses whether or not it controls an investee if facts and circumstances indicate that there are changes to one or more of the three elements of control listed above. When the Group has less than a majority of the voting rights of an investee, it has power over the investee when the voting rights are sufficient to give it the practical ability to direct the relevant activities of the investee unilaterally. The Group considers all relevant facts and circumstances in assessing whether or not the Group’s voting rights in an investee are sufficient to give it power, including:
the size of the Group’s holding of voting rights relative to the size and dispersion of holdings of the other vote holders;
potential voting rights held by the Group, other vote holders or other parties;
rights arising from other contractual arrangements; and
any additional facts and circumstances that indicate that the Group has, or does not have, the current ability to direct the relevant activities at the time that decisions need to be made, including voting patterns at previous shareholders’ meetings.
Consolidation of a subsidiary begins when the Group obtains control over the subsidiary and ceases when the Group loses control of the subsidiary. Specifically, income and expenses of a subsidiary acquired or disposed off during the year are included in the consolidated statement of profit and loss from the date the Group gains control until the date when the Group ceases to control the subsidiary.
Profit or loss and each component of other comprehensive income are attributed to the owners of the Group and to the non-controlling interests. Total comprehensive income ·of subsidiaries is attributed to the owners of the Group and to the non-controlling interests even if this results in the non-controlling interests having a deficit balance.
When necessary, adjustments are made to the financial statements of subsidiaries to bring their accounting policies into line with the Group’s accounting policies.
All intragroup assets and liabilities, equity, income, expenses, and cash flows relating to transactions between members of the Group are eliminated in full on consolidation.
Notes to the Consolidated financial statements for the year ended 31 March, 2019
The list of companies, controlled directly or indirectly by the Holding Company which are included in the consolidated financial statements are as under:
Name Relationship Country of Incorporation
Ownership Interest
31 March, 2019 31 March, 2018
Rallis Chemistry Exports Limited Subsidiary India 100% 100%Zero Waste Agro-Organics Limited Subsidiary India 100% 100%Metahelix Life Sciences Limited Subsidiary India 100% 100%PT Metahelix Life Sciences Indonesia Subsidiary Indonesia 65.77% 65.77%
3.4 Business combinations
Acquisitions of businesses are accounted for using the acquisition method. The consideration transferred in a business combination is measured at fair value, which is calculated as the sum of the acquisition-date fair values of the assets transferred by the Group, liabilities incurred by the Group to the former owners of the acquiree and
the equity interests issued by the Group in exchange of control of the acquiree. Acquisition-related costs are recognised in profit or loss as incurred.
At the acquisition date, the identifiable assets acquired and the liabilities assumed are recognised at their fair value, except that:

202 | 71st Annual Report 2018-19
Rallis India Limited Financial Statements
deferred tax assets or liabilities, and assets or liabilities related to employee benefit arrangements are recognised and measured in accordance with Ind AS 12 Income Taxes and Ind AS 19 Employee Benefits respectively; and
assets (or disposal groups) that are classified as held for sale in accordance with Ind AS 105 Non-current Assets Held for Sale and Discontinued Operations are measured in accordance with that Standard.
Goodwill is measured as the excess of the sum of the consideration transferred, the amount of any non-controlling interests in the acquiree, and the fair value of the acquirer’ s previously held equity interest in the acquiree (if any) over the net of the acquisition-date amounts of the identifiable assets acquired and the liabilities assumed.
In case of a bargain purchase, before recognising a gain in respect thereof, the Group determines whether there exists clear evidence of the underlying reasons for classifying the business combination as a bargain purchase. Thereafter, the Group reassesses whether it has correctly identified all of the assets acquired and all of the liabilities assumed and recognises any additional assets or liabilities that are identified in that reassessment. The Group then reviews the procedures used to measure the amounts that Ind AS requires for the purposes of calculating the bargain purchase. If the gain remains after this reassessment and review, the Group recognises it in other comprehensive income and accumulates the same in equity as capital reserve. This gain is attributed to the acquirer. If there does not exist clear evidence of the underlying reasons for classifying the business combination as a bargain purchase, the Group recognises the gain, after reassessing and reviewing (as described above), directly in equity as capital reserve.
Non-controlling interests that are present ownership interests and entitle their holders to a proportionate share of the entity’s net assets in the event of liquidation may be initially measured either at fair value or at the non-controlling interests’ proportionate share of the recognised amounts of the acquiree’s identifiable net assets. The choice of measurement basis is made on a transaction-by-transaction basis. Other types of non-controlling interests are measured at fair value or, when applicable, on the basis specified in another Ind AS.
When the consideration transferred by the Group in a business combination includes assets or liabilities resulting from a contingent consideration arrangement, the contingent consideration is measured at its acquisition-date fair value and included as part of the consideration transferred in a business combination. Changes in the fair value of the contingent consideration that qualify as measurement period adjustments are adjusted retrospectively, with corresponding adjustments against goodwill or capital reserve, as the case maybe. Measurement period adjustments are adjustments that arise from additional information obtained during the ‘measurement period’ (which cannot exceed one year from the acquisition date) about facts and circumstances that existed at the acquisition date.
The subsequent accounting for changes in the fair value of the contingent consideration that do not qualify as measurement period adjustments depends on how the contingent consideration is classified.
Contingent consideration that is classified as equity is not remeasured at subsequent reporting dates and its subsequent settlement is accounted for within equity. Contingent consideration that is classified as an asset or a liability is remeasured at fair value at subsequent reporting dates with the corresponding gain or loss being recognised in profit or loss.
When a business combination is achieved in stages, the Group’s previously held equity interest in the acquiree is remeasured to its acquisition-date fair value and the resulting gain or loss, if any, is recognised in profit or loss. Amounts arising from interests in the acquiree prior to the acquisition date that have previously been recognised in other comprehensive income are reclassified to profit or loss where such treatment would be appropriate if that interest were disposed off.
If the initial accounting for a business combination is incomplete by the end of the reporting period in which the combination occurs, the Group reports provisional amounts for the items for which the accounting is incomplete. Those provisional amounts are adjusted during the measurement period (see above), or additional assets or liabilities are recognised, to reflect new information obtained about facts and circumstances that existed at the acquisition date that, if known, would have affected the amounts recognised at that date.
Notes to the Consolidated financial statements for the year ended 31 March, 2019

203
Consolidated
3.5 Goodwill Goodwill arising on an acquisition of a business is carried
at cost as established at the date of acquisition of the business less accumulated impairment losses, if any.
For the purposes of impairment testing, goodwill is allocated to each of the Group’s cash-generating units (or groups of cash-generating units) that is expected to benefit from the synergies of the combination.
A cash-generating unit to which goodwill has been allocated is tested for impairment annually, or more frequently when there is an indication that the unit may be impaired. If the recoverable amount of the cash-generating unit is less than its carrying amount, the impairment loss is allocated first to reduce the carrying amount of any goodwill allocated to the unit and then to the other assets of the unit pro rata based on the carrying amount of each asset in the unit. Any impairment loss for goodwill is recognised directly in profit or loss. An impairment loss recognised for goodwill is not reversed in subsequent periods.
On disposal of the relevant cash-generating unit, the attributable amount of goodwill is included in the determination of the profit or loss on disposal.
3.6 Foreign and presentation currency The Consolidated financial statements are presented in
Indian Rupees (INR), which is also the Groups’s functional currency. All amounts have been rounded-off to the nearest ` lakhs, unless otherwise indicated.
3.7 Foreign currency translation On initial recognition, all foreign currency transactions
are translated into the functional currency using the exchange rates prevailing on the date of the transaction. As at the reporting date, foreign currency monetary assets and liabilities are translated at the exchange rate prevailing on the Balance Sheet date and the exchange gains or losses are recognised in the Consolidated Statement of profit and loss.
3.8 Property plant and equipment (PPE)a) Recognition and measurement
On adoption of Ind AS , the Group retained the carrying value for all of its property, plant and equipment as recognised in the consolidated financial statements as at the date of transition to Ind ASs, measured as per the previous GAAP and used that as its deemed cost as permitted by Ind AS 101 ‘First-time Adoption of Indian Accounting Standards’.
PPE are initially recognised at cost. The initial cost of PPE comprises its purchase price, including non-refundable duties and taxes net of any trade discounts and rebates. The cost of PPE includes interest on borrowings (borrowing cost) directly attributable to acquisition, construction or production of qualifying assets. Subsequent to initial recognition, PPE are stated at cost less accumulated depreciation (other than freehold land, which are stated at cost) and impairment losses, if any.
Subsequent costs are included in the asset’s carrying amount or recognised as a separate asset, as appropriate, only when it is probable that future economic benefits associated with the item will flow to the Group and the cost of the item can be measured reliably. The carrying amount of any component accounted for as a separate asset is derecognised when replaced. All other repairs and maintenance are charged to profit or loss during the reporting period in which they are incurred.
Assets held under finance leases are depreciated over their expected useful lives on the same basis as owned assets. However, when there is no reasonable certainty that ownership will be obtained by the end of the lease term, assets are depreciated over the shorter of the lease term and useful lives.
The residual values, useful life and depreciation method are reviewed at each financial year end to ensure that the amount, method and period of depreciation are consistent with previous estimates and the expected pattern of consumption of the future economic benefits embodied in the items of property, plant and equipment.
An item of property, plant and equipment is derecognised upon disposal or when no future economic benefits are expected to arise from the continued use of the asset. Any gain or loss arising on disposal or retirement of an item of property, plant and equipment is determined as the difference between sales proceeds and the carrying amount of the asset and is recognised in profit or loss. Fully depreciated assets still in use are retained in Consolidated financial statements.
(b) Depreciation
Depreciation is recognised so as to write off the cost of assets (other than freehold land and capital work in progress) less their residual values over the useful lives,
Notes to the Consolidated financial statements for the year ended 31 March, 2019

204 | 71st Annual Report 2018-19
Rallis India Limited Financial Statements
using the straight- line method (“SLM”). Management believes based on a technical evaluation (which is based on technical advice, taking into account the nature of the asset, the estimated usage of the asset, the operating conditions of the asset, past history of replacement, anticipated technological changes, manufacturers warranties and maintenance support, etc.) that the revised useful lives of the assets reflect the periods over which these assets are expected to be used, which are as follows:
Type/Category of Asset Useful Lives(in years)– as per
Companies Act, 2013
Useful Lives(in years)
– as estimated by
the GroupRallis India Limited and other subsidiariesBuildings including factory buildings
3-60 5-60
General Plant and Machinery
10-20 3-35
Electrical Installations and Equipments
10-20 2-32
Furniture and Fixtures 10 3-10
Office Equipments 5 2-10
Vehicles 10 8
Computer and Data Processing Units
3-6 1-10
Laboratory Equipments 10-20 1-19
Leasehold improvements NA shorter of lease period or estimated
useful lifeMetahelix Life Sciences LimitedFactory building 30-60 25
Seed processing machine 10-20 15
Laboratory Equipments 10-20 10
The carrying values of property, plant and equipment are reviewed for impairment when events or changes in circumstances indicate that the carrying value may not be recoverable.
(c ) Gain or Loss on disposal
Any gain or loss on disposal of an property, plant and equipment is recognized in the Consolidated Statement of profit and loss.
3.9 Investment Property
(a) Recognition and Measurement
Land or building held to earn rentals or for capital appreciation or both rather than for use in the production or supply of goods or services or for administrative purposes; or sale in the ordinary course of business is recognised as Investment Property. Land held for a currently undetermined future use is also recognised as Investment Property.
An investment property is measured initially at its cost. The cost of an investment property comprises its purchase price and any directly attributable expenditure. After initial recognition, the Group carries the investment property at the cost less accumulated depreciation and accumulated impairment, if any.
The residual value and the useful life of an asset is reviewed at least at each financial year end and, if expectations differ from previous estimates, the change(s) is accounted for as a change in an accounting estimate in accordance with Ind AS 8 – Accounting Policies, Changes in Accounting Estimates and Errors.
(b) Depreciation
After initial recognition, the Group measures all of its investment property in accordance with Ind AS 16 – Property, Plant and Equipment requirements for cost model. The depreciable amount of an item of investment property is allocated on a systematic basis over its useful life. The Group provides depreciation on the straight line method. The Group believes that straight line method reflects the pattern in which the asset’s future economic benefits are expected to be consumed by the Group. Based on internal technical evaluation, the management belives useful lives of the assets are appropriate. The depreciation method is reviewed at least at each financial year end and, if there has been a significant change in the expected pattern of consumption of the future economic benefits embodied in the asset, the method is changed to reflect the changed pattern. Such a change is accounted for as a change in an accounting estimate in accordance with Ind AS 8 – Accounting Policies, Changes in Accounting Estimates and Errors.
The depreciation charge for each period is generally recognised in the Consolidated Statement of profit and loss.
Notes to the Consolidated financial statements for the year ended 31 March, 2019

205
Consolidated
The residual value and the useful life of an asset is reviewed at least at each financial year end and, if expectations differ from previous estimates, the change(s) is accounted for as a change in an accounting estimate in accordance with Ind AS 8 – Accounting Policies, Changes in Accounting Estimates and Errors. The estimated useful lives for the current and comparative periods are as follows:
Type/Category of Asset Useful Lives(in years)– as per
Companies Act, 2013
Useful Lives(in years)
– as estimated by the Group
Rallis India Limited
Buildings 60 60
(c) Fair Value
Fair value of investment property is based on a valuation by an independent valuer who holds a recognised and relevant professional qualification and has recent experience in the location and category of the investment property being valued. The fair value of investment property is disclosed in the Note 5.
(d) Gain or Loss on Disposal
Any gain or loss on disposal of an Investment Property is recognised in the Consolidated Statement of Profit and Loss.
3.10 Other intangible assets
Other intangible assets are measured on initial recognition at cost and subsequently are carried at cost less accumulated amortisation and accumulated impairment losses, if any.
An intangible asset is derecognised on disposal, or when no future economic benefits are expected from use or disposal. Gains or losses on derecognition are determined by comparing proceeds with carrying amount. These are included in profit or loss within other gains/ (losses).
The Group amortises intangible assets with a finite useful life using the straight-line method over the following range of useful lives:
Type/Category of Asset Useful Lives(in years)
– as estimated by the Group
Rallis India LimitedProduct registrations 4Licenses and commercial rights 4Computer software 1-10Metahelix Life Sciences LimitedLicenses and commercial rights 3Computer software 1
The estimated useful life is reviewed annually by the management.
3.11 Capital work-in-progress and other intangible as-sets under development
Capital work-in-progress/other intangible assets under development are carried at cost, comprising direct cost, related incidental expenses and attributable borrowing cost.
3.12 Non-derivative financial instruments
Financial assets and liabilities are recognised when the Group becomes a party to the contractual provisions of the instrument. Financial assets and liabilities are initially measured at fair value. Transaction costs that are directly attributable to the acquisition or issue of financial assets and financial liabilities (other than financial assets and financial liabilities at fair value through profit or loss) are added to or deducted from the fair value measured on initial recognition of financial asset or financial liability.
Cash and cash equivalents
The Group considers all highly liquid financial instruments, which are readily convertible into known amounts of cash that are subject to an insignificant risk of change in value and having original maturities of three months or less from the date of purchase, to be cash equivalents. Cash and cash equivalents consist of balances with banks which are unrestricted for withdrawal and usage.
Financial assets at amortised cost
Financial assets are subsequently measured at amortised cost if these financial assets are held within a business
Notes to the Consolidated financial statements for the year ended 31 March, 2019
206 | 71st Annual Report 2018-19
Rallis India Limited Financial Statements
whose objective is to hold these assets in order to collect contractual cash flows and the contractual terms of the financial asset give rise on specified dates to cash flows that are solely payments of principal and interest on the principal amount outstanding.
Financial assets at fair value through other comprehensive income (FVTOCI)
Financial assets are measured at fair value through other comprehensive income if these financial assets are held within a business whose objective is achieved by both collecting contractual cash flows that give rise on specified dates to solely payments of principal and interest on the principal amount outstanding and by selling financial assets.
The Group has made an irrevocable election to present subsequent changes in the fair value of equity investments not held for trading in Other Comprehensive Income.
Financial assets at fair value through profit or loss (FVTPL)
Financial assets are measured at fair value through profit or loss unless it is measured at amortised cost or at fair value through other comprehensive income on initial recognition. The transaction costs directly attributable to the acquisition of financial assets and liabilities at fair value through profit or loss are immediately recognised in profit or loss.
Financial liabilities
Financial liabilities are measured at amortised cost using the effective interest method.
Equity instruments
An equity instrument is a contract that evidences residual interest in the assets of the Group after deducting all of its liabilities. Equity instruments recognised by the Group are measured at the proceeds received net off direct issue cost.
Offsetting of financial instruments
Financial assets and financial liabilities are offset and the net amount is reported in consolidated financial statements if there is a currently enforceable legal right to offset the recognised amounts and there is an
intention to settle on a net basis, to realise the assets and settle the liabilities simultaneously.
3.13 Derivative financial instruments
The Group enters into certain derivative contracts to hedge risks which are not designated as hedges. Such contracts are accounted for at fair value through profit or loss and are included in other gains/ (losses).
3.14 Impairment
Financial assets (other than at fair value)
The Group assesses on a forward looking basis the expected credit losses associated with its assets carried at amortised cost and FVOCI debt instruments. The impairment methodology applied depends on whether there has been a significant increase in credit risk.
For trade receivables only, the Group applies the simplified approach permitted by Ind AS 109 Financial Instruments, which requires expected lifetime losses to be recognised from initial recognition of the receivables.
PPE and other intangibles assets
Property, plant and equipment and intangible assets with finite life are evaluated for recoverability whenever there is any indication that their carrying amounts may not be recoverable. If any such indication exists, the recoverable amount (i.e. higher of the fair value less cost to sell and the value-in-use) is determined on an individual asset basis unless the asset does not generate cash flows that are largely independent of those from other assets. In such cases, the recoverable amount is determined for the cash generating unit (CGU) to which the asset belongs.
If the recoverable amount of an asset (or CGU) is estimated to be less than its carrying amount, the carrying amount of the asset (or CGU) is reduced to its recoverable amount. An impairment loss is recognised in the Consolidated Statement of profit and loss.
An impairment loss is reversed if there has been a change in the estimates used to determine the recoverable amount. Such a reversal is made only to the extent that the asset’s carrying amount does not exceed the carrying amount that would have been determined, net of depreciation or amortisation, if no impairment loss had been recognised.
Notes to the Consolidated financial statements for the year ended 31 March, 2019

207
Consolidated
3.15 Inventories
Inventories are valued at lower of cost (on weighted average basis) and net realisable value after providing for obsolescence and other losses, where considered necessary. Cost includes all charges in bringing the goods to their present location and condition, including octroi and other levies, transit insurance and receiving charges. Work-in-progress and finished goods include appropriate proportion of overheads. Net realisable value is the estimated selling price in the ordinary course of business, less the estimated costs of completion and the estimated costs necessary to make the sale.
3.16 Revenue recognition
Revenue is measured at the fair value of the consideration received or receivable.
3.16.1 Sale of goods
Revenue is recognised upon transfer of control of promised goods to customers in an amount that reflects the consideration which the Group expects to receive in exchange for those goods.
Revenue from the sale of goods is recognised at the point in time when control is transferred to the customer which is usually on dispatch / delivery.
Revenue is measured based on the transaction price, which is the consideration, adjusted for volume discounts, rebates, scheme allowances, price concessions, incentives, and returns, if any, as specified in the contracts with the customers. Revenue excludes taxes collected from customers on behalf of the government. Accruals for discounts/incentives and returns are estimated (using the most likely method) based on accumulated experience and underlying schemes and agreements with customers. Due to the short nature of credit period given to customers, there is no financing component in the contract.
The Group has adopted Ind AS 115 Revenue from contracts with customers, with effect from April 1, 2018. Ind AS 115 establishes principles for reporting information about the nature, amount, timing and uncertainty of revenues and cash flows arising from the contracts with its customers and replaces Ind AS 18 Revenue and Ind AS 11 Construction Contracts.
The Group has adopted Ind AS 115 using the cumulative effect method whereby the effect of applying this standard is recognised at the date of initial application (i.e. 1 April, 2018). Accordingly, the comparative information in the Consolidated Statement of profit and loss is not restated.
Impact on adoption of above changes in standards is not material.
3.16.2 Rendering of services
Income recognition for services takes place as and when the services are performed in accordance with IND AS 115.
3.16.3 Interest Income
Interest income from financial assets is recognised when it is probable that economic benefits will flow to the Group and the amount of income can be measured reliably. Interest income is accrued on a time basis, by reference to the principal outstanding and at the effective interest rate applicable, which is the rate that exactly discounts estimated future cash receipts through the expected life of the financial assets to that asset’s net carrying amount on initial recognition.
3.16.4 Dividend
Dividend income from investments is recognised when the shareholder’s right to receive payment has been established (provided that it is probable that the economic benefits will flow to the Group and the amount of income can be measured reliably).
3.16.5 Insurance claims
Insurance claims are accounted for on the basis of claims admitted to the extent that there is no uncertainty in receiving the claims.
3.16.6 Government Grants
Government grants and subsidies are recognized when there is reasonable assurance that the Group will comply with the conditions attached to them and the grants / subsidy will be received. Government grants whose primary condition is that the Group should purchase, construct or otherwise acquire capital assets are presented by deducting them from the carrying value of the assets. The grant is recognized as income over the life of a depreciable asset by way of a reduced depreciation charge. Export benefits are accounted for in the year of exports based on eligibility and when there is no uncertainty in receiving the same.
Notes to the Consolidated financial statements for the year ended 31 March, 2019

208 | 71st Annual Report 2018-19
Rallis India Limited Financial Statements
Government grants in the nature of promoters’ contribution like investment subsidy, where no repayment is ordinarily expected in respect thereof, are treated as capital reserve. Government grants in the form of non-monetary assets, given at a concessional rate, are recorded on the basis of their acquisition cost. In case the non-monetary asset is given free of cost, the grant is recorded at a nominal value.
Other government grants and subsidies are recognized as income over the periods necessary to match them with the costs for which they are intended to compensate, on a systematic basis.
3.16.7 Royalty on trademark license arrangements:
Royalty income is recognised on an accrual basis (provided that it is probable that the economic benefits will flow to the Group and the amount of revenue can be measured reliably). Such arrangements are based on sales made by the licensee and are recognised by reference to the compensation terms under the underlying arrangement.
3.17 Research and development expenses
Research expenditure is charged to the Consolidated Statement of profit and loss. Development costs of products are also charged to the Statement of Profit and Loss unless a product’s technical feasibility has been established, in which case such expenditure is capitalised. Tangible assets used in research and development are capitalised.
3.18 Leases
Leases are classified as finance leases whenever the terms of lease transfer substantially all the risks and rewards of ownership to the lessee. Leases where a significant portion of the risks and rewards of ownership are retained by the lessor are classified as operating leases.
(i) Operating Lease:
Operating lease payments are recognized as an expense in the Consolidated Statement of profit and loss on a straight-line basis over the lease term except where another systematic basis is more representative of the time pattern in which economic benefits from leased assets are consumed. The aggregate benefit
of incentives (excluding inflationary increases where rentals are structured solely to increase in line with the expected general inflation to compensate for the lessor’s inflationary cost increases, such increases are recognised in the year in which the benefits accrue) provided by the lessor is recognized as a reduction of rental expense over the lease term on a straight-line basis.
(ii) Finance Lease:
Assets held under finance leases are initially recognized as assets of the Group at their fair value at the inception of the lease or, if lower, at the present value of the minimum lease payments. The corresponding liability to the lessor is included in the Balance Sheet as a finance lease obligation.
Assets held under finance leases are depreciated over their expected useful lives on the same basis as owned assets or, where shorter, the term of the relevant lease. Lease payments are apportioned between finance expenses and reduction of the lease obligation so as to achieve a constant rate of interest on the remaining balance of the liability. Finance expenses are recognized immediately in profit or loss, unless they are directly attributable to qualifying assets, in which case they are capitalized in accordance with the Group’s general policy on borrowing costs. Contingent rentals are recognized as expenses in the periods in which they are incurred.
3.19 Non-current assets held for sale
Non-current assets and disposal groups are classified as held for sale if their carrying amount will be recovered principally through a sale transaction rather than through continuing use. This condition is regarded as met only when the asset (or disposal group) is available for immediate sale in its present condition subject only to terms that are usual and customary for sales of such asset (or disposal group) and its sale is highly probable. Management must be committed to the sale, which should be expected to qualify for recognition as a completed sale within one year from the date of classification.
When the Group is committed to a sale plan involving disposal of an investment, the investment that will be disposed off is classified as held for sale when the criteria described above are met.
Notes to the Consolidated financial statements for the year ended 31 March, 2019

209
Consolidated
Non-current assets (and disposal groups) classified as held for sale are measured at the lower of their carrying amount and fair value less costs to sell.
3.20 Employee benefit expenses
Employee benefits consist of contribution to provident fund, superannuation fund, gratuity fund, compensated absences, supplemental pay and director pension liability.
3.20.1.1 Post-employment benefit plans Defined Contribution plans
Payments to defined contribution retirement benefit scheme for eligible employees in the form of superannuation fund are charged as an expense as they fall due. Such benefits are classified as defined contribution schemes as the Group does not carry any further obligations, apart from the contributions made.
Defined benefit plans
The Group operates various defined benefit plans- gratuity fund, supplemental pay and director pension liability.
The Group also makes contribution towards provident fund, in substance a defined contribution retirement benefit plan. The provident fund is administered by the Trustees of the Rallis India Limited Provident Fund. The rules of the Group’s provident fund administered by the Trust, require that if the Board of Trustees are unable to pay interest at the rate declared by the Employees’ Provident Fund by the Government under para 60 of the Employees’ Provident Fund Scheme, 1952 for the reason that the return on investment is less or for any other reason, then the deficiency shall be made good by the Group. Having regard to the assets of the fund and the return on the investments, the Group does not expect any deficiency as at the year end.
The liability or asset recognised in the balance sheet in respect of its defined benefit plans is the present value of the defined benefit obligation at the end of the reporting period less the fair value of plan assets. The defined benefit obligation is calculated annually by actuaries using the projected unit credit method.
The present value of the said obligation is determined by discounting the estimated future cash outflows,
using market yields of government bonds that have tenure approximating the tenures of the related liability.
The interest income / (expense) are calculated by applying the discount rate to the net defined benefit liability or asset. The net interest income / (expense) on the net defined benefit liability or asset is recognised in the Consolidated Statement of profit and loss.
Remeasurement gains and losses arising from experience adjustments and changes in actuarial assumptions are recognised in the period in which they occur, directly in other comprehensive income. They are included in retained earnings in the Consolidated Statement of Changes in Equity and in the Balance Sheet.
Changes in the present value of the defined benefit obligation resulting from plan amendments or curtailments are recognised immediately in profit or loss as past service cost.
3.20.2 Short term employee benefit
Compensated absences which accrue to employees and which can be carried to future periods but are expected to be encashed or availed in twelve months immediately following the year end are reported as expenses during the year in which the employees perform the services that the benefit covers and the liabilities are reported at the undiscounted amount of the benefits after deducting amounts already paid. Where there are restrictions on availment of encashment of such accrued benefit or where the availment or encashment is otherwise not expected to wholly occur in the next twelve months, the liability on account of the benefit is actuarially determined using the projected unit credit method.
3.21 Borrowing cost
Borrowing costs are interest and ancillary costs incurred in connection with the arrangement of borrowings. General and specific borrowing costs attributable to acquisition and construction of any qualifying asset (one that takes a substantial period of time to get ready for its designated use or sale) are capitalised until such time as the assets are substantially ready for their intended use or sale, and included as part of the cost of that asset. Investment income earned on the temporary investment
Notes to the Consolidated financial statements for the year ended 31 March, 2019
210 | 71st Annual Report 2018-19
Rallis India Limited Financial Statements
of specific borrowings pending their expenditure on qualifying assets is deducted from the borrowing costs eligible for capitalisation. All the other borrowing costs are recognised in the Consolidated Statement of profit and loss within Finance costs of the period in which they are incurred.
3.22 Segment reporting
Operating segments are defined as components of an enterprise for which discrete financial information is available that is evaluated regularly by the chief operating decision maker, in deciding how to allocate resources and assessing performance. The Group’s chief operating decision maker is the Managing Director & CEO of the Holding Company.
Segment revenue, segment expenses, segment assets and segment liabilities have been identified to segments on the basis of their relationship to the operating activities of the segment. Inter segment revenue is accounted on the basis of transactions which are primarily determined based on market / fair value factors. Revenue, expenses, assets and liabilities which relate to the Group as a whole and are not allocable to segments on a reasonable basis have been included under “unallocated revenue / expenses / assets / liabilities”.
3.23 Income tax
Income tax expense comprises current tax expense and the net change in the deferred tax asset or liability during the year. Current and deferred taxes are recognised in Consolidated Statement of profit and loss, except when they relate to items that are recognised in other comprehensive income or directly in equity, in which case, the current and deferred tax are also recognised in other comprehensive income or directly in equity, respectively.
Current tax
Current tax is measured at the amount of tax expected to be payable on the taxable income for the year as determined in accordance with the provisions of the Income Tax Act, 1961.
Current tax assets and current tax liabilities are offset when there is a legally enforceable right to set off the recognized amounts and there is an intention to settle the asset and the liability on a net basis.
Deferred tax
Deferred income tax assets and liabilities are recognised for deductible and taxable temporary differences arising between the tax base of assets and liabilities and their carrying amount, except when the deferred income tax arises from the initial recognition of an asset or liability in a transaction that is not a business combination and affects neither accounting nor taxable profit or loss at the time of the transaction.
Deferred tax assets are recognised only to the extent that it is probable that either future taxable profits or reversal of deferred tax liabilities will be available, against which the deductible temporary differences, and the carry forward of unused tax credits and unused tax losses can be utilised.
The carrying amount of a deferred tax asset shall be reviewed at the end of each reporting date and reduced to the extent that it is no longer probable that sufficient taxable profit will be available to allow all or part of the deferred income tax asset to be utilised.
Deferred tax assets and liabilities are measured using the tax rates and tax laws that have been enacted or substantively enacted by the end of the reporting period and are expected to apply when the related deferred tax asset is realised or the deferred tax liability is settled.
Deferred tax assets and liabilities are offset when there is a legally enforceable right to offset current tax assets and liabilities and when the deferred tax balances relate to the same taxation authority.
3.24 Accounting of Provisions, Contingent Liabilities and Contingent Assets
Provisions are recognized, when there is a present legal or constructive obligation as a result of past events, where it is probable that there will be outflow of resources to settle the obligation and when a reliable estimate of the amount of the obligation can be made. Where a provision is measured using the cash flows estimated to settle the present obligation, its carrying amount is the present value of those cash flows. Where the effect is material, the provision is discounted to net present value using an appropriate current market-based pre-tax discount rate and the unwinding of the discount is included in finance costs.
Notes to the Consolidated financial statements for the year ended 31 March, 2019
211
Consolidated
Contingent liabilities are recognised only when there is a possible obligation arising from past events, due to occurrence or non-occurrence of one or more uncertain future events, not wholly within the control of the Group, or where any present obligation cannot be measured in terms of future outflow of resources, or where a reliable estimate of the obligation cannot be made. Obligations are assessed on an ongoing basis and only those having a largely probable outflow of resources are provided for.
Contingent assets are not disclosed in the consolidated financial statements unless an inflow of economic benefits is probable.
3.25 Dividend to Equity shareholders
Dividend to equity shareholders is recognised as a liability and deducted from shareholders’ Equity, in the period in which the dividends are approved by the equity shareholders in the general meeting.
3.26 Earnings per share (EPS)
Basic EPS is computed by dividing the profit or loss attributable to the equity shareholders of the Group by the weighted average number of Ordinary shares outstanding during the year. Diluted EPS is computed by adjusting the profit or loss attributable to the ordinary equity shareholders and the weighted average number of ordinary equity shares, for the effects of all dilutive potential Ordinary shares.
3A. Critical accounting judgements and key sources of estimation uncertainty
The preparation of the Consolidated financial statements in conformity with the Ind AS requires management to make judgements, estimates and assumptions that affect the application of accounting policies and the reported amounts of assets, liabilities and disclosures as at date of the consolidated financial statements and the reported amounts of the revenues and expenses for the presented. The estimates and associated assumptions are based on historical experience and other factors that are considered to be relevant. Actual results may differ from these estimates under different assumptions and conditions.
The estimates and underlying assumptions are reviewed on an ongoing basis. Revisions to accounting estimates
are recognized in the period in which the estimate is revised if the revision affects only that period or in the period of the revision and future periods if the revision affects both current and future periods.
I Critical Judgements
In the process of applying the Group’s accounting policies, management has made the following judgements, which have the most significant effect on the amounts recognized in the consolidated financial statements:
Discount rate used to determine the carrying amount of the Group’s employee defined benefit obligation
In determining the appropriate discount rate for plans operated in India, the management considers the interest rates of government bonds in currencies consistent with the currencies of the post-employment benefit obligation.
Contingences and commitments
In the normal course of business, contingent liabilities may arise from litigations and other claims against the Group. Where the potential liabilities have a low probability of crystallizing or are very difficult to quantify reliably, we treat them as contingent liabilities. Such liabilities are disclosed in the notes but are not provided for in the consolidated financial statements. Although there can be no assurance regarding the final outcome of the legal proceedings, we do not expect them to have a materially adverse impact on our financial position or profitability.
II Key sources of estimation uncertainty
The key assumptions concerning the future, and other key sources of estimation uncertainty at the end of the reporting period, that have a significant risk of causing a material adjustment to the carrying amounts of assets and liabilities within the next financial year are discussed below:
Useful lives of property, plant and equipment
As described in Note 3, the Group reviews the estimated useful lives and residual values of property, plant and equipment at the end of each reporting period. During the current financial year, the management has
Notes to the Consolidated financial statements for the year ended 31 March, 2019

212 | 71st Annual Report 2018-19
Rallis India Limited Financial Statements
reassessed the useful lives of certain property, plant and equipment and the impact of the change is not material for the year. There were no changes in residual values of the property, plant and equipment.
Allowances for doubtful debts
The Group makes allowances for doubtful debts based on an assessment of the recoverability of trade and other receivables. The identification of doubtful debts requires use of judgements and estimates. Where the expectation is different from the original estimate, such difference will impact the carrying value of the trade and other receivables and doubtful debts expenses in the period in which such estimate has been changed.
Allowances for inventories
Management reviews the inventory age listing on a periodic basis. This review involves comparison of the carrying value of the aged inventory items with the respective net realizable value. The purpose is to ascertain whether an allowance is required to be made in the consolidated financial statements for any obsolete and slow-moving items. Management is satisfied that adequate allowance for obsolete and slow-moving inventories has been made in the consolidated financial statements.
Liability for sales return
In making judgment for liability for sales return, the management considered the detailed criteria for the recognition of revenue from the sale of goods set out in Ind AS 18 and in particular, whether the Group had transferred to the buyer the significant risk and rewards of ownership of the goods. Following the detailed quantification of the Group’s liability towards sales
return, the management is satisfied that significant risk and rewards have been transferred and that recognition of the revenue in the current year is appropriate, in conjunction with the recognition of an appropriate liability for sales return.
Accruals for estimated product returns, which are based on historical experience of actual sales returns and adjustment on account of current market scenario is considered by Group to be reliable estimate of future sales returns.
Goodwill impairment
Goodwill is tested for impairment on an annual basis and whenever there is an indication that the recoverable amount of a cash generating unit is less than its carrying amount based on a number of factors including operating results, business plans, future cash flows and economic conditions. The recoverable amount of cash generating units is determined based on higher of value-in-use and fair value less cost to sell. The goodwill impairment test is performed at the level of the cash-generating unit or groups of cash-generating units which are benefitting from the synergies of the acquisition and which represent the lowest level at which goodwill is monitored for internal management purposes.
Market related information and estimates are used to determine the recoverable amount. Key assumptions on which management has based its determination of recoverable amount include estimated long term growth rates, weighted average cost of capital and estimated operating margins. Cash flow projections take into account past experience and represent management’s best estimate about future developments.
Notes to the Consolidated financial statements for the year ended 31 March, 2019

213
Consolidated
Notes to the Consolidated financial statements for the year ended 31 March, 2019All amounts are in ` lakhs unless otherwise stated
4: Property, plant and equipment and capital work-in-progressAs at
31 March, 2019As at
31 March, 2018Carrying amount of:Freehold land 187.01 187.01 Leasehold Land 1,959.52 728.36 Leasehold improvements 116.86 119.10 Buildings 12,079.55 12,556.50 Plant and equipment 22,231.90 22,405.88 Furniture and fixtures 224.22 247.33 Vehicles 11.52 6.11 Office equipments 142.93 123.34 Equipment under finance lease 23.47 29.78
36,976.98 36,403.41
Capital work-in-progress 1,287.69 1,234.39
38,264.67 37,637.80
Description
Gross block Accumulated depreciation Carrying amount
Balance as at
1 April, 2018
AdditionsDeductions
/ Reclassfica-tion
Reclassfica-tion from
assets held for sale
Balance as at
31 March, 2019
Balance as at
1 April, 2018
AdditionsDeductions
/ Reclassfica-tion
Reclassfica-tion from
assets held for sale
Balance as at
31 March, 2019
Balance as at
31 March, 2019
Freehold land 187.01 - - - 187.01 - - - - - 187.01
187.01 - - - 187.01 - - - - - 187.01
Leasehold Land 884.71 - - 1,391.04 2,275.75 156.35 33.74 - 126.14 316.23 1,959.52
1,729.98 - 845.27 - 884.71 214.00 17.41 75.06 - 156.35 728.36
Leasehold improvements 165.11 - - - 165.11 46.01 2.24 - - 48.25 116.86
165.11 - - - 165.11 43.77 2.24 - - 46.01 119.10
Buildings 14,407.46 217.19 3.58 - 14,621.07 1,850.96 694.13 3.57 - 2,541.52 12,079.55
13,788.03 629.65 10.22 - 14,407.46 1,182.48 674.64 6.16 - 1,850.96 12,556.50
Plant and equipment 31,025.92 3,115.49 833.96 - 33,307.45 8,620.04 3,197.03 741.52 - 11,075.55 22,231.90
26,950.22 4,207.27 131.57 - 31,025.92 5,663.25 3,045.72 88.93 - 8,620.04 22,405.88
Furniture and fixtures 481.27 51.69 5.07 - 527.89 233.94 74.81 5.08 - 303.67 224.22
400.06 81.21 - - 481.27 159.22 74.72 - - 233.94 247.33
Vehicles 17.09 9.70 12.56 - 14.23 10.98 4.29 12.56 - 2.71 11.52
21.86 - 4.77 - 17.09 9.64 5.76 4.42 - 10.98 6.11
Office equipments 307.09 72.00 19.02 - 360.07 183.75 51.95 18.56 - 217.14 142.93
256.19 69.54 18.64 - 307.09 145.92 56.13 18.30 - 183.75 123.34
Equipment under finance lease 36.97 - 0.23 - 36.74 7.19 6.08 - - 13.27 23.47
38.11 - 1.14 - 36.97 1.06 6.13 - - 7.19 29.78
Total 47,512.63 3,466.07 874.42 1,391.04 51,495.32 11,109.22 4,064.27 781.29 126.14 14,518.34 36,976.98
43,536.57 4,987.67 1,011.61 - 47,512.63 7,419.34 3,882.75 192.87 - 11,109.22 36,403.41
footnotes:
1. Cost of buildings includes cost of 30 shares (31 March, 2018 - 30 shares) of ` 50 each fully paid in respect of ownership flats in 3 (31 March, 2018- 3) Co-operative Societies.
2. Buildings include assets carried at ` 0.82 lakhs (31 March, 2018 ` 0.88 lakhs) where the conveyance in favor of the Group has not been completed.
3. Plant and equipment includes plant and machinery, electrical installations and equipments, laboratory equipments and computers and data processing units. The Group’s obligations under finance leases are secured by the lessor’s title to the leased assets.

214 | 71st Annual Report 2018-19
Rallis India Limited Financial Statements
Notes to the Consolidated financial statements for the year ended 31 March, 2019All amounts are in ` lakhs unless otherwise stated
4. Leasehold land include assets carried at ` 1,451.28 lakhs (as at 31 March, 2018 ` 209.56 lakhs) for which the Group is in process of obtaining an extension for the fulfilment of pre-conditions of lease upon expiry of timeline.
5. Plant and equipment includes a unit having carrying cost of ` 706.71 lakhs (31 March, 2018 ` 756.46 lakhs) and land and building with a carrying cost of ` 804.75 lakhs (31 March, 2018 ` 834.66 lakhs) are subject to first charge to secure two of the Group’s bank loans and other corporate body.
6. Plant and Equipments includes ` 2.75 lakhs (31st March, 2018 ` 4.12 lakhs) given under operating lease.
7. The Group has not capitalised any borrowing cost during the year (31 March, 2018 Nil).
8. The Group has not recognised any impairment loss during the year (31 March, 2018 Nil).
9. The figures in italics are for the previous year.
5: Investment propertyAs at
31 March, 2019As at
31 March, 2018Carrying amount of:Freehold land 244.91 244.91 Buildings 304.95 313.06 Total 549.86 557.97
Description
Gross block Accumulated depreciationCarrying amount
Balance as at 1 April
2018Additions Deductions
Balance as at
31 March 2019
Balance as at
1 April 2018
Additions DeductionsBalance as at
31 March 2019
Balance as at 31 March
2019
Freehold land 244.91 - - 244.91 - - - - 244.91 244.91 - - 244.91 - - - - 244.91
Buildings 337.19 - - 337.19 24.13 8.11 - 32.24 304.95 337.19 - - 337.19 16.03 8.10 - 24.13 313.06
Total 582.10 - - 582.10 24.13 8.11 - 32.24 549.86 582.10 - - 582.10 16.03 8.10 - 24.13 557.97
footnotes:
1. Buildings includes 10 flats (31 March, 2018 - 10 flats) which are reclassified as Investment Property by the Group in accordance with IND AS-40 “Investment Property”.
2. Cost of buildings includes cost of 35 shares (31 March, 2018 - 35 shares) of ` 50 each fully paid and cost of 7 shares (31 March, 2018- 7 shares) of ` 100 each fully paid in respect of ownership flats in 7 (31 March, 2018- 7 ) Co-operative Societies.
3. The Group has not capitalised any borrowing cost during the current year (31 March, 2018 - Nil).
4. Total fair value of Investment Property is ` 31,356.16 lakhs (31 March, 2018 ` 31,356.16 lakhs).
5. The Group has not recognised any impairment loss during the year (31 March, 2018 Nil) .
6. The figures in italics are for the previous year.
Fair Value HeirarchyThe fair value of investment property has been determined by external independent property valuers, having appropriate recognised professional qualification and recent experience in the location and category of the property being valued.
The fair value measurement for all of the investment property has been categoried as a level 3 fair value based on the inputs to the valuation techniques used.

215
Consolidated
Notes to the Consolidated financial statements for the year ended 31 March, 2019All amounts are in ` lakhs unless otherwise stated
Description of Valuation Technique used:The Group obtains Independent Valuations of its investment property as per requirement of Ind AS 40. The fair value of the investment property have been derived using the Direct Comparison Method.The direct comparison approach involves a comparison of the investment property to similar properties that have actually been sold in arms-length distance from investment property or are offered for sale in the same region. This approach demonstrates what buyers have historically been willing to pay (and sellers willing to accept) for similar properties in an open and competitive market, and is particularly useful in estimating the value of the land and properties that are typically traded on a unit basis. This approach leads to a reasonable estimation of the prevailing price. Given that the comparable instances are located in close proximity to the investment property; these instances have been assessed for their locational comparative advantages and disadvantages while arriving at the indicative price assessment for investment property.
6: Intangible assetsAs at
31 March, 2019As at
31 March, 20186.1 Carrying amounts of:Goodwill 19,582.31 19,582.31
19,582.31 19,582.31
Goodwill includes amount of ` 16,522.26 lakhs (31 March, 2018 ` 16,522.26 lakhs) allocated to the business of Metahelix Life Sciences Ltd. The estimated value-in-use of this “CGU’’ is based on the future cash flows using a 5.00 % annual growth rate for periods subsequent to the forecast period of 4 years and discount rate of 13.13 % (31 March, 2018 13.70%).
Goodwill of ` 3,060.05 lakhs (31 March, 2018 ` 3,060.05 lakhs) has been allocated to Zero Waste Agro Organics Ltd.The estimated value-in-use of this “CGU’’ is based on the future cash flows using a 5.00 % annual growth rate for periods subsequent to the forecast period of 4 years and discount rate of 13.13 % (31 March, 2018 13.70%).
“An analysis of the sensitivity of the computation to a combined change in key parameters (operating margin, discount rates and long term average growth rate), based on reasonably probable assumptions, did not identify any probable scenario in which the recoverable amount of the CGU would decrease below its carrying amount.
As at 31 March, 2019
As at 31 March, 2018
6.2 Carrying amount of:Other intangible assetsProduct registrations 234.43 188.68 Licences and commercial rights - Computer software 73.87 79.87 Technical knowhow 660.05 554.22
968.35 822.77 Intangible assets under development 3,782.88 3,497.49
4,751.23 4,320.26
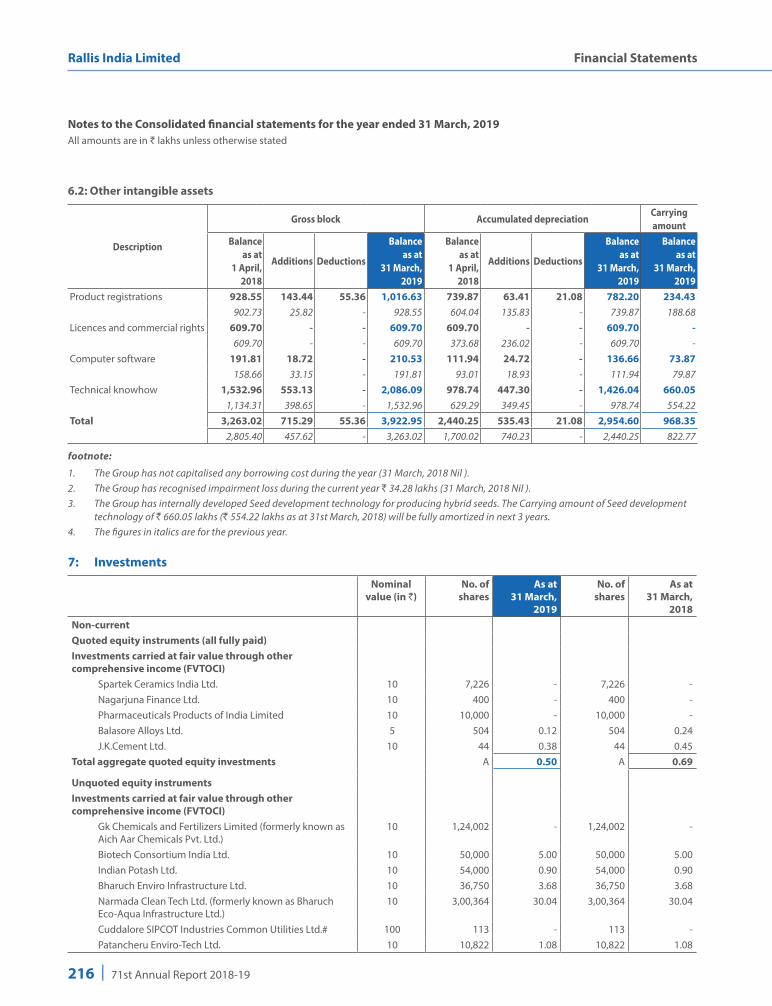
216 | 71st Annual Report 2018-19
Rallis India Limited Financial Statements
6.2: Other intangible assets
Description
Gross block Accumulated depreciationCarrying amount
Balance as at
1 April, 2018
Additions Deductions
Balance as at
31 March, 2019
Balance as at
1 April, 2018
Additions Deductions
Balance as at
31 March, 2019
Balance as at
31 March, 2019
Product registrations 928.55 143.44 55.36 1,016.63 739.87 63.41 21.08 782.20 234.43 902.73 25.82 - 928.55 604.04 135.83 - 739.87 188.68
Licences and commercial rights 609.70 - - 609.70 609.70 - - 609.70 - 609.70 - - 609.70 373.68 236.02 - 609.70 -
Computer software 191.81 18.72 - 210.53 111.94 24.72 - 136.66 73.87 158.66 33.15 - 191.81 93.01 18.93 - 111.94 79.87
Technical knowhow 1,532.96 553.13 - 2,086.09 978.74 447.30 - 1,426.04 660.05 1,134.31 398.65 - 1,532.96 629.29 349.45 - 978.74 554.22
Total 3,263.02 715.29 55.36 3,922.95 2,440.25 535.43 21.08 2,954.60 968.35 2,805.40 457.62 - 3,263.02 1,700.02 740.23 - 2,440.25 822.77
footnote:
1. The Group has not capitalised any borrowing cost during the year (31 March, 2018 Nil ).2. The Group has recognised impairment loss during the current year ` 34.28 lakhs (31 March, 2018 Nil ).3. The Group has internally developed Seed development technology for producing hybrid seeds. The Carrying amount of Seed development
technology of ` 660.05 lakhs (` 554.22 lakhs as at 31st March, 2018) will be fully amortized in next 3 years.4. The figures in italics are for the previous year.
7: Investments
Nominal value (in `)
No. of shares
As at 31 March,
2019
No. of shares
As at 31 March,
2018Non-currentQuoted equity instruments (all fully paid)Investments carried at fair value through other comprehensive income (FVTOCI) Spartek Ceramics India Ltd. 10 7,226 - 7,226 - Nagarjuna Finance Ltd. 10 400 - 400 - Pharmaceuticals Products of India Limited 10 10,000 - 10,000 - Balasore Alloys Ltd. 5 504 0.12 504 0.24 J.K.Cement Ltd. 10 44 0.38 44 0.45 Total aggregate quoted equity investments A 0.50 A 0.69
Unquoted equity instrumentsInvestments carried at fair value through other comprehensive income (FVTOCI) Gk Chemicals and Fertilizers Limited (formerly known as
Aich Aar Chemicals Pvt. Ltd.) 10 1,24,002 - 1,24,002 -
Biotech Consortium India Ltd. 10 50,000 5.00 50,000 5.00 Indian Potash Ltd. 10 54,000 0.90 54,000 0.90 Bharuch Enviro Infrastructure Ltd. 10 36,750 3.68 36,750 3.68 Narmada Clean Tech Ltd. (formerly known as Bharuch
Eco-Aqua Infrastructure Ltd.) 10 3,00,364 30.04 3,00,364 30.04
Cuddalore SIPCOT Industries Common Utilities Ltd.# 100 113 - 113 - Patancheru Enviro-Tech Ltd. 10 10,822 1.08 10,822 1.08
Notes to the Consolidated financial statements for the year ended 31 March, 2019All amounts are in ` lakhs unless otherwise stated
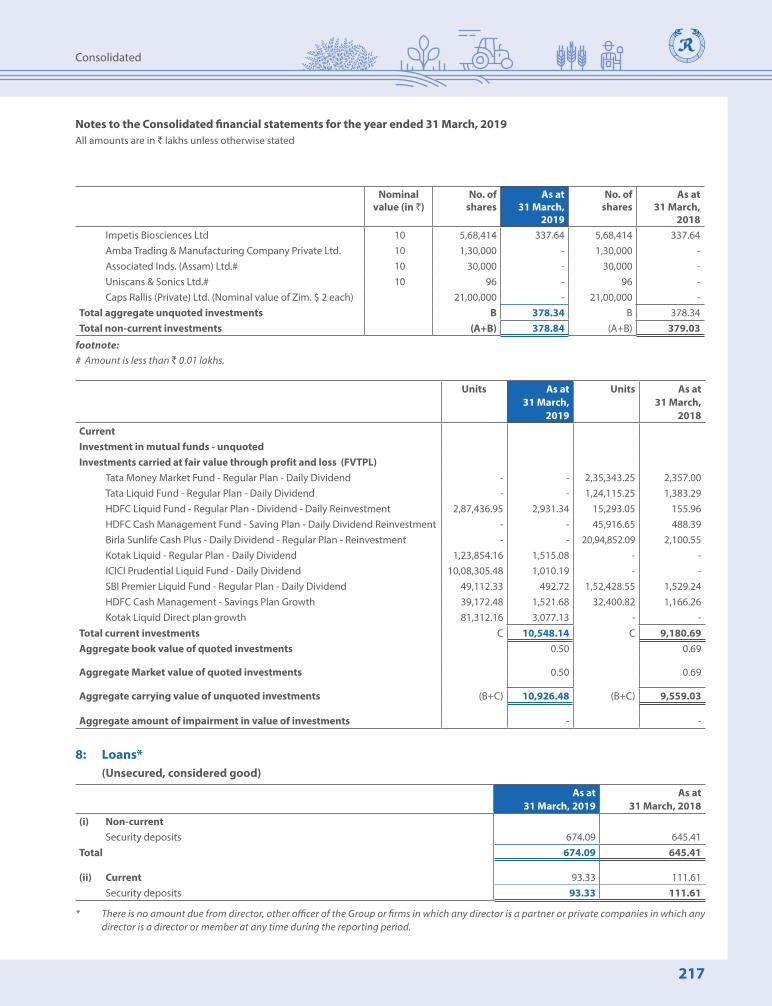
217
Consolidated
Notes to the Consolidated financial statements for the year ended 31 March, 2019All amounts are in ` lakhs unless otherwise stated
Nominal value (in `)
No. of shares
As at 31 March,
2019
No. of shares
As at 31 March,
2018 Impetis Biosciences Ltd 10 5,68,414 337.64 5,68,414 337.64 Amba Trading & Manufacturing Company Private Ltd. 10 1,30,000 - 1,30,000 - Associated Inds. (Assam) Ltd.# 10 30,000 - 30,000 - Uniscans & Sonics Ltd.# 10 96 - 96 - Caps Rallis (Private) Ltd. (Nominal value of Zim. $ 2 each) 21,00,000 - 21,00,000 - Total aggregate unquoted investments B 378.34 B 378.34 Total non-current investments (A+B) 378.84 (A+B) 379.03
footnote:# Amount is less than ` 0.01 lakhs.
Units As at 31 March,
2019
Units As at 31 March,
2018CurrentInvestment in mutual funds - unquotedInvestments carried at fair value through profit and loss (FVTPL) Tata Money Market Fund - Regular Plan - Daily Dividend - - 2,35,343.25 2,357.00 Tata Liquid Fund - Regular Plan - Daily Dividend - - 1,24,115.25 1,383.29 HDFC Liquid Fund - Regular Plan - Dividend - Daily Reinvestment 2,87,436.95 2,931.34 15,293.05 155.96 HDFC Cash Management Fund - Saving Plan - Daily Dividend Reinvestment - - 45,916.65 488.39 Birla Sunlife Cash Plus - Daily Dividend - Regular Plan - Reinvestment - - 20,94,852.09 2,100.55 Kotak Liquid - Regular Plan - Daily Dividend 1,23,854.16 1,515.08 - - ICICI Prudential Liquid Fund - Daily Dividend 10,08,305.48 1,010.19 - - SBI Premier Liquid Fund - Regular Plan - Daily Dividend 49,112.33 492.72 1,52,428.55 1,529.24 HDFC Cash Management - Savings Plan Growth 39,172.48 1,521.68 32,400.82 1,166.26 Kotak Liquid Direct plan growth 81,312.16 3,077.13 - - Total current investments C 10,548.14 C 9,180.69 Aggregate book value of quoted investments 0.50 0.69
Aggregate Market value of quoted investments 0.50 0.69
Aggregate carrying value of unquoted investments (B+C) 10,926.48 (B+C) 9,559.03
Aggregate amount of impairment in value of investments - -
8: Loans* (Unsecured, considered good)
As at 31 March, 2019
As at 31 March, 2018
(i) Non-current Security deposits 674.09 645.41 Total 674.09 645.41
(ii) Current 93.33 111.61 Security deposits 93.33 111.61
* There is no amount due from director, other officer of the Group or firms in which any director is a partner or private companies in which any director is a director or member at any time during the reporting period.

218 | 71st Annual Report 2018-19
Rallis India Limited Financial Statements
Notes to the Consolidated financial statements for the year ended 31 March, 2019All amounts are in ` lakhs unless otherwise stated
9: Other financial assets (at amortised cost)* (Unsecured)
As at 31 March, 2019
As at 31 March, 2018
(i) Non-current a) In other deposit accounts - original maturity more than 12 months 39.99 46.76 b) Interest accrued on fixed deposits with bank 2.18 11.89 Total 42.17 58.65
(ii) Current a) Advances/Deposits considered doubtful of recovery Doubtful 3,946.60 3,933.25 Less: Provision for doubtful loans and advances (3,946.60) (3,933.25)
b) Interest accrued on fixed deposit with bank 16.59 14.75 c) Derivative assets Forward exchange contracts for hedging 79.32 171.02 d) Others 364.63 375.94 Total 460.54 561.71
* There is no amount due from director, other officer of the Group or firms in which any director is a partner or private companies in which any director is a director or member at any time during the reporting period.
10: Income TaxesParticulars As at
31 March, 2019As at
31 March, 201810.1: Income-tax assets and liabilities Income-tax assets Advance income tax (Net of provisions) 7,519.64 7,209.21
7,519.64 7,209.21 Income-tax liabilities Provision for current tax (Net of advance tax) 427.15 328.99
427.15 328.99
Particulars For the year ended 31 March, 2019
For the year ended 31 March, 2018
10.2: Income tax recognised in profit or loss Current income tax: Current income tax charge 6,886.26 6,772.28 Adjustments in respect of current income tax of prior years (10.27) (140.60) Total (A) 6,875.99 6,631.68 Deferred tax: In respect of current year (327.94) (631.11) Total (B) (327.94) (631.11) Income tax expense recognised in the Consolidated Statement of profit and loss (A+B) 6,548.05 6,000.57
Income Tax recognised in Other Comprehensive Income Income tax expense on remeasurements of employee defined benefit plans (26.67) (78.23) Deferred tax expense on remeasurements of employee defined benefit plans 2.02 11.87 Total tax expense recognised in Other Comprehensive Income 24.65 66.36
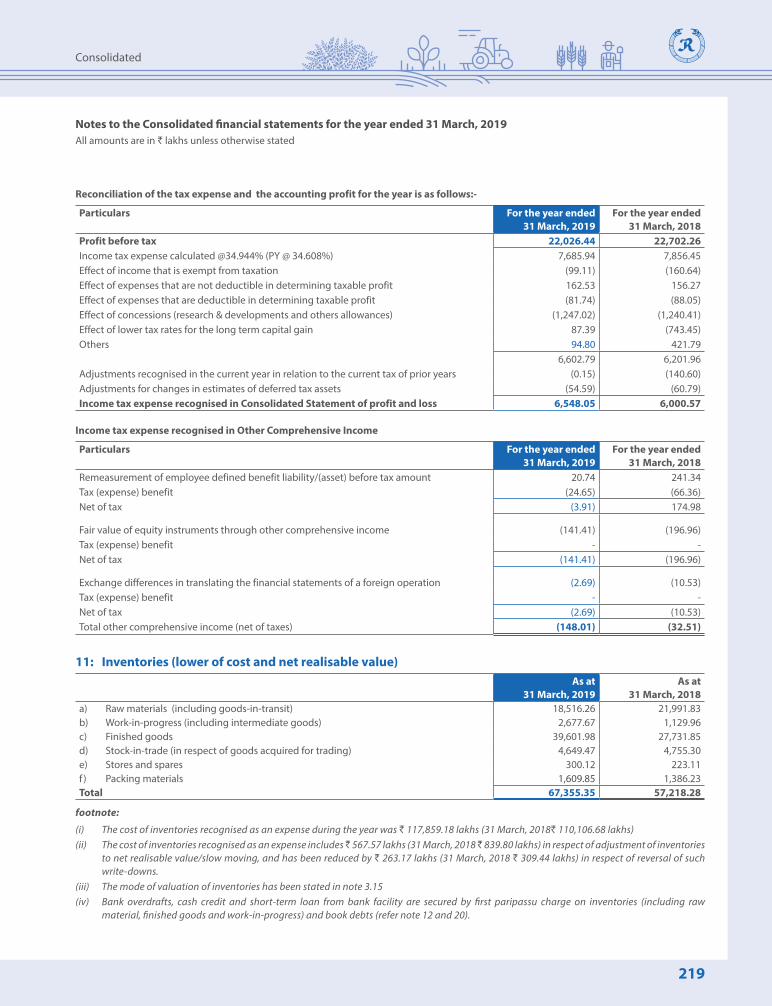
219
Consolidated
Notes to the Consolidated financial statements for the year ended 31 March, 2019All amounts are in ` lakhs unless otherwise stated
Reconciliation of the tax expense and the accounting profit for the year is as follows:-
Particulars For the year ended 31 March, 2019
For the year ended 31 March, 2018
Profit before tax 22,026.44 22,702.26Income tax expense calculated @34.944% (PY @ 34.608%) 7,685.94 7,856.45Effect of income that is exempt from taxation (99.11) (160.64)Effect of expenses that are not deductible in determining taxable profit 162.53 156.27Effect of expenses that are deductible in determining taxable profit (81.74) (88.05)Effect of concessions (research & developments and others allowances) (1,247.02) (1,240.41)Effect of lower tax rates for the long term capital gain 87.39 (743.45)Others 94.80 421.79
6,602.79 6,201.96Adjustments recognised in the current year in relation to the current tax of prior years (0.15) (140.60)Adjustments for changes in estimates of deferred tax assets (54.59) (60.79)Income tax expense recognised in Consolidated Statement of profit and loss 6,548.05 6,000.57
Income tax expense recognised in Other Comprehensive Income
Particulars For the year ended 31 March, 2019
For the year ended 31 March, 2018
Remeasurement of employee defined benefit liability/(asset) before tax amount 20.74 241.34Tax (expense) benefit (24.65) (66.36)Net of tax (3.91) 174.98
Fair value of equity instruments through other comprehensive income (141.41) (196.96)Tax (expense) benefit - - Net of tax (141.41) (196.96)
Exchange differences in translating the financial statements of a foreign operation (2.69) (10.53)Tax (expense) benefit - - Net of tax (2.69) (10.53)Total other comprehensive income (net of taxes) (148.01) (32.51)
11: Inventories (lower of cost and net realisable value)As at
31 March, 2019As at
31 March, 2018a) Raw materials (including goods-in-transit) 18,516.26 21,991.83 b) Work-in-progress (including intermediate goods) 2,677.67 1,129.96 c) Finished goods 39,601.98 27,731.85 d) Stock-in-trade (in respect of goods acquired for trading) 4,649.47 4,755.30 e) Stores and spares 300.12 223.11 f ) Packing materials 1,609.85 1,386.23 Total 67,355.35 57,218.28
footnote:
(i) The cost of inventories recognised as an expense during the year was ` 117,859.18 lakhs (31 March, 2018` 110,106.68 lakhs)(ii) The cost of inventories recognised as an expense includes ̀ 567.57 lakhs (31 March, 2018 ̀ 839.80 lakhs) in respect of adjustment of inventories
to net realisable value/slow moving, and has been reduced by ` 263.17 lakhs (31 March, 2018 ` 309.44 lakhs) in respect of reversal of such write-downs.
(iii) The mode of valuation of inventories has been stated in note 3.15(iv) Bank overdrafts, cash credit and short-term loan from bank facility are secured by first paripassu charge on inventories (including raw
material, finished goods and work-in-progress) and book debts (refer note 12 and 20).

220 | 71st Annual Report 2018-19
Rallis India Limited Financial Statements
12: Trade receivablesAs at
31 March, 2019As at
31 March, 2018Current Secured, considered good 986.65 1,076.48 Unsecured, considered good 43,920.29 38,890.82 Credit impaired 1,848.30 1,556.77 Loss allowance (1,848.30) (1,556.77)Total 44,906.94 39,967.30
footnotes:
(i) The average credit period ranges from 15 days to 180 days.
(ii) Before accepting any new customer, the Group assesses the potential customer’s credit quality and defines credit limits by customer. Limits attributed to customers are reviewed annually. Of the trade receivable balance as at 31 March, 2019 ` 9,284.47 lakhs is due from one customer (31 March, 2018 ̀ 6,126.72 lakhs is due from one cutomer). The credit risk in respect of these customers is mitigated by export credit guarantee. There are no other customers who represent more than 5% of the total balance of trade receivable.
(iii) No trade or other receivable are due from directors or other officers of the Group either severally or jointly with any other person. Nor any trade or other receivables are due from firms or private companies respectively in which any director is a partner, a director or a member.
(iv) Movement in the expected credit loss allowance
Particulars As at 31 March, 2019
As at 31 March, 2018
Balance at the beginning of the year 1,556.77 1,370.65 Less: reversal of provision due to write off - 302.11 Less: balances written off during the year 242.25 - Add: provision made during the year 533.78 488.23 Balance at the end of the year 1,848.30 1,556.77
(v) Bank overdrafts, cash credit facility and short-term loans from bank are secured by first paripassu charge on inventories (including raw material, finished goods and work-in-progress) and book debts (refer note 11 and 20).
13: Cash and bank balances
As at 31 March, 2019
As at 31 March, 2018
13.1: Cash and cash equivalentsa. Balances with banks in current accounts 4,180.06 996.38b. Cash on hand 4.83 3.92c. Term deposits with original maturity of less than 3 months 0.10 1,892.31Total Cash and cash equivalents as per Balance Sheet 4,184.99 2,892.61Bank overdrafts and cash credit facility (secured) (3,595.86) (14.59)Cash and cash equivalents as per Consolidated Statement of cash flows 589.13 2,878.02
13.2: Other bank balancesa. In other deposit accounts - original maturity more than 3 months and less than 12
months172.03 154.64
b. In earmarked accounts: i. Balances held for unpaid / unclaimed dividend accounts 174.94 167.33 ii. Bank deposits as margin money against bank guarantees - original maturity
more than 3 months and less than 12 months42.84 124.61
Total other bank balances 389.81 446.58
Notes to the Consolidated financial statements for the year ended 31 March, 2019All amounts are in ` lakhs unless otherwise stated

221
Consolidated
Notes to the Consolidated financial statements for the year ended 31 March, 2019All amounts are in ` lakhs unless otherwise stated
14: Other assets (Unsecured, considered good)
As at 31 March, 2019
As at 31 March, 2018
Non-currentCapital advances 177.00 58.66 Deposit with public bodies 119.51 116.21 Claims receivable from public bodies 550.03 665.46 Prepaid lease rental 2,146.59 2,233.12 Prepaid expenses 185.39 209.61 Total 3,178.52 3,283.06
CurrentStatutory dues receivable from government authorities Goods and Services Tax receivable 5,876.65 5,968.53 Custom duty 42.85 14.40 Export benefit receivable 1,504.75 1,062.32 Inventory recoverable 3,225.93 2,662.53 Advances recoverable Advances to suppliers 1,591.21 1,717.71 Advances to employees 204.80 224.16 Others 648.93 527.45 Prepaid lease rental 89.74 89.74 Prepaid expenses 195.94 196.81 Total 13,380.80 12,463.65
15: Assets classified as held for sale
As at 31 March, 2019
As at 31 March, 2018
Leasehold land - 1,264.90 Total - 1,264.90
footnote:
During the year, the management has decided to utilise the said land for construction of a new factory, which is supported by appropriate approvals by the Board of Directors of the Holding Company. The Holding Company has commenced construction work during the year with prior approval from GIDC and has also filed an application with GIDC in to seek extension of the lease for the said land. Accordingly, the said leasehold land is now no longer treated as an asset held for sale and has been reclassified to “property, plant and equipment” during the year (refer note 4).

222 | 71st Annual Report 2018-19
Rallis India Limited Financial Statements
Notes to the Consolidated financial statements for the year ended 31 March, 2019All amounts are in ` lakhs unless otherwise stated
16: Share capital
As at 31 March, 2019
As at 31 March, 2018
Authorised share capital :500,000,000 ( 31 March, 2018 500,000,000 ) equity shares of ` 1 each with voting rights 5,000.00 5,000.00 150,000,000 ( 31 March, 2018 150,000,000 ) preference shares of ` 10 each 15,000.00 15,000.00
Issued, subscribed and paid up capital comprises:Issued shares194,470,890 ( 31 March, 2018 194,470,890 ) equity shares of ` 1 each 1,944.71 1,944.71 Subscribed and fully paid up194,468,890 ( 31 March, 2018 194,468,890 ) equity shares of ` 1 each 1,944.69 1,944.69 Forfeited shares2,000 ( 31 March, 2018 2,000 ) equity shares of ` 1 each 0.02 0.02
1,944.71 1,944.71
footnotes:
a. Reconciliation of the number of shares and amount outstanding at the beginning and at the end of the year:
Fully paid equity shares
Number of shares
Amount of share capital
Balance at 31 March, 2018 19,44,68,890 1,944.69 Movements during the year - - Balance at 31 March, 2019 19,44,68,890 1,944.69
b. The Company has issued one class of equity shares having a par value of ` 1 per share. Each shareholder is eligible for one vote per share held. The dividend proposed by the Board of Directors is subject to the approval of the shareholders in the ensuing Annual General Meeting, except in case of interim dividend. In the event of liquidation, the equity shareholders are eligible to receive the remaining assets of the Company after distribution of all preferential amounts, in proportion to their shareholding.
c. Details of shares held by the Holding Company
Out of total equity shares issued by the Company, shares held by its Holding Company are as below:
Number of fully paid equity shares
Amount of share capital
Tata Chemicals LimitedAs at 31 March, 2018 9,73,41,610 973.42 As at 31 March, 2019 9,73,41,610 973.42
d. Details of shares held by each shareholder holding more than 5% shares in the Company:
Number of fully paid equity shares
% holding of equity shares
Tata Chemicals LimitedAs at 31 March, 2018 9,73,41,610 50.06%As at 31 March, 2019 9,73,41,610 50.06%
Rakesh JhunjhunwalaAs at 31 March, 2018 1,88,05,820 9.67%As at 31 March, 2019 1,79,80,820 9.25%
e. As per records of the Company as at 31 March, 2019, no calls remain unpaid by the directors and officers of the Company.

223
Consolidated
Notes to the Consolidated financial statements for the year ended 31 March, 2019All amounts are in ` lakhs unless otherwise stated
17: Other equityAs at
31 March, 2019As at
31 March, 2018General reserve 17,649.93 17,649.93 Securities premium reserve 8,793.88 8,793.88 Retained earnings 90,822.35 81,284.11 Foreign currency translation reserve on consolidation (13.22) (10.53)Capital redemption reserve 8,151.77 8,151.77 Capital reserve 1,243.10 1,243.10 Reserve for equity instruments through Other Comprehensive Income 0.20 0.39
1,26,648.01 1,17,112.65
17.1: General reserve
As at 31 March, 2019
As at 31 March, 2018
Balance at beginning of year 17,649.93 17,649.93 Balance at the end of year 17,649.93 17,649.93
General reserve is used from time to time to transfer profits from retained earnings for appropriation purposes. As the general reserve is created by a transfer from one component of equity to another and is not an item of other comprehensive income , items included in the general reserve will not be reclassified subsequently to profit or loss.
17.2: Securities premium reserve
As at 31 March, 2019
As at 31 March, 2018
Balance at beginning of year 8,793.88 8,793.88 Balance at the end of year 8,793.88 8,793.88
Amount received on issue of shares in excess of the par value has been classified as security share premium.
17.3: Retained earningsAs at
31 March, 2019As at
31 March, 2018Balance at beginning of year 81,284.11 73,332.65 Movements Others 5.98 Other comprehensive income (Net of taxes) (3.91) 174.98 Profit attributable to the owners of the Company 15,538.45 16,761.22 Transfer from equity instruments through Other Comprehensive Income (141.22) (196.96)Payment of dividend on equity shares - Final (4,861.72) (7,292.58)Payment of distribution tax on equity shares (999.34) (1,495.20)Balance at the end of year 90,822.35 81,284.11
17.4: Capital redemption reserve
As at 31 March, 2019
As at 31 March, 2018
Balance at beginning of year 8,151.77 8,151.77 Balance at the end of year 8,151.77 8,151.77
Capital redemption reserve is created out of profits on redemption of capital.
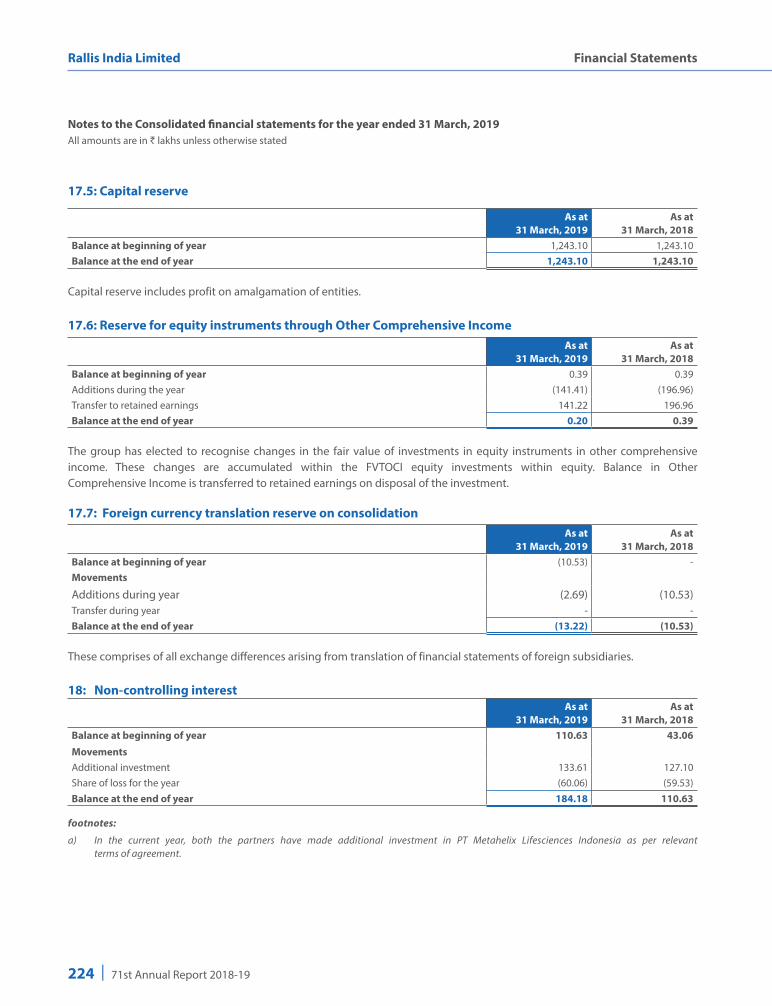
224 | 71st Annual Report 2018-19
Rallis India Limited Financial Statements
Notes to the Consolidated financial statements for the year ended 31 March, 2019All amounts are in ` lakhs unless otherwise stated
17.5: Capital reserve
As at 31 March, 2019
As at 31 March, 2018
Balance at beginning of year 1,243.10 1,243.10 Balance at the end of year 1,243.10 1,243.10
Capital reserve includes profit on amalgamation of entities.
17.6: Reserve for equity instruments through Other Comprehensive IncomeAs at
31 March, 2019As at
31 March, 2018Balance at beginning of year 0.39 0.39 Additions during the year (141.41) (196.96)Transfer to retained earnings 141.22 196.96 Balance at the end of year 0.20 0.39
The group has elected to recognise changes in the fair value of investments in equity instruments in other comprehensive income. These changes are accumulated within the FVTOCI equity investments within equity. Balance in Other Comprehensive Income is transferred to retained earnings on disposal of the investment.
17.7: Foreign currency translation reserve on consolidationAs at
31 March, 2019As at
31 March, 2018Balance at beginning of year (10.53) - Movements
Additions during year (2.69) (10.53)Transfer during year - - Balance at the end of year (13.22) (10.53)
These comprises of all exchange differences arising from translation of financial statements of foreign subsidiaries.
18: Non-controlling interestAs at
31 March, 2019As at
31 March, 2018Balance at beginning of year 110.63 43.06
MovementsAdditional investment 133.61 127.10Share of loss for the year (60.06) (59.53)Balance at the end of year 184.18 110.63
footnotes:
a) In the current year, both the partners have made additional investment in PT Metahelix Lifesciences Indonesia as per relevant terms of agreement.

225
Consolidated
Notes to the Consolidated financial statements for the year ended 31 March, 2019All amounts are in ` lakhs unless otherwise stated
19: Non-current borrowingsAs at
31 March, 2019As at
31 March, 2018Secured - at amortised cost
Secured loan from banks (refer note (ii) ) 50.00 100.00 Secured loan from other corporate bodies (refer note (ii)) 47.01 72.24 Finance lease obligation (refer note (iii) ) 11.72 20.34
Unsecured - at amortised costTerm loan from bank (refer note(ii) 900.00 1,200.00 Loan from the Council of Scientific and Industrial Research (refer note(ii) 16.65 24.98 Sales tax deferral under a state government scheme (refer note(i)) 554.78 570.22 Total 1,580.16 1,987.78
Summary of borrowing arrangements(i) Sales tax deferral scheme:
The loan is repayable in annual installments which ranges from a maximum of ` 113.11 lakhs to a minimum of ` 14.73 lakhs over the period stretching from 1 April, 2019 to 31 March, 2027. The amount outstanding is free of interest.
The balance outstanding as at 31 March, 2019 is ̀ 569.51 lakhs (31 March, 2018 ̀ 578.00 lakhs) of which ̀ 14.73 lakhs (31 March, 2018 ` 7.78 lakhs) has been grouped under note 21 other current financial liabilities which are payable in next 12 months.
(ii) The terms of repayment of term loans and other loans are stated below
As at 31 March, 2019
Particulars Amount outstanding
Terms of Repayment Rate of interest
Secured loan from banksOwed by Metahelix Life Sciences Limited
100.00 Term loan from ICICI Bank - is secured by hypothecation of movable assets, both present and future including its movable plant and equipment, machinery spares, tools and accessories and other movables, both present and future All piece and parcel of the Immovable Agricultural property situated at Kokkanda Village, Mulugu Mandal, Medak District. The balance outstanding as at 31st March, 2019 is ` 100 lakhs which is repayable in 8 equated quarterly installments of ̀ 12.50 lakhs each (of which ̀ 50.00 lakhs has been classified under note 21 other current financial liabilities).
7.50%
Secured loan from other corporate bodiesOwed by Metahelix Life Sciences Limited
72.23 Term loan from Biotechnology Industry Partnership Project is secured by hypothecation of all equipment, apparatus machineries, machineries spares, tools and other accessories, goods and/or the other movable property, present and future to a value equivalent to the amount of loan and interest thereon and the royalty payable on grant-in-aid till the full and final settlement of all dues. The Balance outstanding as at 31st March, 2019 is ̀ 72.23 lakhs (of which ` 25.22 lakhs has been classified under note 21 other current financial liabilities) which is repayable along with interest in 8 equal half yearly installments from December 2015 (Rice) and June, 2017 - (Maize).
2.00%
Unsecured term loan from bank Owed by Rallis India Limited
1,200.00 The loan is repayable in 20 quarterly installments. The repayment begins after a moratorium of 24 months from February 2018. The first repayment of ` 75.00 lakhs falls due in May 2018. The balance outstanding as at 31 March, 2019 is ` 1,200 lakhs of which ` 300 lakhs has been grouped under note 21 Other current financial liabilities, which are payable in next 12 months.
8.35% to 8.85%
Loan from the Council of Scientific and Industrial Research Owed by Metahelix Life Sciences Limited
24.98 Term loan from Council of Scientific and Industrial Research: The balance payable as on 31 March, 2019 is ` 24.98 lakhs (of which ` 8.33 lakhs has been classified under note 21 Other current financial liabilities). The same is repayable along with interest in 6 annual installments.
3.00%
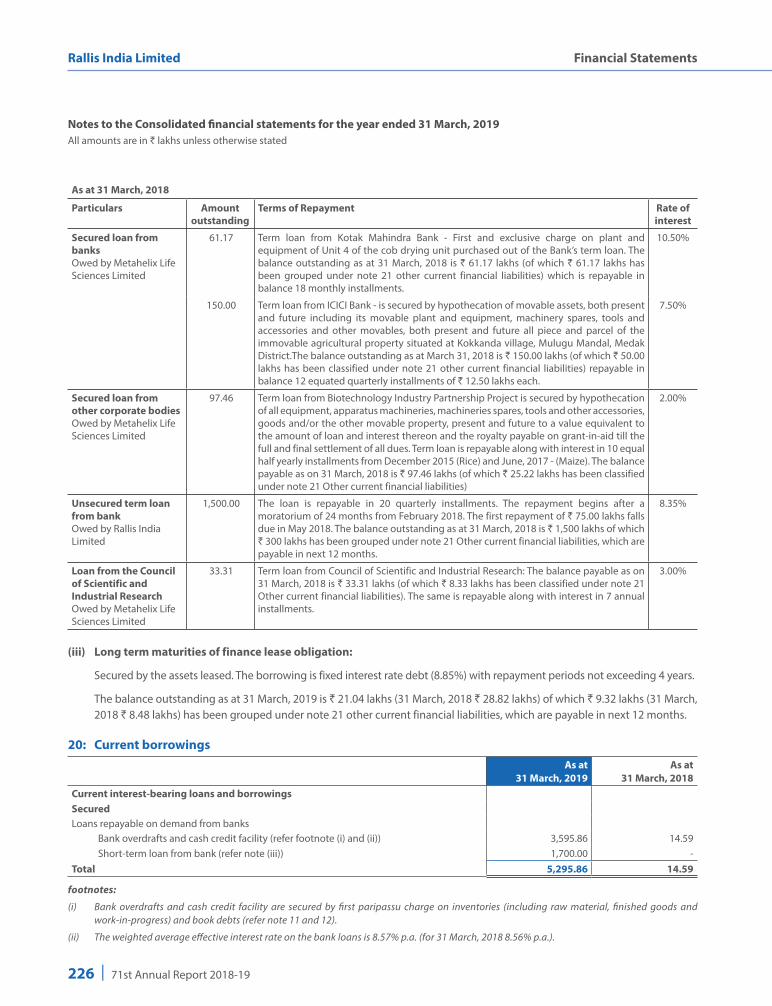
226 | 71st Annual Report 2018-19
Rallis India Limited Financial Statements
Notes to the Consolidated financial statements for the year ended 31 March, 2019All amounts are in ` lakhs unless otherwise stated
As at 31 March, 2018
Particulars Amount outstanding
Terms of Repayment Rate of interest
Secured loan from banksOwed by Metahelix Life Sciences Limited
61.17 Term loan from Kotak Mahindra Bank - First and exclusive charge on plant and equipment of Unit 4 of the cob drying unit purchased out of the Bank’s term loan. The balance outstanding as at 31 March, 2018 is ` 61.17 lakhs (of which ` 61.17 lakhs has been grouped under note 21 other current financial liabilities) which is repayable in balance 18 monthly installments.
10.50%
150.00 Term loan from ICICI Bank - is secured by hypothecation of movable assets, both present and future including its movable plant and equipment, machinery spares, tools and accessories and other movables, both present and future all piece and parcel of the immovable agricultural property situated at Kokkanda village, Mulugu Mandal, Medak District.The balance outstanding as at March 31, 2018 is ` 150.00 lakhs (of which ` 50.00 lakhs has been classified under note 21 other current financial liabilities) repayable in balance 12 equated quarterly installments of ` 12.50 lakhs each.
7.50%
Secured loan from other corporate bodiesOwed by Metahelix Life Sciences Limited
97.46 Term loan from Biotechnology Industry Partnership Project is secured by hypothecation of all equipment, apparatus machineries, machineries spares, tools and other accessories, goods and/or the other movable property, present and future to a value equivalent to the amount of loan and interest thereon and the royalty payable on grant-in-aid till the full and final settlement of all dues. Term loan is repayable along with interest in 10 equal half yearly installments from December 2015 (Rice) and June, 2017 - (Maize). The balance payable as on 31 March, 2018 is ` 97.46 lakhs (of which ` 25.22 lakhs has been classified under note 21 Other current financial liabilities)
2.00%
Unsecured term loan from bank Owed by Rallis India Limited
1,500.00 The loan is repayable in 20 quarterly installments. The repayment begins after a moratorium of 24 months from February 2018. The first repayment of ` 75.00 lakhs falls due in May 2018. The balance outstanding as at 31 March, 2018 is ` 1,500 lakhs of which ` 300 lakhs has been grouped under note 21 Other current financial liabilities, which are payable in next 12 months.
8.35%
Loan from the Council of Scientific and Industrial Research Owed by Metahelix Life Sciences Limited
33.31 Term loan from Council of Scientific and Industrial Research: The balance payable as on 31 March, 2018 is ` 33.31 lakhs (of which ` 8.33 lakhs has been classified under note 21 Other current financial liabilities). The same is repayable along with interest in 7 annual installments.
3.00%
(iii) Long term maturities of finance lease obligation:
Secured by the assets leased. The borrowing is fixed interest rate debt (8.85%) with repayment periods not exceeding 4 years.
The balance outstanding as at 31 March, 2019 is ` 21.04 lakhs (31 March, 2018 ` 28.82 lakhs) of which ` 9.32 lakhs (31 March, 2018 ` 8.48 lakhs) has been grouped under note 21 other current financial liabilities, which are payable in next 12 months.
20: Current borrowingsAs at
31 March, 2019As at
31 March, 2018Current interest-bearing loans and borrowingsSecuredLoans repayable on demand from banks Bank overdrafts and cash credit facility (refer footnote (i) and (ii)) 3,595.86 14.59 Short-term loan from bank (refer note (iii)) 1,700.00 - Total 5,295.86 14.59
footnotes:
(i) Bank overdrafts and cash credit facility are secured by first paripassu charge on inventories (including raw material, finished goods and work-in-progress) and book debts (refer note 11 and 12).
(ii) The weighted average effective interest rate on the bank loans is 8.57% p.a. (for 31 March, 2018 8.56% p.a.).

227
Consolidated
Notes to the Consolidated financial statements for the year ended 31 March, 2019All amounts are in ` lakhs unless otherwise stated
(iii) The terms of repayment of short-term loan is stated below
Particulars Amount outstanding
Terms of Repayment Rate of interest
Secured short-term loan from bank is secured by first paripassu charge on inventories (including raw material, finished goods and work-in-progress) and book debts (refer note 11 and 12).
1,700.00 The loan is repayable in 30 days from the date of availment.
8.35%
21: Other financial liabilitiesAs at
31 March, 2019As at
31 March, 2018Non-currentSecurity deposits 640.50 606.56 Total 640.50 606.56
Current(a) Current maturity of long-term borrowings (refer note 19) Term loan from bank - secured 50.00 111.17 Secured - others 25.22 25.22 Term loan from bank- unsecured 300.00 300.00 Finance lease obligation 9.32 8.48 Unsecured - others 23.06 16.11 (b) Interest accrued but not due on non-current and current borrowings 19.83 22.69 (c) Unclaimed dividends (refer footnote) 175.26 167.65 (d) Others Creditors for capital purchases 507.60 249.11 Customer deposits 1,458.97 1,405.81 Amounts due to customers 8,110.36 6,704.08 Total 10,679.62 9,010.32
footnote:All amounts required to be transferred to the Investor Education and Protection Fund by the Group have been transferred within the time prescribed for the same, except in cases of disputes relating to the ownership of the underlying shares that have remained unresolved amounting to ` 0.25 lakhs (31 March, 2018 ` 0.19 lakhs).
22: ProvisionsAs at
31 March, 2019As at
31 March, 2018Non-current(a) Supplemental pay (refer note c below) 1,364.89 1,431.68 (b) Gratuity (refer note c below) - 12.72 (c) Compensated absences (refer note c below) 160.39 144.15 (d) Directors pension liability (refer note c below) 663.60 - Total 2,188.88 1,588.55
Current(a) Supplemental pay 220.93 195.66 (b) Directors pension liability (refer note c below) 59.32 - (c) Gratuity (refer note c below) 176.59 124.51 (d) Compensated absences (refer note c below) 880.83 854.04 (e) Other Provisions (refer note a and b below) 287.32 277.32 Total 1,624.99 1,451.53

228 | 71st Annual Report 2018-19
Rallis India Limited Financial Statements
Notes to the Consolidated financial statements for the year ended 31 March, 2019All amounts are in ` lakhs unless otherwise stated
Note : (a) Provision held in respect of indirect tax matters in dispute
On an evaluation of each of its disputed claims, the Group holds an overall provision for contingency in respect of certain indirect tax matters in dispute which, as at the year-end, aggregates ₹ 237.32 lakhs (31 March, 2018 ₹ 227.32 lakhs). The movement during the year is as under:
Particulars As at 31 March, 2019
As at 31 March, 2018
Opening Balance as at 1 April 227.32 193.82
Additional provisions made during the year 10.00 33.50 Total 237.32 227.32 Payments made adjusted against above sum - - Closing Balance as at 31 March 237.32 227.32
(b) Provision for contingencies for claims in business operation :
Particulars As at 31 March, 2019
As at 31 March, 2018
Opening Balance as at 1 April 50.00 50.00 Additional provisions made during the year - - Total 50.00 50.00 Payments made adjusted against above sum - - Closing Balance as at 31 March 50.00 50.00
Due to the numerous uncertainties and variables associated with certain assumptions and judgments, and the effects of changes in the regulatory and legal environment, both the precision and reliability of the resulting estimates of the related contingencies are subject to substantial uncertainties. The Group regularly monitors its estimated exposure to such loss contingencies and, as additional information becomes known, may change its estimates significantly. However, no estimate of the range of any such change can be made at this time.
(c) The provision for employee benefits includes gratuity, supplemental pay on retirement, director pension liability and compensated absences. The increase/decrease in the carrying amount of the provision for the current year is mainly on account of net impact of incremental charge for current year and benefits paid in the current year due to retirement and resignation of employees. For other disclosures, refer note 38.
23: Deferred tax balancesThe following is the analysis of deferred taxes presented in Balance sheet
As at 31 March, 2019
As at 31 March, 2018
Reconciliation of deferred tax (a) Deferred tax assets 2,171.70 2,078.14 (b) Deferred tax liabilities - - Deferred tax assets (Net) (a-b) 2,171.70 2,078.14
(a) Deferred tax liabilities 5,518.82 5,813.63 (b) Deferred tax assets 1,702.61 1,761.02 Deferred tax liabilities (Net) (a-b) 3,816.21 4,052.61
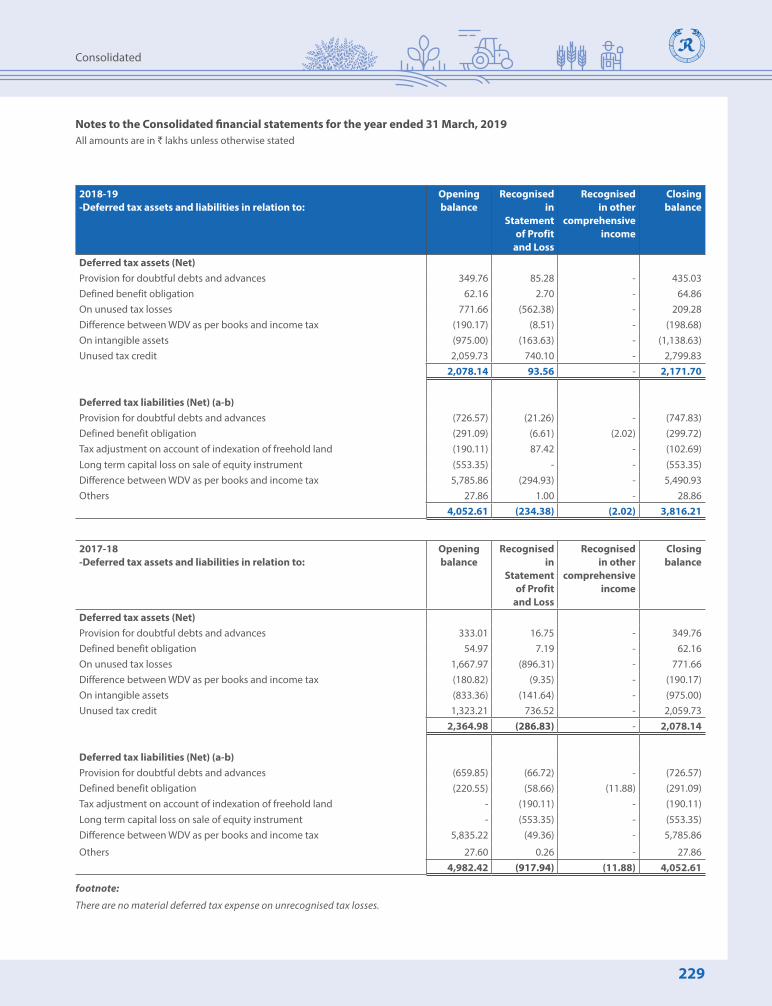
229
Consolidated
Notes to the Consolidated financial statements for the year ended 31 March, 2019All amounts are in ` lakhs unless otherwise stated
2018-19 -Deferred tax assets and liabilities in relation to:
Opening balance
Recognised in
Statement of Profit
and Loss
Recognised in other
comprehensive income
Closing balance
Deferred tax assets (Net)Provision for doubtful debts and advances 349.76 85.28 - 435.03 Defined benefit obligation 62.16 2.70 - 64.86 On unused tax losses 771.66 (562.38) - 209.28 Difference between WDV as per books and income tax (190.17) (8.51) - (198.68)On intangible assets (975.00) (163.63) - (1,138.63)Unused tax credit 2,059.73 740.10 - 2,799.83
2,078.14 93.56 - 2,171.70
Deferred tax liabilities (Net) (a-b)Provision for doubtful debts and advances (726.57) (21.26) - (747.83)Defined benefit obligation (291.09) (6.61) (2.02) (299.72)Tax adjustment on account of indexation of freehold land (190.11) 87.42 - (102.69)Long term capital loss on sale of equity instrument (553.35) - - (553.35)Difference between WDV as per books and income tax 5,785.86 (294.93) - 5,490.93 Others 27.86 1.00 - 28.86
4,052.61 (234.38) (2.02) 3,816.21
2017-18 -Deferred tax assets and liabilities in relation to:
Opening balance
Recognised in
Statement of Profit
and Loss
Recognised in other
comprehensive income
Closing balance
Deferred tax assets (Net)Provision for doubtful debts and advances 333.01 16.75 - 349.76 Defined benefit obligation 54.97 7.19 - 62.16 On unused tax losses 1,667.97 (896.31) - 771.66 Difference between WDV as per books and income tax (180.82) (9.35) - (190.17)On intangible assets (833.36) (141.64) - (975.00)Unused tax credit 1,323.21 736.52 - 2,059.73
2,364.98 (286.83) - 2,078.14
Deferred tax liabilities (Net) (a-b)Provision for doubtful debts and advances (659.85) (66.72) - (726.57)Defined benefit obligation (220.55) (58.66) (11.88) (291.09)Tax adjustment on account of indexation of freehold land - (190.11) - (190.11)Long term capital loss on sale of equity instrument - (553.35) - (553.35)Difference between WDV as per books and income tax 5,835.22 (49.36) - 5,785.86
Others 27.60 0.26 - 27.86 4,982.42 (917.94) (11.88) 4,052.61
footnote:
There are no material deferred tax expense on unrecognised tax losses.
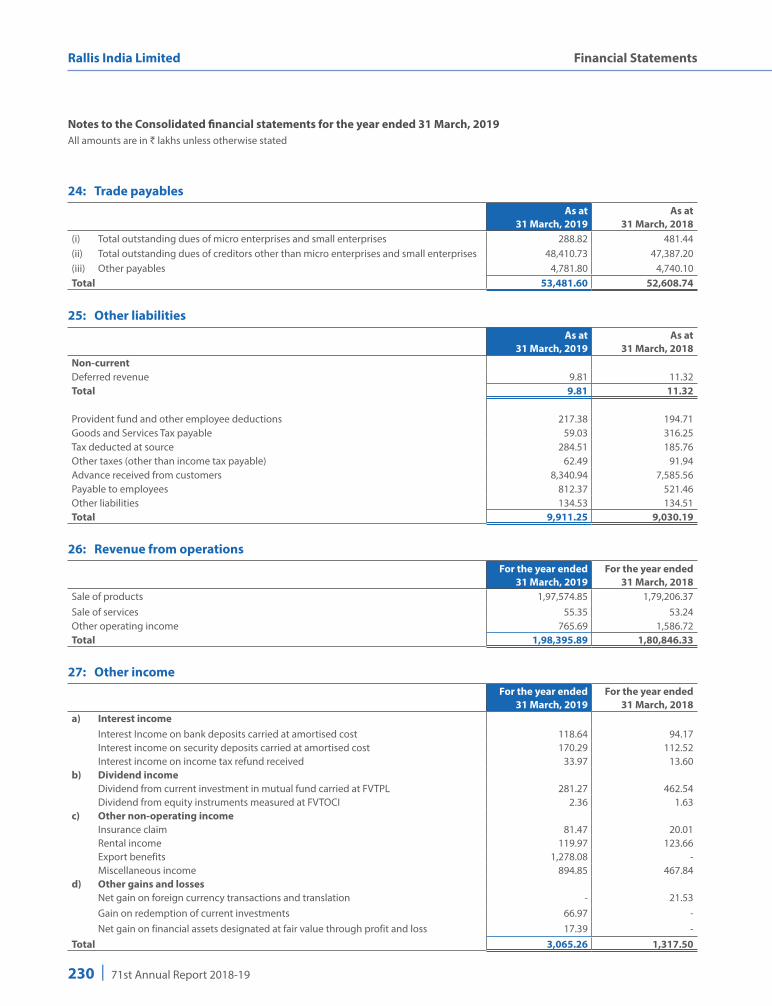
230 | 71st Annual Report 2018-19
Rallis India Limited Financial Statements
Notes to the Consolidated financial statements for the year ended 31 March, 2019All amounts are in ` lakhs unless otherwise stated
24: Trade payablesAs at
31 March, 2019As at
31 March, 2018(i) Total outstanding dues of micro enterprises and small enterprises 288.82 481.44(ii) Total outstanding dues of creditors other than micro enterprises and small enterprises 48,410.73 47,387.20(iii) Other payables 4,781.80 4,740.10Total 53,481.60 52,608.74
25: Other liabilitiesAs at
31 March, 2019As at
31 March, 2018Non-currentDeferred revenue 9.81 11.32 Total 9.81 11.32
Provident fund and other employee deductions 217.38 194.71Goods and Services Tax payable 59.03 316.25Tax deducted at source 284.51 185.76Other taxes (other than income tax payable) 62.49 91.94Advance received from customers 8,340.94 7,585.56Payable to employees 812.37 521.46Other liabilities 134.53 134.51Total 9,911.25 9,030.19
26: Revenue from operationsFor the year ended
31 March, 2019 For the year ended
31 March, 2018 Sale of products 1,97,574.85 1,79,206.37 Sale of services 55.35 53.24 Other operating income 765.69 1,586.72 Total 1,98,395.89 1,80,846.33
27: Other incomeFor the year ended
31 March, 2019 For the year ended
31 March, 2018 a) Interest income Interest Income on bank deposits carried at amortised cost 118.64 94.17 Interest income on security deposits carried at amortised cost 170.29 112.52 Interest income on income tax refund received 33.97 13.60 b) Dividend income Dividend from current investment in mutual fund carried at FVTPL 281.27 462.54 Dividend from equity instruments measured at FVTOCI 2.36 1.63 c) Other non-operating income Insurance claim 81.47 20.01 Rental income 119.97 123.66 Export benefits 1,278.08 - Miscellaneous income 894.85 467.84 d) Other gains and losses Net gain on foreign currency transactions and translation - 21.53 Gain on redemption of current investments 66.97 - Net gain on financial assets designated at fair value through profit and loss 17.39 - Total 3,065.26 1,317.50
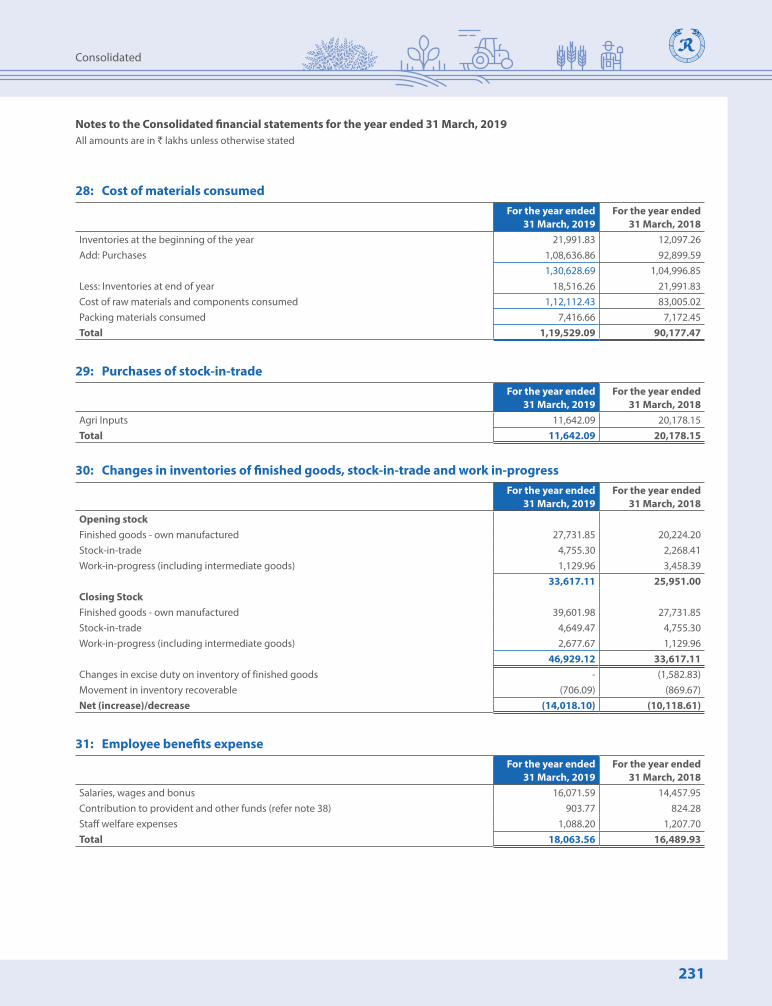
231
Consolidated
Notes to the Consolidated financial statements for the year ended 31 March, 2019All amounts are in ` lakhs unless otherwise stated
28: Cost of materials consumedFor the year ended
31 March, 2019 For the year ended
31 March, 2018 Inventories at the beginning of the year 21,991.83 12,097.26Add: Purchases 1,08,636.86 92,899.59
1,30,628.69 1,04,996.85Less: Inventories at end of year 18,516.26 21,991.83Cost of raw materials and components consumed 1,12,112.43 83,005.02Packing materials consumed 7,416.66 7,172.45Total 1,19,529.09 90,177.47
29: Purchases of stock-in-tradeFor the year ended
31 March, 2019 For the year ended
31 March, 2018 Agri Inputs 11,642.09 20,178.15Total 11,642.09 20,178.15
30: Changes in inventories of finished goods, stock-in-trade and work in-progress For the year ended
31 March, 2019 For the year ended
31 March, 2018 Opening stockFinished goods - own manufactured 27,731.85 20,224.20Stock-in-trade 4,755.30 2,268.41Work-in-progress (including intermediate goods) 1,129.96 3,458.39
33,617.11 25,951.00Closing StockFinished goods - own manufactured 39,601.98 27,731.85Stock-in-trade 4,649.47 4,755.30Work-in-progress (including intermediate goods) 2,677.67 1,129.96
46,929.12 33,617.11Changes in excise duty on inventory of finished goods - (1,582.83)Movement in inventory recoverable (706.09) (869.67)Net (increase)/decrease (14,018.10) (10,118.61)
31: Employee benefits expenseFor the year ended
31 March, 2019 For the year ended
31 March, 2018 Salaries, wages and bonus 16,071.59 14,457.95Contribution to provident and other funds (refer note 38) 903.77 824.28Staff welfare expenses 1,088.20 1,207.70Total 18,063.56 16,489.93

232 | 71st Annual Report 2018-19
Rallis India Limited Financial Statements
Notes to the Consolidated financial statements for the year ended 31 March, 2019All amounts are in ` lakhs unless otherwise stated
32: Finance costsFor the year ended
31 March, 2019 For the year ended
31 March, 2018 Interest on long-term loan from bank 116.04 129.39Interest on bank overdrafts, cash credit and short-term loan from bank 406.47 298.33Finance charges paid under finance leases 2.23 2.81 Total 524.74 430.53
33: Depreciation and amortisation expenseFor the year ended
31 March, 2019 For the year ended
31 March, 2018 Depreciation of property, plant and equipment (refer note 4) 4,064.27 3,882.75Depreciation of investment property (refer note 5) 8.11 8.10Amortization of intangible assets (note 6.2) 535.43 740.23Total 4,607.81 4,631.08
34: Other expensesFor the year ended
31 March, 2019 For the year ended
31 March, 2018 Freight, handling and packing 7,208.04 7,344.69Travelling and conveyance 2,192.13 2,067.02Power and fuel 6,393.58 5,542.26Brand equity contribution 229.08 206.00Repairs and maintenance Plant and equipment 1,026.74 805.65 Property 228.62 178.10 Others 559.30 563.86Stores and spares consumed 627.71 528.29Rates and taxes 610.95 673.32Commission 100.49 90.40Insurance charges 298.05 316.30Rent (refer note 37) 2,350.42 2,181.63Bank charges 281.63 230.73Director fees and commission 294.41 473.97Bad debts 242.25 302.11Allowance for doubtful debts 291.53 186.12Allowance for doubtful advances 31.98 2.57Intangible assets and intangible assets under development written off 308.48 - Investment written off (refer footnote) 24.60 - Loss on sale of property, plant and equipment (Net) 59.67 6.35Selling expenses 3,558.08 3,097.92Advertisement and promotion 2,743.29 3,522.19Legal and professional fees 1,825.24 1,512.75Net loss on foreign currency transactions and translation 601.30 - Other expenses (refer note 44) 6,997.96 6,089.15Total 39,085.53 35,921.38
footnotes:
During the year ended 31 March, 2019, Rallis Chemistry Exports Ltd. has made an application to the Registrar of Companies for removal of its name from the Register of Companies, hence investment has been written off from books of accounts.

233
Consolidated
Notes to the Consolidated financial statements for the year ended 31 March, 2019All amounts are in ` lakhs unless otherwise stated
35: Earnings per shareFor the year ended
31 March, 2019 For the year ended
31 March, 2018 Profit for the year attributable to owners of the Company used in the calculation of basic/diluted earnings per share
15,538.45 16,761.22
Weighted average number of equity shares for basic/diluted earnings per share 19,44,68,890 19,44,68,890 Basic /diluted earnings per share 7.99 8.62
36: Segment informationProducts and services from which reportable segments derive their revenues
Information reported to the chief operating decision maker (CODM) for the purpose of resources allocation and assessment of segment performance focuses on the types of goods or services delivered or provided. No operating segments have been aggregated in arriving at the reportable segments of the Group.
The Group has determined its business segment as “Agri -Inputs” comprising of Pesticides, Plant Growth Nutrients, Organic Compost and Seeds .The other segment includes “Polymer” and other non reportable elements.
Segment Revenue and results
The following is an analysis of the Group’s revenue and results from operations by reportable segment
Segment Segment revenue Segment resultsFor the year ended
31 March, 2019 For the year ended
31 March, 2018For the year ended
31 March, 2019For the year ended
31 March, 2018Agri Inputs 1,94,581.49 1,77,303.73 19,722.31 21,709.70Others 3,814.40 3,542.60 924.17 706.18Total 1,98,395.89 1,80,846.33 20,646.48 22,415.88Other income 3,065.26 1,317.50Central administration cost, director fees and commission
(1,160.56) (600.59)
Finance costs (524.74) (430.53)Profit before tax 22,026.44 22,702.26
Note:
(i) Segment revenue consist of sales of products including excise duty in previous year.
(ii) Segment revenue reported above represents revenue generated from external customers. There were no inter-segment sales in the current year (31 March, 2018 ` Nil). The accounting policies of the reportable segments are the same as described in note 3.22.
(iii) Segment profit represents the profit before tax earned by each segment without allocation of central administration cost and director fees and commission, other income, as well as finance costs. This is the measure reported to the chief operating decision maker for the purposes of resource allocation and assessment of segment performance.
Segment assets and liabilities
Particulars As at 31 March, 2019
As at 31 March, 2018
Segment assetsAgri Inputs 1,94,250.16 1,74,097.44Others 1,891.83 2,034.09Total segment assets 1,96,141.99 1,76,131.53Assets classified as held for sale - 1,264.90Unallocated 22,290.94 22,462.74Total assets 2,18,432.93 1,99,859.17
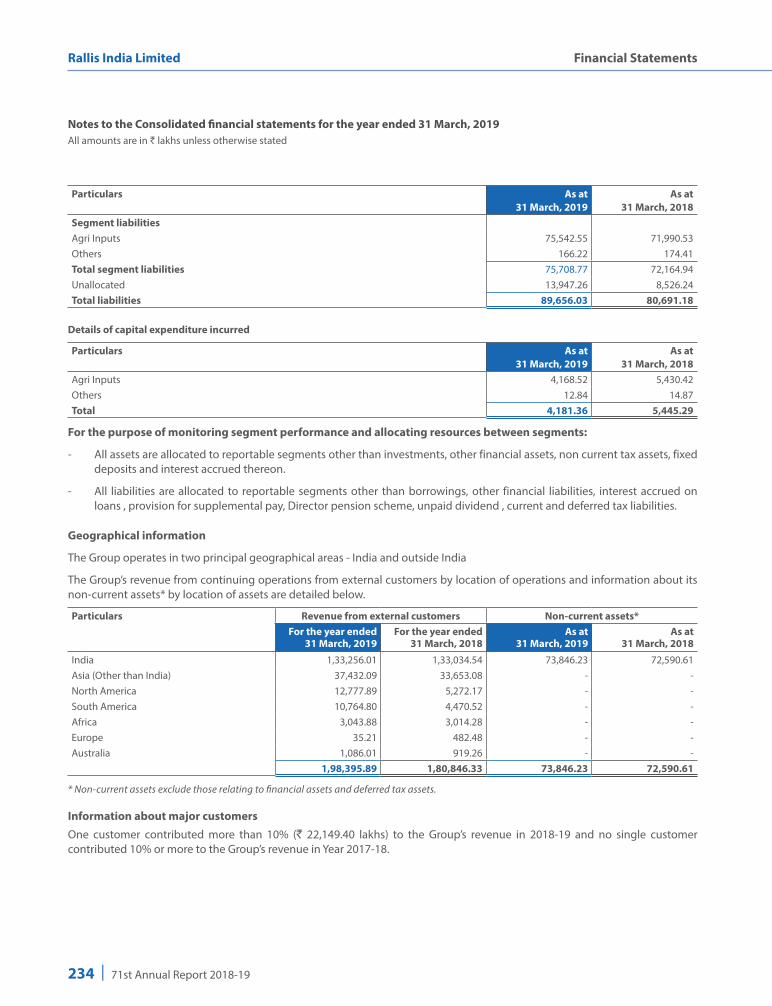
234 | 71st Annual Report 2018-19
Rallis India Limited Financial Statements
Notes to the Consolidated financial statements for the year ended 31 March, 2019All amounts are in ` lakhs unless otherwise stated
Particulars As at 31 March, 2019
As at 31 March, 2018
Segment liabilitiesAgri Inputs 75,542.55 71,990.53Others 166.22 174.41Total segment liabilities 75,708.77 72,164.94Unallocated 13,947.26 8,526.24Total liabilities 89,656.03 80,691.18
Details of capital expenditure incurred
Particulars As at 31 March, 2019
As at 31 March, 2018
Agri Inputs 4,168.52 5,430.42Others 12.84 14.87Total 4,181.36 5,445.29
For the purpose of monitoring segment performance and allocating resources between segments:
- All assets are allocated to reportable segments other than investments, other financial assets, non current tax assets, fixed deposits and interest accrued thereon.
- All liabilities are allocated to reportable segments other than borrowings, other financial liabilities, interest accrued on loans , provision for supplemental pay, Director pension scheme, unpaid dividend , current and deferred tax liabilities.
Geographical information
The Group operates in two principal geographical areas - India and outside India
The Group’s revenue from continuing operations from external customers by location of operations and information about its non-current assets* by location of assets are detailed below.
Particulars Revenue from external customers Non-current assets*For the year ended
31 March, 2019For the year ended
31 March, 2018As at
31 March, 2019As at
31 March, 2018India 1,33,256.01 1,33,034.54 73,846.23 72,590.61 Asia (Other than India) 37,432.09 33,653.08 - - North America 12,777.89 5,272.17 - - South America 10,764.80 4,470.52 - - Africa 3,043.88 3,014.28 - - Europe 35.21 482.48 - - Australia 1,086.01 919.26 - -
1,98,395.89 1,80,846.33 73,846.23 72,590.61
* Non-current assets exclude those relating to financial assets and deferred tax assets.
Information about major customersOne customer contributed more than 10% (` 22,149.40 lakhs) to the Group’s revenue in 2018-19 and no single customer contributed 10% or more to the Group’s revenue in Year 2017-18.

235
Consolidated
Notes to the Consolidated financial statements for the year ended 31 March, 2019All amounts are in ` lakhs unless otherwise stated
37: Lease arrangementsOperating lease arrangementsGroup as LesseeThe Group has procured motor vehicles and computer network under non-cancellable operating leases. Lease rent charged to the Consolidated Statement of profit and loss during the year is ` 840.87 lakhs (31 March, 2018 ` 762.04 lakhs) net of amount recovered from employees ` 5.69 lakhs (31 March, 2018 ` 5.11 lakhs). Disclosures in respect of non-cancellable leases are given below:
Amounts recognised as an expense (refer note 34)
Particulars For the year ended 31 March, 2019
For the year ended 31 March, 2018
Minimum lease payments 840.87 762.04 Total 840.87 762.04
Non-cancellable operating lease commitments
Particulars For the year ended 31 March, 2019
For the year ended 31 March, 2018
Not later than 1 year 664.12 639.50 Later than 1 year and not later than 5 years 824.00 690.42 Later than 5 years - - Total 1,488.12 1,329.92
Finance lease arrangement:
Group as Lessee
The Group has finance lease for office equipment .The Group’s obligation under finance lease are secured by lessors title to the leased assets. Future minimum lease payment under finance lease with the present value of the net minimum lease payments are as follows:-
Particulars Minimum lease payments Present value of minimum lease paymentsAs at
31 March, 2019 As at
31 March, 2018As at
31 March, 2019As at
31 March, 2018Not Later than one year 9.78 9.78 9.32 9.35 Later than one year and not later than five years 14.00 23.79 11.72 19.47 Later than five years - - - -
23.78 33.57 21.04 28.82 Less: interest element of minimum lease payment
(2.74) (4.75) - -
Present value of minimum lease payments 21.04 28.82 21.04 28.82
38: Employee benefit plans Defined contribution plans: Contribution to provident fund and ESIC
The Group makes provident fund contributions to defined contribution retirement benefit plans for eligible employees. Under the scheme, the Group is required to contribute a specified percentage of the payroll costs to fund the benefits. The contributions as specified under the law are paid to government authorities (PF commissioner) at factories.
Amount recognised as expense and included in the note 31 in the head “Contribution to Provident and other funds” for 31 March, 2019 ` 453.44 lakhs (31 March, 2018 ` 408.76 lakhs).

236 | 71st Annual Report 2018-19
Rallis India Limited Financial Statements
Notes to the Consolidated financial statements for the year ended 31 March, 2019All amounts are in ` lakhs unless otherwise stated
Defined benefit plans
The Group offers its employees defined-benefit plans in the form of a gratuity scheme (a lump sum amount), a supplemental pay scheme (a life long pension) and director pension liability. The gratuity scheme covers substantially all regular employees, director pension liability covers retired Managing Director of the holding company and supplemental pay plan covers certain former executives. In the case of the gratuity scheme, the Group contributes funds to Gratuity Trust, which is irrevocable, director pension scheme and supplemental pay scheme are not funded. Commitments are actuarially determined at year-end. The actuarial valuation is done based on “Projected Unit Credit” method.
The Group makes provident fund contributions to defined contribution retirement benefit plans for eligible employees. Under the scheme, the Group is required to contribute a specified percentage of the payroll costs to fund the benefits. The contributions as specified under the law are paid to the provident fund set up as a trust by the Group in case of certain locations. The Group is liable for contributions and any deficiency compared to interest computed based on the rate of interest declared by the Central Government under the Employees’ Provident Fund Scheme, 1952 and recognises, if any, as an expense in the year it is determined.
These plans typically expose the Group to actuarial risk such as: investment risk, interest rate risk, longevity risk and salary risk.
Investment risk:
The present value of the defined benefit plan liability is calculated using a discount rate which is determined by reference to market yields at the end of the reporting period on government bonds. If the return on plan asset is below this rate, it will create plan deficit.
Interest risk:
A decrease in the bond interest rate will increase the plan liability; however, this will be partially offset by an increase in the plan’s assets.
Longevity Risk:
The present value of the defined benefit plan liability is calculated by reference to the best estimate of the mortality of plan participants both during and after their employment. An increase in the life expectancy of the plan participants will increase the plan’s liability.
Salary Risk:
The Present value of the defined benefit plan liability is calculated by reference to the future salaries of plan participants. As such, an increase in the salary of the plan participants will increase the plan’s liability.
The principal assumptions used for the purpose of actuarial valuation were as follows.
Particulars For the year ended 31 March, 2019
For the year ended 31 March, 2018
Discount rates 7.00% to 7.69% p.a. 7.40% to 7.78% p.a. Expected rate of salary increase 8.00% p.a. 8.00% p.a. Average longevity at retirement age for current beneficiaries of the plan (years)* 8.49 Years 8.61 Years Average longevity at retirement age for current employees (future beneficiaries of the plan) (years)
5 Years to 12 Years 6 Years to 13 Years
* Based on Indian standard mortality table with modification to reflect expected changes in mortality.

237
Consolidated
Notes to the Consolidated financial statements for the year ended 31 March, 2019All amounts are in ` lakhs unless otherwise stated
Amount recognised in Consolidated Statement of profit and loss in respect of these defined benefit plans are as follows
Particulars Gratuity Supplemental pay For the year ended
31 March, 2019For the year ended
31 March, 2018For the year ended
31 March, 2019For the year ended
31 March, 2018Service cost: Current service cost 307.38 321.35 - - Net interest expense 12.56 17.06 118.63 126.72 Components of defined benefit costs recognised in profit or loss
319.94 338.41 118.63 126.72
Remeasurement on the net defined benefit liability: Return on plan assets (excluding amounts
included in net interest expense) 70.84 105.36 - -
Actuarial (Gain)/Losses arising from changes in demographic assumptions
(16.58) (6.67) (2.40) -
Actuarial (Gain)/Loss arising from changes in financial assumptions
83.05 (106.48) (39.17) (48.85)
Actuarial (Gain)/Losses arising from experience adjustments
(148.49) (146.45) 32.01 (38.25)
Components of defined benefit costs recognised in Other Comprehensive Income
(11.18) (154.24) (9.56) (87.10)
Total 308.76 184.17 109.07 39.62
The current service cost and the net interest expenses for the year are included in the Employee benefits expense line item in the Consolidated Statement of profit and loss. The remeasurement of the net defined benefit liability/asset is included in Other Comprehensive Income.
The amount included in the Balance Sheet arising from the entity’s obligation in respect of its defined benefit plan is as follows:
Particulars Gratuity Supplemental pay As at
31 March, 2019As at
31 March, 2018As at
31 March, 2019As at
31 March, 2018Present value of funded defined benefit obligations
3,167.12 2,983.93 1,585.82 1,627.34
Fair value of plan assets 2,999.48 2,855.19 - - Funded Status [Deficit/(Surplus)] 167.64 128.74 1,585.82 1,627.34 Additional provision created 8.95 8.49 - -Net liability arising from defined benefit obligation
176.59 137.23 1,585.82 1,627.34

238 | 71st Annual Report 2018-19
Rallis India Limited Financial Statements
Notes to the Consolidated financial statements for the year ended 31 March, 2019All amounts are in ` lakhs unless otherwise stated
Movements in the present value of the defined benefit obligation are as follows:
Particulars Gratuity Supplemental pay As at
31 March, 2019As at
31 March, 2018As at
31 March, 2019As at
31 March, 2018Opening defined benefit obligation 2,983.93 2,856.39 1,627.34 1,738.31 Current service cost 306.03 321.35 - - Interest cost 230.63 207.19 118.63 126.72 Liability Transferred in/Acquisitions 5.16 Remeasurement (Gain)/Losses:Actuarial (Gain)/Losses arising from changes in demographic assumptions
(16.58) (6.67) (2.40) -
Actuarial (Gain)/Loss arising from changes in financial assumptions
82.75 (103.99) (39.17) (48.85)
Actuarial (Gain)/Losses arising from experience adjustments
(151.23) (146.17) 32.01 (38.25)
Benefits paid (273.57) (144.17) (150.59) (150.59)Closing defined benefit obligation 3,167.12 2,983.93 1,585.82 1,627.34
Movements in the fair value of the plan assets are as follows
Particulars Gratuity Supplemental pay As at
31 March, 2019As at
31 March, 2018As at
31 March, 2019As at
31 March, 2018Opening fair value of the plan assets 2,855.19 2,638.24 - - Interest income 218.39 190.15 - - Remeasurement gain (loss):Return on plan assets (excluding amounts included in net interest expense)
(70.84) (105.36) - -
Assets Transferred In/Acquisitions 5.16 - - -Actuarial gain/(loss) - 2.08 - - Contributions from the employer 265.15 274.25 - - Benefits paid (273.57) (144.17) - - Closing fair value of plan assets 2,999.48 2,855.19 - -
The plan assets are managed by the Gratuity Trust formed by the Group. The management of funds is entrusted with the Life Insurance Corporation of India (“LIC”).
Directors pension liability
Particulars As at 31 March, 2019
As at 31 March, 2018
Opening defined benefit obligation - - Current service cost 722.92 - Closing defined benefit obligation 722.92 -

239
Consolidated
Notes to the Consolidated financial statements for the year ended 31 March, 2019All amounts are in ` lakhs unless otherwise stated
The fair value of the plan assets at the end of the reporting period for each category, are as follow:
Particulars Gratuity Supplemental pay As at
31 March, 2019As at
31 March, 2018As at
31 March, 2019As at
31 March, 2018Cash and cash equivalents 4.47 8.65 - - Equity investments categorised by industry type:Consumer industry - - - - Manufacturing industry - 1.86 - - Financial institutions - 0.71 - - IT and telecom - 0.14 - - Subtotal - 2.71 - - Debt investments categorised by issuers credit rating:Sovereign - 667.08 - - AAA - 1,330.95 - - AA+ and below - 70.41 - - Subtotal - 2,068.44 - - Investment funds with insurance GroupUnit linked - - - - Traditional / non unit linked 482.55 775.39 - -
482.55 775.39 - - Others - LIC managed fund 2,512.46 - - - Total 2,999.48 2,855.19 - -
Significant actuarial assumptions for the determination of the defined benefit obligation are discount rate, expected salary increase and mortality. The sensitivity analysis below have been determined based on reasonably possible changes of the respective assumptions occurring at the end of the reporting period, while holding all other assumptions constant.
1. If the discounting rate is 100 basis point higher (lower), the defined benefit obligation would decrease by ` 361.87 lakhs (increase by ` 424.23 lakhs) (31 March, 2018: decrease by ` 323.55 lakhs (increase by ` 369.46 lakhs).
2. If the expected salary growth increases (decreases) by 1%, the defined benefit obligation would increase by ` 249.69 lakhs (decrease by ` 213.16 lakhs) (31 March, 2018: increase by ` 251.27 lakhs (decrease by ` 223.99 lakhs).
3. If the life expectancy increases (decreases) by 1 year, the defined benefit obligation would increase by ` 37.93 lakhs (decrease by ` 37.91 lakhs) (31 March, 2018: increase by ` 38.44 lakhs (decrease by ` 38.94 lakhs).
The sensitivity analysis presented above may not representative of the actual change in the defined benefit obligation as it is unlikely that the change in assumptions would occur in isolation of one another as some of the assumptions may be correlated.
Furthermore, in presenting the above sensitivity analysis, the present value of the defined benefit obligation has been calculated using “Projected Unit Credit” method at the end of the reporting period which is the same as that applied in calculating the defined benefit obligation liability recognised in Balance Sheet.
There were no change in the methods and assumptions used in preparing the sensitivity analysis from prior years.

240 | 71st Annual Report 2018-19
Rallis India Limited Financial Statements
Notes to the Consolidated financial statements for the year ended 31 March, 2019All amounts are in ` lakhs unless otherwise stated
The Group expects to make a contribution of ` 246.59 lakhs (31 March, 2018 ` 184.50 lakhs ) to the defined benefit plans during the next financial year.
The defined benefit obligations (mainly related to Rallis India Limited) shall mature after year ended 31 March, 2019 as follows:
Particulars Defined benefit obligation
As at 31 March2020 480.85 2021 359.61 2022 448.86 2023 469.65 2024 463.99 Thereafter 2,302.16
The Group operates Provident Fund Scheme and the contributions are made to recognised fund. The Group is required to offer a defined benefit interest rate guarantee on provident fund balances of employees. The interest rate guarantee is payable to the employees for the year when the exempted fund declares a return on provident fund investments which is less than the rate declared by the Regional Provident Fund Commissioner (RPFC) on the provident fund corpus for their own subscribers. The Actuary has provided a valuation for provident fund liabilities on the basis of guidance issued by Actuarial Society of India and based on the below provided assumptions there is no shortfall as on 31 March, 2019 and 31 March, 2018.
Amount recognised as expense and included in the Note 31 - in the head “Contribution to Provident and other funds” for 31 March, 2019 ` 233.18 lakhs (for 31 March, 2018 ` 213.29 lakhs).
The details of provident fund and plan asset position are given below:
Particulars As at 31 March, 2019
As at 31 March, 2018
Plan assets as period end 8,142.68 7,112.52 Present value of funded obligation 7,771.78 6,764.91 Amount recognised in the Balance Sheet - -
Assumptions used in determining present value of obligation of interest rate guarantee under a deterministic approach:
Particulars For the year ended 31 March, 2019
For the year ended 31 March, 2018
Guaranteed rate of return 8.55% 8.65%Discount rate for remaining term to maturity of investments 7.69% 7.78%Expected rate of return on investments 7.78% 7.99%
As at 31 March, 2019, the fair value of the assets of the fund and the accumulated members’ corpus is ` 8,142.68 lakhs and ` 7,771.78 lakhs respectively. In accordance with an assets and liability study, there is no deficiency as the present value of the expected future earnings on the fund is greater than the expected amount to be credited to the individual members based on the expected guaranteed rate of interest.
Compensatory absences
The Group provides for the encashment of leave or leave with pay subject to certain rules. The employees are entitled to accumulate leave subject to certain limits, for future encashment. The liability is provided based on the number of days of unutilized leave at each balance sheet date on the basis of an independent actuarial valuation. Amount of ` 190.69 lakhs (31 March, 2018 ` 213.29 lakhs ) has been recognised in the Consolidated Statement of profit and loss on account of provision for long-term employment benefit.

241
Consolidated
Notes to the Consolidated financial statements for the year ended 31 March, 2019All amounts are in ` lakhs unless otherwise stated
39: Financial instrumentsCapital management
The Group manages its capital to ensure that entities in the Group will be able to continue as going concern while maximising the return to stakeholders through optimisation of debt and equity balance.
The capital structure of the Group consists of net debt (borrowings as detailed in note 19,20 and 21 offset by cash and bank balances) and total equity of the Group.
The Group is not subject to any externally imposed capital requirements.
Gearing Ratio
The gearing ratio at the end of the reporting period was as follows
Particulars As at 31 March, 2019
As at 31 March, 2018
Debt (i) 7,283.62 2,463.35 Cash and bank balances (4,574.80) (3,339.19)Net debt 2,708.82 (875.84)Total equity 1,28,776.90 1,19,167.99 Net debt to equity ratio 2.10% -0.73%
(i) Debt is defined as long-term borrowings, short-term borrowings and current maturity of long-term borrowings (excluding financial guarantee contracts and contingent consideration), as described in notes 19,20 and 21.
Fair value hierarchy The following table shows the carrying amounts and fair values of financial assets and financial liabilities, including their levels in the fair value hierarchy. It does not include fair value information for financial assets and financial liabilities not measured at fair value if the carrying amount is a reasonable approximation of fair value.
As at 31 March, 2019
Particulars
Carrying amount Fair value measurement usingTotal FVTPL FVTOCI Amortised
costTotal Quoted
prices in active market
(Level 1)
Significant observable
inputs (Level 2)
Significant unobservable
inputs (Level 3)
Financial assetsCash and cash equivalents 4,184.99 - - 4,184.99 - - - -Bank balances other than above 389.81 - - 389.81 - - - -Non-current investments 378.84 - 378.84 - 378.84 0.50 - 378.34 Current investments 10,548.14 10,548.14 - - 10,548.14 - 10,548.14 - Loans (non-current) 674.09 - - 674.09 674.09 - - 674.09Loans (current) 93.33 - - 93.33 - - - -Other non current financial assets 42.17 - - 42.17 42.17 - - 42.17 Trade receivables 44,906.94 - - 44,906.94 - - - -Other current financial assets 460.54 79.32 - 381.22 79.32 - 79.32 -Financial liabilitiesNon-current borrowings (excluding current portion)
1,580.16 - - 1,580.16 1,580.16 - - 1,580.16
Current borrowings 5,295.86 - - 5,295.86 - - - -Trade payables 53,481.60 - - 53,481.60 - - - -Other current financial liabilities 10,679.62 - - 10,679.62 - - - -
There have been no transfers among Level 1, Level 2 and Level 3 during the year.

242 | 71st Annual Report 2018-19
Rallis India Limited Financial Statements
Notes to the Consolidated financial statements for the year ended 31 March, 2019All amounts are in ` lakhs unless otherwise stated
As at 31 March, 2018
Particulars
Carrying amount Fair value measurement usingTotal FVTPL FVTOCI Amortised
costTotal Quoted
prices in active market
(Level 1)
Significant observable
inputs (Level 2)
Significant unobservable
inputs (Level 3)
Financial assetsCash and cash equivalents 2,892.61 - - 2,892.61 - - - -Bank balances other than above 446.58 - - 446.58 - - - -Non-current investments 379.03 - 379.03 - 379.03 0.69 - 378.34 Current investments 9,180.69 9,180.69 - - 9,180.69 - 9,180.69 - Loans (non-current) 645.41 - - 645.41 645.41 - - 645.41Loans (current) 111.61 - - 111.61 - - - -Other non current financial assets 58.65 - - 58.65 58.65 - - 58.65 Trade receivables 39,967.30 - - 39,967.30 - - - -Other current financial assets 561.71 171.02 - 390.69 171.02 - 171.02 -Financial liabilitiesNon-current borrowings (excluding current portion)
1,987.78 1,987.78 1,987.78 - - 1,987.78
Current borrowings 14.59 14.59 - - - -Trade payables 52,608.74 52,608.74 - - - -Other current financial liabilities 9,010.32 - 9,010.32 - - - -
There have been no transfers among Level 1, Level 2 and Level 3 during the year.
Measurement of fair valuesValuation techniques and significant unobservable inputsThe following tables show the valuation techniques used in measuring Level 2 and Level 3 fair values, as well as the significant unobservable inputs used
Financial instruments measured at fair value
Type Valuation technique Significant unobservable inputs
Inter-relationship between significant unobservable inputs and fair value measurement
Non current financial assets and liabilities measured at amortised cost
Discounted cash flows: The valuation model considers the present value of expected receipt/payment discounted using appropriate discounting rates.
Not applicable Not applicable
Forward contracts for foreign exchange contracts
Forward pricing: The fair value is determined using quoted forward exchange rates at the reporting date and present value calculations based on high credit quality yield curves in the respective currency.
Not applicable Not applicable
Current investments -in mutual funds
The fair values of investments in mutual fund units is based on the net asset value (‘NAV’) as stated by the issuers of these mutual fund units in the published statements as at Balance Sheet date. NAV represents the price at which the issuer will issue further units of mutual fund and the price at which issuers will redeem such units from the investors
Not applicable Not applicable
Non-current investments Discounted cash flows: The valuation model considers the present value of expected cash flows discounted using appropriate discounting rates.
Not applicable Not applicable
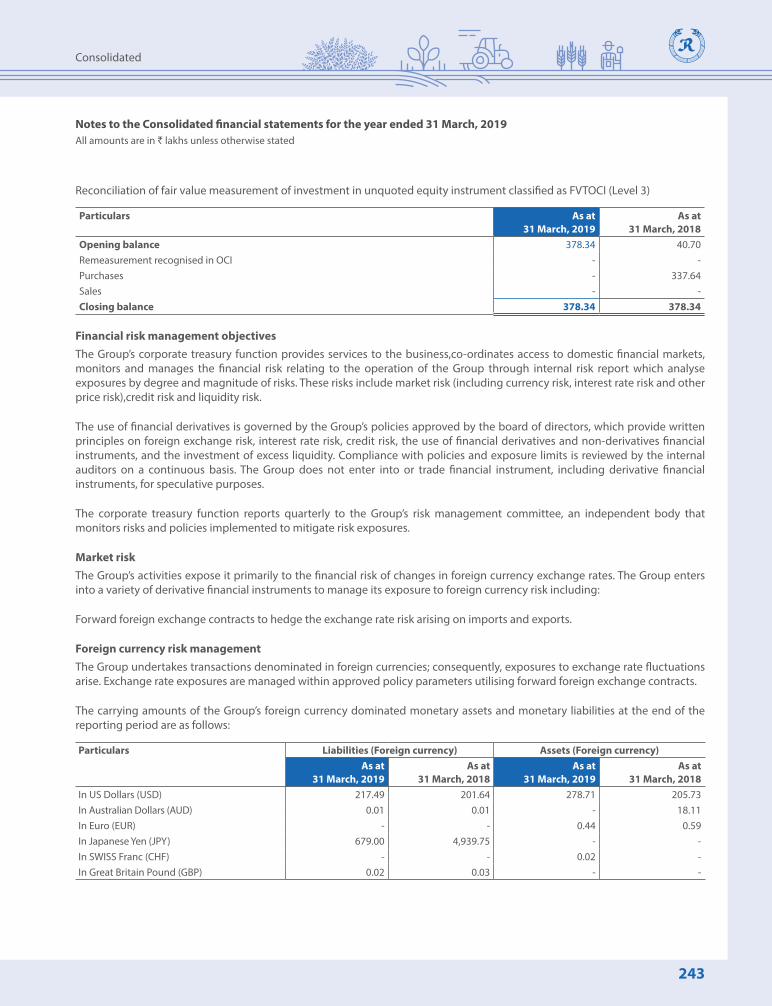
243
Consolidated
Notes to the Consolidated financial statements for the year ended 31 March, 2019All amounts are in ` lakhs unless otherwise stated
Reconciliation of fair value measurement of investment in unquoted equity instrument classified as FVTOCI (Level 3)
Particulars As at 31 March, 2019
As at 31 March, 2018
Opening balance 378.34 40.70 Remeasurement recognised in OCI - - Purchases - 337.64 Sales - - Closing balance 378.34 378.34
Financial risk management objectivesThe Group’s corporate treasury function provides services to the business,co-ordinates access to domestic financial markets, monitors and manages the financial risk relating to the operation of the Group through internal risk report which analyse exposures by degree and magnitude of risks. These risks include market risk (including currency risk, interest rate risk and other price risk),credit risk and liquidity risk.
The use of financial derivatives is governed by the Group’s policies approved by the board of directors, which provide written principles on foreign exchange risk, interest rate risk, credit risk, the use of financial derivatives and non-derivatives financial instruments, and the investment of excess liquidity. Compliance with policies and exposure limits is reviewed by the internal auditors on a continuous basis. The Group does not enter into or trade financial instrument, including derivative financial instruments, for speculative purposes.
The corporate treasury function reports quarterly to the Group’s risk management committee, an independent body that monitors risks and policies implemented to mitigate risk exposures.
Market riskThe Group’s activities expose it primarily to the financial risk of changes in foreign currency exchange rates. The Group enters into a variety of derivative financial instruments to manage its exposure to foreign currency risk including:
Forward foreign exchange contracts to hedge the exchange rate risk arising on imports and exports.
Foreign currency risk managementThe Group undertakes transactions denominated in foreign currencies; consequently, exposures to exchange rate fluctuations arise. Exchange rate exposures are managed within approved policy parameters utilising forward foreign exchange contracts.
The carrying amounts of the Group’s foreign currency dominated monetary assets and monetary liabilities at the end of the reporting period are as follows:
Particulars Liabilities (Foreign currency) Assets (Foreign currency)As at
31 March, 2019As at
31 March, 2018As at
31 March, 2019As at
31 March, 2018In US Dollars (USD) 217.49 201.64 278.71 205.73 In Australian Dollars (AUD) 0.01 0.01 - 18.11 In Euro (EUR) - - 0.44 0.59 In Japanese Yen (JPY) 679.00 4,939.75 - - In SWISS Franc (CHF) - - 0.02 - In Great Britain Pound (GBP) 0.02 0.03 - -

244 | 71st Annual Report 2018-19
Rallis India Limited Financial Statements
Notes to the Consolidated financial statements for the year ended 31 March, 2019All amounts are in ` lakhs unless otherwise stated
Particulars Liabilities (INR) Assets (INR)As at
31 March, 2019As at
31 March, 2018As at
31 March, 2019As at
31 March, 2018In US Dollars (USD) 15,040.82 13,141.86 19,274.02 13,408.36 In Australian Dollars (AUD) 0.33 0.34 - 906.06
In Euro (EUR) - - 34.06 47.47 In Japanese Yen (JPY) 423.81 3,038.19 - - In SWISS Franc (CHF) - - 1.09 - In Great Britain Pound (GBP) 2.10 2.54 - -
Foreign currency sensitivity analysisThe Group is mainly exposed to the currency : USD; EUR; JPY and GBP.
The following table details the Group’s sensitivity to a 5% increase and decrease in the ` against the relevant foreign currencies. 5% is the sensitivity rate used when reporting foreign currency risk internally to key management personnel and represents management’s assessment of the reasonably possible change in foreign exchange rates. This is mainly attributable to the exposure outstanding on receivables and payables in the Group at the end of the reporting period. The sensitivity analysis includes only outstanding foreign currency denominated monetary items and adjusts their translation at the period end for a 5% change in foreign currency rate. A positive number below indicates an increase in the profit or equity where the ` strengthens 5% against the relevant currency. For a 5% weakening of the ` against the relevant currency, there would be a comparable impact on the profit or equity , and the balances below would be negative.
Impact on profit / (loss) and total equity
Particulars USD impactAs at
31 March, 2019As at
31 March, 2018Increase in exchange rate by 5% 211.66 13.32 Decrease in exchange rate by 5% (211.66) (13.32)
Particulars AUD impactAs at
31 March, 2019As at
31 March, 2018Increase in exchange rate by 5% (0.02) 45.29 Decrease in exchange rate by 5% 0.02 (45.29)
Particulars EUR impactAs at
31 March, 2019As at
31 March, 2018Increase in exchange rate by 5% 1.70 2.37 Decrease in exchange rate by 5% (1.70) (2.37)
Particulars JPY impactAs at
31 March, 2019As at
31 March, 2018Increase in exchange rate by 5% (21.19) (151.91)Decrease in exchange rate by 5% 21.19 151.91

245
Consolidated
Notes to the Consolidated financial statements for the year ended 31 March, 2019All amounts are in ` lakhs unless otherwise stated
Particulars GBP impactAs at
31 March, 2019As at
31 March, 2018Increase in exchange rate by 5% (0.11) (0.13)Decrease in exchange rate by 5% 0.11 0.13
Particulars SWISS Franc (CHF) impactAs at
31 March, 2019As at
31 March, 2018Increase in exchange rate by 5% 0.05 - Decrease in exchange rate by 5% (0.05) -
The Group, in accordance with its risk management policies and procedures, enters into foreign currency forward contracts to manage its exposure in foreign exchange rate variations. The counter party is generally a bank. These contracts are for a period between one day and four years. The above sensitivity does not include the impact of foreign currency forward contracts which largely mitigate the risk.
Derivative Instruments:
The Group uses foreign currency forward contracts to hedge its risks associated with foreign currency fluctuations relating to accounts receivable and accounts payable. The use of foreign currency forward contracts is governed by the Group’s strategy approved by the Board of Directors, which provide principles on the use of such forward contracts consistent with the Group’s Risk Management Policy. The Group does not use forward contracts for speculative purposes.
The following forward exchange contracts are outstanding as at balance sheet date:
Particulars As at 31 March, 2019 As at 31 March, 2018Number of
contracts` lakhs Foreign currency
in lakhsNumber of
contracts` lakhs Foreign currency
in lakhsReceivables 6 3,550.22 USD 51.34 1 411.32 USD 6.31 Payable 1 423.81 JPY 679.00 4 2,997.14 JPY 4,873.00
Note: USD = US Dollar; JPY = Japanese Yen.
The line item in the balance sheet that includes the above hedging instruments are “other financial assets and other financial liabilities”.
Equity Risk
There is no material equity risk relating to the Group’s equity investments which are detailed in note 7. The Group equity investments majorly comprises of strategic investments rather than trading purposes.
Interest Risk
Interest rate risk is the risk that the fair value or future cash flows of a financial instrument that will fluctuate because of changes in market rates. The Group’s exposure to the risk of changes in market rates relates primarily to the Group’s non-current debt obligations with floating interest rates. The Group’s policy is generally to undertake non current borrowing using facilities that carry floating interest rate.
Moreover, the short-term borrowings of the Group do not have a significant fair value or cash flow interest rate risk due to their short tenure.

246 | 71st Annual Report 2018-19
Rallis India Limited Financial Statements
Notes to the Consolidated financial statements for the year ended 31 March, 2019All amounts are in ` lakhs unless otherwise stated
At the end of reporting period, the Group had the following variable interest rate borrowings and fixed interest rate financial assets:
Particulars As at 31 March, 2019
As at 31 March, 2018
Non-current variable interest rate borrowings 1,321.04 1,739.99 Non-current fixed interest rate borrowings 111.94 138.55 Current variable interest rate borrowings 5,295.86 14.59Fixed interest rate financial assets 254.96 2,218.32
Cash flow sensitivity analysis for variable rate instrumentsNon-current variable interest rate borrowingsIf the interest rate is 100 basis point higher (lower), the impact on profit or loss would be decreased by ` 23.86 lakhs (increased by ` 23.86 lakhs) (as at 31 March, 2018: decrease by ` 37.42 lakhs (increase by ` 37.42 lakhs).
Current variable interest rate borrowings
If the interest rate is 100 basis point higher (lower), the impact on profit or loss would be decreased by ` 1.16 lakhs (increased by ` 1.16 lakhs) (as at 31 March, 2018: decrease by ` Nil (increase by ` Nil).
Credit risk managementCredit risk refers to the risk that a counter party will default on its contractual obligation resulting in financial loss to the Group. The Group uses its own trading records to evaluate the credit worthiness of its customers. The Group’s exposure are continuously monitored and the aggregate value of transactions concluded, are spread amongst approved counter parties (refer note 12).
The credit risk on investment in mutual funds and derivative financial instruments is limited because the counter parties are reputed banks or funds sponsored by reputed bank.
Liquidity risk managementUltimate responsibility for liquidity risk management rests with the board of directors, which has established an appropriate liquidity risk management framework for the management of the Group’s short-term, medium-term and long-term funding and liquidity management requirements. The Group manages liquidity risk by maintaining adequate reserves, banking facilities and reserve borrowing facilities, by continuously monitoring forecast and actual cash flows, and by matching the maturity profiles of financial assets and liabilities.
All current financial liabilities are repayable within one year. The contractual maturities of non-current liabilities are disclosed in note 19.
Liquidity risk tableThe following table detail the Group’s remaining contractual maturity for its non-derivative financial liabilities with agreed repayment periods. The tables have been drawn up based on the undiscounted cash flows of financial liabilities based on the earliest date on which the Group can be required to pay.
Particulars Less than 1 year
1-5 years More than 5 year
Total Carrying amount
As at 31 March, 2019Borrowings including future interest payable 5,806.14 1,501.98 196.34 7,504.46 7,283.62 Trade payables 53,481.60 - - 53,481.60 53,481.60 Other financial liabilities (Current and Non-current) 10,272.02 640.50 - 10,912.52 10,912.52
69,559.76 2,142.48 196.34 71,898.58 71,677.74
As at 31 March, 2018Borrowings including future interest payable 452.58 1,804.70 510.06 2,767.34 2,454.87 Trade payables 52,608.74 - - 52,608.74 52,608.74 Other financial liabilities (Current and Non-current) 8,549.34 606.56 - 9,155.90 9,155.90
61,610.66 2,411.26 510.06 64,531.98 64,219.51

247
Consolidated
Notes to the Consolidated financial statements for the year ended 31 March, 2019All amounts are in ` lakhs unless otherwise stated
40: Related party transactions Details of transactions between the Group and other related party are disclosed below.
1. Holding company
Name of holding Country HoldingAs at
31 March, 2019As at
31 March, 2018Tata Chemicals Ltd. India 50.06% 50.06%
2. List of Subsidiaries
Name of subsidiaries Country HoldingAs at
31 March, 2019As at
31 March, 2018Direct
Rallis Chemistry Exports Ltd.* India - 100.00%
Metahelix Life Science Ltd. India 100.00% 100.00%
Zero Waste Agro Organics Ltd. India 100.00% 100.00%
Indirect
PT. Metahelix Lifesciences Indonesia Indonesia 65.77% 65.77%
* During the year ended 31 March, 2019, Rallis Chemistry Exports Ltd. has made an application to the Registrar of Companies for removal of its name from the Register of Companies, hence investment has been written off from books of accounts. However, it is continue to be subsidiary of the Group till the time of removal of its name from Register of Companies.
3. Other Related Parties
Rallis India Limited Provident Fund
Rallis India Limited Management Staff Gratuity Fund
Rallis India Limited Senior Assistants Super Annuation Scheme
Rallis Executive Staff Super Annuation Fund
Rallis India Limited Non-Management Staff Gratuity Fund
4. Key Management Personnel
Mr. V. Shankar, Managing Director and CEO (upto 31 March, 2019)
Mr. R. Mukundan, Managing Director and CEO (w.e.f 3 December, 2018 till 31 March, 2019
5. Promoter Group
Tata Sons Private Limited
6. List of subsidiaries of Tata Sons Private Limited
Tata Africa Services (Nigeria) Ltd.
Infiniti Retail Ltd.
Tata AIG General Insurance Co. Ltd.
Tata Consultancy Services Ltd.
Ecofirst Services Ltd.

248 | 71st Annual Report 2018-19
Rallis India Limited Financial Statements
Notes to the Consolidated financial statements for the year ended 31 March, 2019All amounts are in ` lakhs unless otherwise stated
Advinus Therapeutics Ltd.
TC Travels & Services Ltd.
Tata Teleservices Limited
Tata Capital Financial Services Ltd.
TASEC Limited
Tata Strategic Management Group (Division of Tata Industries Limited)
Impetis Biosciences Limited
Ewart Investments Limited
Tata Consulting Engineers Ltd.
7. Trading transactions During the year, Group entered into following trading transactions with related parties:
Particulars Sales of goods Purchases of goodsFor the year ended
31 March, 2019For the year ended
31 March, 2018For the year ended
31 March, 2019For the year ended
31 March, 2018Holding Company Tata Chemicals Ltd.* - (401.64) 1,120.57 636.99 Subsidiary of Tata Sons Private Ltd. Tata Africa Services (Nigeria) Ltd. - 478.29 - - Infiniti Retail Ltd. - - 5.33 -
* negative figure indicates net sales return
Sale of goods to related parties were made at the Group’s usual list prices, less average discounts. Purchases were made at market price discounted to reflect the quantity of goods purchased and the relationship between the parties.
8. Service transactions
Particulars Services rendered Services receivedFor the year ended
31 March, 2019For the year ended
31 March, 2018For the year ended
31 March, 2019For the year ended
31 March, 2018Holding Company Tata Chemical Ltd. 49.26 74.19 0.35 0.89 Investor of Holding Company Tata Sons Private Ltd. - - 270.10 229.71 Subsidiaries Tata Sons Private Ltd. Tata AIG General Insurance Co. Ltd - - 17.84 19.22 Tata Consultancy Services Ltd. - - 96.76 314.56 Ecofirst Services Limited - - 4.30 4.93 Advinus Therapeutics Ltd* - 6.93 - 20.58 TC Travels & Services Ltd - - - 0.12 Tata Teleservices Limited - - 11.23 14.06 Tata Capital Financial Services Ltd. - - - 1.58 Tata Africa Services (Nigeria) Limited - - - 0.26 TASEC Limited - - 11.33 - Tata Strategic Management Group
(Division of Tata Industries Limited) - - 89.54 -
* Advinus Therapeutics Ltd cease to be related party from 5 October, 2017
Services were received at market price and any discount to reflect the relationship between the parties.

249
Consolidated
Notes to the Consolidated financial statements for the year ended 31 March, 2019All amounts are in ` lakhs unless otherwise stated
9. Investment transactionsParticulars Investment made Investment sold
For the year ended 31 March, 2019
For the year ended 31 March, 2018
For the year ended 31 March, 2019
For the year ended 31 March, 2018
Impetis Biosciences Limited (w.e.f. 05.10.2017) - 337.63 - - Advinus Therapeutics Ltd. - - - 1,828.60 Rallis Chemistry Exports Ltd. 19.60 - - -
10. Other -Dividend paymentsParticulars For the year ended
31 March, 2019For the year ended
31 March, 2018Holding Company Tata Chemicals Ltd. 2,433.54 3,650.31 Subsidiaries of Tata Sons Private Ltd. Ewart Investments Ltd. 1.88 2.81
11. Contributions to employee benefit trustsParticulars For the year ended
31 March, 2019For the year ended
31 March, 2018Contributions to employee benefit trusts 1,093.94 781.13
The following balances were outstanding at the end of the reporting period:-Particulars Amounts owed by related parties Amounts owed to related parties
As at 31 March, 2019
As at 31 March, 2018
As at 31 March, 2019
As at 31 March, 2018
Holding Company Tata Chemical Ltd. 49.26 - 70.60 17.79 Subsidiaries Tata Sons Private Ltd. Tata AIG General Insurance Co. Ltd. 0.70 0.44 - - Tata Consultancy Services Ltd. - - - 6.67 Tata Strategic Management Group
(Division of Tata Industries Limited) - - 59.24 -
Tata Consulting Engineers Ltd. 11.79 - - - Tata Teleservices (Maharashtra) Limited - - 0.02 0.24
The amounts outstanding are unsecured and will be settled in cash. No guarantees have been given or taken during the year except as below. No expense has been recognised in the current or prior years for bad and doubtful debts in respect of the amounts owed by related parties.
The Group has issued a corporate guarantee to debenture trustee in respect of issuance of debentures of ` 27,000.00 lakhs by Advinus Therapeutics Ltd. (Advinus), to the extent of 16.89% of the total subscription of debentures issued by Advinus. Corporate guarnatee had been released during the previous year on 5 October, 2017. The Group’s maximum exposure in this respect is of ` Nil as at 31 March, 2019 (31 March, 2018: ` Nil).
12.Compensation of key management personnelThe remuneration of key management personnel during the year was as follows:Particulars For the year ended
31 March, 2019For the year ended
31 March, 2018Short term benefits 528.90 535.96 Post-Employment benefits ( PF + Superannuation) 28.11 25.68
The remuneration of key management personnel is determined by the remuneration committee having regard to the performance of individuals and market trends. It is exclusive of gratuity and compensated absences.

250 | 71st Annual Report 2018-19
Rallis India Limited Financial Statements
Notes to the Consolidated financial statements for the year ended 31 March, 2019All amounts are in ` lakhs unless otherwise stated
41: Contingent liabilities The Group is involved in a number of appellate, judicial and arbitration proceedings (including those described below)
concerning matters arising in the course of conduct of the Group’s businesses. Some of these proceedings in respect of matters under litigation are in early stages, and in some other cases, the claims are indeterminate. A summary of claims asserted on the Group in respect of these cases have been summarised below.
a. Guarantees
Gurantees issued by bank on behalf of the Group as on 31 March, 2019 is ₹ 161.09 lakhs (31 March, 2018 ₹ 273.40 lakhs) these are covered by the charge created in favour of the said subsidiary’s bankers by way of hypothication of stock and debtors.
b. Tax contingencies
Amounts in respect of claims asserted by various revenue authorities on the Group, in respect of taxes, which are in dispute, have been tabulated below:
Nature of tax As at 31 March, 2019
As at 31 March, 2018
Sales tax 1,313.56 1,372.84 Excise duty 515.35 525.70 Customs duty 144.10 144.10 Income tax 12,123.24 9,411.76 Service tax 61.01 60.26
The management believes that the claims made are untenable and is contesting them. As of the reporting date, the management is unable to determine the ultimate outcome of above matters. However, in the event the revenue authorities succeed with enforcement of their assessments, the Group may be required to pay some or all of the asserted claims and the consequential interest and penalties, which would reduce net income and could have a material adverse effect on net income in the respective reported period.
c. Amount in respect of other claims
Nature of claim For the year ended 31 March, 2019
For the year ended 31 March, 2018
Matters relating to employee benefits 94.26 103.11 Others (claims related to contractual disputes) 486.53 500.82
Management is generally unable to reasonably estimate a range of possible loss for proceedings or disputes other than those included in the estimate above, including where:
(i) plaintiffs / parties have not claimed an amount of money damages, unless management can otherwise determine an appropriate amount;
(ii) the proceedings are in early stages;
(iii) there is uncertainty as to the outcome of pending appeals or motions or negotiations;
(iv) there are significant factual issues to be resolved; and/or
(v) there are novel legal issues presented.
However, in respect of the above matters, management does not believe, based on currently available information, that the outcomes of the litigation, will have a material adverse effect on the Group’s financial condition, though the outcomes

251
Consolidated
Notes to the Consolidated financial statements for the year ended 31 March, 2019All amounts are in ` lakhs unless otherwise stated
could be material to the Group’s operating results for any particular period, depending, in part, upon the operating results for such period.
d. The Hon’ble Supreme Court of India (“SC”) by their order dated February 28, 2019, in the case of Surya Roshani Limited & others v/s EPFO, set out the principles based on which allowances paid to the employees should be identified for inclusion in basic wages for the purposes of computation of Provident Fund contribution. Subsequently, a review petition against this decision has been filed and is pending before the SC for disposal. In view of the management, the liability for the period from date of the SC order to 31 March 2019 is not significant and has been provided in the books of account. Further, pending decision on the subject review petition and directions from the EPFO, the impact for the past period, if any, is not ascertainable and consequently no effect has been given in the accounts.
42: Commitments(i) Estimated amount of contract with minimum commitment for plant activity ` 2317.50 lakhs (31 March, 2018 ` 3,399 lakhs).
(ii) Estimated amount of contracts remaining to be executed on capital account of property, plant and equipment is ₹ 1512.42 lakhs as at 31 March, 2019 (31 March, 2018: ₹ 525.94 lakhs) and Intangible assets is ₹ 6.41 lakhs as at 31 March, 2019 (31 March, 2018: ₹ 89.05 lakhs) against which advances paid aggregate ₹ 84.07 lakhs as at 31 March, 2019 (31 March, 2018: ₹ 53.50 lakhs).
(iii) Capital commitment towards investment in PT. Metahelix Lifesciences Indonesia ₹ Nil (31 March, 2018 ₹ 119.76 lakhs).
(iv) For lease commitments refer note no 37.
43: Research and development expenditure The Group has incurred the following expenses on research and development activity:
Particulars (Refer footnote) For the year ended 31 March, 2019
For the year ended 31 March, 2018
On property, plant and equipment 156.08 91.65 On items which have been expensed during the year - Materials 157.85 163.79 - Employee benefits expense 1,624.06 1,701.27 - Professional fees 274.90 244.53 - Consumables 128.44 125.94 - Finance costs 0.57 1.05 - Travelling expenses 94.78 108.75 - Rent 40.60 38.28 - Depreciation and amortisation expense 293.12 400.71 - Others 588.39 379.67 Expenses - External agency 19.38 20.85 Total 3,378.17 3,276.49
During the year, the Group has also incurred ₹ 4.60 lakhs (31 March, 2018 ₹ 43.58 lakhs) towards capital research and development expenditure which is included under tangible assets under development. The total amount included in tangible assets under development as at 31 March, 2019 is ₹ 1,287.69 lakhs (31 March, 2018 ₹ 1,234.39 lakhs).
footnote:
The above figures include the amounts based on separate accounts for the Research and Developments (“”R&D””) Centre recognised by the Department of Scientific & Industrial Research (“”DSIR””), Ministry of Science and Technology for in-house research (consonance with the DSIR guidelines for in-house R & D Centre will be evaluated at the time of filing the return with DSIR).

252 | 71st Annual Report 2018-19
Rallis India Limited Financial Statements
Notes to the Consolidated financial statements for the year ended 31 March, 2019All amounts are in ` lakhs unless otherwise stated
44: Other expenses include Auditors’ Remuneration as under:
Particulars For the year ended 31 March, 2019
For the year ended 31 March, 2018
(a) To statutory auditors For audit 62.64 57.81 For limited review of quarterly results 15.00 15.00 For taxation matters 6.00 5.00 For other services 21.65 5.52 Reimbursement of expenses 7.85 2.18
Recoverable taxes which is being claimed for set-off as input credit has not been included in the expenditure above.
45: Disclosures as required under Schedule III to the Companies Act 2013 with respect to consolidated financial statements.
a ) As at and for the year ended 31 March, 2019
Name of the entity in the Group As at 31 March, 2019
For the year ended 31 March, 2019
For the year ended 31 March, 2019
For the year ended 31 March, 2019
Net assets* Share in profit or loss Share in other comprehensive income
Share in total comprehensive income
As % of consolidated
net assets
Amount As % of consolidated profit or loss
Amount As % of consolidated
other comprehensive
income
Amount As % of consolidated
total comprehensive
income
Amount
Parent
Rallis India Ltd. 96.94% 1,24,835.73 83.33% 12,897.83 57.92% (85.72) 83.57% 12,812.11
Subsidiaries ( Group’s share)
Indian
Metahelix Life Sciences Ltd. 10.24% 13,186.75 15.42% 2,386.38 38.79% (57.41) 15.19% 2,328.97
Zero Waste Agro Organics Ltd. 1.39% 1,785.65 1.09% 168.21 1.48% (2.19) 1.08% 166.02
Rallis Chemistry Exports Ltd.# 0.00% (0.00) -0.01% (2.14) - - -0.01% (2.14)
Foreign
PT. Metahelix Lifesciences Indonesia 0.14% 184.18 -0.39% (60.06) - - -0.39% (60.06)
Total Eliminations/Adjustments -8.70% (11,202.19) 0.57% 88.17 - - 0.58% 88.17
Exchange differences on translation of foreign operations
-0.01% (13.22) - - 1.82% (2.69) -0.02% (2.69)
Total 100.00% 1,28,776.90 100.00% 15,478.39 100.00% (148.01) 100.00% 15,330.38

253
Consolidated
Notes to the Consolidated financial statements for the year ended 31 March, 2019All amounts are in ` lakhs unless otherwise stated
b) As at and for the year ended 31 March, 2018
Name of the entity in the Group As at 31 March, 2018
For the year ended 31 March, 2018
For the year ended 31 March, 2018
For the year ended 31 March, 2018
Net assets* Share in profit or loss Share in other comprehensive income
Share in total comprehensive income
As % of consolidated
net assets
Amount As % of consolidated profit or loss
Amount As % of consolidated
other comprehensive
income
Amount As % of consolidated
total comprehensive
income
Amount
Parent
Rallis India Ltd. 98.92% 1,17,884.68 84.71% 14,148.59 48.75% (15.85) 84.78% 14,132.74
Subsidiaries ( Group’s share)
Indian
Metahelix Life Sciences Ltd. 9.19% 10,957.24 14.34% 2,395.59 20.40% (6.63) 14.33% 2,388.96
Zero Waste Agro Organics Ltd. 1.36% 1,619.62 1.16% 193.63 -1.54% 0.50 1.16% 194.13
Rallis Chemistry Exports Ltd.# -0.01% (17.46) 0.00% 0.52 - - 0.00% 0.52
Foreign
PT. Metahelix Lifesciences Indonesia (incorporated in the year 2016-17)
0.09% 110.63 -0.36% (59.53) - - -0.36% (59.53)
Total Eliminations/Adjustments -9.55% (11,376.19) 0.14% 22.89 - - 0.14% 22.89
Exchange differences on translation of foreign operations
-0.01% (10.53) - - 32.39% (10.53) -0.06% (10.53)
Total 100.00% 1,19,167.99 100.00% 16,701.69 100.00% (32.51) 100.00% 16,669.18
* Net assets = total assets minus total liabilities
# less than 0.01%
46: Disclosure pursuant to Section 186 of the Companies Act, 2013(a) Details of investment made:
Entity Financial year Opening Purchase of Investment
Sale of Investment Closing
No. of Shares
Amount No. of Shares
Amount No. of Shares
Amount No. of Shares
Amount
Advinus Therapeutics Ltd. Year ended 31 March, 2018
1,82,86,000 1,828.60 - - 1,82,86,000 1,828.60 - -
Impetis Biosciences Limited Year ended 31 March, 2018
- - 5,68,414 337.64 - - 5,68,414 337.64
Rallis Chemistry Exports Limited* Year ended 31 March, 2019
50,000 5.00 1,96,000 19.60 - - - -
* During the year ended 31 March, 2019, the Company has made an application to the Registrar of Companies for removal of its name from the Register of Companies, hence investment has been written off from books of accounts.
(b) Details of guarantee given:
Entity Financial year Opening Guarantee given Guarantee revoked ClosingAdvinus Therapeutics Ltd. Year ended
31 March, 2018 4,560.30 - 4,560.30 -

254 | 71st Annual Report 2018-19
Rallis India Limited Financial Statements
47: Dislosure under Ind AS 115 - Revenue from contracts with customersThe Company is engaged into manufacturing of agri inputs. There is no impact on the Company’s revenue on applying Ind AS 115 from the contract with customers.
Disaggregation of revenue from contracts with customers
Particulars 2018-19 2017-18Agri Inputs Others Total Agri Inputs Others Total
1) Revenue from contracts with customers:
Sale of products (Transferred at point in time)
Manufacturing
India 1,16,197.12 - 1,16,197.12 1,14,038.55 - 1,14,038.55
Asia (Other than India) 37,326.49 - 37,326.49 33,589.72 - 33,589.72
North America 8,963.49 3,814.40 12,777.89 1,776.09 3,496.08 5,272.17
South America 10,764.80 - 10,764.80 4,470.47 - 4,470.47
Africa 2,248.01 - 2,248.01 2,882.77 - 2,882.77
Europe 35.21 - 35.21 482.48 - 482.48
Australia 1,086.01 - 1,086.01 919.26 - 919.26
Total (A) 1,76,621.14 3,814.40 1,80,435.54 1,58,159.34 3,496.08 1,61,655.42
Trading
India 16,237.83 - 16,237.83 17,356.08 - 17,356.08
Asia (Other than India) 105.60 - 105.60 63.36 - 63.36
Africa 795.87 - 795.87 131.51 - 131.51
Total (B) 17,139.31 - 17,139.31 17,550.95 - 17,550.95
Total (A) + (B) 1,93,760.44 3,814.40 1,97,574.85 1,75,710.29 3,496.08 1,79,206.37
2) Sale of services 55.35 - 55.35 53.24 - 53.24
3) Other operating revenue
Sale of scrap 332.63 - 332.63 299.29 - 299.29
Export benefits* - - - 883.71 - 883.71
Liabilities written back 390.17 - 390.17 230.29 - 230.29
Royalty Income 42.89 - 42.89 173.43 - 173.43
765.69 - 765.69 1,586.72 - 1,586.72
Total Revenue 1,94,581.48 3,814.40 1,98,395.89 1,77,350.25 3,496.08 1,80,846.33
* Consequent to clarifications published by the Institute of Chartered Accountants of India (ICAI), the amount of export incentive has been recognised as “Other Income” with effect from July 2018. In earlier periods these amounts were reported under “Other Operating Revenue” in the Statement of Profit and Loss.
Notes to the Consolidated financial statements for the year ended 31 March, 2019All amounts are in ` lakhs unless otherwise stated
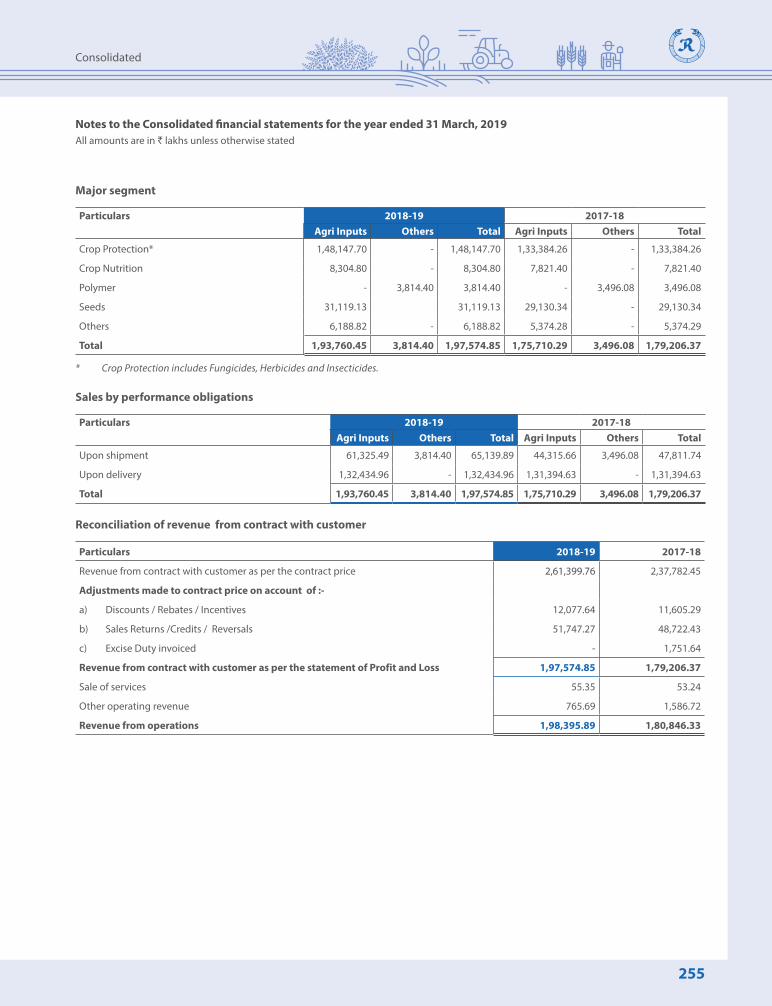
255
Consolidated
Major segment
Particulars 2018-19 2017-18Agri Inputs Others Total Agri Inputs Others Total
Crop Protection* 1,48,147.70 - 1,48,147.70 1,33,384.26 - 1,33,384.26
Crop Nutrition 8,304.80 - 8,304.80 7,821.40 - 7,821.40
Polymer - 3,814.40 3,814.40 - 3,496.08 3,496.08
Seeds 31,119.13 31,119.13 29,130.34 - 29,130.34
Others 6,188.82 - 6,188.82 5,374.28 - 5,374.29
Total 1,93,760.45 3,814.40 1,97,574.85 1,75,710.29 3,496.08 1,79,206.37
* Crop Protection includes Fungicides, Herbicides and Insecticides.
Sales by performance obligations
Particulars 2018-19 2017-18Agri Inputs Others Total Agri Inputs Others Total
Upon shipment 61,325.49 3,814.40 65,139.89 44,315.66 3,496.08 47,811.74
Upon delivery 1,32,434.96 - 1,32,434.96 1,31,394.63 - 1,31,394.63
Total 1,93,760.45 3,814.40 1,97,574.85 1,75,710.29 3,496.08 1,79,206.37
Reconciliation of revenue from contract with customer
Particulars 2018-19 2017-18
Revenue from contract with customer as per the contract price 2,61,399.76 2,37,782.45
Adjustments made to contract price on account of :-
a) Discounts / Rebates / Incentives 12,077.64 11,605.29
b) Sales Returns /Credits / Reversals 51,747.27 48,722.43
c) Excise Duty invoiced - 1,751.64
Revenue from contract with customer as per the statement of Profit and Loss 1,97,574.85 1,79,206.37
Sale of services 55.35 53.24
Other operating revenue 765.69 1,586.72
Revenue from operations 1,98,395.89 1,80,846.33
Notes to the Consolidated financial statements for the year ended 31 March, 2019All amounts are in ` lakhs unless otherwise stated

256 | 71st Annual Report 2018-19
Rallis India Limited Financial Statements
As per our report of even date attached
For B S R & Co. LLPChartered Accountants Firm’s Registration No. 101248W/W-100022
For and on behalf of the Board of Directors of Rallis India Limited PRAKASH R. RASTOGI(DIN: 00110862)
BHASKAR BHAT(DIN: 00148778)
Chairman
R. MUKUNDAN(DIN: 00778253)
SANJIV LAL (DIN: 08376952)
Managing Director & CEO
PUNITA KUMAR-SINHA (DIN: 05229262)
ASHISH MEHTA(M. No. 53039)
Chief Financial Officer
ANIRUDDHA GODBOLE PartnerMembership No. 105149
C.V. NATRAJ (DIN: 07132764)
DirectorsYASHASWIN SHETH (M. No. A15388)
Company Secretary
PADMINI KHARE KAICKER (DIN: 00296388)
Mumbai, 25 April, 2019 JOHN MULHALL (DIN: 08101474)
Mumbai, 25 April, 2019
48: Consequent to the issuance of “Guidance Note on Division II -Ind AS Schedule III to the Companies Act ,2013 “, certain items of consolidated financial statement have been regrouped/reclassified.
49: The Holding Company made a contribution to an electoral trust of ` 500 lakhs (31st March, 2018 ` Nil) which is included in other expenses.
50: Subsequent event
The Board of Directors of the Holding Company at its meeting held on 25 April, 2019 has recommended a dividend of ̀ 2.50 per equity share (31 March, 2018 ` 2.50 per equity share), subject to shareholders approval at annual general meeting.
51: The MCA wide notification dated 11 October, 2018 has amended Schedule Ill to the Companies Act, 2013 in respect of certain disclosures. The Group has incorporated appropriate changes in the above results.
Notes to the Consolidated financial statements for the year ended 31 March, 2019All amounts are in ` lakhs unless otherwise stated

257
Form AOC-1
Form AOC-1
Statement Pursuant to first proviso to sub-section (3) of Section 129 of the Companies Act, 2013 read with Rule 5 of Companies (Accounts) Rules, 2014 in the prescribed Form AOC-1 containing salient features of the financial statement of subsidiaries/associate companies/joint ventures
Part “A”: Subsidiaries` in crores
Sl. No.
Particulars Name of the SubsidiaryMetahelix Life Sciences Ltd.
Zero Waste Agro Organics Ltd.
Rallis Chemistry Exports Ltd.
PT Metahelix Lifesciences Indonesia
1. Reporting period for the subsidiary concerned, if different from the holding company’s reporting period
NA NA NA NA
2. Reporting currency and Exchange rate as on the last date of the relevant Financial year in the case of foreign subsidiaries
Reporting Currency: INR Exchange Rate: 1
Reporting Currency: INR Exchange Rate: 1
Reporting Currency: INR Exchange Rate: 1
Reporting Currency: IDR Exchange Rate: 0.004861
3. Share Capital 0.11 0.07 0.25 6.834. Reserves & Surplus 131.54 17.78 (0.25) (3.32)5. Total Assets 423.05 19.80 - 3.826. Total Liabilities (excluding Share
Capital and Reserves & Surplus)291.40 1.94 - 0.31
7. Investments 30.77 15.22 - -8. Turnover 336.21 10.05 - 1.239. Profit before taxation 28.02 2.34 (0.02) (1.10)
10. Provision for taxation 5.37 0.66 - 0.0811. Profit after taxation 22.65 1.68 (0.02) (1.18)12. Proposed Dividend - - - -13. % of shareholding 100.00% 100.00% 100.00% 65.77%
Notes:
1. Rallis Chemistry Exports Ltd. is yet to commence commercial activities and currently is not operational.
2. Indian rupee equivalents of the figures given in foreign currencies in the accounts of the subsidiary Companies, are based on the exchange rates as on 31st March, 2019.
3. Reporting period of the above subsidiaries is the same as that of the Company.
4. Part B of the Annexure is not applicable as there are no associate companies/ joint ventures of the Company as on 31st March, 2019.
For and on behalf of the Board of Directors
PRAKASH R. RASTOGI(DIN: 00110862)
BHASKAR BHAT(DIN: 00148778)
Chairman
R. MUKUNDAN(DIN: 00778253)
SANJIV LAL (DIN: 08376952)
Managing Director & CEO
PUNITA KUMAR-SINHA (DIN: 05229262)
ASHISH MEHTA(M. No. 53039)
Chief Financial Officer
C.V. NATRAJ (DIN: 07132764)
DirectorsYASHASWIN SHETH (M. No. A15388)
Company Secretary
PADMINI KHARE KAICKER (DIN: 00296388)
JOHN MULHALL (DIN: 08101474)
Mumbai, 25 April, 2019

258 | 71st Annual Report 2018-19
NoticeRallis India Limited
Notice
NOTICE is hereby given that the 71st Annual General Meeting of Rallis India Limited will be held at Walchand Hirachand Hall, 4th Floor, Indian Merchants’ Chamber Building, IMC Marg, Churchgate, Mumbai - 400 020 on Friday, 28th June, 2019 at 3.00 p.m. to transact the following business:
ORDINARY BUSINESS1. To receive, consider and adopt the Audited Standalone
Financial Statements of the Company for the financial year ended 31st March, 2019 together with the Reports of the Board of Directors and Auditors thereon.
2. To receive, consider and adopt the Audited Consolidated Financial Statements of the Company for the financial year ended 31st March, 2019 together with the Report of the Auditors thereon.
3. To declare dividend for the financial year 2018-19 on Equity Shares.
4. To appoint a Director in place of Mr. Bhaskar Bhat (DIN: 00148778), who retires by rotation and being eligible, offers himself for re-appointment.
SPECIAL BUSINESS5. Approval for appointment of Mr. R. Mukundan
(DIN: 00778253) as Managing Director & CEO for the term ending 31st March, 2019
To consider and, if thought fit, to pass the following resolution as an Ordinary Resolution:
“RESOLVED THAT pursuant to the provisions of Section 196 read with Schedule V and other applicable provisions of the Companies Act, 2013 [including any statutory modification(s) or re-enactment(s) thereof ], the Companies (Appointment and Remuneration of Managerial Personnel) Rules, 2014, as amended from time to time and such other approvals, permissions and sanctions as may be required, consent of the Company be and is hereby accorded to the appointment of Mr. R. Mukundan (DIN: 00778253) as Managing Director & CEO of the Company for a period commencing from 3rd December, 2018 upto 31st March, 2019, upon the terms and conditions as set out in the Explanatory Statement annexed to this Notice, with liberty to the Board of Directors (hereinafter referred to as ‘the Board’ which term shall be deemed to include the Committee
of the Board) to alter and vary the terms and conditions of the said appointment in such manner as may be agreed to between the Board and Mr. Mukundan.
RESOLVED FURTHER THAT the Board be and is hereby authorised to take all such steps as may be necessary, proper and expedient and to do any acts, deeds, matters and things to give effect to this Resolution.”
6. Appointment of Mr. Sanjiv Lal (DIN: 08376952) as a Director of the Company
To consider and, if thought fit, to pass the following resolution as an Ordinary Resolution:
“RESOLVED THAT Mr. Sanjiv Lal (DIN: 08376952) who was appointed as an Additional Director of the Company with effect from 1st April, 2019 by the Board of Directors and who holds office upto the date of the forthcoming Annual General Meeting of the Company in terms of Section 161(1) of the Companies Act, 2013 (‘the Act’) [including any statutory modification(s) or re-enactment(s) thereof ] and Article 116 of the Articles of Association of the Company, but who is eligible for appointment and in respect of whom the Company has received a notice in writing from a Member under Section 160(1) of the Act proposing his candidature for the office of a Director, be and is hereby appointed as a Director of the Company.”
7. Appointment of Mr. Sanjiv Lal (DIN: 08376952) as Managing Director & CEO of the Company
To consider and, if thought fit, to pass the following resolution as an Ordinary Resolution:
“RESOLVED THAT pursuant to the provisions of Sections 196, 197 and 198 read with Schedule V and other applicable provisions of the Companies Act, 2013 [including any statutory modification(s) or re-enactment(s) thereof ], the Companies (Appointment and Remuneration of Managerial Personnel) Rules, 2014, as amended from time to time and such other approvals, permissions and sanctions as may be required, consent of the Company be and is hereby accorded to the appointment and terms of remuneration of Mr. Sanjiv Lal (DIN: 08376952) as Managing Director & CEO of the Company for a period
259
of 5 years commencing from 1st April, 2019 upto 31st March, 2024, upon the terms and conditions as set out in the Explanatory Statement annexed to this Notice (including the remuneration to be paid in the event of loss or inadequacy of profits in any financial year during the aforesaid period), with liberty to the Board of Directors (hereinafter referred to as ‘the Board’ which term shall be deemed to include the Committee of the Board) to alter and vary the terms and conditions of the said appointment and remuneration in such manner as may be agreed to between the Board and Mr. Lal.
RESOLVED FURTHER THAT the Board be and is hereby authorised to take all such steps as may be necessary, proper and expedient and to do any acts, deeds, matters and things to give effect to this Resolution.”
8. Re-appointment of Dr. Punita Kumar-Sinha (DIN: 05229262) as an Independent Director of the Company
To consider and, if thought fit, to pass the following resolution as a Special Resolution:
“RESOLVED THAT pursuant to the provisions of Sections 149 and 152 of the Companies Act, 2013 (‘the Act’) read with Schedule IV of the Act, the Companies (Appointment and Qualifications of Directors) Rules, 2014 and other applicable provisions of the Act [including any statutory modification(s) or re-enactment(s) thereof ] and Regulation 17 and other applicable provisions of the SEBI (Listing Obligations and Disclosure Requirements) Regulations, 2015 (‘Listing Regulations’), as amended from time to time, Dr. Punita Kumar-Sinha (DIN: 05229262), who was appointed as an Independent Director of the Company at the 66th Annual General Meeting of the Company and holds office upto 29th June, 2019 and who being eligible for re-appointment as an Independent Director has given her consent along with a declaration that she meets the criteria for independence under Section 149(6) of the Act and Regulation 16(1)(b) of the Listing Regulations and in respect of whom the Company has received a Notice in writing from a Member under Section 160(1) of the Act proposing her candidature for the office of Director, be and is hereby re-appointed as an Independent Director of the Company, not liable to retire by rotation, to hold office for a second term commencing from 30th June, 2019 upto 25th March, 2024.”
9. Ratification of Cost Auditors’ remuneration
To consider and, if thought fit, to pass the following resolution as an Ordinary Resolution:
“ RESOLVED THAT pursuant to Section 148(3) and other applicable provisions, if any, of the Companies Act, 2013 [including any statutory modification(s) or re-enactment(s) thereof for the time being in force] and the Companies (Audit and Auditors) Rules, 2014, as amended from time to time, the Company hereby ratifies the remuneration of ₹ 5 lakhs plus applicable taxes and out-of-pocket expenses incurred in connection with the audit, payable to D. C. Dave & Co. (Firm Registration No. 000611), who are appointed as Cost Auditors of the Company to conduct Cost Audits relating to Insecticides (Liquid, Solid and Technical Grade), Fertilizers, Chemicals (Plastics and Polymers) and Drugs and Pharmaceuticals of the Company for the financial year ending 31st March, 2020.
RESOLVED FURTHER THAT the Board of Directors of the Company (including any Committee thereof ) be and is hereby authorized to do all acts and take all such steps as may be necessary, proper or expedient to give effect to this Resolution.”
Notes:
1. The Explanatory Statement pursuant to Section 102 of the Companies Act, 2013 (‘the Act’) in respect of the business under Item Nos. 5 to 9 above is annexed hereto. The relevant details of the Directors seeking re-appointment/appointment under Item Nos. 4 to 8 pursuant to Regulations 26(4) and 36(3) of the Securities and Exchange Board of India (Listing Obligations and Disclosure Requirements) Regulations, 2015 (‘Listing Regulations’) and as required under Secretarial Standard – 2 on General Meetings issued by the Institute of Company Secretaries of India, are annexed hereto.
2. A MEMBER ENTITLED TO ATTEND AND VOTE AT THE MEETING IS ENTITLED TO APPOINT A PROXY TO ATTEND AND VOTE INSTEAD OF HIM AND A PROXY NEED NOT BE A MEMBER OF THE COMPANY. Proxies, in order to be effective, must be received at the Company’s Registered Office not less than 48 hours before the Meeting. Proxies submitted on behalf of companies, societies, partnership firms, etc. must be supported by appropriate resolution/authority, as applicable, issued on behalf of the nominating organisation.

260 | 71st Annual Report 2018-19
NoticeRallis India Limited
Members are requested to note that a person can act as a proxy on behalf of members not exceeding 50 and holding in aggregate not more than 10% of the total share capital of the Company carrying voting rights. If a proxy is proposed to be appointed by a Member holding more than 10% of the total share capital of the Company carrying voting rights, then such proxy shall not act as a proxy for any other person or Member.
3. Book Closure and Dividend:
(a) The Register of Members and the Share Transfer Books of the Company will be closed from Friday, 21st June, 2019 to Friday, 28th June, 2019 (both days inclusive).
(b) If dividend on Equity Shares, as recommended by the Board, is approved at the Annual General Meeting (‘AGM’), it will be paid on or after 2nd July, 2019 as under:
(i) To all Beneficial Owners in respect of shares held in electronic form, as per details furnished by the Depositories for this purpose as at the end of the business hours on 20th June, 2019.
(ii) To all Members in respect of shares held in physical form, whose names are on the Company’s Register of Members after giving effect to valid transmission and transposition requests lodged with the Company before the end of business hours on 20th June, 2019.
4. Payment of dividend through electronic means:
(a) To avoid loss of dividend warrants in transit and undue delay in receipt of dividend warrants, the Company provides the facility to the Members for remittance of dividend directly in their bank accounts through electronic means. The facility is available at all bank branches which have registered themselves as participating banks with National Payment Corporation of India and have joined the Core Banking System. Members holding shares in physical form and desirous of availing this facility are requested to provide their latest bank account details (Core Banking Solutions Enabled Account Number, 9 digit MICR and 11 digit IFS Code), along with their Folio Number, to the Company’s Share Registrar and Transfer Agent, TSR Darashaw Limited (‘TSRDL’).
Members holding shares in electronic form are requested to provide these details to their respective Depository Participants.
(b) Members holding shares in electronic form are hereby informed that bank particulars registered against their respective depository accounts will be used by the Company for payment of dividend. The Company or TSRDL cannot act on any request received directly from the Members holding shares in electronic form for any change of bank particulars or bank mandates. Such changes are to be advised only to the respective Depository Participants of the Members.
5. The Securities and Exchange Board of India (‘SEBI’) has mandated the transfer of securities to be carried out only in dematerialised form (except in case of transmission or transposition of securities) effective from 1st April, 2019. Accordingly, requests for physical transfer of securities of listed entities shall not be processed from 1st April, 2019 onwards. In view of such amendment and in order to eliminate the risks associated with physical holding of shares, Members who are holding shares in physical form are hereby requested to dematerialise their holdings.
6. Members holding shares in physical form in identical order of names in more than one folio are requested to send to the Company or TSRDL, the details of such folios together with the share certificates for consolidating their holdings in one folio. A consolidated share certificate will be returned to such Members after making requisite changes thereon.
7. Members/proxyholders and authorised representatives are requested to bring to the Meeting, the duly filled in attendance slip(s) enclosed herewith. Corporate Members intending to send their authorised representatives to attend the Meeting pursuant to Section 113 of the Act are requested to send to the Company, a certified copy of the Board Resolution authorising their representative to attend and vote on their behalf at the Meeting. Members are requested to carry their copy of the Annual Report to the AGM. Copies of the Annual Report will not be distributed at the Meeting.
8. A route map giving directions to reach the venue of the 71st AGM is given at the end of the Notice.

261
9. In case of joint holders attending the AGM, only such joint holder who is higher in the order of names will be entitled to vote.
10. Members holding shares in physical form are requested to advise any change of address immediately to TSRDL. Members holding shares in electronic form must send the advice about change in address to their respective Depository Participant only and not to the Company or TSRDL.
11. Nomination Facility:
As per the provisions of Section 72 of the Act, facility for making nomination is available for Members in respect of shares held by them. Members holding shares in single name and who have not yet registered their nomination are requested to register the same by submitting form No. SH-13. If a Member desires to cancel the earlier nomination and record fresh nomination, he/she may submit the same in Form No. SH-14. These Forms can be downloaded from TSRDL’s website www.tsrdarashaw.com or from the Company’s website www.rallis.co.in under the “Investor Relations” section. Members holding shares in physical form are requested to submit the forms to TSRDL. Members holding shares in electronic form may obtain nomination forms from their respective Depository Participant.
12. Transfer to Investor Education and Protection Fund:
(a) Transfer of unclaimed dividend
Members are hereby informed that under the Act, the Company is required to transfer the dividend which remains unpaid or unclaimed for a period of seven consecutive years or more, to the credit of the Investor Education and Protection Fund (‘the IEPF’). Accordingly, Dividend of ` 19,82,954 (Final Dividend 2010-11, ` 10,34,462 and Interim Dividend 2011-12 ` 9,48,492) which remained unpaid or unclaimed was transferred to the IEPF Authority in the financial year 2018-19.
Members who have not yet encashed their dividend warrant(s) for the financial year ended 31st March, 2012 and for any subsequent financial year(s) are requested to make their claims to the Company or TSRDL without any delay, to avoid transfer of their dividend/shares to the Fund/IEPF Demat Account.
It may be noted that unclaimed dividend for the financial year (‘FY’) 2011-12 declared on 27th June, 2012 can be claimed by the Members by 28th July, 2019. Unclaimed Interim Dividend declared on 17th October, 2012 can be claimed by the Members by 17th November, 2019.
(b) Transfer of shares to IEPF
Pursuant to the provisions of Section 124 of the Act read with the Investor Education and Protection Fund Authority (Accounting, Audit, Transfer and Refund) Rules, 2016, as amended (‘IEPF Rules’), all the shares on which dividends remain unpaid or unclaimed for a period of seven consecutive years or more shall be transferred to the demat account of the IEPF Authority as notified by the Ministry of Corporate Affairs. Accordingly, the Company has transferred 64,378 Equity Shares of face value of ` 1 each to the demat account of the IEPF Authority during FY 2018-19.
The Company had sent individual notice to all the Members whose shares were due to be transferred to the IEPF Authority and had also published newspaper advertisement in this regard. The details of such dividends/shares transferred to IEPF are uploaded on the website of the Company, www.rallis.co.in.
(c) Claim from IEPF Authority
Members/Claimants whose shares, unclaimed dividend, sale proceeds of fractional shares, etc. have been transferred to the IEPF Demat Account or the Fund, as the case may be, may claim the shares or apply for refund by making an application to the IEPF Authority in e-Form IEPF- 5 (available on www.iepf.gov.in) along with requisite fee as decided by the IEPF Authority from time to time. The Member/Claimants can file only one consolidated claim in a financial year as per the IEPF Rules. No claim shall lie against the Company in respect of the dividend/shares so transferred.
(d) Details of unclaimed dividend on the website
In order to help Members ascertain the status of unclaimed dividends, the Company has uploaded the information in respect of unclaimed dividends for the financial year ended 31st March, 2012 and subsequent years as on the date of the previous AGM i.e. 2nd July, 2018 (70th AGM) on the website of Investor Education and Protection Fund, at www.iepf.gov.in and under “Investor Relations” section on the website of the Company, www.rallis.co.in.

262 | 71st Annual Report 2018-19
NoticeRallis India Limited
13. Process and Manner for Members opting to vote through electronic means:
I. In compliance with the provisions of Section 108 of the Act, Rule 20 of the Companies (Management and Administration) Rules, 2014 as amended from time to time and Regulation 44 of the Listing Regulations, the Members are provided with the facility to exercise their right to vote electronically, through the e-voting services provided by the National Securities Depository Limited (‘NSDL’), i.e. facility of casting the votes by the Members using an electronic voting system from a place other than the venue of the AGM (remote e-voting) on all the resolutions set forth in this Notice. Instructions for remote e-voting are given herein below.
II. The facility for voting through electronic voting system or by Ballot Paper shall also be made available at the Meeting and Members attending the Meeting who have not already cast their vote by remote e-voting shall be able to exercise their right at the meeting.
III. The remote e-voting period commences from Tuesday, 25th June, 2019 (9.00 am IST) and ends on Thursday, 27th June, 2019 (5.00 pm IST). During this period, Members of the Company, holding shares either in physical form or in dematerialised form, as on the cut-off date of Friday, 21st June, 2019, may cast their vote by remote e-voting. The remote e-Voting module shall be disabled by NSDL for voting thereafter. Once the vote on a resolution is cast by the Member, the Member shall not be allowed to change it subsequently. A person who is not a Member as on the cut-off date should treat this Notice for information purpose only. Members who have cast their vote by remote e-voting prior to the AGM are also eligible to attend the Meeting but shall not be entitled to cast their vote again.
IV. The process and manner for remote e-Voting are as under:
Step 1: Log-in to NSDL e-Voting system at https://www.evoting.nsdl.com.
Step 2: Cast your vote electronically on NSDL e-Voting system.
Details on Step 1 are mentioned below:
How to Log-in to NSDL e-Voting website?
1. Visit the e-Voting website of NSDL. Open web browser by typing the following URL: https://www.evoting.nsdl.com either on a personal computer or on a mobile.
2. Once the home page of e-Voting system is launched, click on the icon “Login” which is available under ‘Shareholders’ section.
3. A new screen will open. You will have to enter your User ID, your Password and a Verification Code as shown on the screen.
Alternatively, if you are registered for NSDL e-services i.e. IDEAS, you can log-in at https://eservices.nsdl.com with your existing IDEAS login. Once you log-in to NSDL e-services after using your log-in credentials, click on e-Voting and you can proceed to Step 2 i.e. Cast your vote electronically.
4. Your User ID details are given below :
Manner of holding shares i.e. Demat (NSDL or CDSL) or Physical
Your User ID is:
a) For Members who hold shares in demat account with NSDL.
8 Character DP ID followed by 8 Digit Client ID
For example, if your DP ID is IN300*** and Client ID is 12******, then your user ID is IN300***12******.
b) For Members who hold shares in demat account with CDSL.
16 Digit Beneficiary ID
For example, if your Beneficiary ID is 12**************, then your user ID is 12**************.
c) For Members holding shares in Physical Form.
EVEN Number followed by Folio Number registered with the Company
For example, if your folio number is 001*** and EVEN is 110701, then user ID is 110701001***.
5. Your password details are given below:
a) If you are already registered for e-Voting, then you can use your existing password to login and cast your vote.
b) If you are using NSDL e-Voting system for the first time, you will need to retrieve the ‘initial password’ which was communicated to you. Once you retrieve your ‘initial password’, you need to enter the same and the system will force you to change your password.
c) How to retrieve your ‘initial password’?
(i) If your email ID is registered in your demat account or with the Company, your ‘initial password’ is communicated to you on your

263
email ID. Trace the email sent to you from NSDL from your mailbox. Open the email and open the attachment i.e. a .pdf file. Open the .pdf file. The password to open the .pdf file is your 8 digit client ID for NSDL account, last 8 digits of client ID for CDSL account or folio number for shares held in physical form. The .pdf file contains your ‘User ID’ and your ‘initial password’.
(ii) If your email ID is not registered, your ‘initial password’ is communicated to you on your postal address.
6. If you are unable to retrieve or have not received the initial password or have forgotten your password:
a) Click on “Forgot User Details/Password?” (If you are holding shares in your demat account with NSDL or CDSL) option available on www.evoting.nsdl.com.
b) “Physical User Reset Password?” (If you are holding shares in physical mode) option available on www.evoting.nsdl.com.
c) If you are still unable to get the password by aforesaid two options, you can send a request at [email protected] mentioning your demat account number/folio number, your PAN, your name and your registered address.
d) Members can also use the OTP (One Time Password) based login for casting the votes on the e-Voting system of NSDL.
7. After entering your password, tick on Agree to “Terms and Conditions” by selecting on the check box.
8. Now, you will have to click on “Login” button.
9. After you click on the “Login” button, home page of e-Voting will open.
Details on Step 2 are given below:
How to cast your vote electronically on NSDL e-Voting system?
1. After successful login at Step 1, you will be able to see the home page of e-Voting. Click on e-Voting. Then, click on Active Voting Cycles.
2. After click on Active Voting Cycles, you will be able to see all the companies “EVEN” in which you are holding shares and whose voting cycle is in active status.
3. Select “EVEN” of the Company which is 110701.
4. Now you are ready for e-Voting as the voting page opens.
5. Cast your vote by selecting appropriate options i.e. assent or dissent, verify/modify the number of shares for which you wish to cast your vote and click on “Submit” and also “Confirm” when prompted.
6. Upon confirmation, the message “Vote cast successfully” will be displayed.
7. You can also take the printout of the votes cast by you by clicking on the “print” option on the confirmation page.
8. Once you confirm your vote on the resolution, you will not be allowed to modify your vote.
General Guidelines for Members
i. Institutional shareholders (i.e. other than individuals, HUF, NRIs, etc.) are required to send scanned copy (PDF/JPG Format) of the relevant Board Resolution/Authority letter etc. with attested specimen signature of the duly authorized signatory(ies) who are authorized to vote, to the Scrutinizer by e-mail to [email protected], with a copy marked to [email protected].
ii. It is strongly recommended not to share your password with any other person and take utmost care to keep your password confidential. Login to the e-voting website will be disabled upon five unsuccessful attempts to key in the correct password. In such an event, you will need to go through the “Forgot User Details/Password?” or “Physical User Reset Password?” option available on www.evoting.nsdl.com to reset the password.
iii. In case of any queries, you may refer the Frequently Asked Questions (‘FAQs’) for Members and e-voting user manual for Members available at the download section of www.evoting.nsdl.com or call on toll free no.: 1800-222-990 or send a request at [email protected].
264 | 71st Annual Report 2018-19
NoticeRallis India Limited
V. In order to address any grievances relating to e-voting, you may write or contact NSDL as under:
• Mr. Amit Vishal: +91 22 24994360 or [email protected]
• Ms. Pallavi Mhatre: +91 22 24994545 or [email protected]
• Mr. Pratik Bhatt: +91 22 24994738 or [email protected]
• Ms. Sarita Mote: +91 22 24994890 or [email protected]
VI. If you are already registered with NSDL for remote e-voting, then you can use your existing user ID and password/PIN for casting your vote.
VII. You can also update your mobile number and e-mail id in the user profile details of the folio which may be used for sending future communication(s).
General instructions/information for Members for voting on the resolutions:
(a) A Member can vote either by remote e-Voting or at the AGM. If a Member votes by both the modes, then the votes cast through remote e-Voting shall prevail and the votes cast at the AGM shall be considered invalid.
(b) The voting rights of the Members (for voting through remote e-Voting or by Ballot paper at the AGM) shall be in proportion to their share of the paid-up equity share capital of the Company as on 21st June, 2019 (‘Cut-Off Date’).
(c) Any person who acquires shares of the Company and becomes a Member of the Company after the despatch of the AGM Notice and holds shares as on the cut-off date, i.e. 21st June, 2019, may obtain the login Id and password by sending a request at [email protected]. However, if you are already registered with NSDL for remote e-voting, then you can use your existing user ID and password for casting your vote. If you have forgotten your password, you may reset your password by using “Forgot User Details/Password” option available on www.evoting.nsdl.com.
(d) Mr. N. L. Bhatia (Membership No. FCS 1176/ CP No. 422) or failing him, Mr. Bhaskar Upadhyay (Membership No. FCS 8663/ CP No. 9625) of N L Bhatia & Associates, Practicing Company Secretaries has been appointed by the Board of Directors of the Company as Scrutinizer for
scrutinizing the remote e-voting process as well as voting through electronic means or by Ballot paper at the AGM, in a fair and transparent manner.
(e) The Scrutinizer shall, immediately after the conclusion of voting at the AGM, first count the votes cast at the AGM, and thereafter unblock the votes cast through remote e-voting, in the presence of at least two (2) witnesses not in the employment of the Company.
(f ) The Scrutinizer will collate the votes cast at the AGM and votes downloaded from the e-voting system and make, not later than forty eight hours from the conclusion of the AGM, a consolidated Scrutinizer’s Report of the total votes cast in favour or against, if any, to the Chairman or a person authorized by him in writing, who shall countersign the same.
(g) The Chairman or the person authorized by him in writing shall forthwith on receipt of the consolidated Scrutinizer’s Report, declare the result of the voting. The result declared, along with the Scrutinizer’s Report, shall be placed on the Company’s website, www.rallis.co.in and on the website of NSDL, www.evoting.nsdl.com immediately after their declaration, and communicated to the Stock Exchanges where the Company’s shares are listed, viz. BSE Limited and the National Stock Exchange of India Limited.
(h) Subject to the receipt of requisite number of votes, the resolutions forming part of the AGM Notice shall be deemed to be passed on the date of the AGM, i.e. Friday, 28th June, 2019.
14. SEBl has mandated the submission of Permanent Account Number (‘PAN’) and bank account details by every participant in the securities market. Members holding shares in electronic form are requested to submit their PAN and bank account details to their respective Depository Participants. Members holding shares in physical form are requested to submit their PAN and bank account details to the Company or TSRDL.
15. Webcast Facility:
The Members are informed that the Company will be providing a facility to view the live streaming of the AGM Webcast on the NSDL website. You may access the same at https://www.evoting.nsdl.com by using your remote e-Voting credentials. The link will be available in shareholder login where the EVEN of the Company will be displayed.

265
The Webcast facility will be available from the commencement of the AGM on 28th June, 2019 from 3.00 pm onwards.
For any further clarifications in this regard, you may contact the undersigned or the following NSDL officials as under:
• Ms. Pallavi Mhatre at +91 22 2499 4545 or [email protected]
• Mr. Amit Vishal at +91 22 2499 4360 or [email protected]
16. Updation of Members’ Details:
The format of the Register of Members prescribed by the Ministry of Corporate Affairs under the Act requires the Company/Share and Transfer Agent to record additional details of Members, including their PAN details, email address, bank details for payment of dividend, etc. A form for capturing the additional details is appended at the end of this Annual Report.
Members holding shares in physical form are requested to submit the filled in form to the Company or TSRDL. Members holding shares in electronic form are requested to submit the details to their respective Depository Participants.
17. Electronic copy of the Annual Report for FY 2018-19 is being sent to all Members whose email addresses are registered with the Company/Depository Participants for communication purposes, unless any Member has requested for a hard copy of the same. For Members who have not registered their email addresses, physical copies of the Annual Report for FY 2018-19 are being sent in the permitted mode.
18. To support the “Green Initiative”, Members who have not registered their email addresses are requested to register the same with TSRDL/Depository Participants, in respect of shares held in physical/ electronic mode respectively.
By Order of the Board of Directors
Yashaswin Sheth Company Secretary
Mumbai, 25th April, 2019
Registered Office:
Rallis India Limited156/157 15th FloorNariman Bhavan227 Nariman Point, Mumbai - 400 021CIN: L36992MH1948PLC014083Tel. No.: +91 22 6665 2700 I Fax No.: +91 22 6665 2827E-mail address: [email protected]: www.rallis.co.in

266 | 71st Annual Report 2018-19
NoticeRallis India Limited
Pursuant to Section 102 of the Companies Act, 2013 (‘the Act’), the following Explanatory Statement sets out all material facts relating to the business mentioned under Item Nos. 5 to 9 of the accompanying Notice dated 25th April, 2019.
Item No. 5:
In order to provide continuity of leadership to the Company post the early retirement of Mr. V. Shankar as the Managing Director & CEO of the Company, the Board at its meeting held on 3rd December, 2018, based on the recommendations of the Nomination and Remuneration Committee (‘NRC’), appointed Mr. R. Mukundan, Non-Executive Director on the Board of the Company, as the Managing Director & CEO of the Company for a period commencing from 3rd December, 2018 to 31st March, 2021 subject to the approval of Members at the ensuing Annual General Meeting (‘AGM’).
Thereafter, consequent to the appointment of Mr. Sanjiv Lal as Managing Director & CEO effective 1st April, 2019, Mr. R. Mukundan stepped down as the Managing Director & CEO effective from close of business hours of 31st March, 2019. However, he continues as the Non-Executive Director on the Board of the Company and will continue to offer his support and guidance to the Company. Accordingly, approval of the Members is sought at the ensuing AGM for appointment of Mr. Mukundan as the Managing Director & CEO for the period commencing from 3rd December, 2018 to 31st March, 2019.
Mr. Mukundan, 52 years, is currently the Managing Director & CEO of Tata Chemicals Limited (‘TCL’), the holding company. He is an MBA from FMS, Delhi University and BE-Electrical Engineering from IIT, Roorkee. He has attended the Advanced Management Programme at Harvard Business School. He joined the Tata Administrative Service in 1990. He joined TCL in 2001 and has led various functions like strategy and business development, corporate quality, corporate planning and manufacturing before taking over as the Managing Director of TCL in 2008. He serves as Director on the Boards of other Tata group companies.
He also serves on executive committees of various industry forums viz. the Confederation of Indian Industry, Bombay Chamber of Commerce and Industry, Employers’ Federation of India, All India Management Association, etc.
The principal terms and conditions of appointment of Mr. Mukundan as Managing Director & CEO (hereinafter
Explanatory Statement pursuant toSection 102 of the Companies Act, 2013
referred to as ‘Mr. Mukundan’ or ‘Managing Director & CEO’) are as follows:
1. Term and Termination:
With effect from 3rd December, 2018 (the date of appointment) to 31st March, 2019 (date of cessation as Managing Director & CEO).
2. Remuneration:
Mr. Mukundan would not draw any remuneration during his tenure as Managing Director & CEO of the Company.
3. Other Terms of Appointment:
i. The terms and conditions of the said appointment may be altered and varied from time to time by the Board as it may in its discretion deem fit, in such manner as may be agreed to between the Board and the Managing Director & CEO, subject to such approvals as may be required.
ii. The Managing Director & CEO shall not become interested or otherwise concerned, directly or through his spouse and/or children, in any selling agency of the Company.
iii. This appointment may be terminated by either party by giving to the other party six months’ notice of such termination or as may be mutually agreed.
iv. The employment of the Managing Director & CEO may be terminated by the Company without notice:
• if the Managing Director & CEO is found guilty of any gross negligence, default or misconduct in connection with or affecting the business of the Company or any subsidiary or associate company to which he is required to render services; or
• in the event of any serious repeated or continuing breach (after prior warning); or
• in the event the Board expresses its loss of confidence in the Managing Director & CEO.

267
v. In the event the Managing Director & CEO is not in a position to discharge his official duties due to any physical or mental incapacity, the Board shall be entitled to terminate his contract on such terms as the Board may consider appropriate in the circumstances.
vi. Upon the termination by whatever means of employment of the Managing Director & CEO:
• the Managing Director & CEO shall immediately cease to hold office held by him in any subsidiaries or associate companies without claim for compensation for loss of office by virtue of Section 167(1)(h) of the Act and shall resign as trustee of any trust connected with the Company.
• the Managing Director & CEO shall not without the consent of the Company at any time thereafter represent himself as connected with the Company or any of its subsidiaries or associate companies.
vii. If at any time, the appointee ceases to be a Director of the Company for any reason whatsoever, he shall cease to be the Managing Director & CEO.
viii. The terms and conditions of appointment of the Managing Director & CEO also include clauses pertaining to adherence with the Tata Code of Conduct, no conflict of interest with the Company, protection and use of Intellectual Properties, non-solicitation post cessation and maintenance of confidentiality.
The appointment of Mr. R. Mukundan as the Managing Director & CEO is in accordance with the conditions set out in Part – 1 of Schedule V of the Act as also conditions set out under Section 196(3) of the Act. He is not disqualified from being appointed as Director in terms of Section 164 of the Act.
The Board commends the Ordinary Resolution as set out at Item No. 5 of the accompanying Notice for approval of the Members of the Company in relation to the appointment of Mr. Mukundan as the Managing Director & CEO for the period commencing from 3rd December, 2018 to 31st March, 2019 pursuant to provisions of Section 196 read with Schedule D of the Act.
The above may be treated as a written memorandum setting out the terms of appointment of Mr. Mukundan under Section 190 of the Act.
Except Mr. Mukundan and his relatives, none of the Directors or Key Managerial Personnel (‘KMP’) of the Company and their respective relatives is concerned or interested, financially or otherwise, in the resolution set out at Item No. 5 of the accompanying Notice. Mr. Mukundan is not related to any other Director or KMP of the Company.
Item Nos. 6 & 7:
At the Board Meeting of the Company held on 9th February, 2019, the Board had, based on the recommendations of the NRC and subject to the approval of the Members, appointed Mr. Sanjiv Lal as Managing Director & CEO of the Company for a period of 5 years commencing from 1st April, 2019 to 31st March, 2024, in accordance with the provisions of Sections 196 and 197 read with Schedule V of the Act.
Mr. Lal was appointed as an Additional Director of the Company with effect from 1st April, 2019 by the Board of Directors. In terms of Section 161(1) of the Act, Mr. Lal holds office upto the date of this AGM but is eligible for appointment as a Director. The Company has received a Notice from a Member in writing under Section 160(1) of the Act proposing his candidature for the office of Director.
Mr. Sanjiv Lal, 58 years, was the Chief Operating Officer of the India Chemicals Business of Tata Chemicals Limited (‘TCL’) prior to his appointment as Managing Director & CEO of the Company. After joining TCL in 2004, he has held manufacturing responsibilities at two of its units, handled its Agri Retail Business, headed the organisational transformation and business excellence function, headed the information technology function and was also nominated as the Joint Managing Director to IMACID, a JV in Morocco. Before joining TCL, Mr. Lal has worked with Hindustan Unilever for 21 years in various functions in manufacturing and specialty chemicals business.
Mr. Lal is a B. Tech in Chemical Engineering and graduated from the Indian Institute of Technology, New Delhi in 1983. He has attended various executive development programs within Unilever and Tata Group including Management Development program at IMD Switzerland and the Tata Strategic Leadership Program.
The principal terms and conditions of Mr. Lal’s appointment as the Managing Director & CEO (hereinafter referred to as ‘Mr. Lal’ or ‘Managing Director & CEO’) are as follows:
Period of Appointment: Five years from 1st April, 2019 upto 31st March, 2024 (both days inclusive).

268 | 71st Annual Report 2018-19
NoticeRallis India Limited
Remuneration and other terms of appointment:
A) Salary: ` 4,50,000 per month (starting from April 2019) in the scale of ` 3,75,000 to ` 10,00,000.
The annual increments which will be effective 1st April each year (starting from April 2020) will be decided by the Board, based on recommendation of the NRC and will be merit based and take into account the Company’s performance as well.
B) Benefits, Perquisites and Allowances:
i. Rent free residential accommodation (furnished or otherwise), the Company bearing the cost of repairs, maintenance, society charges and utilities (e.g. gas, electricity and water charges) for the said accommodation.
OR
If accommodation is not provided by the Company, House Rent, House Maintenance and Utility Allowances aggregating 85% of the basic salary.
ii. Hospitalization, Transport, Telecommunication and other facilities in accordance with the Rules of the Company:
a. Hospitalization and major medical expenses for self, spouse and dependent (minor)children;
b. Car, with driver provided, maintained by the Company, for official and personal use;
c. Telecommunication facilities including broadband, internet and fax;
d. Housing Loan facility.
iii. Other perquisites and allowances, subject to a maximum of 55% of the basic salary as follows:
a. Allowances - 33.34% of basic salary
b. Leave Travel Concession/Allowance - 8.33% of basic salary
c. Medical Allowance - 8.33% of basic salary
d. Personal Accident Insurance and Club Membership fees at actuals, subject to a cap of 5% of basic salary
iv. Company’s contribution to Provident Fund, Superannuation or Annuity Fund and Gratuity Fund as per the rules of the Company.
v. The Managing Director & CEO shall be entitled to leave in accordance with the rules of the Company.
Privilege leave not availed by him is encashable in accordance with the rules of the Company.
C) Commission: Such remuneration by way of commission, in addition to the salary and benefits, perquisites and allowances payable, calculated with reference to the net profits of the Company in a particular financial year, as may be determined by the Board at the end of each financial year, subject to the overall ceilings stipulated in Section 197 of the Act. The specific amount payable will be based on performance as evaluated by the Board or a Committee thereof duly authorized in this behalf and will be payable annually after the Annual Financial Statements have been adopted by the Board.
D) Incentive remuneration: In cases where the net profits of the Company are inadequate for payment of profit linked commission, incentive remuneration, not exceeding 200% of the annual basic salary, to be paid at the discretion of the Board annually, based on certain performance criteria and such other parameters as may be considered appropriate from time to time.
An indicative list of factors that may be considered for determining the extent of commission/incentive remuneration, by the Board which will be payable annually after the Annual Accounts have been approved, are:
i. Company performance on certain defined qualitative and quantitative parameters as may be decided by the Board from time to time;
ii. Industry benchmarks of remuneration;
iii. Performance of the individual.
E) Minimum Remuneration: Notwithstanding anything to the contrary herein contained, where in any financial year during the currency of the tenure of the Managing Director & CEO, the Company has no profits or its profits are inadequate, the Company will pay to him remuneration by way of Salary, Benefits, Perquisites and Allowances and Incentive Remuneration as specified above.
F) Insurance: The Company will take an appropriate Directors’ and Officers’ Liability Insurance Policy and pay the premiums for the same. It is intended to maintain such insurance cover for the entire period of appointment, subject to the terms of such policy in force from time to time.
269
G) Other Terms of Appointment:
i. The terms and conditions of the said appointment may be altered and varied from time to time by the Board as it may in its discretion deem fit, irrespective of the limits stipulated under Schedule V of the Act or any amendments made hereafter in this regard, in such manner as may be agreed to between the Board and the Managing Director & CEO, subject to such approvals as may be required.
ii. The Managing Director & CEO shall not become interested or otherwise concerned, directly or through his spouse and/or children, in any selling agency of the Company.
iii. This appointment may be terminated by either party by giving to the other party six months’ notice of such termination or the Company paying six months’ remuneration in lieu of the notice.
iv. The employment of the Managing Director & CEO may be terminated by the Company without notice or payment in lieu of notice:
• if the Managing Director & CEO, is found guilty of any gross negligence, default or misconduct in connection with or affecting the business of the Company or any subsidiary or associate company to which he is required by the Agreement to render services; or
• in the event of any serious repeated or continuing breach (after prior warning) or non-observance by the Managing Director & CEO of any of the stipulations contained in the Agreement to be executed between the Company and the Managing Director & CEO; or
• in the event the Board expresses its loss of confidence in the Managing Director & CEO.
v. In the event the Managing Director & CEO is not in a position to discharge his official duties due to any physical or mental incapacity, the Board shall be entitled to terminate his contract on such terms as the Board may consider appropriate in the circumstances.
vi. Upon the termination by whatever means of employment of the Managing Director & CEO:
• the Managing Director & CEO shall immediately cease to hold office held by him
in any subsidiaries or associate companies without claim for compensation for loss of office by virtue of Section 167(1)(h) of the Act and shall resign as trustee of any trust connected with the Company.
• the Managing Director & CEO shall not without the consent of the Company at any time thereafter represent himself as connected with the Company or any of its subsidiaries or associate companies.
vii. All Personnel Policies of the Company and the related rules which are applicable to other employees of the Company shall also be applicable to the Managing Director & CEO, unless specifically provided otherwise.
viii. If and when the Agreement expires or is terminated for any reason whatsoever, the appointee will cease to be the Managing Director & CEO and also cease to be a Director. If at any time, the appointee ceases to be a Director of the Company for any reason whatsoever, he shall cease to be the Managing Director & CEO and the Agreement shall forthwith terminate. If at any time, the appointee ceases to be in the employment of the Company for any reason whatsoever, he shall cease to be a Director and the Managing Director and CEO of the Company.
ix. The terms and conditions of appointment of the Managing Director & CEO also include clauses pertaining to adherence with the Tata Code of Conduct, no conflict of interest with the Company, protection and use of Intellectual Properties, non-solicitation post termination of agreement and maintenance of confidentiality.
Mr. Lal satisfies all the conditions set out in Part-I of Schedule V of the Act as also conditions set out under Section 196(3) of the Act for being eligible for his appointment. He is not disqualified from being appointed as Director in terms of Section 164 of the Act. Further, Mr. Lal has also confirmed that he is not debarred from holding the office of Director by virtue of any SEBI Order or any such authority pursuant to circulars dated 20th June, 2018 issued by BSE Limited and the National Stock Exchange of India Limited pertaining to enforcement of SEBI Orders regarding appointment of Directors by the listed companies.

270 | 71st Annual Report 2018-19
NoticeRallis India Limited
Having regard to the qualifications, experience and knowledge, the Directors are of the view that the appointment of Mr. Lal as a Managing Director & CEO will be beneficial to the functioning and future growth opportunities of the Company and the remuneration payable to him is commensurate with his abilities and experience.
Accordingly, the Board commends the Ordinary Resolutions as set out at Item Nos. 6 & 7 of the accompanying Notice in relation to the appointment of Mr. Lal as Director and as Managing Director & CEO for a period of 5 years commencing from 1st April, 2019 to 31st March, 2024 for the approval of the Members pursuant to the provisions of Sections 196, 197 and 198 read with Schedule V of the Act.
The above may be treated as a written memorandum setting out the terms of appointment of Mr. Lal under Section 190 of the Act.
Except Mr. Lal and his relatives, none of the Directors or KMP of the Company and their relatives is concerned or interested, financially or otherwise, in the resolutions set out at Item Nos. 6 & 7 of the accompanying Notice. Mr. Lal is not related to any other Director or KMP of the Company.
Item No. 8:
Dr. Punita Kumar-Sinha is currently an Independent Director of the Company and the Chairperson and Member of the Stakeholders’ Relationship Committee. Dr. Punita Kumar-Sinha was appointed as an Independent Director of the Company by the Members at the 66th AGM of the Company held on 30th June, 2014 to hold office upto 29th June, 2019 and is eligible for re-appointment for a second term on the Board of the Company as an Independent Director. Based on the recommendations of the NRC, the Board of Directors propose the re-appointment of Dr. Kumar-Sinha as an Independent Director of the Company, not liable to retire by rotation, for period commencing from 30th June, 2019 to 25th March, 2024, subject to the approval of the Members by a Special Resolution. The Company has in terms of Section 160(1) of the Act received a notice from a Member proposing her candidature for the office of Director.
Based on the performance evaluation of the Independent Directors and as per the recommendations of the NRC, given her background, experience and contribution, the Board is of the opinion that Dr. Kumar-Sinha’s continued association would be of immense benefit to the Company and it is therefore desirable to continue to avail her services as an Independent Director.
The Company has received a declaration from Dr. Kumar-Sinha confirming that she meets the criteria of independence as prescribed under Section 149(6) of the Act and Regulation 16(1)(b) of the SEBI (Listing Obligations and Disclosure Requirements) Regulations, 2015 (‘Listing Regulations’). In terms of Regulation 25(8) of the Listing Regulations, Dr. Kumar-Sinha has confirmed that she is not aware of any circumstance or situation which exists or may be reasonably anticipated that could impair or impact her ability to discharge her duties. Dr. Kumar-Sinha has also confirmed that she is not debarred from holding the office of Director by virtue of any SEBI Order or any such authority pursuant to circulars dated 20th June, 2018 issued by BSE Limited and the National Stock Exchange of India Limited pertaining to enforcement of SEBI Orders regarding appointment of Directors by the listed companies. Further, Dr. Kumar-Sinha is not disqualified from being appointed as Director in terms of Section 164 of the Act and has given her consent to act as Director.
In the opinion of the Board, Dr. Kumar-Sinha fulfills the conditions specified in the Act and the Listing Regulations for re-appointment as an Independent Director and that she is independent of the Management. A copy of the draft letter for re-appointment of the Independent Director setting out the terms and conditions of her re-appointment is available for inspection by the Members at the Registered Office of the Company during the business hours (except on Saturdays and Sundays) and will also be kept available at the venue of the AGM till the conclusion of the AGM.
Dr. Kumar-Sinha holds a Ph.D and a Masters in Finance from the Wharton School, University of Pennsylvania, undergraduate degree in Chemical Engineering with distinction from the Indian Institute of Technology, New Delhi, an MBA degree from Drexel University and also a CFA Charter holder. She is a member of the CFA Institute and the Council on Foreign Relations. Dr. Kumar-Sinha is the Founder and Managing Partner, Pacific Paradigm Advisors, an independent investment advisory and management firm. Prior to founding Pacific Paradigm Advisors in 2012, she was Head of Blackstone Asia Advisors L.L.C. and its Chief Investment Officer, and was a Senior Managing Director of The Blackstone Group L.P.
She has 30 years of experience in fund management in emerging markets, being one of the first foreign investors into India. Before joining Blackstone, she was a Managing Director at Oppenheimer Asset Management Inc., Portfolio Manager and Chief Investment Officer at The India Fund Inc., and Asia Tigers Fund Inc., and Senior Portfolio Manager at CIBC World Markets. She has also been a Portfolio Manager on the emerging markets team at Batterymarch (a Legg
271
By Order of the Board of Directors
Yashaswin Sheth Company Secretary
Mumbai, 25th April, 2019
Registered Office:
Rallis India Limited156/157 15th FloorNariman Bhavan227 Nariman Point, Mumbai - 400 021CIN: L36992MH1948PLC014083Tel. No.: +91 22 6665 2700 I Fax No.: +91 22 6665 2827E-mail address: [email protected]: www.rallis.co.in
Mason company), and on the international equity team at Standish Ayer & Wood (a Bank of New York Mellon company). She is also on several other Boards and has numerous years of experience in corporate governance.
In compliance with the provisions of Section 149 read with Schedule IV of the Act, Regulation 17 of the Listing Regulations and other applicable provisions of the Act and Listing Regulations, the re-appointment of Dr. Kumar-Sinha as Independent Director is now placed for the approval of the Members by a Special Resolution.
The Board commends the Special Resolution set out in Item No. 8 of the accompanying Notice for approval of the Members.
Except Dr. Kumar-Sinha and her relatives, none of the Directors or KMP of the Company and their respective relatives is concerned or interested in the resolution set out at Item No. 8 of the accompanying Notice. Dr. Kumar-Sinha is not related to any other Director or KMP of the Company.
Item No. 9:
Pursuant to Section 148 of the Act, read with the Companies (Cost Records and Audit) Rules, 2014, as amended from time to time, the Company is required to have the audit
of its cost records conducted by a Cost Accountant. The Board has, on the recommendation of the Audit Committee, approved the appointment of D. C. Dave & Co. (Firm Registration No. 000611) as the Cost Auditors of the Company to conduct Cost Audits relating to Insecticides (Liquid, Solid and Technical Grade), Fertilizers, Chemicals (Plastics and Polymers) and Drugs & Pharmaceuticals of the Company for the year ending 31st March, 2020, at a remuneration of ₹ 5 lakhs plus applicable taxes and out-of-pocket expenses.
D. C. Dave & Co. have the necessary experience in the field of cost audit, and have submitted a certificate regarding their eligibility for appointment as Cost Auditors of the Company.
In accordance with the provisions of Section 148 of the Act read with the Companies (Audit and Auditors) Rules, 2014, the remuneration payable to the Cost Auditors has to be ratified by the Members of the Company.
The Board commends the remuneration of ₹ 5 lakhs plus applicable taxes and out-of-pocket expenses to D. C. Dave & Co. as the Cost Auditors and the approval of the Members is sought for the same by an Ordinary Resolution.
None of the Directors or KMP of the Company and their respective relatives is, in any way, concerned or interested in the Resolution at Item No. 9 of the Notice.

272 | 71st Annual Report 2018-19
NoticeRallis India Limited
Details of Directors seeking appointment/ re-appointment at the AGM[Pursuant to Regulations 26(4) and 36(3) of the Listing Regulations and Secretarial Standard - 2 on General Meetings]
Name of Director Mr. Bhaskar Bhat Mr. R. Mukundan Mr. Sanjiv Lal Dr. Punita Kumar-Sinha
DIN 00148778 00778253 08376952 05229262Date of Birth 29th August, 1954 19th September, 1966 6th March, 1961 13th May, 1962Age 64 years 52 years 58 years 56 yearsDate of first appointment
8th October, 2015 3rd December, 2009 1st April, 2019 26th March, 2014
Qualifications Graduated in Mechanical Engineering from IIT, Madras and PGDBM from IIM, Ahmedabad
BE (Electrical Engineering) from IIT, Roorkee and MBA from FMS, Delhi University; Advanced Management Programme at Harvard Business School
B. Tech in Chemical Engineering from IIT Delhi
Ph. D in Finance, The Wharton School, University of Pennsylvania, Masters in Finance, The Wharton School, University of Pennsylvania; Master of Business Administration, Drexel University, Philadelphia; Bachelor of Technology, IIT, Delhi
Expertise in specific functional areas
Mr. Bhat has extensive experience and expertise in sales and marketing. He is the Managing Director of Titan Company Limited since April 2002. At Titan, Mr. Bhat has dealt with Sales & Marketing, HR, international business and various general managerial assignments
Mr. R. Mukundan has wide experience in the field of strategy, business development, corporate quality, planning, manufacturing and general management
Mr. Sanjiv Lal has over 36 years of rich and varied experience in the chemical industry in terms of manufacturing, sales and marketing, strategy, IT and general management
Dr. Punita Kumar-Sinha has more than 30 years of experience in Global/ Indian financial markets and economics, fund management, general management and corporate finance. She also has numerous years of experience in corporate governance
Terms and conditions of appointment/ re-appointment
N. A. Appointment as Managing Director & CEO effective 3rd December, 2018 upto 31st March, 2019 (Refer Item No. 5 of the Notice and Explanatory Statement)
Appointment as Managing Director & CEO effective 1st April, 2019 upto 31st March, 2024 (Refer Item Nos. 6 & 7 of the Notice and Explanatory Statement)
Re-appointment as an Independent Director for a period commencing from 30th June, 2019 to 25th March, 2024 (Refer Item No. 8 of the Notice and Explanatory Statement)
Details of remuneration last drawn# (FY 2018-19)
Sitting Fees: ` 3,00,000
Commission: Nil**
Nil** NA Sitting Fees: ` 2,20,000
Commission: ` 20,00,000
No. of Board Meetings attended during the year
8 8 NA 8
Relationship with other Directors and KMPs
None None None None
No. of shares held in the Company:(a) Own(b) For other
persons on a beneficial basis
NILNIL
NILNIL
NILNIL
NILNIL
List of other Companies in which Directorship held as on 31st March, 2019 (excluding foreign, private and Section 8 Companies)
1. Tata Chemicals Limited*2. Titan Company Limited*3. Titan Engineering &
Automation Limited4. Trent Limited*5. Bosch Limited*6. Tata SIA Airlines Limited7. Carat Lane Trading Pvt.
Limited
1. Tata Chemicals Limited*
2. Tata International Limited
3. Metahelix Life Sciences Limited
NIL 1. Sobha Limited*2. Bharat Financial Inclusions
Limited*3. Mahindra Intertrade Limited4. SREI Infrastructure Finance
Limited*5. JSW Steel Limited*6. Infosys Limited*7. Metahelix Life Sciences
Limited8. FINO Payments Bank Limited
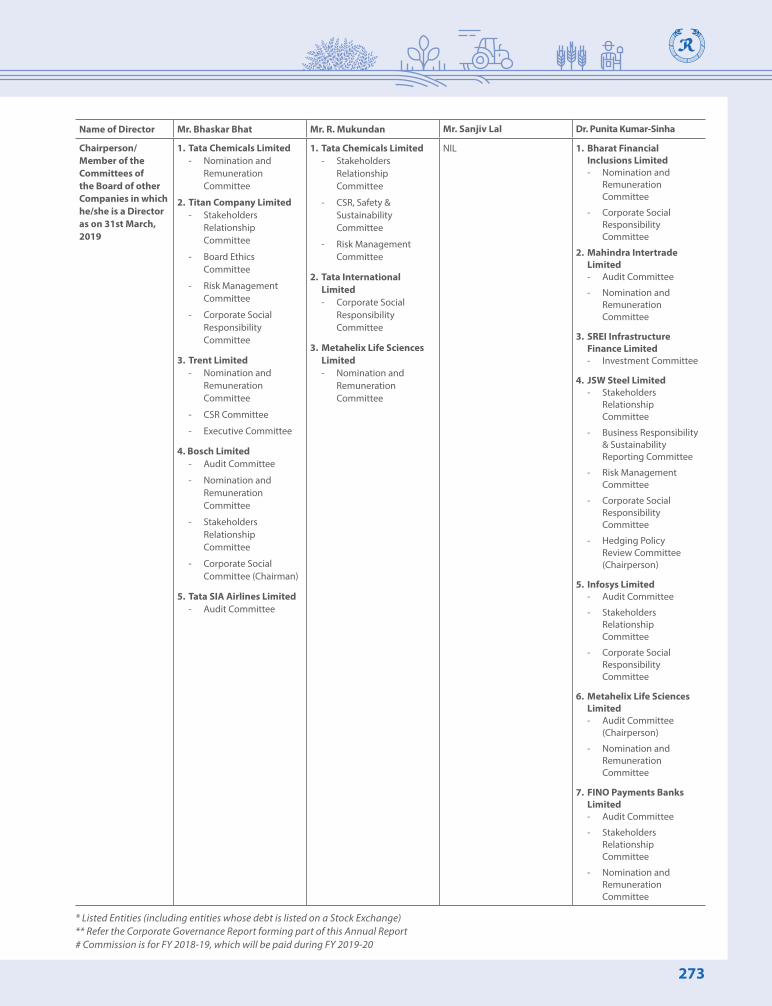
273
Name of Director Mr. Bhaskar Bhat Mr. R. Mukundan Mr. Sanjiv Lal Dr. Punita Kumar-Sinha
Chairperson/ Member of the Committees of the Board of other Companies in which he/she is a Director as on 31st March, 2019
1. Tata Chemicals Limited - Nomination and
Remuneration Committee
2. Titan Company Limited - Stakeholders
Relationship Committee
- Board Ethics Committee
- Risk Management Committee
- Corporate Social Responsibility Committee
3. Trent Limited - Nomination and
Remuneration Committee
- CSR Committee
- Executive Committee
4. Bosch Limited - Audit Committee
- Nomination and Remuneration Committee
- Stakeholders Relationship Committee
- Corporate Social Committee (Chairman)
5. Tata SIA Airlines Limited - Audit Committee
1. Tata Chemicals Limited - Stakeholders
Relationship Committee
- CSR, Safety & Sustainability Committee
- Risk Management Committee
2. Tata International Limited
- Corporate Social Responsibility Committee
3. Metahelix Life Sciences Limited
- Nomination and Remuneration Committee
NIL 1. Bharat Financial Inclusions Limited
- Nomination and Remuneration Committee
- Corporate Social Responsibility Committee
2. Mahindra Intertrade Limited
- Audit Committee
- Nomination and Remuneration Committee
3. SREI Infrastructure Finance Limited
- Investment Committee
4. JSW Steel Limited - Stakeholders
Relationship Committee
- Business Responsibility & Sustainability Reporting Committee
- Risk Management Committee
- Corporate Social Responsibility Committee
- Hedging Policy Review Committee (Chairperson)
5. Infosys Limited - Audit Committee
- Stakeholders Relationship Committee
- Corporate Social Responsibility Committee
6. Metahelix Life Sciences Limited
- Audit Committee (Chairperson)
- Nomination and Remuneration Committee
7. FINO Payments Banks Limited
- Audit Committee
- Stakeholders Relationship Committee
- Nomination and Remuneration Committee
* Listed Entities (including entities whose debt is listed on a Stock Exchange)** Refer the Corporate Governance Report forming part of this Annual Report # Commission is for FY 2018-19, which will be paid during FY 2019-20

274 | 71st Annual Report 2018-19
NoticeRallis India Limited
ROU
TE M
AP
to th
e Ve
nue
of th
e 71
st A
nnua
l Gen
eral
Mee
ting
Venu
e: W
alch
and
Hira
chan
d H
all,
4th
Floo
r, In
dian
Mer
chan
ts’ C
ham
ber B
uild
ing,
IMC
Mar
g, C
hurc
hgat
e, M
umba
i - 4
00 0
20La
ndm
ark:
Nex
t to
Chur
chga
te S
tatio
n
Co.
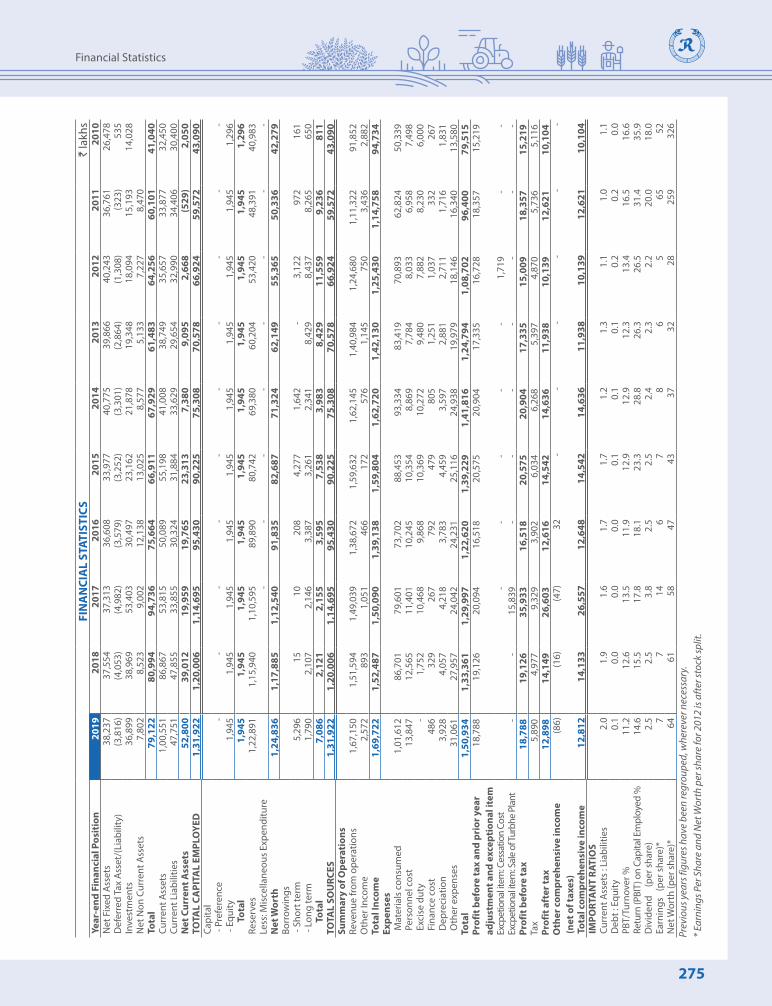
275
Financial Statistics
FIN
AN
CIA
L ST
ATIS
TICS
` la
khs
Year
-end
Fin
anci
al P
osit
ion
2019
2018
2017
2016
2015
2014
2013
2012
2011
2010
Net
Fix
ed A
sset
s38
,237
37,5
5437
,313
36,6
0833
,977
40,7
7539
,866
40,2
4336
,761
26,4
78D
efer
red
Tax
Ass
et/(
Liab
ility
)(3
,816
)(4
,053
)(4
,982
)(3
,579
)(3
,252
)(3
,301
)(2
,864
)(1
,308
)(3
23)
535
Inve
stm
ents
36,8
9938
,969
53,4
0330
,497
23,1
6221
,878
19,3
4818
,094
15,1
9314
,028
Net
Non
Cur
rent
Ass
ets
7,80
28,
523
9,00
212
,138
13,0
258,
577
5,13
37,
227
8,47
0To
tal
79,1
2280
,994
94,7
3675
,664
66,9
1167
,929
61,4
8364
,256
60,1
0141
,040
Curr
ent A
sset
s1,
00,5
5186
,867
53,8
1550
,089
55,1
9841
,008
38,7
4935
,657
33,8
7732
,450
Curr
ent L
iabi
litie
s47
,751
47,8
5533
,855
30,3
2431
,884
33,6
2929
,654
32,9
9034
,406
30,4
00N
et C
urre
nt A
sset
s52
,800
39,0
1219
,959
19,7
6523
,313
7,38
09,
095
2,66
8(5
29)
2,05
0TO
TAL
CAPI
TAL
EMPL
OYE
D1,
31,9
221,
20,0
061,
14,6
9595
,430
90,2
2575
,308
70,5
7866
,924
59,5
7243
,090
Capi
tal
- Pr
efer
ence
--
--
--
--
--
- Eq
uity
1,94
51,
945
1,94
51,
945
1,94
51,
945
1,94
51,
945
1,94
51,
296
T
otal
1,94
51,
945
1,94
51,
945
1,94
51,
945
1,94
51,
945
1,94
51,
296
Rese
rves
1,22
,891
1,15
,940
1,10
,595
89,8
9080
,742
69,3
8060
,204
53,4
2048
,391
40,9
83Le
ss: M
isce
llane
ous
Expe
nditu
re-
--
--
--
-N
et W
orth
1,24
,836
1,17
,885
1,12
,540
91,8
3582
,687
71,3
2462
,149
55,3
6550
,336
42,2
79Bo
rrow
ings
- Sh
ort t
erm
5,29
615
1020
84,
277
1,64
2-
3,12
297
216
1 -
Long
term
1,79
02,
107
2,14
63,
387
3,26
12,
341
8,42
98,
437
8,26
565
0
Tot
al7,
086
2,12
12,
155
3,59
57,
538
3,98
38,
429
11,5
599,
236
811
TOTA
L SO
URC
ES1,
31,9
221,
20,0
061,
14,6
9595
,430
90,2
2575
,308
70,5
7866
,924
59,5
7243
,090
Sum
mar
y of
Ope
rati
ons
Reve
nue
from
ope
ratio
ns1,
67,1
501,
51,5
941,
49,0
391,
38,6
721,
59,6
321,
62,1
451,
40,9
841,
24,6
801,
11,3
2291
,852
Oth
er In
com
e2,
572
893
1,05
146
617
257
61,
145
750
3,43
62,
882
Tota
l Inc
ome
1,69
,722
1,52
,487
1,50
,090
1,39
,138
1,59
,804
1,62
,720
1,42
,130
1,25
,430
1,14
,758
94,7
34Ex
pens
es M
ater
ials
con
sum
ed1,
01,6
1286
,701
79,6
0173
,702
88,4
5393
,334
83,4
1970
,893
62,8
2450
,339
Per
sonn
el c
ost
13,8
4712
,565
11,4
0110
,245
10,3
548,
869
7,78
48,
033
6,95
87,
498
Exc
ise
duty
-1,
752
10,4
689,
868
10,3
6910
,272
9,48
07,
882
8,23
06,
000
Fin
ance
cos
t48
632
926
779
247
980
51,
251
1,03
733
226
7 D
epre
ciat
ion
3,92
84,
057
4,21
83,
783
4,45
93,
597
2,88
12,
711
1,71
61,
831
Oth
er e
xpen
ses
31,0
6127
,957
24,0
4224
,231
25,1
1624
,938
19,9
7918
,146
16,3
4013
,580
Tota
l 1
,50,
934
1,33
,361
1,29
,997
1,22
,620
1,39
,229
1,41
,816
1,24
,794
1,08
,702
96,4
0079
,515
Prof
it b
efor
e ta
x an
d pr
ior y
ear
adju
stm
ent a
nd e
xcep
tion
al it
em 1
8,78
8 19
,126
20,0
9416
,518
20,5
7520
,904
17,3
3516
,728
18,3
5715
,219
Excp
etio
nal it
em: C
essa
tion
Cost
--
--
-1,
719
--
Excp
etio
nal it
em: S
ale
of Tu
rbhe
Pla
nt-
-15
,839
--
--
--
-Pr
ofit
bef
ore
tax
18,
788
19,1
2635
,933
16,5
1820
,575
20,9
0417
,335
15,0
0918
,357
15,2
19Ta
x5,
890
4,97
79,
329
3,90
26,
034
6,26
85,
397
4,87
05,
736
5,11
6Pr
ofit
aft
er ta
x 1
2,89
8 14
,149
26,6
0312
,616
14,5
4214
,636
11,9
3810
,139
12,6
2110
,104
Oth
er c
ompr
ehen
sive
inco
me
(net
of t
axes
)(8
6)(1
6)(4
7)32
--
--
--
Tota
l com
preh
ensi
ve in
com
e 1
2,81
2 14
,133
26,5
5712
,648
14,5
4214
,636
11,9
3810
,139
12,6
2110
,104
IMPO
RTA
NT
RATI
OS
Curr
ent A
sset
s : L
iabi
litie
s2.
01.
91.
61.
71.
71.
21.
31.
11.
01.
1D
ebt :
Equ
ity0.
10.
00.
00.
00.
10.
10.
10.
20.
20.
0PB
T/Tu
rnov
er %
11.
2 12
.613
.511
.912
.912
.912
.313
.416
.516
.6Re
turn
(PBI
T) o
n Ca
pita
l Em
ploy
ed %
14.6
15.5
17.8
18.1
23.3
28.8
26.3
26.5
31.4
35.9
Div
iden
d
(per
sha
re)
2.5
2.5
3.8
2.5
2.5
2.4
2.3
2.2
20.0
18.0
Earn
ings
(p
er s
hare
)*7
714
67
86
565
52N
et W
orth
(per
sha
re)*
6461
5847
4337
3228
259
326
Prev
ious
yea
rs fi
gure
s hav
e be
en re
grou
ped,
whe
reve
r nec
essa
ry.
* Ear
ning
s Per
Sha
re a
nd N
et W
orth
per
shar
e fo
r 201
2 is
afte
r sto
ck sp
lit.

This page is intentionally kept blank

To,TSR Darashaw Ltd.Unit: Rallis India Limited6-10 Haji Moosa Patrawala Industrial Estate, 20 Dr. E. Moses Road, Mahalaxmi,Mumbai - 400 011.
Updation of Shareholder Information
I / We request you to record the following information against my/our Folio No.:
General Information:
Folio No.:
Name of the first-named Member:
PAN: *
CIN/Registration No.: *
(applicable to Corporate Members)
Tel No. with STD Code:
Mobile No.:
Email Id:
*Self-attested copy of the document(s) enclosed
Bank Details:
IFSC:
(11 digit)
MICR:
(9 digit)
Bank A/c Type: Bank A/c No.: *
Name of the Bank:
Bank Branch Address:
* A blank cancelled cheque is enclosed to enable verification of bank details
I/ We hereby declare that the particulars given above are correct and complete. If the transaction is delayed because of incomplete or incorrect information, I/ We would not hold the Company/ RTA responsible. I/ We undertake to inform any subsequent changes in the above particulars as and when the changes take place. I/ We understand that the above details shall be maintained by you till I/We hold the securities under the above-mentioned Folio No.
Place: Date: Signature of Sole/ First holder

This page is intentionally kept blank

RALLIS INDIA LIMITED
RALLIS INDIA LIMITED
Corporate Identity Number: L36992MH1948PLC014083Registered Office: 156/157 15TH FLOOR, NARIMAN BHAVAN, 227 NARIMAN POINT, MUMBAI 400 021Tel. No.: +91 22 6665 2700 Fax No.: +91 22 6665 2827 E-mail address: [email protected]
Website: www.rallis.co.in
ATTENDANCE SLIP
Folio No.: DP ID No.: Client ID No.:
I/We hereby record my/our presence at the SEVENTY FIRST ANNUAL GENERAL MEETING of the Company at Walchand Hirachand Hall, 4th Floor, Indian Merchants’ Chamber Building, IMC Marg, Churchgate, Mumbai - 400 020, on Friday, the 28th June, 2019 at 3.00 p.m.
Name of the Member __________________________________________
Name of the Proxyholder _______________________________________
Signature _______________________________________
Signature _______________________________________
NOTES: 1. Only Member/Proxyholder can attend the Meeting.2. Please complete the Folio/DP-Client ID No. and name of the Member/Proxyholder, sign this Attendance Slip and hand it over, duly signed, at
the entrance of the Meeting Hall.3. A Member/Proxyholder attending the Meeting should bring the copy of the Annual Report for reference at the Meeting.
Corporate Identity Number: L36992MH1948PLC014083Registered Office: 156/157 15TH FLOOR, NARIMAN BHAVAN, 227, NARIMAN POINT, MUMBAI - 400 021
Tel. No.: +91 22 6665 2700 Fax No.: +91 22 6665 2827 E-mail address: [email protected]: www.rallis.co.in
PROXY FORMPursuant to Section 105(6) of the Companies Act, 2013 and Rule 19(3) of the Companies (Management and Administration) Rules, 2014
Name of the Member(s) :
Registered Address :
E-mail Id :
Folio No./DP ID-Client ID No. :
I/ We, being the Member(s) of the above named Company, holding ............................. shares, hereby appoint:
(1) Name: .......................................................... Address: ...........................................................................................................................................................................................
E-mail Id: ..................................................... Signature: .......................................................... or failing him/her;
(2) Name: .......................................................... Address: ...........................................................................................................................................................................................
E-mail Id: .....................................................Signature: .......................................................... or failing him/her;
(3) Name: .......................................................... Address: ...........................................................................................................................................................................................
E-mail Id: .....................................................Signature: ..........................................................
as my/our Proxy to attend and vote (on a poll) for me/us and on my/ our behalf at the SEVENTY FIRST ANNUAL GENERAL MEETING of the Company, to be held on Friday, the 28th June, 2019 at 3.00 p.m. at Walchand Hirachand Hall, 4th Floor, Indian Merchants’ Chamber Building, IMC Marg, Churchgate, Mumbai - 400 020 and at any adjournment thereof in respect of such resolutions as are indicated overleaf:

*I wish my above Proxy to vote in the manner as indicated in the box below:
Resolution No. Resolution For AgainstOrdinary Business
1. Adoption of Audited Standalone Financial Statements, Board’s and Auditors’ Report for the financial year ended 31st March, 2019
2. Adoption of Audited Consolidated Financial Statements and Auditors’ Report for the financial year ended 31st March, 2019
3. Declaration of dividend for the financial year 2018-19 on Equity Shares4. Re-appointment of Mr. Bhaskar Bhat, who retires by rotation
Special Business5. Appointment of Mr. R. Mukundan as Managing Director & CEO6. Appointment of Mr. Sanjiv Lal as a Director7. Appointment of Mr. Sanjiv Lal as Managing Director & CEO8. Re-appointment of Dr. Punita Kumar-Sinha as an Independent Director9. Ratification of Cost Auditors’ remuneration
Signed this ............................................................................................................ day of ............................................................................................................ 2019
Signature of Member: ..........................................................................................................
Signature of Proxy holder: ...........................................................................................
NOTES:
1. This Form in order to be effective, should be duly filled, stamped, signed and deposited at the Registered Office of the Company, at 156/157, 15th Floor, Nariman Bhavan, 227, Nariman Point, Mumbai - 400 021, not less than Forty-Eight (48) Hours before the commencement of the Meeting.
2. A proxy need not be a member of the Company.
*3. This is only optional. Please put a ‘’ in the appropriate column against the resolutions indicated in the box. If you leave the ‘For’ or ‘Against’ column blank against any or all the resolutions, your Proxy will be entitled to vote in the manner as he/she thinks appropriate.
4. For the Resolutions, Explanatory Statement and Notes, please refer to the Notice of the SEVENTY FIRST ANNUAL GENERAL MEETING of the Company.
AffixRevenue
Stamp

Notes

Notes

Notes

Notes

Awards
Conferred with a Plaque award for our IGBC Green Building with Platinum Rating, indicating the highest level of recognition, for our commendable efforts in incorporating various unique features, showcasing profound commitment towards preserving the environment
We are Included in the Inclusive business list 2018 for our contribution in social space
Metahelix Life Sciences Limited received Bio Excellence award from Government of Karnataka for the year 2018 in recognition of their outstanding contribution to Biotechnology Sector
We won the first prize for business model innovation for Rallis Samrudh Krishi organised by the CII-INSTITUTE OF QUALITY at 6th National Excellence Practice Competition 2018
Our Team receiving award in ‘Out of the Box’ category of TVW – 10 for our ‘You are safe’ initiative
Featured in the 2017 Inclusive Business list by the Institute of Competitiveness for redefining the role of business in society through an inclusive business model that addresses social and environmental problems
PMFAI-SML Annual AGCHEM award to Rallis for Outstanding innovation in crop solution (Rallis Samrudh Krishi)
Registered office156/157, 15th Floor, Nariman Bhavan227 Nariman Point, Mumbai - 400 021CIN: L36992MH1948PLC014083Tel.: 91 22 6665 2700Fax: 91 22 6665 2827E-mail: [email protected]: www.rallis.co.in
71st Annual Report 2018-19