raman and surface enhanced raman spectroscopy on molecules of pharmaceutical and biological
TRANSCRIPT

Romanian Reports in Physics, Vol. 60, No. 3, P. 829–855, 2008
Dedicated to Prof. Ioan-Iovitz Popescu’s 75th Anniversary
BIOPHYSICS. MEDICAL PHYSICS. ENVIRONMENTAL PHYSICS
RAMAN AND SURFACE ENHANCED RAMANSPECTROSCOPY ON MOLECULES OF PHARMACEUTICAL
AND BIOLOGICAL INTEREST
T. ILIESCU*, M. BAIA, D. MANIU
Molecular Spectroscopy Dept., Physics Faculty, “Babes-Bolyai” University,M. Kogalniceanu 1, 400084 Cluj-Napoca, Romania
E-mail: [email protected]
(Received November 27, 2007)
Abstract. The molecules with antibacterial properties like, acridine derivatives, rivanol, furanderivatives, potassium benzylpenicillin, tranquilizers like, phenothiazine derivatives, anti-inflamatorrydrugs like, diclofenac sodium and its complex with beta-cyclodextrin and some non natural -aminoacids were studied by theoretical (DFT) and experimental (Raman and Surface Enhanced RamanSpectroscopy (SERS)) point of view in order to have information about vibrational frequencies theirassignment and the structure of the adsorbed molecular species and orientation of the molecules onmetallic surface. These studies lead to a better understanding of their biological activity on differentphysico-chemical conditions.
Key words: Raman, SERS, pharmaceutical products.
1. INTRODUCTION
The observation of greatly enhanced Raman intensities for molecules afteradsorption on certain rouged metal (silver, gold, copper) surface, with roughness ofthe nanometer size, has been both an experimentally as well as theoreticallyinteresting and intriguing phenomenon, known as surface-enhanced Raman scattering(SERS), since its discovery in 1974 by Fleischmann et al. [1]. The intensityobserved in SERS usually exceeds by a factor of 105–106 and, in special cases by1012–1014 the signal observed in normal Raman scattering. Moreover, the SERSeffect becomes even stronger if the frequency of the excitation light is in resonancewith the main absorption band of the molecule being illuminated (surface-enhancedresonance Raman scattering, SERRS). Due to high intensity of the Raman signalSERS is a very useful technique in surface science, electrochemistry and analytical

830 T. Iliescu, M. Baia, D. Maniu 2
chemistry [2–6]. Because of the fluorescence suppression, this non-radiativetransfer being determined by metal surface roughness, this technique is widelyemployed for molecules of biological interest that present this phenomenon [7, 8].
Unfortunately, a full theoretical and quantitative understanding of the SERSmechanisms is lacking even after more than three decades of investigation. However,the enhancement of the Raman scattering cross-section of molecules adsorbed onrough metal surfaces has been attributed to two major effects [5, 9]. The main andforemost contribution to SERS comes from the enhancement of electromagneticfield close to the surface through interaction with surface plasmon excitation. Thelocal electromagnetic field depends on the microscopic shape of the metallic surface,such as the presence of a sharp edge. Metal colloids and colloidal aggregatesprovide a particularly rich example of such local electromagnetic enhancement.Several authors [10–12] suggest that protrusions on the surface of a colloidalparticles, as well as “cavities” between adjacent particles in an aggregate, lead to agiant enhancement of the local field, up to a factor of 1014–1015.
The second contribution to the enhancement of the Raman scattering is aspecific interaction of the adsorbed molecule with the metal surface [9]. In someinstances, this molecular chemisorption effect leads to a charge-transfer interaction,whereby an electron is transferred from the molecule into the empty levels of themetal or from occupied metal levels to the molecule. This electron transfer can beregarded as an electron excitation of the coupled molecule-surface system (complex)and should therefore lead to the appearance of a new band in the electronicspectrum of the molecule, excitation light being in resonance with this new band.The charge transfer mechanism is restricted by its nature to molecules directlyadsorbed on the metal, as opposed to the electromagnetic effect, which extends acertain distance beyond the surface.
The recent progress in the SERS field can be summarized in three parts:SERS substrate, technique, theory and application.
Several procedures have been proposed for preparing suitable SERS activesupports. Noble metal (Ag, Au) colloids have been widely employed in SERS, sincethe aggregation of metal particles leads to the formation of aggregates withroughness and fractal morphology necessary to render intense Raman spectra[13, 14]. Among the methods employed to obtain metal colloids, the chemicalreduction of silver nitrate with citrate [15] produces a more uniform distribution ofparticle sizes. It was found [16] that the SERS intensity increases as the size of theAg particles becomes larger (average diameter about 50 nm). However, a furtherincrease of the particle size (100–130 nm) leads to lower SERS intensity signal.Thus, one of the advantages of metal colloids is the possibility to control and modifythe particle size and shape by choosing adequate experimental conditions [17].
One possible application of the silver colloid deposits in bacteria is theobtaining of intense SERS spectra [18] to probe the immediate biochemical

3 Spectroscopy on molecules of pharmaceutical and biological interest 831
environment near the metal cores. SERS spectra obtained in this way are particularlysensitive to one specific component from the cell wall that is riboflavin (orflavinadenine dinucleotide), which is a co-factor of major importance in a varietyof live-sustaining processes in living cell.
Recently there has been a renewed interest in the enhancement of isolatenanoparticles deposited on planar surfaces [19, 20]. Oldenberg et al. [21] obtaineda high enhancement factor in SERS by using gold nanoshell as a support. A goldnanoshell is a composite nanoparticle consisting of a dielectric core coated by athin metal shell, its peak plasmon resonance wavelength being determined by theratio of the core diameter to the shell thickness.
Lithography technique can be exploited to fabricate topographically predictableSERS substrates. In this case, a colloidal crystal monolayer of size-monodispersenanospheres is grown on a flat substrate, and then the desired nanoparticle materialis thermally evaporated through the nanosphere mask. Upon removing thenanospheres from the surface, homogenous arrays of truncated tetrahedralnanoparticles remain on the surface [22].
Nanostructure preparation via self-assembly rout offer a new possibility asSERS support with sufficient stable building blocks which have to be well-characterized and uniform in size and shape [23].
The occurrence of giant SERS cross section on colloids facilitated themeasurement of SER spectra of single molecule (SM) [24, 25]. Probably SM SERSwill offer new possibility to comprehend the mechanisms of enhancement in SERS.Kneipp et al. [24] have reported the detection of single molecule of crystal violetadsorbed on aggregated cluster of colloidal silver. They used near-infrared excitationwhich is not resonant with any intramolecular optical transitions of dye butefficiently excite the plasmons of the fractal aggregated silver colloids. Nie andEmory [25] combined surface and resonance enhancement (SERRS) to produce therequirement sensitivity to detect rhodamine 6G molecule adsorbed on the surfaceof a single particles. A small number of these particles showed extraordinary highenhancements and they have been labelled “hot” particles. Information from SMcan be obtained also from fluorescence spectra but SM SERS offer, by its vibrationalaspects, more details about structure of adsorbed molecule. SM spectroscopyillustrates high potential of SERS, not only for its high sensitivity, but also itscapability of characterizing the molecule orientation and dynamics.
In many cases is very important to know the orientation of the adsorbedmolecule with respect to the metal surface. Surface selection rules for Ramanscattering allow us to obtain such information [26, 27]. According to these rules,the vibrations of the adsorbed molecules, which have the polarizability tensorcomponent normal to the surface, will be preferentially enhanced.
In this work, we present a few of our recent results concerning SERSinvestigations on molecules of pharmaceutical and biological interest. Thefollowing question appears: Way SERS on pharmaceutical and biological relevant
832 T. Iliescu, M. Baia, D. Maniu 4
molecules? From pharmacological studies it is known that each drug is specific to acertain human organ in which it is adsorbed on some special centers. As a mimic ofthis adsorption process can be considered the adsorption of the molecules on ametal surface. In these investigations the silver surface serves as an artificialbiological interface [28]. Moreover, for a complete understanding of the action ofpotential drugs, such as our derivatives, it is very important to know if the structureof the adsorbed molecules is the same as that of the free species. On the other hand,the analysis of the SER spectra of biological molecules like -amino acids may leadto a better understanding of the interaction mechanism with other biologicalmolecules and of their biological activity on different physico-chemical conditions.
2. RAMAN AND SERS STUDY
For all molecular species discussed in the present work SER spectra wererecorded by using a Lee-Meisel [15] silver colloid as SERS support and employingvisible laser lines for excitation. The SER spectra of the -amino acids wereobtained with the 1064 nm excitation line by using also a solid SERS substrate.Prior to the SERS analyses complete vibrational investigations of the moleculeshave been carried out from a theoretical (ab initio and density functional theorycalculations (DFT) [29]) and experimental (IR and Raman spectroscopy) point ofview. The DFT calculations allow to obtain the spatial configuration of the molecule,the frequencies value and their assignment.
2.1. MOLECULES WITH ANTIBACTERIAL PROPERTIES
2.1.1. Acridine derivatives
9-phenylacridine [30] and 9-methyl acridine [31], as well as most acridinederivatives, have antibacterial properties being used in the treatment oftrichomonasis and protozoal diseases. Among the acridine derivatives we presenthere only SERS data for 9-methylacridine (9MA). Fig. 1A shows the SER spectraof 9MA at different pH values. At pH value lower than pKa value of 3.8, acridineexists as 9 methylacridinium ion (9MAH+) form while, in environments with pHhigher than the pKa value the neutral form of 9MA is present. These molecularspecies can be evidenced in SER spectra presented in Fig. 1A. Some of the bandsspecific to these molecular species can be observed in Fig. 1B. Thus the 1270,1354 and 1582 cm–1 bands, which are present in the SER spectrum at pH value of0.7, are assigned to the protonated 9MAH+ form, whereas the 1256, 1364 and1562 cm–1 bands are determined by the neutral 9MA form. The neutral form ischemisorbed on silver surface via nitrogen lone pair electrons, while the 9MAH+

5 Spectroscopy on molecules of pharmaceutical and biological interest 833
Fig. 1 – A) SER spectra of 7.5 10–4 M 9MA in silver sol solution containing 2.5 10–3 KCl at (a); pH0.7; (b); pH 1.1; (c) pH 7.8; (d) pH 12.9. Laser output: 488 nm, 150 mW. B) Details of the spectral changeshowed by the SER spectra of 9MA due to pH variation. The concentration and pH values are the same as
in Fig. 1A.
834 T. Iliescu, M. Baia, D. Maniu 6
forme a pair with chloride ions that is adsorbed on the metal surface. According toselection rules for SER spectra [26, 27], both neutral and cationic forms werefound to be perpendicular or at least tilted stance oriented with respect to the silversurface.
2.1.2. Rivanol
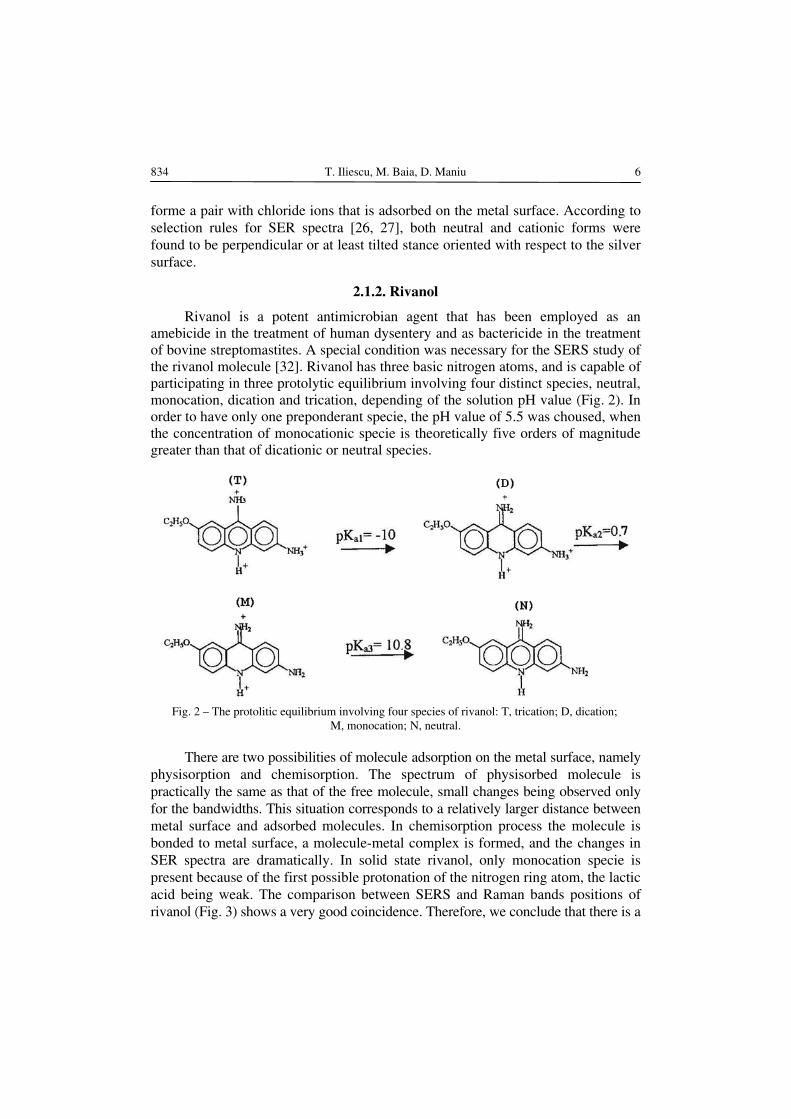
Rivanol is a potent antimicrobian agent that has been employed as anamebicide in the treatment of human dysentery and as bactericide in the treatmentof bovine streptomastites. A special condition was necessary for the SERS study ofthe rivanol molecule [32]. Rivanol has three basic nitrogen atoms, and is capable ofparticipating in three protolytic equilibrium involving four distinct species, neutral,monocation, dication and trication, depending of the solution pH value (Fig. 2). Inorder to have only one preponderant specie, the pH value of 5.5 was choused, whenthe concentration of monocationic specie is theoretically five orders of magnitudegreater than that of dicationic or neutral species.
Fig. 2 – The protolitic equilibrium involving four species of rivanol: T, trication; D, dication;M, monocation; N, neutral.
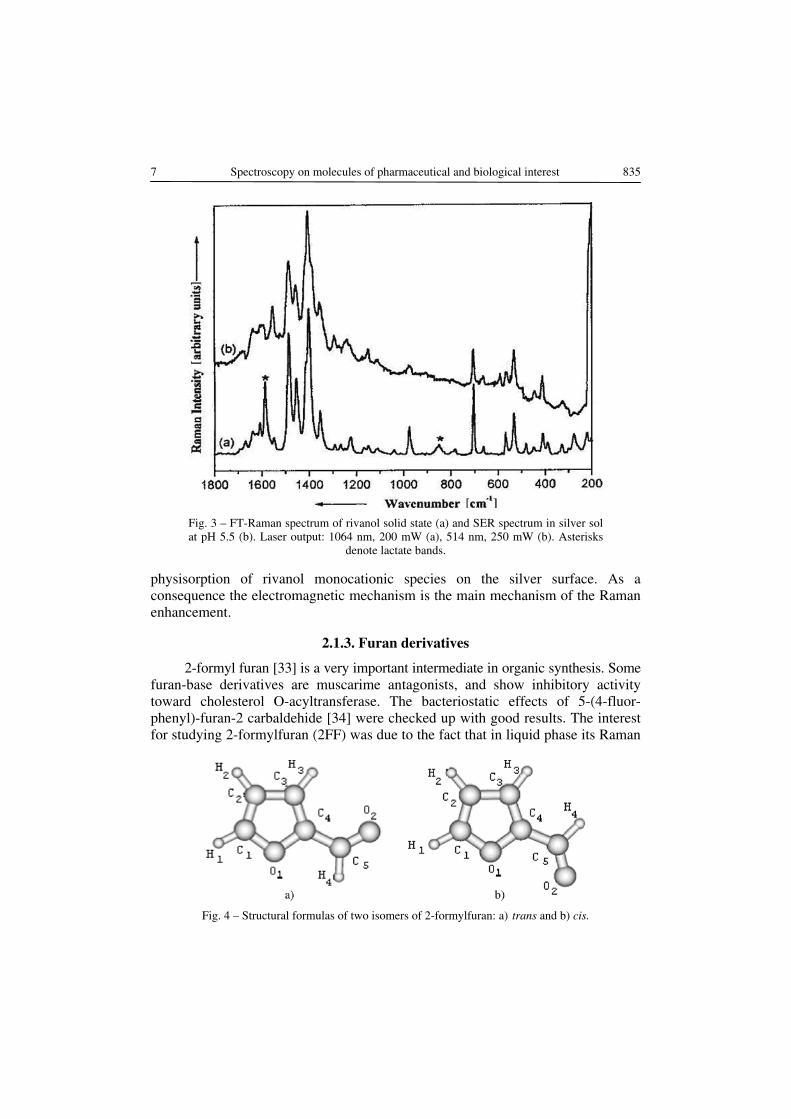
There are two possibilities of molecule adsorption on the metal surface, namelyphysisorption and chemisorption. The spectrum of physisorbed molecule ispractically the same as that of the free molecule, small changes being observed onlyfor the bandwidths. This situation corresponds to a relatively larger distance betweenmetal surface and adsorbed molecules. In chemisorption process the molecule isbonded to metal surface, a molecule-metal complex is formed, and the changes inSER spectra are dramatically. In solid state rivanol, only monocation specie ispresent because of the first possible protonation of the nitrogen ring atom, the lacticacid being weak. The comparison between SERS and Raman bands positions ofrivanol (Fig. 3) shows a very good coincidence. Therefore, we conclude that there is a
7 Spectroscopy on molecules of pharmaceutical and biological interest 835
Fig. 3 – FT-Raman spectrum of rivanol solid state (a) and SER spectrum in silver solat pH 5.5 (b). Laser output: 1064 nm, 200 mW (a), 514 nm, 250 mW (b). Asterisks
denote lactate bands.
physisorption of rivanol monocationic species on the silver surface. As aconsequence the electromagnetic mechanism is the main mechanism of the Ramanenhancement.
2.1.3. Furan derivatives
2-formyl furan [33] is a very important intermediate in organic synthesis. Somefuran-base derivatives are muscarime antagonists, and show inhibitory activitytoward cholesterol O-acyltransferase. The bacteriostatic effects of 5-(4-fluor-phenyl)-furan-2 carbaldehide [34] were checked up with good results. The interestfor studying 2-formylfuran (2FF) was due to the fact that in liquid phase its Raman
Fig. 4 – Structural formulas of two isomers of 2-formylfuran: a) trans and b) cis.

8836 T. Iliescu, M. Baia, D. Maniu
Fig.
5 –
A)
Ram
an s
pect
ra o
f 2F
F at
dif
fere
nt te
mpe
ratu
res
as in
dica
ted.
B)
FT-R
aman
(a)
and
SE
R s
pect
rum
(b)
of
2FF
insi
lver
sol
at p
H 6
. Las
er o
utpu
t: 10
64 n
m, 2
00 m
W (
a), 5
14 n
m, 2
00 m
W (
b).

9 Spectroscopy on molecules of pharmaceutical and biological interest 837
spectrum shows pairs of bands whose temperature and solvent dependence behaviorcan be interpreted in terms of cis-trans conformational equilibrium [33] (Fig. 4).
Density functional theory (DFT) calculations performed at the BPW91/6-311+G* and B3LYP/6-311+G* theoretical levels have been indicated that thetrans-isomer is more stable than the cis-isomer by 2.81 and 3.12 kJ mol–1,respectively. Raman spectra of 2FF at different temperatures are presented in Fig. 5A.
Theoretical H values obtained from DFT calculations 2.99 and 3.1 kJ mol–1
(BPW91, B3LYP) are very close to the experimental value H = 2.53 kJ mol–1
determined from the plots of logarithmic relative intensities of the band pairs1673/1692, 1477/1465 and 1396/1371 cm–1 of these isomers against reciprocaltemperature.
Anti and syn-form rotational isomers were also found to be present in the5-(4-fluor-phenyl)-furan-carbaldehyde as a derivative of 2FF [34]. The SERspectrum of 2FF in silver colloid is illustrated in Fig. 5B. The selective enhancementof vibrational modes in SER spectrum was used as a probe for the determination ofthe adsorbate mode of 2FF molecule on the silver surface. Thus, the band at 236 cm–1
assigned to the Ag-Cl– stretching mode present an asymmetryat low wavenumbers.This asymmetry can be determined by the contribution of the Ag-O stretchingmode. These observations suggest that 2FF molecules are adsorbed in the metalsurface through the oxygen atom. The enhancement of the band at 1157 cm–1
assigned to the C1O1C4 stretching mode (see Fig. 4) in the SER spectrum furtherdemonstrates the adsorption of 2FF molecules on the silver surface through the ringoxygen atom. The in plane ring deformation modes at 887 and 933 cm–1 and ringstretching modes at 1459, 1476 and 1570 cm–1 are enhanced also in SER spectrum,which suggest the perpendicular or least tilted orientation of 2FF molecules withrespect to the solver surface. The enhancement and the strong shift of the carbonylstretching mode present in SER spectrum at 1661 cm–1 suggest the existence of astrong interaction of between this group and silver surface and the perpendicularorientation of this bond with respect to the metal surface. Having in view thechanges in the peak position and of the relative intensities of the bands in SERspectrum by comparison to the normal Raman spectrum a chemisorption process ispresent in this case, 2FF molecules being bonded to the silver surface through boththe ring oxygen and the oxygen atom of the substituent group, the cis-form beingpreferred in the adsorbate state.
2.1.4. Potassium benzilpenicilin
Potassium benzylpenicillin (KBP) is a well-known component of the bigfamily of antibacterial drugs, its biological activity being due to the presence of thebeta-lactam-thiazoline ring system. The study of the interaction between metals andantibiotics, like benzylpenicillins, is important because of the metal strong influenceupon susceptibility of bacteria to penicillin in vitro. The structure of KBP molecule

838 T. Iliescu, M. Baia, D. Maniu 10
consists of amide, carbonyl and carboxylate groups, and phenyl, -lactam andthyazolidine rings. FT Raman spectra of polycrystalline KBP and its water solutionat pH value of 6 (resulted after dissolution) are illustrated in Fig. 6 [35]. A closeanalysis of Fig. 6 reveals no dramatic changes in Raman spectrum of the KBPsolution in comparison with the solid-state Raman spectrum beside the well-knowncharacteristic of the solution spectra concerning the broadening and change in thepeak position of the bands.
Fig. 6 – Raman spectra of the benzylpenicilin potassium salt: solid state (a)and solution (b).
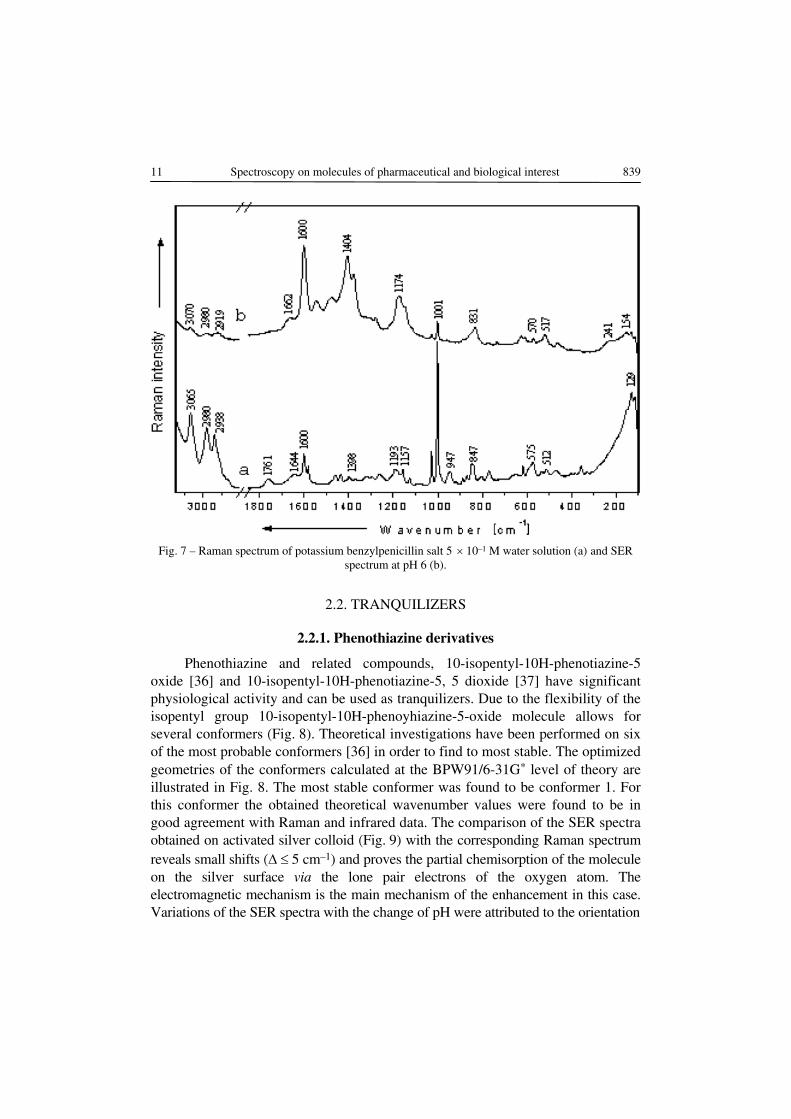
The SER spectrum of KBP at pH value of 6 compared with its solution Ramanspectrum at the same pH value is presented in Fig. 7. By inspecting Fig. 7 we observedramatic change in the relative intensities of some bands in the SER spectrum ascompared to the normal Raman spectrum. These spectral features confirm thechemisorption of KBP molecule through some of its constituent groups, while othergroups are located at relatively large distance from the metal surface and thereforetheir vibrations are not influenced by adsorption. The bonding of KBP molecule tothe silver surface can be realized through different atoms. Thus, sulfur atom canform a stable metal-sulfur bond. Moreover, the KBP molecule could be adsorbedon the silver surface either through the nitrogen atoms of the amide, carbonyl orcarboxylate groups, respectively.
According the prediction of surface selection rules and analyzing the intensityof the SERS bands, the adsorption of the KBP molecule on silver surface takes placein such a way that the phenyl, -lactam and thyazolidine rings are situated at largedistance to the silver surface and are oriented approximately perpendicular to it.For these groups, the electromagnetic mechanisms seem to be the main mechanism.
11 Spectroscopy on molecules of pharmaceutical and biological interest 839
Fig. 7 – Raman spectrum of potassium benzylpenicillin salt 5 10–1 M water solution (a) and SERspectrum at pH 6 (b).
2.2. TRANQUILIZERS
2.2.1. Phenothiazine derivatives
Phenothiazine and related compounds, 10-isopentyl-10H-phenotiazine-5oxide [36] and 10-isopentyl-10H-phenotiazine-5, 5 dioxide [37] have significantphysiological activity and can be used as tranquilizers. Due to the flexibility of theisopentyl group 10-isopentyl-10H-phenoyhiazine-5-oxide molecule allows forseveral conformers (Fig. 8). Theoretical investigations have been performed on sixof the most probable conformers [36] in order to find to most stable. The optimizedgeometries of the conformers calculated at the BPW91/6-31G* level of theory areillustrated in Fig. 8. The most stable conformer was found to be conformer 1. Forthis conformer the obtained theoretical wavenumber values were found to be ingood agreement with Raman and infrared data. The comparison of the SER spectraobtained on activated silver colloid (Fig. 9) with the corresponding Raman spectrumreveals small shifts ( 5 cm–1) and proves the partial chemisorption of the moleculeon the silver surface via the lone pair electrons of the oxygen atom. Theelectromagnetic mechanism is the main mechanism of the enhancement in this case.Variations of the SER spectra with the change of pH were attributed to the orientation

840 T. Iliescu, M. Baia, D. Maniu 12
Fig. 8 – Optimized geometries of six most probable conformers of 10-isopentyl-10H-phenothiazine-5-oxide. The differences between theenergy of the most stable conformer and energy of the conformers ob-tained at the BPW91-31G level of theory are indicated in parentheses.
Fig. 9 – SER spectra of 10-isopentyl-10H-phenothiazine-5-oxide compound in silvercolloid at different pH values, as indicated. Laser output: 514 nm, 200 mW.
change of the adsorbed molecule with respect to the silver surface. We assume that,at acidic pH, the molecules are oriented at the metal surface in such a way that thebenzene rings are preponderantly perpendicular to the surface (Fig. 10a). At alkaline

13 Spectroscopy on molecules of pharmaceutical and biological interest 841
pH, a reorientation of the molecules occurs, with the phenyl rings having a tiltedorientation with respect to the metal surface as suggested in Fig. 10b.
Fig. 10 – Schematic model for theadsorption geometry of 10-isopentyl- 10H-phenothiazine.
2.3. ANTI-INFLAMATORY DRUGS
2.3.1. Diclofenac sodium
Diclofenac sodium (DCFNa) is a salt of an aminophenyl acid and is a well-known representative of nonsteroidal anti-inflammatory drugs. Theoreticalcalculations (DFT and ab initio) have been performed on DCFNa conformers,presented in Fig. 11, to find the optimized structure and computed vibrationalwavenumbers of the most stable one [38]. The calculations performed on bothisomers demonstrate, in agreement with the experimental data on tetrahydrateDCFNa crystals, that the conformer 2 is energetically more stable by an energy
Fig. 11 – Optimized geometries of two conformational isomers of DCFNa obtainedat BPW91/6-31G* level of theory.

842 T. Iliescu, M. Baia, D. Maniu 14
difference of approximately 18 kJ/mol (RHF), 30 kJ/mol (BPW91) and 27 kJ/mol(B3LYP) respectively.
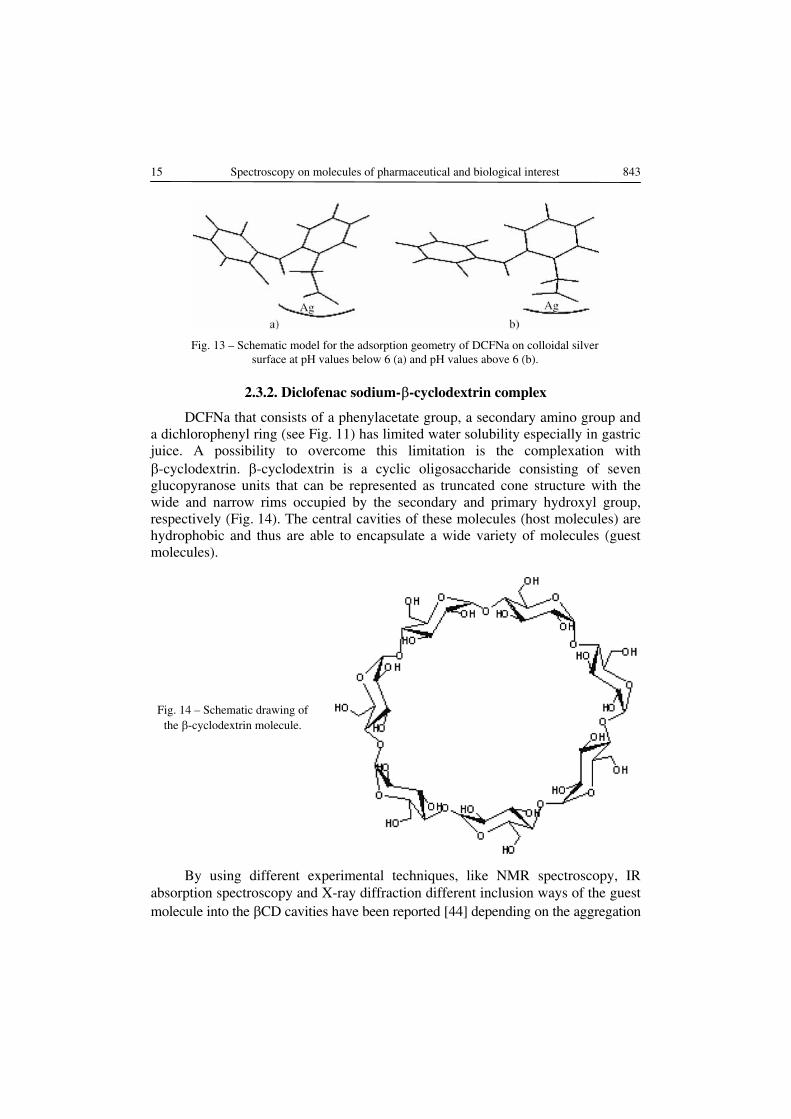
The calculated Raman intensities and wavenumber are in good agreementwith the experimental data. The absence of the carbonyl stretching band in the1800–1600 cm–1 spectral range confirms the presence of the carboxylate group inDCFNa specie in solid state. Good SER spectra were obtained in acidic and neutralenvironments indicating the chemisorption of the DCFNa molecule on the silversurface (Fig. 12). At all studied pH values the DCFNa molecule was bonded to thesilver surface through the lone pair oxygen electrons of the carboxylate group,which has a perpendicular or slightly tilted orientation with respect to the metalsurface. By analyzing the SER spectra at different pH values a change of the phenylring's orientation with respect to the metal surface from tilted close to flat to amore perpendicular one was concluded (Fig. 13).
Fig. 12 – FT-Raman spectrum of polycrystalline DCFNa (a) and SER spectra of DCFNaon silver colloid at pH 2 (b); pH 6 (c); pH 10 (d). Laser output: 1064 nm, 200 mW (a),
514 nm, 200 mW (b–d).
The elucidation of the adsorption of the DCFNa molecule can be considered astart point in the characterization of adsorption of the diclofenac sodium-cyclodextrin (DCFNa- CD) complex on the silver surface.
15 Spectroscopy on molecules of pharmaceutical and biological interest 843
Fig. 13 – Schematic model for the adsorption geometry of DCFNa on colloidal silversurface at pH values below 6 (a) and pH values above 6 (b).
2.3.2. Diclofenac sodium- -cyclodextrin complex
DCFNa that consists of a phenylacetate group, a secondary amino group anda dichlorophenyl ring (see Fig. 11) has limited water solubility especially in gastricjuice. A possibility to overcome this limitation is the complexation with
-cyclodextrin. -cyclodextrin is a cyclic oligosaccharide consisting of sevenglucopyranose units that can be represented as truncated cone structure with thewide and narrow rims occupied by the secondary and primary hydroxyl group,respectively (Fig. 14). The central cavities of these molecules (host molecules) arehydrophobic and thus are able to encapsulate a wide variety of molecules (guestmolecules).
Fig. 14 – Schematic drawing ofthe -cyclodextrin molecule.
By using different experimental techniques, like NMR spectroscopy, IRabsorption spectroscopy and X-ray diffraction different inclusion ways of the guestmolecule into the CD cavities have been reported [44] depending on the aggregation

844 T. Iliescu, M. Baia, D. Maniu 16
state and the preparation method of the DCFNa- CD complex. Different guest-hostcomplexes like 1:1, 1:2, 2:1 have been found [39, 40].
The different existence of the complex structure, determine us to examine theinteraction between the DCFNa and CD in solid state complex by using Ramanspectroscopy [41]. The support of this study was the existence of some spectralrange, where the Raman bands associated to atom group vibration directly involvedin guest-host molecules interaction are not overlapped (see Fig. 15).
Fig. 15 – FT-Raman spectra of CD (a); DCFNa (b); 1:1 DCFNa- CDcomplex (c); 1:1 DCFNa- CD physical mixture (d). Laser output: 1064 nm,
200 mW.
From Fig. 15 one can see that the Raman spectrum of the 1:1 physicalmixture closely resembles the sum of the individual spectra of the guest and hostmolecules. Furthermore, one can notice the absence of the Raman bands given by the
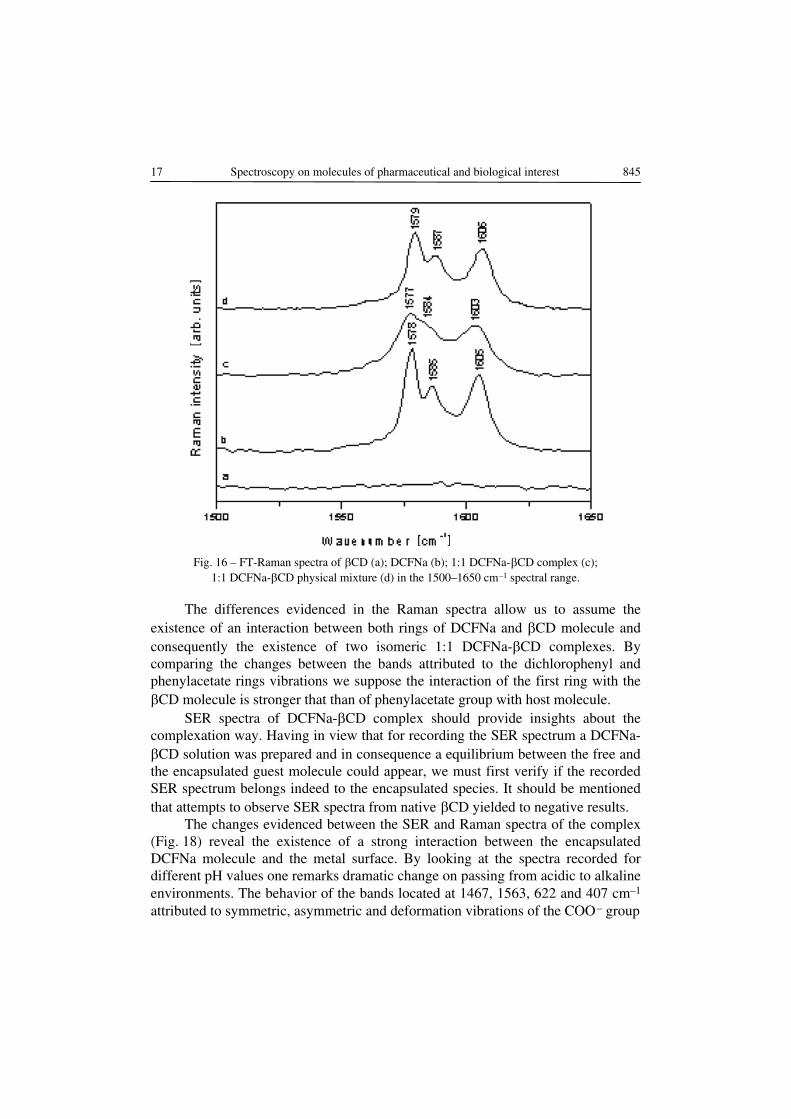
CD molecule vibrations in the following spectral ranges: 3050–3151, 1500–1650,1220–1300 and 1000–1100 cm–1. Fig. 16 presents detailed the spectral rangebetween 1500 and 1650 cm–1. The band at 1578 cm–1 was assigned to the O1C8C2
asymmetric stretching vibration (see Fig. 11), while the bands at 1585 and 1604 cm–1
were attributed to dichlorophenyl and phenyl rings stretching vibration, respectively.The corresponding Raman bands of the inclusion complex are broader and theirpeak positions are changed in comparison to the bands of pure DCFNa and indicatethe existence of the guest-host interaction. The deconvolutions of the bands fromFig. 16 done by using Lorentz functions are presented in Fig. 17.
17 Spectroscopy on molecules of pharmaceutical and biological interest 845
Fig. 16 – FT-Raman spectra of CD (a); DCFNa (b); 1:1 DCFNa- CD complex (c);1:1 DCFNa- CD physical mixture (d) in the 1500–1650 cm–1 spectral range.
The differences evidenced in the Raman spectra allow us to assume theexistence of an interaction between both rings of DCFNa and CD molecule andconsequently the existence of two isomeric 1:1 DCFNa- CD complexes. Bycomparing the changes between the bands attributed to the dichlorophenyl andphenylacetate rings vibrations we suppose the interaction of the first ring with the
CD molecule is stronger that than of phenylacetate group with host molecule.SER spectra of DCFNa- CD complex should provide insights about the
complexation way. Having in view that for recording the SER spectrum a DCFNa-CD solution was prepared and in consequence a equilibrium between the free and
the encapsulated guest molecule could appear, we must first verify if the recordedSER spectrum belongs indeed to the encapsulated species. It should be mentionedthat attempts to observe SER spectra from native CD yielded to negative results.
The changes evidenced between the SER and Raman spectra of the complex(Fig. 18) reveal the existence of a strong interaction between the encapsulatedDCFNa molecule and the metal surface. By looking at the spectra recorded fordifferent pH values one remarks dramatic change on passing from acidic to alkalineenvironments. The behavior of the bands located at 1467, 1563, 622 and 407 cm–1
attributed to symmetric, asymmetric and deformation vibrations of the COO– group

18846 T. Iliescu, M. Baia, D. Maniu
Fig.
17
– T
he f
it of
Ram
an b
ands
aro
und
1600
cm
–1 o
f D
CFN
a (a
) an
d D
CFN
a-βC
D c
ompl
ex (
b). T
he in
set p
rese
nts
the
band
s ch
arac
teri
stic
s.

19 Spectroscopy on molecules of pharmaceutical and biological interest 847
Fig. 18 – FT-Raman and SER spectra of DCFNa- CD complex at different pH valuesas indicated. Laser output: 1064 nm, 200 mW (a); 514 nm, 200 mW (b).
indicates that this group directly interacts with the silver surface. Enhancement andshift of the bands attributed to the COO– group vibrations evidenced in SERspectrum prove that in acidic pH the adsorption of the guest molecule on the silversurface is maintained through the lone pair electrons of the oxygen atom. In thespectral range around 1600 cm–1 one can notice the high intensity and the blue shiftof the band due to the stretching vibration of the dichlorophenyl ring (1590 cm–1),while the band given by the stretching vibration of phenylacetate ring appears as ashoulder at 1613 cm–1. By considering the spectral features evidenced in the SERspectrum recorded at pH 2 we assume that the isomeric form of the DCFNa- CDcomplex having the phenylacetate ring included into the CD cavity is preferentiallyadsorbed on the metal surface in acidic environments, the COO– group beingperpendicular or least tilted oriented with respect to silver surface. Furthermore, theenhancement of the bands at 1284 and 1180 cm–1 attributed to the rocking andbending vibrations of the CH group demonstrates that the dichlorophenyl ring istilted relative to the metal surface (Fig. 19a). In the SER spectrum recorded for pH6 the bands attributed to the CH stretching vibrations of phenylacetate ring present
848 T. Iliescu, M. Baia, D. Maniu 20
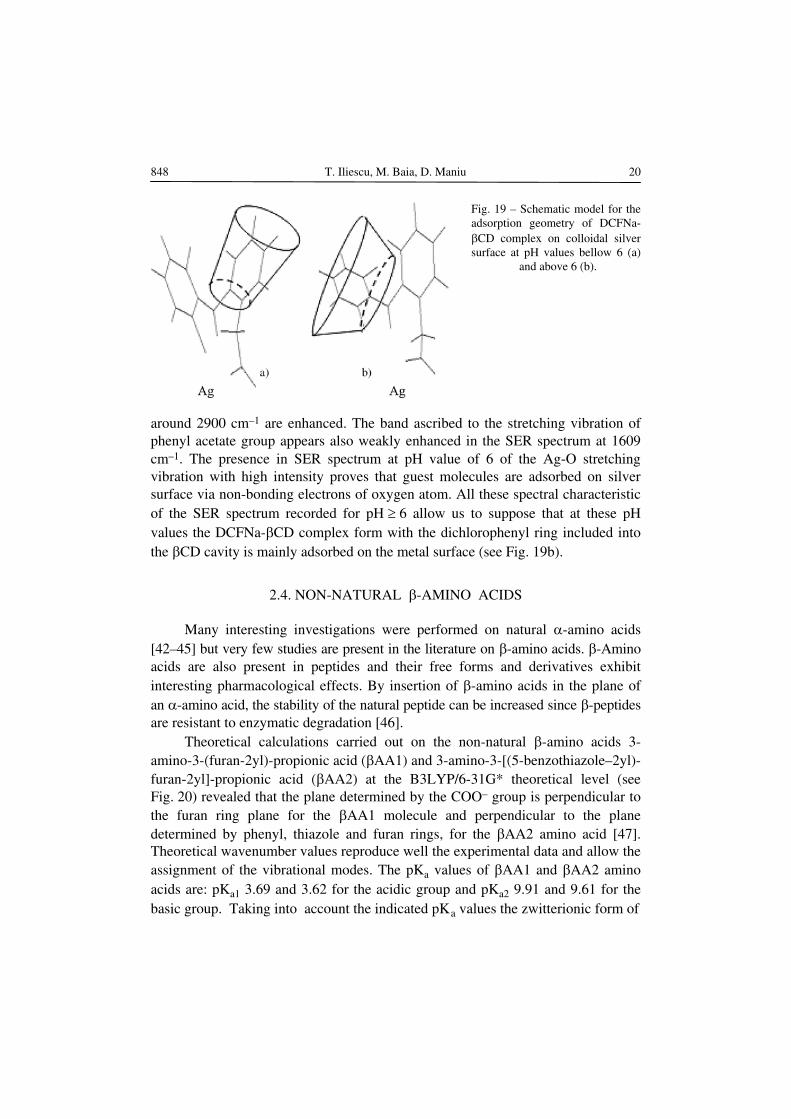
Fig. 19 – Schematic model for theadsorption geometry of DCFNa-
CD complex on colloidal silversurface at pH values bellow 6 (a) and above 6 (b).
around 2900 cm–1 are enhanced. The band ascribed to the stretching vibration ofphenyl acetate group appears also weakly enhanced in the SER spectrum at 1609cm–1. The presence in SER spectrum at pH value of 6 of the Ag-O stretchingvibration with high intensity proves that guest molecules are adsorbed on silversurface via non-bonding electrons of oxygen atom. All these spectral characteristicof the SER spectrum recorded for pH 6 allow us to suppose that at these pHvalues the DCFNa- CD complex form with the dichlorophenyl ring included intothe CD cavity is mainly adsorbed on the metal surface (see Fig. 19b).
2.4. NON-NATURAL -AMINO ACIDS
Many interesting investigations were performed on natural -amino acids[42–45] but very few studies are present in the literature on -amino acids. -Aminoacids are also present in peptides and their free forms and derivatives exhibitinteresting pharmacological effects. By insertion of -amino acids in the plane ofan -amino acid, the stability of the natural peptide can be increased since -peptidesare resistant to enzymatic degradation [46].
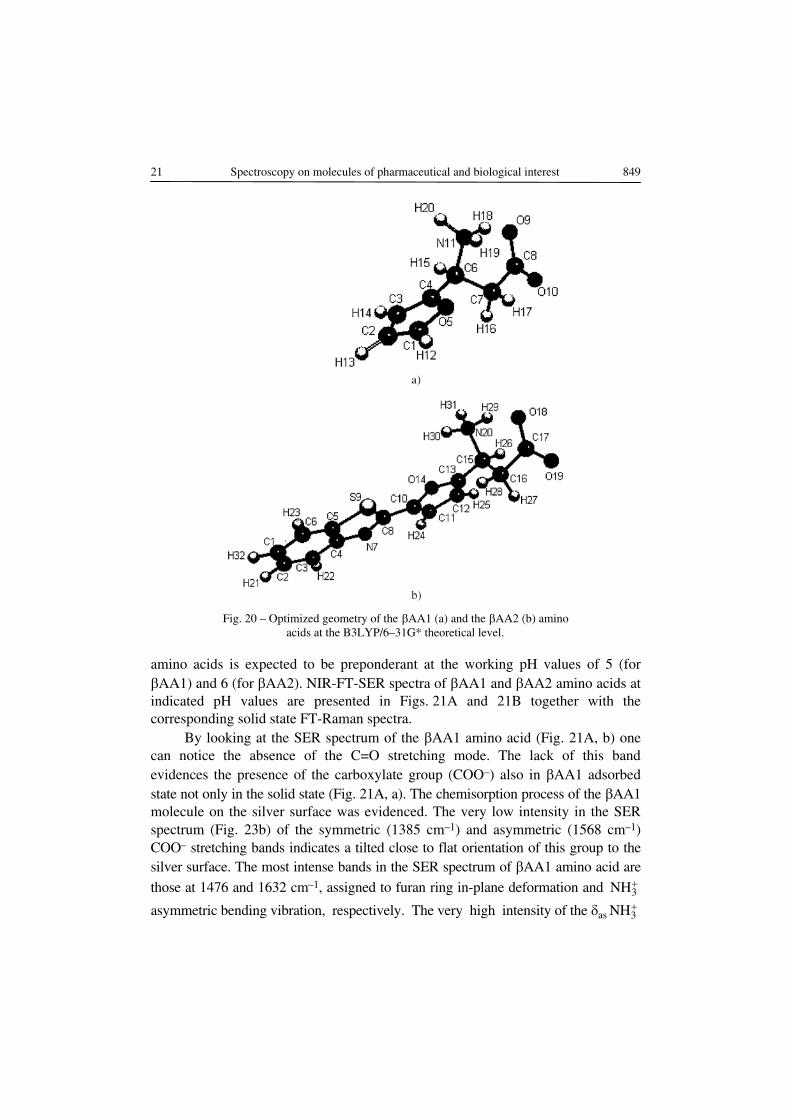
Theoretical calculations carried out on the non-natural -amino acids 3-amino-3-(furan-2yl)-propionic acid ( AA1) and 3-amino-3-[(5-benzothiazole–2yl)-furan-2yl]-propionic acid ( AA2) at the B3LYP/6-31G* theoretical level (seeFig. 20) revealed that the plane determined by the COO– group is perpendicular tothe furan ring plane for the AA1 molecule and perpendicular to the planedetermined by phenyl, thiazole and furan rings, for the AA2 amino acid [47].Theoretical wavenumber values reproduce well the experimental data and allow theassignment of the vibrational modes. The pKa values of AA1 and AA2 aminoacids are: pKa1 3.69 and 3.62 for the acidic group and pKa2 9.91 and 9.61 for thebasic group. Taking into account the indicated pKa values the zwitterionic form of
21 Spectroscopy on molecules of pharmaceutical and biological interest 849
Fig. 20 – Optimized geometry of the AA1 (a) and the AA2 (b) aminoacids at the B3LYP/6–31G* theoretical level.
amino acids is expected to be preponderant at the working pH values of 5 (forAA1) and 6 (for AA2). NIR-FT-SER spectra of AA1 and AA2 amino acids at
indicated pH values are presented in Figs. 21A and 21B together with thecorresponding solid state FT-Raman spectra.
By looking at the SER spectrum of the AA1 amino acid (Fig. 21A, b) onecan notice the absence of the C=O stretching mode. The lack of this bandevidences the presence of the carboxylate group (COO–) also in AA1 adsorbedstate not only in the solid state (Fig. 21A, a). The chemisorption process of the AA1molecule on the silver surface was evidenced. The very low intensity in the SERspectrum (Fig. 23b) of the symmetric (1385 cm–1) and asymmetric (1568 cm–1)COO– stretching bands indicates a tilted close to flat orientation of this group to thesilver surface. The most intense bands in the SER spectrum of AA1 amino acid arethose at 1476 and 1632 cm–1, assigned to furan ring in-plane deformation and 3NH
asymmetric bending vibration, respectively. The very high intensity of the as 3NH

22850 T. Iliescu, M. Baia, D. Maniu
Fig.
21
– A
) NIR
-FT
Ram
an (a
) and
NIR
-FT
SE
R s
pect
ra (b
), pH
5, c
= 1
.5 ×
10–3
M, o
f βA
A1
amin
o ac
id. L
aser
out
put:
a) 1
064
nm,
30 m
W, b
) 10
64 n
m, 3
80 m
W. B
) N
IR-F
T R
aman
(a)
and
NIR
-FT
-SE
R s
pect
ra in
silv
er s
ol (
b), p
H 6
, c =
5 ×
10–4
, of βA
A2
amin
oac
id. L
aser
out
put:
a) 1
064
nm, 7
0 m
W, b
) 10
64 n
m, 4
00 m
W.
23 Spectroscopy on molecules of pharmaceutical and biological interest 851
vibration in the SER spectrum relative to that of the furan ring in-planedeformation mode (1476 cm–1) indicates the proximity of this group on silversurface and their strong interaction.
According to surface selection rules we propose the tilted close to perpendicularorientation of the furan ring on the metal surface. The presence in the SERspectrum of the CH ring in-plane deformation mode at 1023 cm–1 reinforces theproposed orientation. This orientation of the adsorbed molecule presumes theproximity of 3NH group to the silver surface and explains the high intensity of the
as 3NH (1632 cm–1) band. In the FT-Raman spectrum of the solid state AA2
amino acid (Fig. 21B, a) one can observe the absence of the band specific to 3NHbending mode (around 1630 cm–1), which is probably determined by the presenceof the strong intramolecular hydrogen bonds. In the solid state FT-Raman spectrumof the corresponding chlorohydrate (not shown here), in which 3NH group ispresent, this band was observed at 1628 cm–1. FT-Raman spectrum of the AA2amino acid sodium salt shows in this spectral region a band at 1632 cm–1 specificto NH2 group. The presence of the band at 1628 cm–1 in the SER spectrum at pHvalue of 6 (Fig. 21B, b) indicates that in the adsorbed state of the AA2 moleculethe intermolecular hydrogen bonds are weaker than in the solid state form.According to surface selection rules the strong intensities of the bands assigned tothe in-plane deformation modes of phenyl, thiazole and furan rings (1519, 1579,1593 cm–1) and CH phenyl and furan ring in-plane deformation vibrations (1027,1237 and 1469 cm–1) imply both the proximity of the rings plane to the silversurface and their strong interaction with the surface as well as the perpendicularorientation of the rings plane with respect to the surface. The COO– symmetricstretching vibration is present in the SER spectrum as a weak contribution to the1396 cm–1 band. Having in view the geometry of the AA2 molecule (see Fig. 20b)in which rings plane and the COO– group are perpendicular to each other, we supposethat the COO– group is approximately parallel to the silver surface.
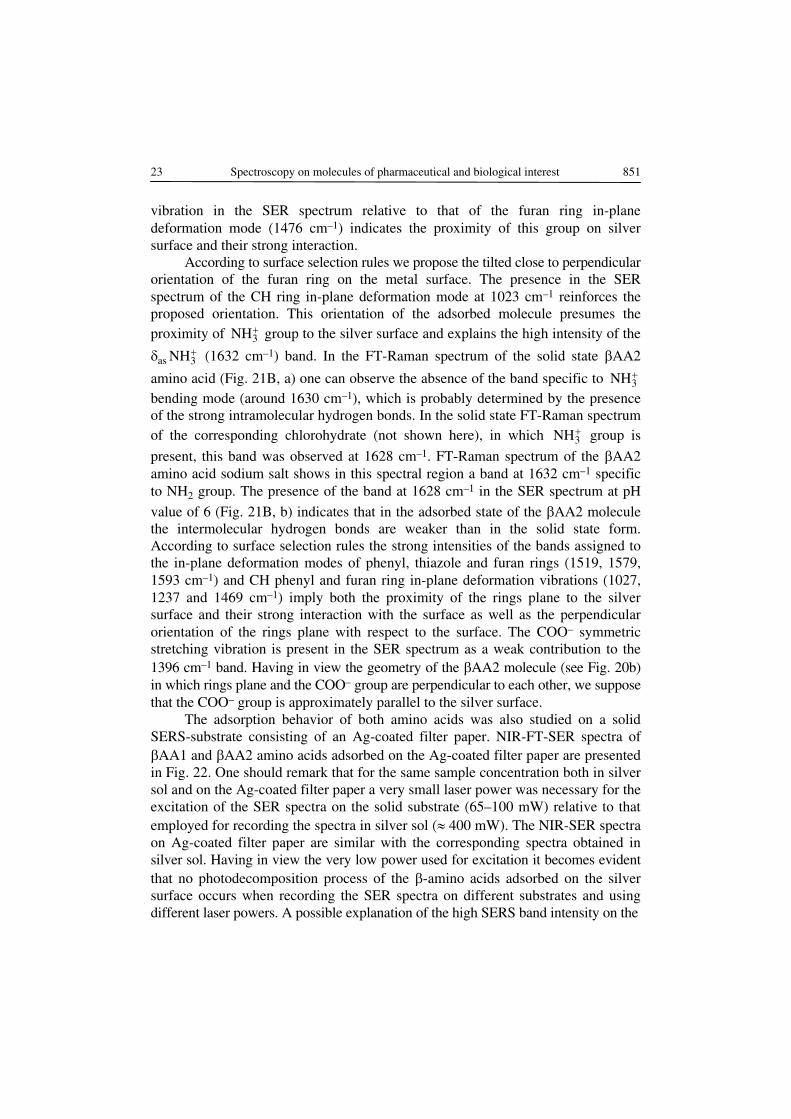
The adsorption behavior of both amino acids was also studied on a solidSERS-substrate consisting of an Ag-coated filter paper. NIR-FT-SER spectra of
AA1 and AA2 amino acids adsorbed on the Ag-coated filter paper are presentedin Fig. 22. One should remark that for the same sample concentration both in silversol and on the Ag-coated filter paper a very small laser power was necessary for theexcitation of the SER spectra on the solid substrate (65–100 mW) relative to thatemployed for recording the spectra in silver sol ( 400 mW). The NIR-SER spectraon Ag-coated filter paper are similar with the corresponding spectra obtained insilver sol. Having in view the very low power used for excitation it becomes evidentthat no photodecomposition process of the -amino acids adsorbed on the silversurface occurs when recording the SER spectra on different substrates and usingdifferent laser powers. A possible explanation of the high SERS band intensity on the
852 T. Iliescu, M. Baia, D. Maniu 24
Fig. 22 – NIR-FT-SER spectra of AA1 (a) and AA2 (b) amino acid adsorbed onAg-coated filter paper. Laser output 1064 nm: a) 65 mW, b) 100 mW.
solid support could be considered the existence of “hot area”, where giant electricfields are known to appear.
3. CONCLUSIONS
Throughout of the review the results of our SERS investigations on a fewrepresentative molecules with antibacterial properties (9-methyl acridine, rivanol,2-formyl furan and its derivatives, and potassium benzylpenicillin), tranquilizant(phenothiazine derivatives) and anti-inflammatory effects (diclofenac sodium anddiclofenac sodium- -cyclodextrin complex) as well as on some non natural -aminoacids have been presented. In order to understand the adsorption behavior of themolecules on the colloidal silver particles detailed vibrational investigations byusing IR and Raman spectroscopy in conjunction with theoretical calculations werepreviously performed. The results of theoretical calculations established if necessarythe most stable conformation of the molecular species and provided the theoreticalwavenumber values employed for the assignment of the vibrational modes. Theanalyses of the SERS spectra provided information concerning the structure of theadsorbed species and their orientation relative to the metal surface. Furthermore,the pH influence on the adsorption behaviour of the investigated molecules has
25 Spectroscopy on molecules of pharmaceutical and biological interest 853
been monitored. It was found that most of the investigated species are chemisorbedon the silver surface, the physisorption process beeing observed only for therivanol molecules and for some constituent part of complex molecules.
Moreover, it was shown that the SERS technique is able to discriminatebetween the possible ways of complexation of DCFNa into the -cyclodextrin hostmolecule cavities. These results prove that SERS is a versatil tool in elucidating theencapsulation way of different drugs into the cavities of host molecules, whichobviously improve the drug qualities. On the other hand, the results of the SERSinvestigations of the non natural -amino acids could be considered preliminarystudies in establishing their complex interaction mechanism with peptides.
REFERENCES
1. M. Fleischmann, P. J. Hendra, A. J. Mequillin, Raman spectra of pyridine adsorbed at a silverelectrode, Chem. Phys. Lett., 26, 163 (1974).
2. R. P. Van Duyne, Chemical and Biomedical Applications of Lasers, Vol. IV, ed. by C. B. Moore,Academic Press, New York, 1979, p. 101.
3. R. K. Chang, T. E. Furtak (Eds.), Surface Enhanced Raman Scattering, Plenum Press, NewYork, 1982.
4. T. M. Citton, In: Surface and interfacial Aspects of Biological Polymers, Vol. 2, ed. byJ. Andrde, Plenum Press, New York, 1985, p. 161.
5. M. Moskovits, Surface-enhanced spectroscopy, Rev. Mod. Phys., 57, 783 (1985).6. T. M. Cotton, In Spectroscopy of Surfaces, ed. by R. J. Clark and R. E. Hester, John Wiley and
Sons, Chichester, 1988, p. 91.7. I. R. Nabiev, K. K. Sokolov, M. Manfait, In: Biomolecular Spectroscopy, Ed. by R. J. H. Clark
and R. E. H Hester, John Wiley and Sons, Chichester, 1993, p. 267.8. I. R. Nabiev, M. Manfait, In: Biomedical Application of Spectroscopy, ed. by R. J. H. Clark and
R. E. H Hester, John Wiley and Sons, Chichester, 1996, p. 48.9. A. Otto, I. Mrozek, H. Grabhorn, W. Akemann, Surface –enhanced Raman scattering, J. Phys.
Condes. Matter, 4, 1143 (1992).10. J. I. Gesten, A. Nitzan, Electromagnetic theory of enhancement Raman scattering by molecules
adsorbed on rough surface, J. Chem. Phys., 73, 3023 (1980).11. J. I. Gesten, A. Nitzan, Photophysics and photochemistry near surface and small particles, Surf.
Sci., 158, 165 (1985).12. M. Inoue, K. Ohtaka, Enhanced Raman Scattering by metal spheres I: Cluster effects, J. Phys. Soc.
Jpn., 52, 3852 (1989).13. M. G. Albrecht, J. A. Creighton, Anomalously intense Raman spectra of pyridine at a silver
electrode, J. Am. Chem. Soc., 99, 5215 (1977).14. J. A. Sanchez-Gil, J. V. Garcia-Ramos, Calculation of the electromagnetic enhancement in surface
enhanced Raman scattering on random self-affine fractal metal surfaces, J. Chem. Phys., 108,317 (1998).
15. P. C. Lee, D. Meisel, Adsorption and surface-enhanced Raman of dyes on silver and gold sols,J. Phys. Chem., 86, 3991 (1982).
16. L. Rivas, S. Sanchez-Cortez, J. V. Garcia-Ramos, G. Marcillo, Growth of Silver colloidalParticles Obtained by Citrate Reduction to Increase the Raman Enhancement Factor,Langmuir, 17, 574 (2001).

854 T. Iliescu, M. Baia, D. Maniu 26
17. T. S. Ahmadi. Z. L. Wang, T. C. Green, A. Henglein, M. A. El-Sayed, Shape-ControlledSynthesis of Colloidal Platinum Nanoparticles, Science, 272, 1924 (1996).
18. S. E. Efrima, in: B. E. Conway, R. White, O. M. Bockris (Eds.), Modern Aspects ofElectrochemistry, Vol. 16, Plenum Press, New York, 1985, p. 253.
19. S. R. Emory, S. Nie, Near-Field Surface-Enhanced Raman Spectroscopy on single Nanoparicles,Anal. Chem., 69, 2631 (1997).
20. B. Vlckova, X. J. Gu, D. P. Tsai, M. Moskovits, A Microscopic Surface-Enhanced Raman Studyof a single Adsorbate-Covered Colloidal Silver Aggregate , J. Phys. Chem., 100, 3169 (1996).
21. S. J. Oldenberg. S. L. Westcott, R. D. Averitt, N. J. Halas, Surface enhanced Raman scattering inthe near infrared using metal nanoshell substrates, J. Chem. Phys., 111, 4729 (1999).
22. C. L. Haynes, A. J. Haes, R. P. Van Duyne, Nanosphere Lithography: Synthesis and Applicationof Nanoparticles with Inherently Anisotropic Structures and Surface Chemistry, Mat. Res.Soc. Symp. Proc. 635, C6.3/1–C6.3/6 (2001).
23. M. Brust, C. J. i Kely, Some recent advances in nanostructure preparation from gold and silverparticles: a short topical review, Colloids and Surfaces, A Physicochemical and EngineeringAspects, 202, 175 (2002).
24. K. Kneipp, Y. Wang, H. Kneipp, L. T. Perlman, I. Itzkan, R. R. Dasari, M. S. Feld, Single MoleculeDetection Using Surface-Enhanced Raman Scattering (SERS), Phys. Rev. Lett., 78, 1667 (1997).
25. S. M. Nie, S. R. Emory, Probing single molecules and single nanoparticles by surface-enhancedRaman scattering, Science, 275, 1102 (1997).
26. J. A. Chreighton, Surface Raman electromagnetic enhancement factors for molecules at the surfaceof small isolated metal spheres: The determination of adsorbate orientation from SERSrelative intensities, Surf. Sci. 124, 209 (1983).
27. M. Moskovits, D. P. DiLella, Surface-enhanced Raman spectroscopy of benzene and benzene d6,J. Chem. Phys., 73, 6068 (1980).
28. C. G. Dryhusrst, Electrochemistry of Biological Molecules, Academic Press, New York, 1977,p. 473.
29 J. Frisch, G. W. Trucks, H. B. Schlegel, G. E. Scuseria, M. A. Robb, J. R. Cheeseman,V. G. Zakrzewski, J. A. Jr. Montgomery, R. E. Stratmann, J. C. Burant, S. Dapprich,J. M. Millam, A. D. Daniels, K. N. Kudin, M. C. Strain, O. Farkas, J. Tomasi, V. Barone,M. Cossi, R. Cammi, B. Mennucci, C. Pomelli, C. Adamo, S. Clifford, J. Ochterski,G. A. Petersson, P. Y. Ayala, Q. Cui, K. Morokuma, D. K. Malick, A. D. Rabuck,K. Raghavachari, J. B. Foresman, J. Ciolowski, J. V. Ortiz, B. B. Stefanov, G. Liu, A. Liashenko,P. Piskorz, I. Komaromi, R. Gomperts, R. L. Martin, D. J. Fox, T. Keith, M. A. Al-Laham,C. Y. Peng, A. Nanayakkara, C. Gonzales, M. Challacombe, P. M. W. Gill, B. Johnson,W. Chen, M. W. Wong, J. L. Andres, M. Head-Gordon, E. S. Repogle, J. A. Pople, Gaussian98, Revision A7, Gaussian Inc., Pittsburgh, PA 1998.
30. Iliescu, I. Marian, R. Misca, V. Smarandache, Surface-Enhanced Raman spectroscopy of 9-phenylacridine on silver sol, Analyst, 119, 567 (1994).
31. T. Iliescu, M. Vlassa, M. Caragiu, I. Marian, S. Astilean, Raman study of 9-methylacridine adsorbrdon silver sol, Vibr. Spectrosc., 8, 451 (1995).
32. T. Iliescu, S. Cinta, W. Kiefer, FT Raman and SERS spectra of rivanol in silver sol Talanta, 53,121 (2000).
33. T. Iliescu, M. Bolboaca, R. Pacurariu, D. Maniu, W. Kiefer, Raman, SERS and DFT studies of 2-formyl-furan, J. Raman Spectrosc., 34, 705 (2003).
34. T. Iliescu, F. D. Irimie, M. Bolboaca, Cs. Paizs, W. Kiefer, Surface enhanced Raman Spectroscopyof 5-(4-fluor-phenyl)-furan—carbaldehide adsorbed on silver sol, Vibr. Spectrosc., 29, 235(2002).
35. T. Iliescu, M Baia, I. Pavel, Raman and SERS investigation of potassium benzylpenicilin, J. RamanSpectrosc. 37, 318 (2006).
27 Spectroscopy on molecules of pharmaceutical and biological interest 855
36. M. Bolboaca, T. Iliescu, Cs. Paizs, F. D. Irimie, W. Kiefer, Raman, SERS in combination withab-initio and DFT calculation on 10-isopropyl-10H-phenothiazine-5 oxide, J. Phys. Chem., A107, 1811 (2003).
37. M. Bolboaca, T. Iliescu, W. Kiefer, Infrared absorption, Raman, and SERS investigations inconjunction with theoretical simulations on a phenothiazine derivatives, Chem. Phys., 298, 87(2004).
38. T. Iliescu, M. Baia, W. Kiefer, FT-Raman, surface-enhanced Raman spectroscopy and theoreticalinvestigations of diclorofenac sodium, Chem. Phys., 298, 167 (2004).
39. D. V. Whittaker, L. J. Penkler, L. A. Glintenkamp, B. van Oudtshoorn, P. L. Wessels, In: I. Szejtli,L. Szente (Eds.), Proceedings of Cyclodextrins, Kluwer, Academic Publishers, 1996, p. 377.
40. M. R. Caira, V. J. Griffth, L. R. Nassimbeni, B. van Oudtshoorn, Synthesis and X-Ray CrystalStructure of -Cyclodextrin Diclofenac Sodium Undecahydrata, a -CD Complex with aUnique Crystal Packing Arrangement, J. Chem. Soc. Chem. Commun., 9, 1061 (1994).
41. T. Iliescu, M. Baia, V. Miclaus, A Raman spectroscopic study of the diclofenac sodium-betacyclodextrin, European J. Pharma. Sci., 22, 487 (2004).
42. G. D. Chumakovm R. G. Efremov, I. R. Nabiev, Surface-enhanced Raman spectroscopy ofbiomolecules. Part I – water soluble proteins, dipeptides and amino acids, J. Raman. Spectrosc.,21, 43 (1990).
43. T. Watanabe, H. Moedo, Adsorption-controlled redox activity. Surface-enhanced Ramaninvestigation of cystine versus cysteine on solver electrodes , J. Phys. Chem., 93, 3258 (1989).
44. X. Dou, Y. M. Joung, Z. Q. Cao, Y. Ozaki, Surface-Enhanced Raman Scattering of Biomoleculeson Metal Colloid II. Effects of Aggregation of Gold Colloid and Comparison of Effects of pHof Glicine Solution between Gold and Siver Colloids, Appl. Spectrosc., 53, 1440 (1999).
45. E. Podstawka, Y. Ozaki, L. M. Proniewcz, Surface-Enhanced Raman Spectroscopy Investigationof Amino Acids and Their Homodipeptides Adsorbed on Colloidal Silver, Appl. Spectrosc., 58,570 (2004).
46. F. Fülop. The Chemistry of 2-Amino cycloalkanecarbixilic Acids , Chem. Rev., 101, 2181 (2001).47. T. Iliescu, D. Maniu, V. Chis, F. D. Irimie, Cs. Paizs, M. Tosa, NIR surface enhanced Raman
spectroscopy and band assignment by DFT calculations of non-natural beta-amino acidsChem. Phys., 310, 189 (2004).