raman chapter 18 total - islamic university of...
TRANSCRIPT

١
١
RAMAN SPECTROSCOPY
CHAPTER 18 Prof. Dr. Nizam M. ElProf. Dr. Nizam M. El--AshgarAshgarChemistry DepartmentChemistry DepartmentIslamic University of GazaIslamic University of Gaza
Ch 18Raman Spectroscopy
• When radiation passes through a transparent medium,the species present scatter a fraction of the beam in alldirections.
• In 1928, the Indian physicist C. V. Raman discoveredthat:
- The visible wavelength of a small fraction of theradiation scattered by certain molecules differs fromthat of the incident beam.
- Furthermore that the shifts in wavelength depend uponthe chemical structure of the molecules responsible forthe scattering.

٢
Sir Chandrashekhara Venkata Raman• November 7, 1888-November
21, 1970• Won the Noble Prize in 1930
for Physics• Discovered the "Raman
Effect"• Besides Discovering the
Raman Effect, He studied extensively in X-Ray Diffractions, Acoustics, Optics, Dielectrics, Ultrasonics, Photo electricity, and colloidal particles.
Raman Spectroscopy
• The theory of Raman scattering shows that thephenomenon results from the same type of quantizedvibrational changes that are associated with infraredabsorption.
• Thus, the difference in wavelength between theincident and scattered visible radiation corresponds towavelengths in the mid-infrared region.
• The Raman scattering spectrum and infraredabsorption spectrum for a given species oftenresemble one another quite closely.
٣
Raman Spectroscopy
• An important advantage of Raman spectra overinfrared lies in the fact that water does not causeinterference; indeed, Raman spectra can be obtainedfrom aqueous solutions.
• In addition, glass or quartz cells can be employed, thusavoiding the inconvenience of working with sodiumchloride or other atmospherically unstable windowmaterials.
THEORY OF RAMAN SPECTROSCOPY
• Raman spectra are acquired by irradiating a sample witha powerful laser source of visible or near-infraredmonochromatic radiation.
• During irradiation, the spectrum of the scattered radiationis measured at some angle (often 90 deg) with a suitablespectrometer.
• At the very most, the intensities of Raman lines are 0.001% of the intensity of the source; as a consequence, theirdetection and measurement are somewhat more difficultthan are infrared spectra.

٤
7
Light Scattering Phenomenon
• When radiation passes through a transparentmedium, the species present in that mediumscatter a fraction of the beam in all directions.
٥
9
Scattering of Radiation
The fraction of radiation transmitted at all angles from itsoriginal path.Expalanation:Transmission of radiation in matter can be pictured as:• A momentary retention of the radiant energy by atoms, ions, or
molecules followed by reemission of the radiation in alldirections as the particles return to their original state.
• With atomic or molecular particles that are small relative to thewavelength of the radiation, destructive interference removesmost but not all of the reemitted radiation except the radiationthat travels in the original direction of the beam; the path of thebeam appears to be unaltered as a consequence of theinteraction.
Careful observation, however, reveals that:A very small fraction of the radiation is transmitted at all angles from the
original path and that the intensity of this scattered radiation increases with particle size.
Types of Scattering:• Rayleigh scattering
Scattering by molecules or aggregates of molecules with dimensions significantly smaller than the wavelength of the radiation.
Its intensity is proportional to:- The inverse fourth power of the wavelength.- The dimensions of the scattering particles.• The square of the polarizability of the particles.• An everyday manifestation of Rayleigh scattering is the blue color of
the sky, which results from greater scattering of the shorter wavelengths of the visible spectrum.
٦
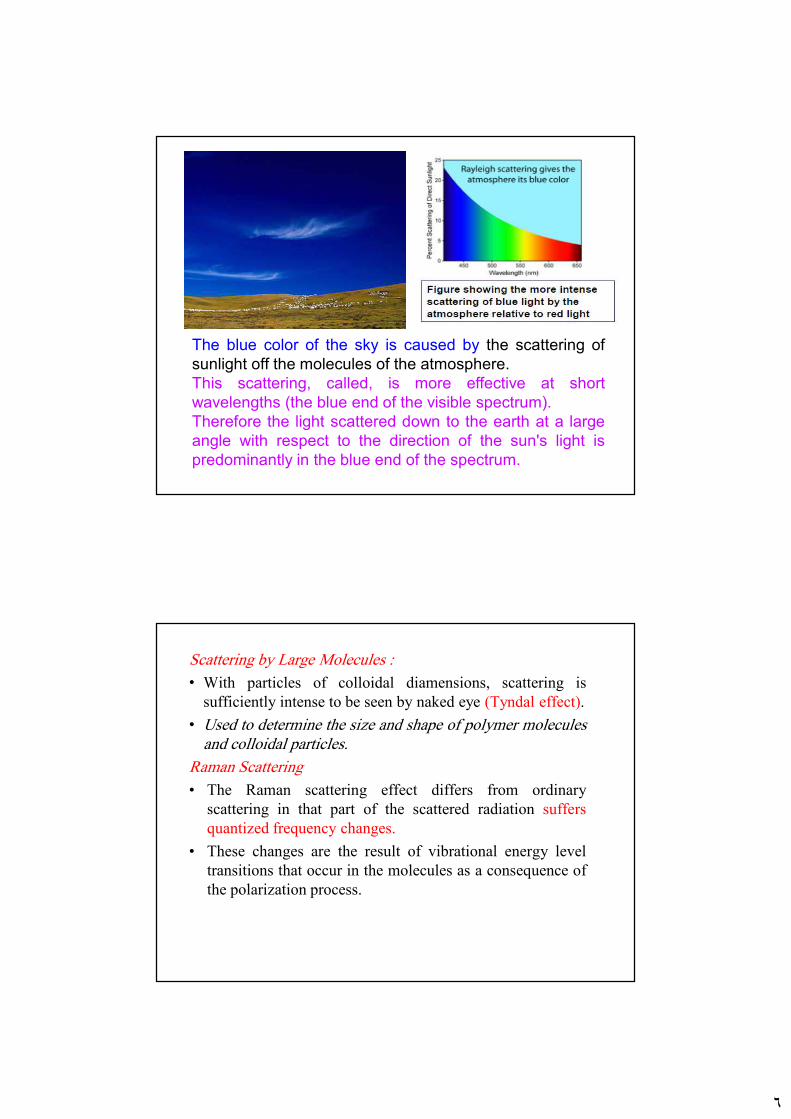
The blue color of the sky is caused by the scattering ofsunlight off the molecules of the atmosphere.This scattering, called, is more effective at shortwavelengths (the blue end of the visible spectrum).Therefore the light scattered down to the earth at a largeangle with respect to the direction of the sun's light ispredominantly in the blue end of the spectrum.
Scattering by Large Molecules :• With particles of colloidal diamensions, scattering is
sufficiently intense to be seen by naked eye (Tyndal effect).• Used to determine the size and shape of polymer molecules
and colloidal particles.Raman Scattering• The Raman scattering effect differs from ordinary
scattering in that part of the scattered radiation suffersquantized frequency changes.
• These changes are the result of vibrational energy leveltransitions that occur in the molecules as a consequence ofthe polarization process.
٧
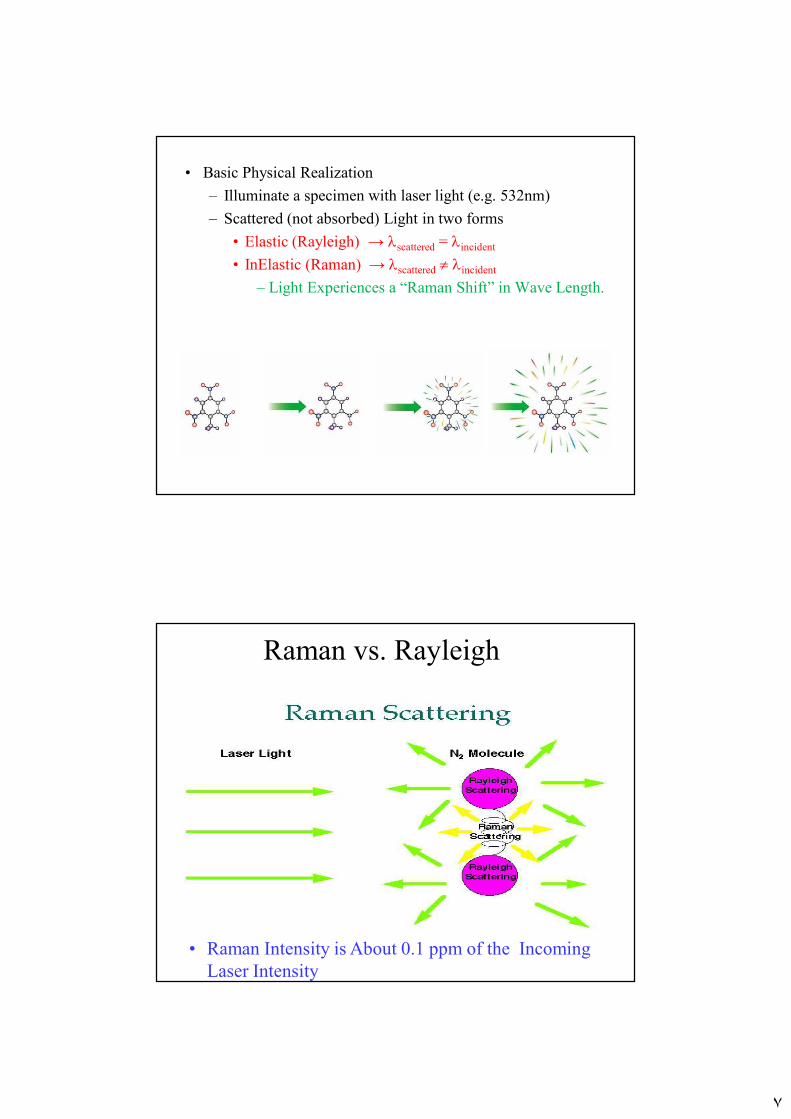
• Basic Physical Realization– Illuminate a specimen with laser light (e.g. 532nm)– Scattered (not absorbed) Light in two forms
• Elastic (Rayleigh) → λscattered = λincident
• InElastic (Raman) → λscattered ≠ λincident
– Light Experiences a “Raman Shift” in Wave Length.
Raman vs. Rayleigh
• Raman Intensity is About 0.1 ppm of the Incoming Laser Intensity

٨
• Inelastic Light Scattering Mechanisms• Raman Shift Can be:
– To Longer WaveLengths (Stokes Scattering)• Loses Energy – Predominant Raman Shift
– To Shorter WaveLengths (AntiStokes Scattering)• Gains Energy – Subordinate Raman Shift
Raman Stokes Scattering Raman AntiStokes Scattering
Representation in terms of energy levels:
Arrow up = laser photon in; Arrow down = Raman scattering out

٩
Excitation of Raman Spectra: Summery
A Raman spectrum can be obtained by irradiating a sample of carbon tetrachloride (Fig 18-2) with an intense beam of an argon ion laser having a wavelength of 488.0 nm (20492 cm-1). The emitted radiation is of three types: 1. Stokes scattering
2. Anti-stokes scattering
3. Rayleigh scattering
١٠
Excitation of Raman Spectra
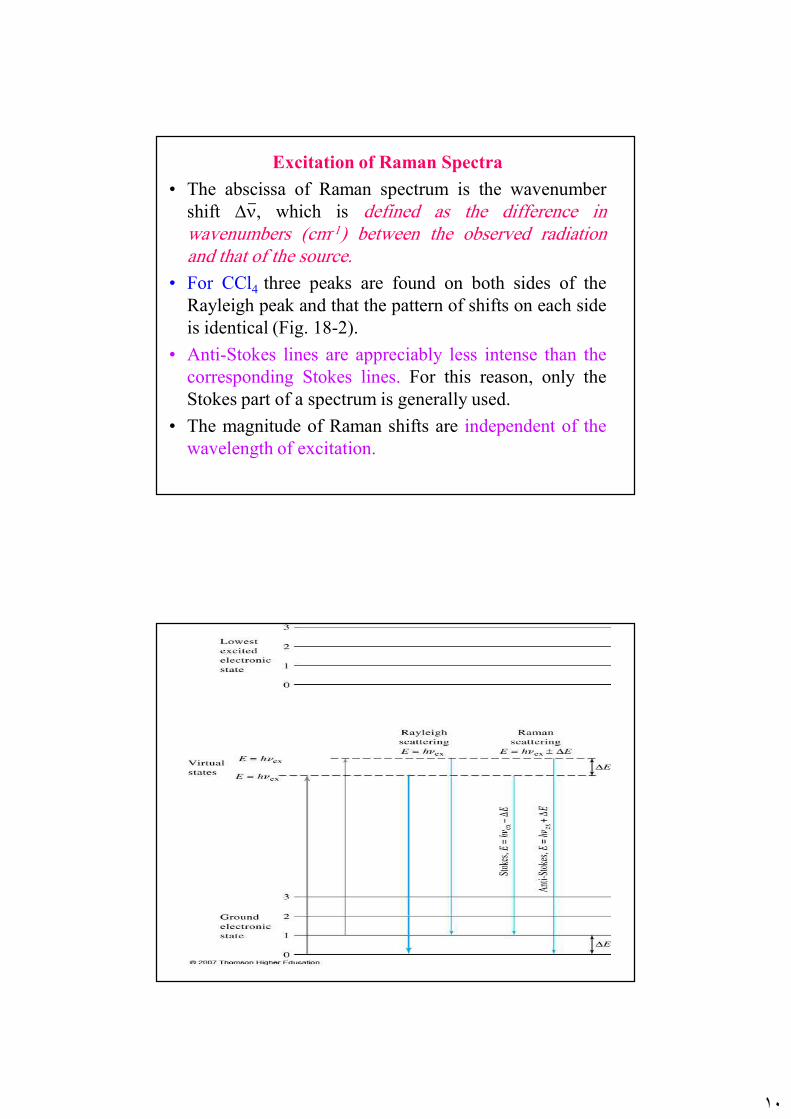
• The abscissa of Raman spectrum is the wavenumbershift ∆ν, which is defined as the difference inwavenumbers (cm-1) between the observed radiationand that of the source.
• For CCl4 three peaks are found on both sides of theRayleigh peak and that the pattern of shifts on each sideis identical (Fig. 18-2).
• Anti-Stokes lines are appreciably less intense than thecorresponding Stokes lines. For this reason, only theStokes part of a spectrum is generally used.
• The magnitude of Raman shifts are independent of thewavelength of excitation.
١١
Mechanism of Raman and
Rayleigh Scattering
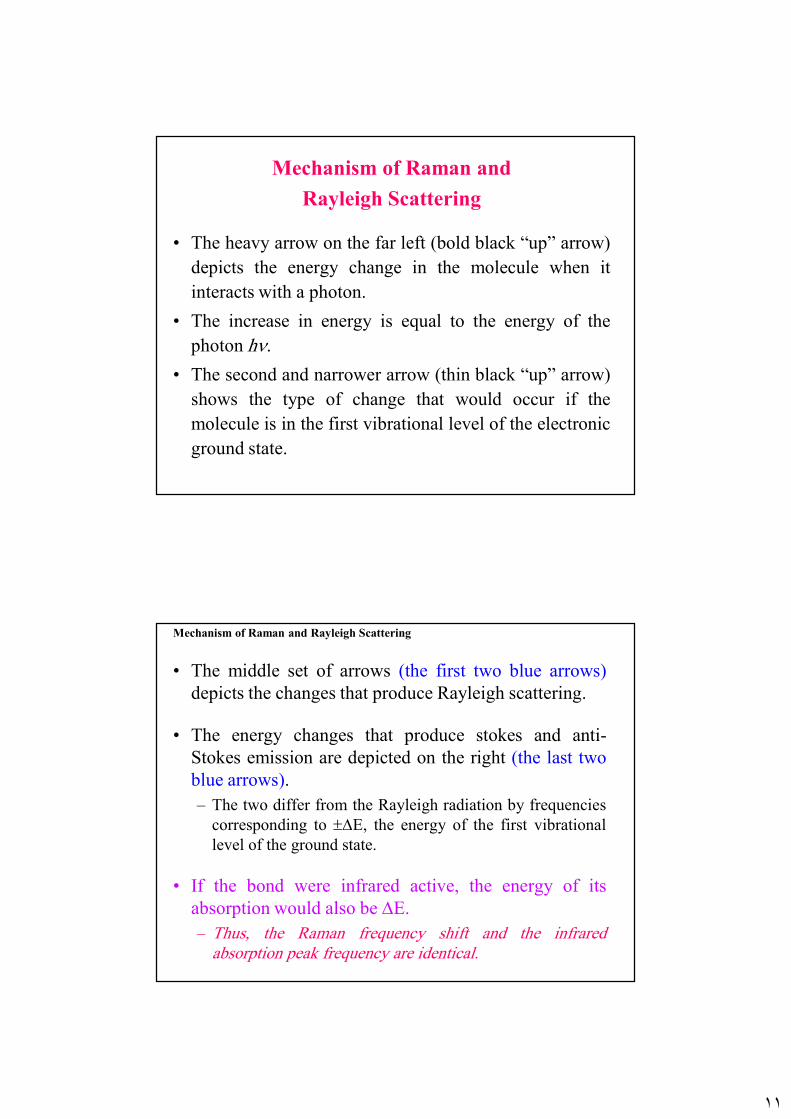
• The heavy arrow on the far left (bold black “up” arrow)depicts the energy change in the molecule when itinteracts with a photon.
• The increase in energy is equal to the energy of thephoton hν.
• The second and narrower arrow (thin black “up” arrow)shows the type of change that would occur if themolecule is in the first vibrational level of the electronicground state.
Mechanism of Raman and Rayleigh Scattering
• The middle set of arrows (the first two blue arrows)depicts the changes that produce Rayleigh scattering.
• The energy changes that produce stokes and anti-Stokes emission are depicted on the right (the last twoblue arrows).– The two differ from the Rayleigh radiation by frequencies
corresponding to ±∆E, the energy of the first vibrationallevel of the ground state.
• If the bond were infrared active, the energy of itsabsorption would also be ∆E.– Thus, the Raman frequency shift and the infrared
absorption peak frequency are identical.
١٢
Mechanism of Raman and Rayleigh Scattering
• The relative populations of the two upper energy statesare such that Stokes emission is much favored over anti-Stokes.
• Rayleigh scattering has a considerably higherprobability of occurring than Raman because the mostprobable event is the energy transfer to molecules in theground state and reemission by the return of thesemolecules to the ground state.
• The ratio of anti-Stokes to Stokes intensities willincrease with temperature because a larger fraction ofthe molecules will be in the first vibrationally excitedstate under these circumstances.
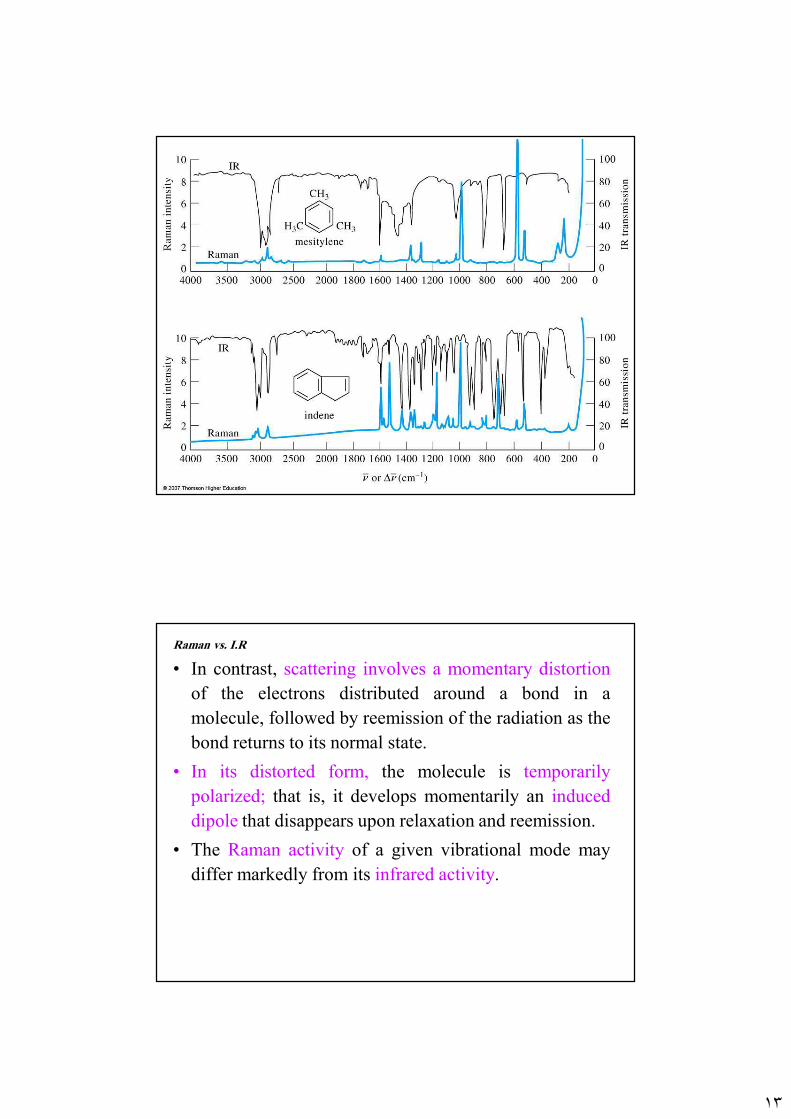
Raman vs. I.R
• For a given bond, the energy shifts observed in aRaman experiment should be identical to the energies ofits infrared absorption bands,– provided that the vibrational modes involved are active
toward both infrared absorption and Raman scattering.
• The differences between a Raman spectrum and aninfrared spectrum are not surprising.– Infrared absorption requires that a vibrational mode of the
molecule have a change in dipole moment or chargedistribution associated with it.
١٣
Raman vs. I.R
• In contrast, scattering involves a momentary distortionof the electrons distributed around a bond in amolecule, followed by reemission of the radiation as thebond returns to its normal state.
• In its distorted form, the molecule is temporarilypolarized; that is, it develops momentarily an induceddipole that disappears upon relaxation and reemission.
• The Raman activity of a given vibrational mode maydiffer markedly from its infrared activity.
١٤
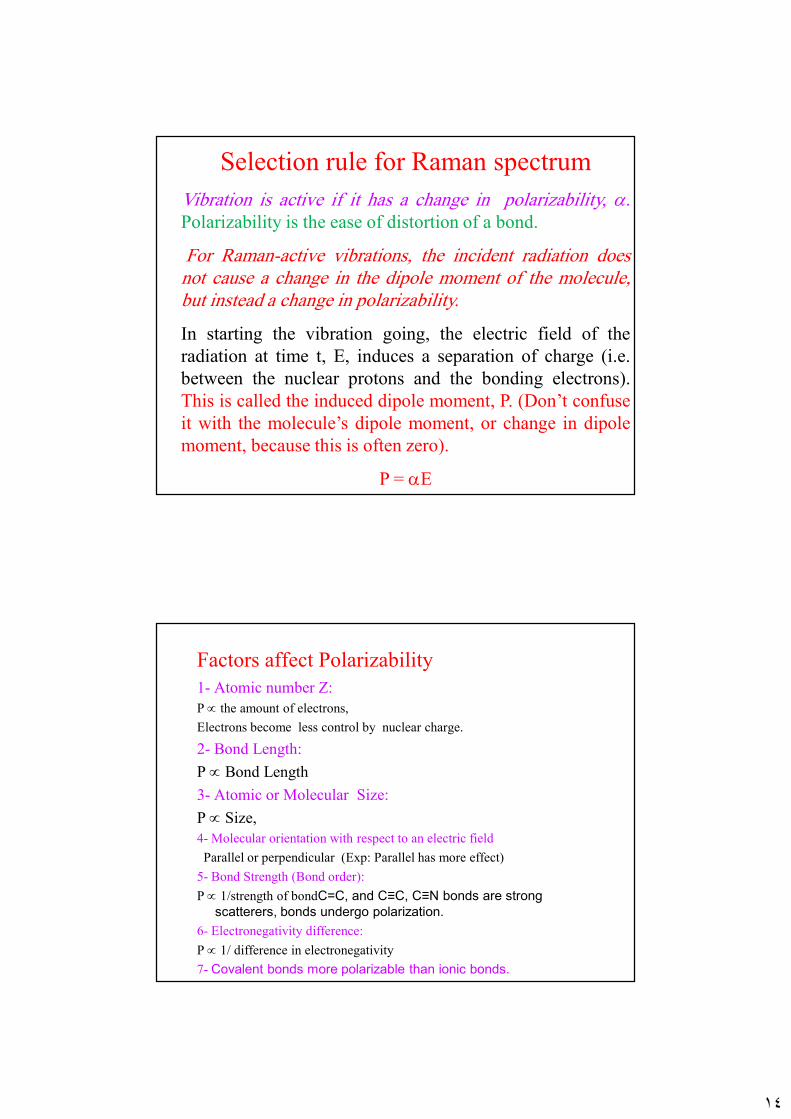
Selection rule for Raman spectrumVibration is active if it has a change in polarizability, α.Polarizability is the ease of distortion of a bond.
For Raman-active vibrations, the incident radiation doesnot cause a change in the dipole moment of the molecule,but instead a change in polarizability.
In starting the vibration going, the electric field of theradiation at time t, E, induces a separation of charge (i.e.between the nuclear protons and the bonding electrons).This is called the induced dipole moment, P. (Don’t confuseit with the molecule’s dipole moment, or change in dipolemoment, because this is often zero).
P = αE
Factors affect Polarizability1- Atomic number Z: P ∝ the amount of electrons, Electrons become less control by nuclear charge.
2- Bond Length:P ∝ Bond Length 3- Atomic or Molecular Size:P ∝ Size, 4- Molecular orientation with respect to an electric field Parallel or perpendicular (Exp: Parallel has more effect)
5- Bond Strength (Bond order):P ∝ 1/strength of bondC=C, and C≡C, C≡N bonds are strong
scatterers, bonds undergo polarization.
6- Electronegativity difference:P ∝ 1/ difference in electronegativity7- Covalent bonds more polarizable than ionic bonds.
١٥
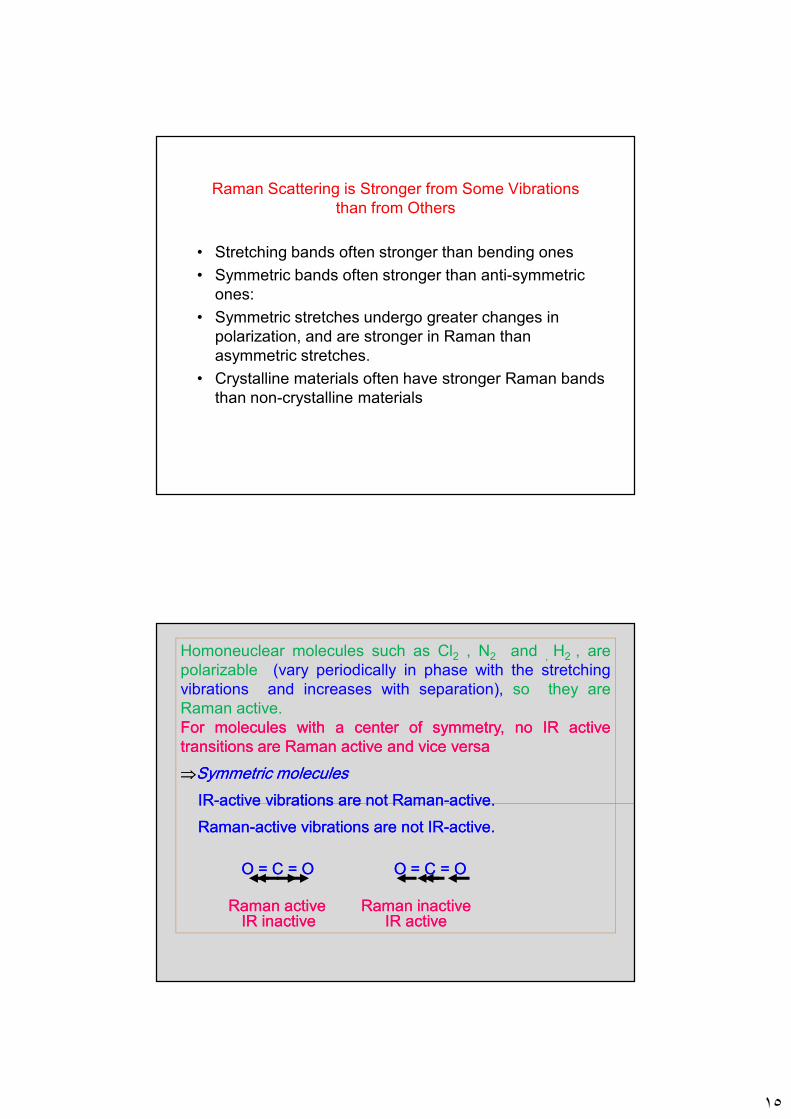
Raman Scattering is Stronger from Some Vibrations than from Others
• Stretching bands often stronger than bending ones
• Symmetric bands often stronger than anti-symmetric ones:
• Symmetric stretches undergo greater changes in polarization, and are stronger in Raman than asymmetric stretches.
• Crystalline materials often have stronger Raman bands than non-crystalline materials
Homoneuclear molecules such as Cl2 , N2 and , H2 , arepolarizable (vary periodically in phase with the stretchingvibrations and increases with separation), so they areRaman active.ForFor moleculesmolecules withwith aa centercenter ofof symmetry,symmetry, nono IRIR activeactivetransitionstransitions areare RamanRaman activeactive andand vicevice versaversa
⇒⇒SymmetricSymmetric moleculesmolecules
IRIR--activeactive vibrationsvibrations areare notnot RamanRaman--activeactive..
RamanRaman--activeactive vibrationsvibrations areare notnot IRIR--activeactive..
OO == CC == OO OO == CC == OO
RamanRaman activeactive RamanRaman inactiveinactiveIRIR inactiveinactive IRIR activeactive
١٦
31
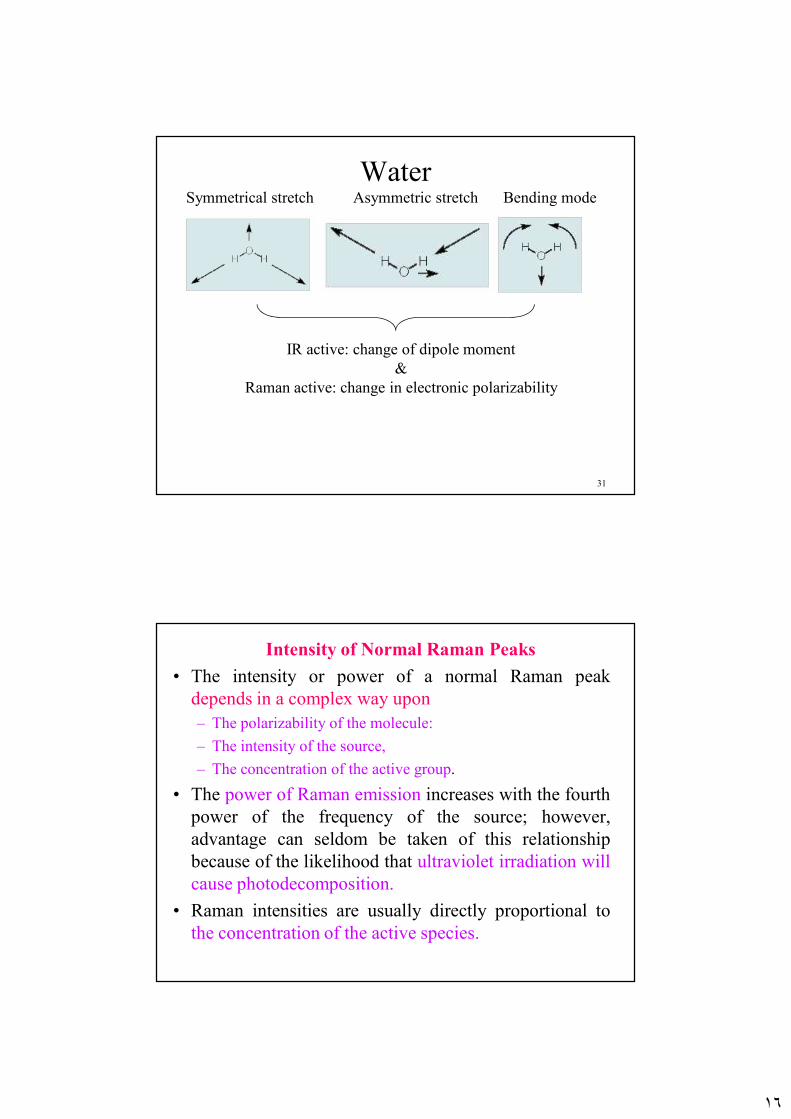
WaterSymmetrical stretch Asymmetric stretch Bending mode
IR active: change of dipole moment&
Raman active: change in electronic polarizability
Intensity of Normal Raman Peaks
• The intensity or power of a normal Raman peakdepends in a complex way upon– The polarizability of the molecule:– The intensity of the source,– The concentration of the active group.
• The power of Raman emission increases with the fourthpower of the frequency of the source; however,advantage can seldom be taken of this relationshipbecause of the likelihood that ultraviolet irradiation willcause photodecomposition.
• Raman intensities are usually directly proportional tothe concentration of the active species.
١٧
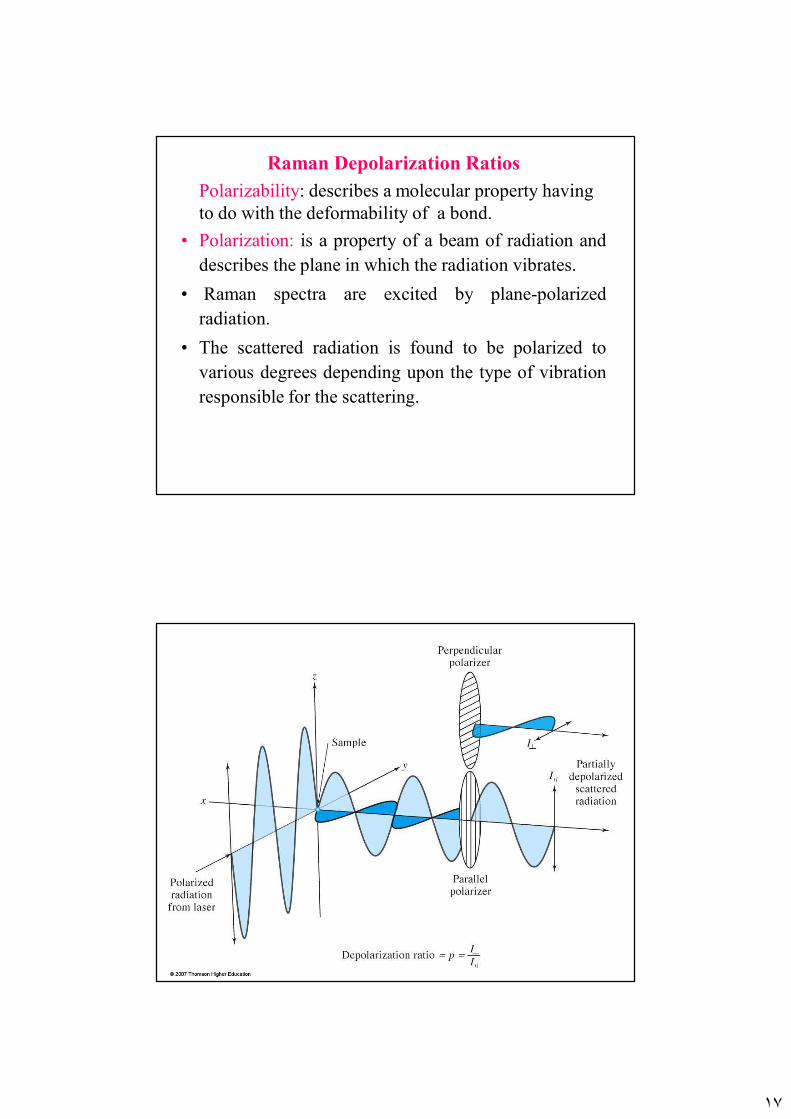
Raman Depolarization Ratios
Polarizability: describes a molecular property having to do with the deformability of a bond.
• Polarization: is a property of a beam of radiation anddescribes the plane in which the radiation vibrates.
• Raman spectra are excited by plane-polarizedradiation.
• The scattered radiation is found to be polarized tovarious degrees depending upon the type of vibrationresponsible for the scattering.
١٨
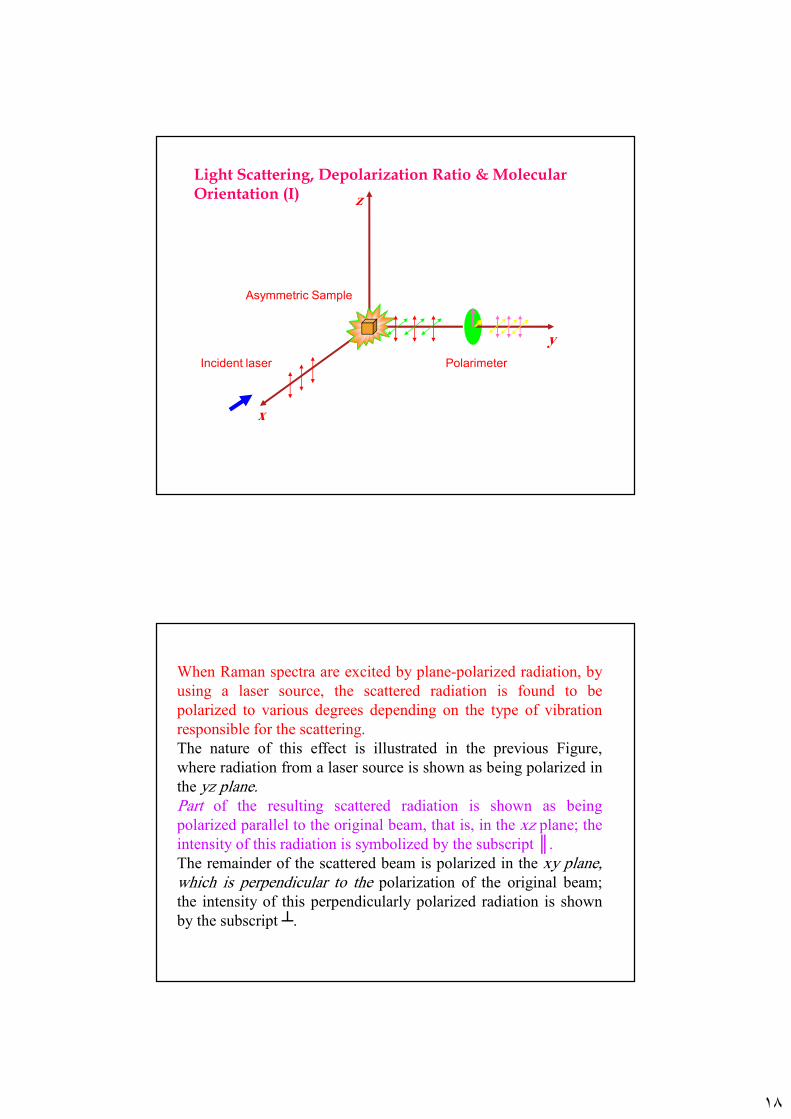
Light Scattering, Depolarization Ratio & Molecular Orientation (I)
Incident laser
Asymmetric Sample
x
y
z
Polarimeter
When Raman spectra are excited by plane-polarized radiation, byusing a laser source, the scattered radiation is found to bepolarized to various degrees depending on the type of vibrationresponsible for the scattering.The nature of this effect is illustrated in the previous Figure,where radiation from a laser source is shown as being polarized inthe yz plane.Part of the resulting scattered radiation is shown as beingpolarized parallel to the original beam, that is, in the xz plane; theintensity of this radiation is symbolized by the subscript ║.The remainder of the scattered beam is polarized in the xy plane,which is perpendicular to the polarization of the original beam;the intensity of this perpendicularly polarized radiation is shownby the subscript ┴.
١٩
Raman Depolarization Ratios
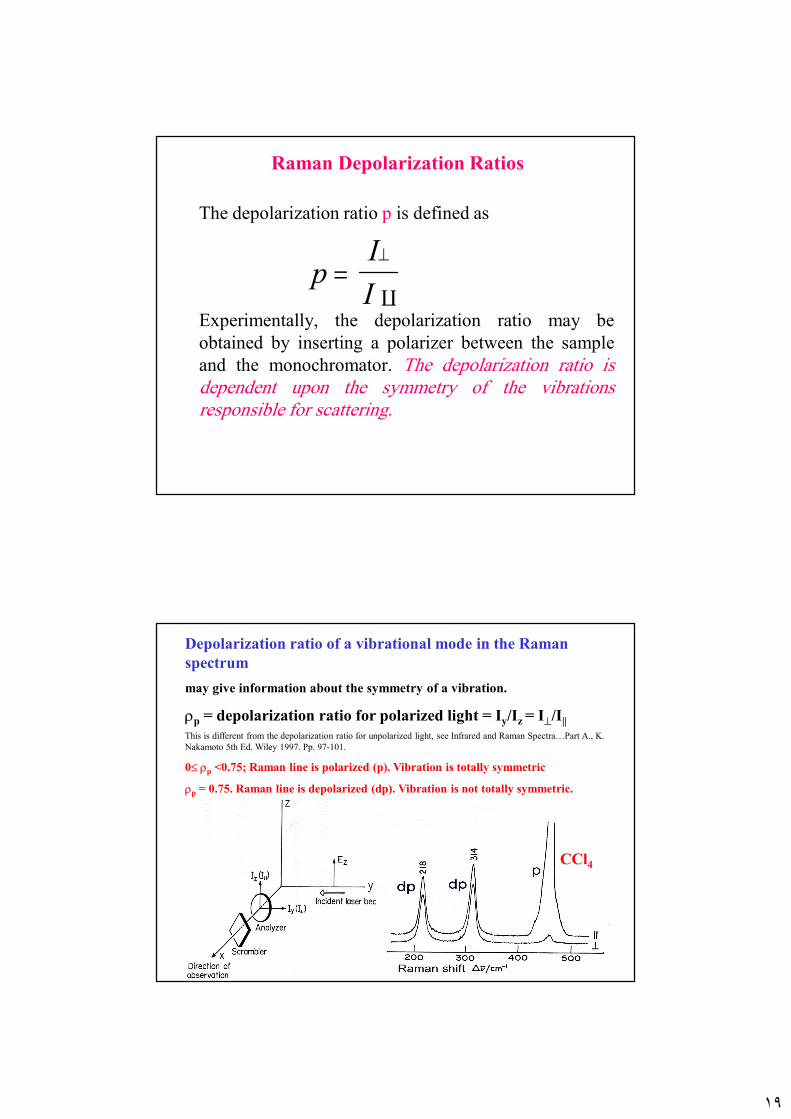
The depolarization ratio p is defined as
Experimentally, the depolarization ratio may beobtained by inserting a polarizer between the sampleand the monochromator. The depolarization ratio isdependent upon the symmetry of the vibrationsresponsible for scattering.
pI
I=
⊥
C
Depolarization ratio of a vibrational mode in the Raman spectrum
may give information about the symmetry of a vibration.
ρp = depolarization ratio for polarized light = Iy/Iz = I⊥/I||
This is different from the depolarization ratio for unpolarized light, see Infrared and Raman Spectra…Part A., K. Nakamoto 5th Ed. Wiley 1997. Pp. 97-101.
0≤ ρp <0.75; Raman line is polarized (p). Vibration is totally symmetric
ρp = 0.75. Raman line is depolarized (dp). Vibration is not totally symmetric.
CCl4

٢٠
Raman Depolarization Ratios
Polarized band: p = < 0.75 for totallysymmetric modes.
Depolarized band: p = 0.75 fornonsymmetrical vibrational modes
Anomalously polarized band: p = > 0.75for vibrational modes
40
Raman Polarized Spectra of SO2
Asymmetric stretching vibration

٢١
Light Scattering, Depolarization Ratio & Molecular Orientation (III)
459cm-1 -Symmetric stretching314, 218cm-1 -Asymmetric stretching
CCl4
100%
ρν= 75%
ρν=0.007
459 314 218
Raman Shift /cm-1
RAMAN INSTRUMENTATION
Modern Raman spectroscopy consists of three components:1. Laser source2. Sample illumination system3. Suitable spectrometer.
1. Source:
• The sources used in are nearly always lasers– Because their high intensity is necessary to produce Raman
scattering of sufficient intensity to be measured with areasonable S/N ratio.
– Because the intensity of Raman scattering varies as the fourthpower of the frequency, argon and krypton ion sources thatemit in the blue and green region of the spectrum have anadvantage over the other sources.

٢٢
EXERCISE• Which of the following lasers would yield best results when
measuring weak Raman signals, and approximately by how much?– Green argon line (514.5 nm) vs. blue argon line (488 nm):
– Nd:YAG fundamental (1064 nm) vs. diode laser (785 nm):
Nd:YAG : neodymium-doped yttrium aluminum garnet

٢٣
CCD Detectorscharge-coupled devices
• Most of the current dispersive Raman set-ups are nowequipped with multichannel two-dimensional CCDdetectors.
The main advantages of these detectors are:
- The high quantum efficiency.
- The extremely low level of thermal noise (wheneffectively cooled).
- Low read noise.
- The large spectral range available.
Many CCD chips exist, but one of the most commonspectroscopy sensor formats is the 1024 x 256 pixelarray.
٢٤
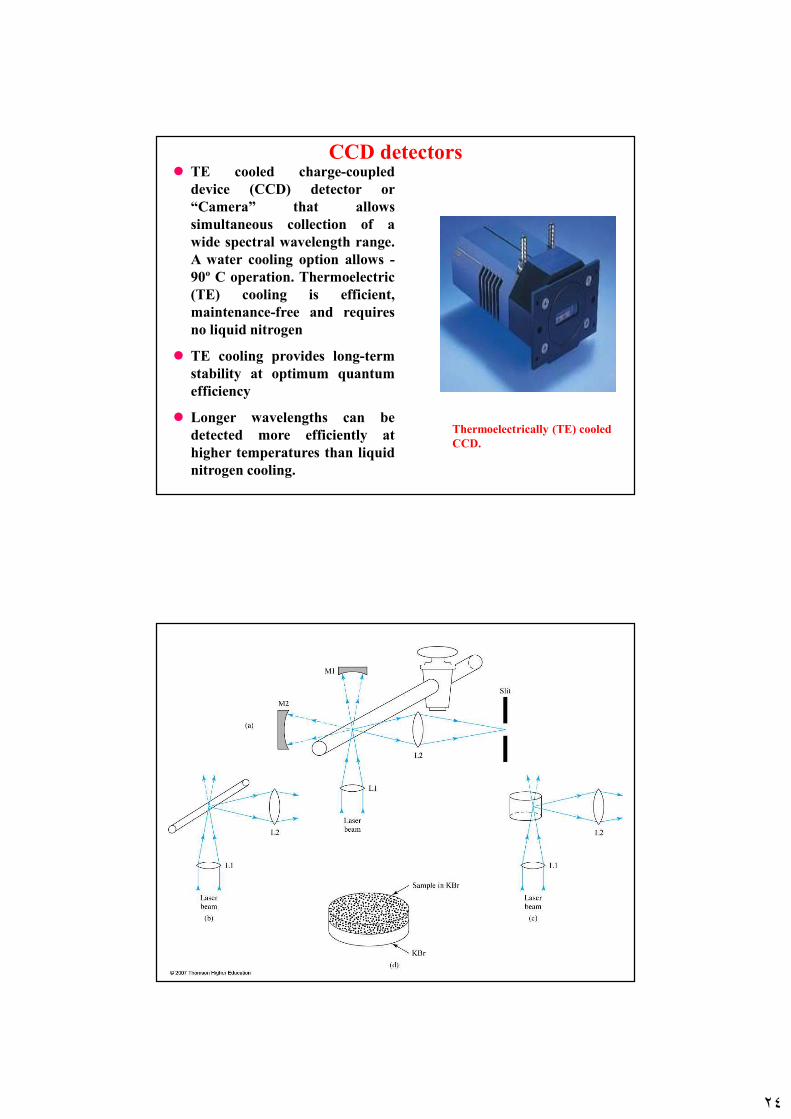
CCD detectors� TE cooled charge-coupled
device (CCD) detector or“Camera” that allowssimultaneous collection of awide spectral wavelength range.A water cooling option allows -90º C operation. Thermoelectric(TE) cooling is efficient,maintenance-free and requiresno liquid nitrogen
� TE cooling provides long-termstability at optimum quantumefficiency
� Longer wavelengths can bedetected more efficiently athigher temperatures than liquidnitrogen cooling.
Thermoelectrically (TE) cooled CCD.
٢٥
Sample Illumination System
• Sample handling for Raman spectroscopicmeasurements is simpler than for infrared spectroscopy.– because glass can be used for windows, lenses, and other
optical components instead of the more fragile andatmospherically less stable crystalline halides.
– In addition, the laser source is easily focused on a smallsample area and the emitted radiation efficiently focused on aslit.
– Consequently, very small samples can be investigated.
• A common sample holder for nonabsorbing liquidsamples is an ordinary glass melting-point capillary.
• If the sample is colourless, it does not absorb a visible laser.
• If the compound is colored, it can absorb the laser, get hot and decompose. Some techniques are:
• Reduce the laser power (defocus) and/or change wavelength;
• Dilute the sample into a KBr pellet;
• Cool the sample
• Rotate or oscillate the laser beam on the sample
٢٦
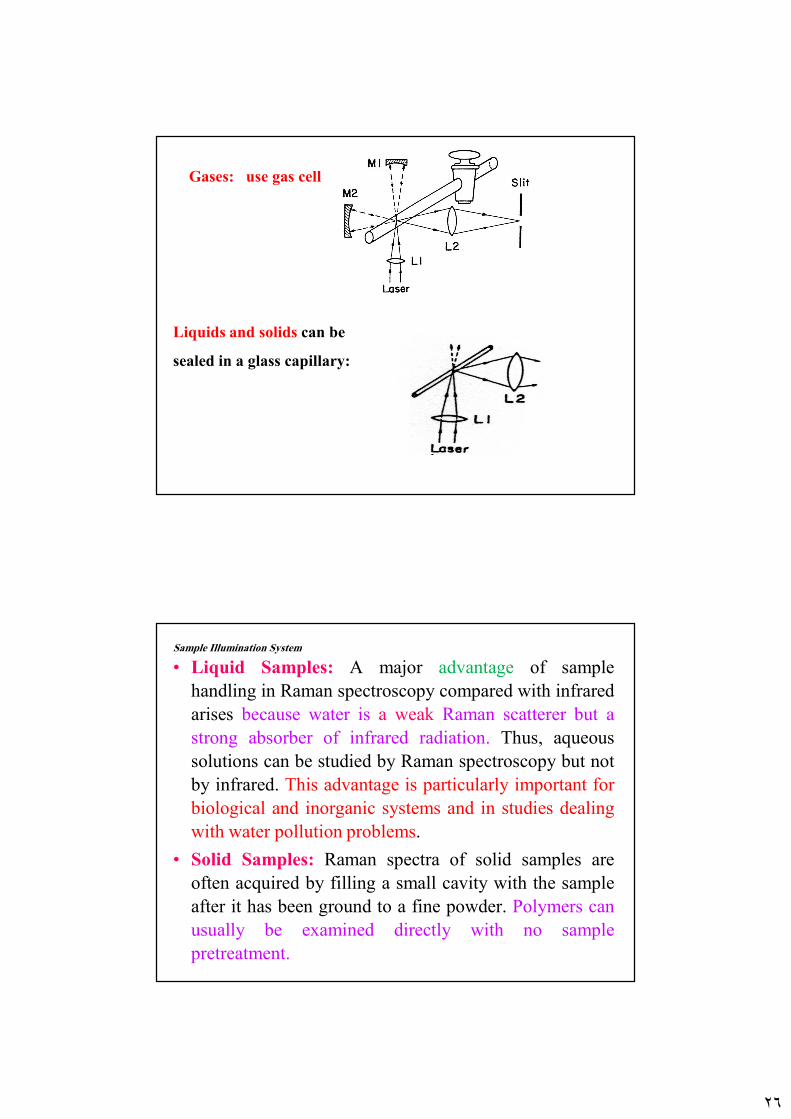
Gases: use gas cell
Liquids and solids can be
sealed in a glass capillary:
Sample Illumination System
• Liquid Samples: A major advantage of samplehandling in Raman spectroscopy compared with infraredarises because water is a weak Raman scatterer but astrong absorber of infrared radiation. Thus, aqueoussolutions can be studied by Raman spectroscopy but notby infrared. This advantage is particularly important forbiological and inorganic systems and in studies dealingwith water pollution problems.
• Solid Samples: Raman spectra of solid samples areoften acquired by filling a small cavity with the sampleafter it has been ground to a fine powder. Polymers canusually be examined directly with no samplepretreatment.

٢٧
Introduction to Optical Fibers.
• Fibers of glass• Usually 120 micrometers in diameter• Used to carry signals in the form of light
over distances up to 50 km.
Constituents
• Core – thin glass center of the fiber where light travels.
• Cladding )ةFGHIا( – outer optical material surrounding the core
• Buffer Coating – plastic coating that protectsthe fiber.

٢٨
Advantages of Optical Fibre
• Thin.• Not Expensive.• Higher Carrying Capacity.• Less Signal Degradation& Digital Signals.• Light Signals.• Non-Flammable.• Light Weight.
Areas of Application
• Telecommunications• Local Area Networks• Cable TV• Optical Fiber Sensors

٢٩
Types of Fibers
Optical fibers come in two types:
• Single-mode fibers – used to transmit one signal per fiber (used in telephone and cable TV). They have small cores(9 microns in diameter) and transmit infra-red light from laser.
• Multi-mode fibers – used to transmit many signals per fiber (used in computer networks). They have larger cores(62.5 microns in diameter) and transmit infra-red light from laser.
Total Internal Reflection in FiberTransmit light signal
٣٠
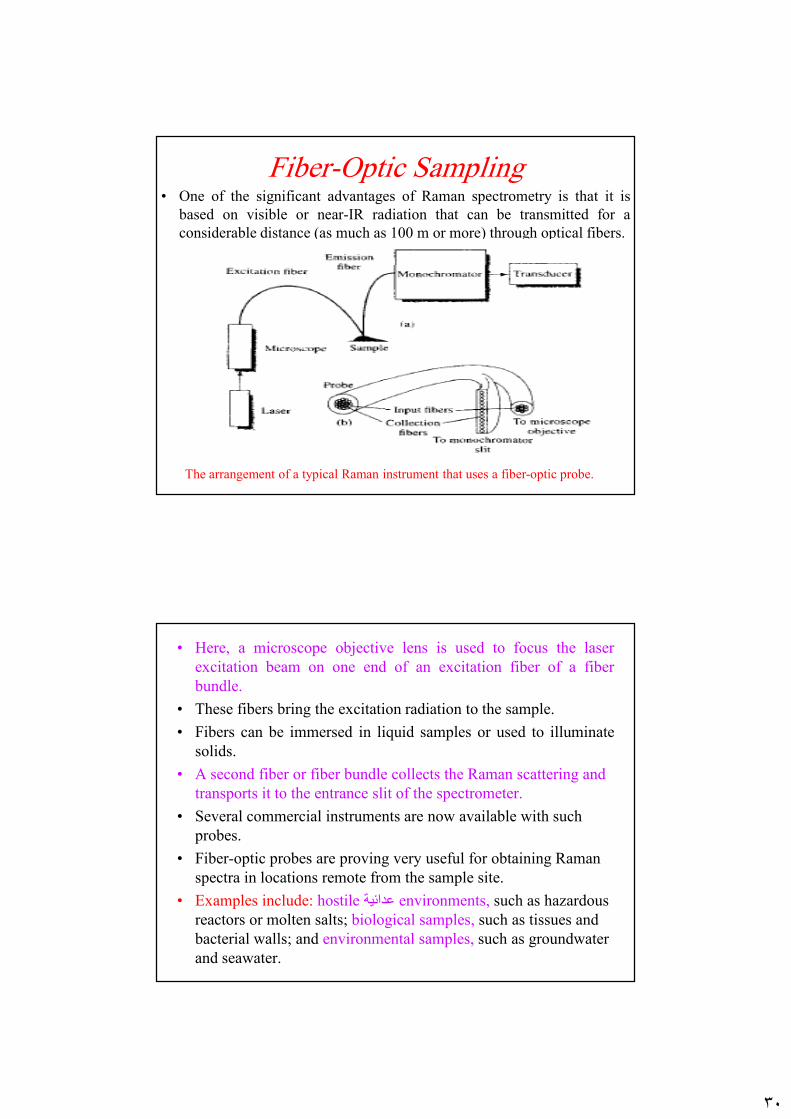
Fiber-Optic Sampling• One of the significant advantages of Raman spectrometry is that it is
based on visible or near-IR radiation that can be transmitted for aconsiderable distance (as much as 100 m or more) through optical fibers.
The arrangement of a typical Raman instrument that uses a fiber-optic probe.
• Here, a microscope objective lens is used to focus the laserexcitation beam on one end of an excitation fiber of a fiberbundle.
• These fibers bring the excitation radiation to the sample.• Fibers can be immersed in liquid samples or used to illuminate
solids.• A second fiber or fiber bundle collects the Raman scattering and
transports it to the entrance slit of the spectrometer. • Several commercial instruments are now available with such
probes.• Fiber-optic probes are proving very useful for obtaining Raman
spectra in locations remote from the sample site. • Examples include: hostile >?@داC environments, such as hazardous
reactors or molten salts; biological samples, such as tissues and bacterial walls; and environmental samples, such as groundwater and seawater.

٣١
Raman Spectrometers
• Raman spectrometers were similar in design and usedthe same type of components as the classicalultraviolet/visible dispersing instruments.
• Most employed double grating systems to minimize thespurious radiation reaching the transducer.
• Photomultipliers served as transducers.
• Now Raman spectrometers being marketed are eitherFourier transform instruments equipped with cooledgermanium transducers or multichannel instrumentsbased upon charge-coupled devices.
FT-Raman Spectrometer
٣٢
APPLICATIONS OF RAMAN SPECTROSCOPY
• Raman Spectra of Inorganic Species
The Raman technique is often superior to infrared forspectroscopy investigating inorganic systems becauseaqueous solutions can be employed.
• In addition, the vibrational energies of metal-ligand bondsare generally in the range of 100 to 700 cm-1, a region ofthe infrared that is experimentally difficult to study.
• These vibrations are frequently Raman active, however,and peaks with ∆ν values in this range are readily observed.
• Raman studies are potentially useful sources ofinformation concerning the composition, structure, andstability of coordination compounds.
• Raman studies have been useful in determining theprobable structures of many species.
• For example: in perchloric acid solutions,vanadium(lV) appears to be present as VO 2+
(aq) rather than as V(OH)22+ (aq).
• Studies of boric acid solutions show that the anion• formed by acid dissociation is the tetrahedral
B(OH)4-, rather than H2 BO3
-.• Dissociation constants for strong acids such as
H2SO4, HNO3, H2SeO4 and H5IO6 have beencalculated from Raman measurements.
٣٣
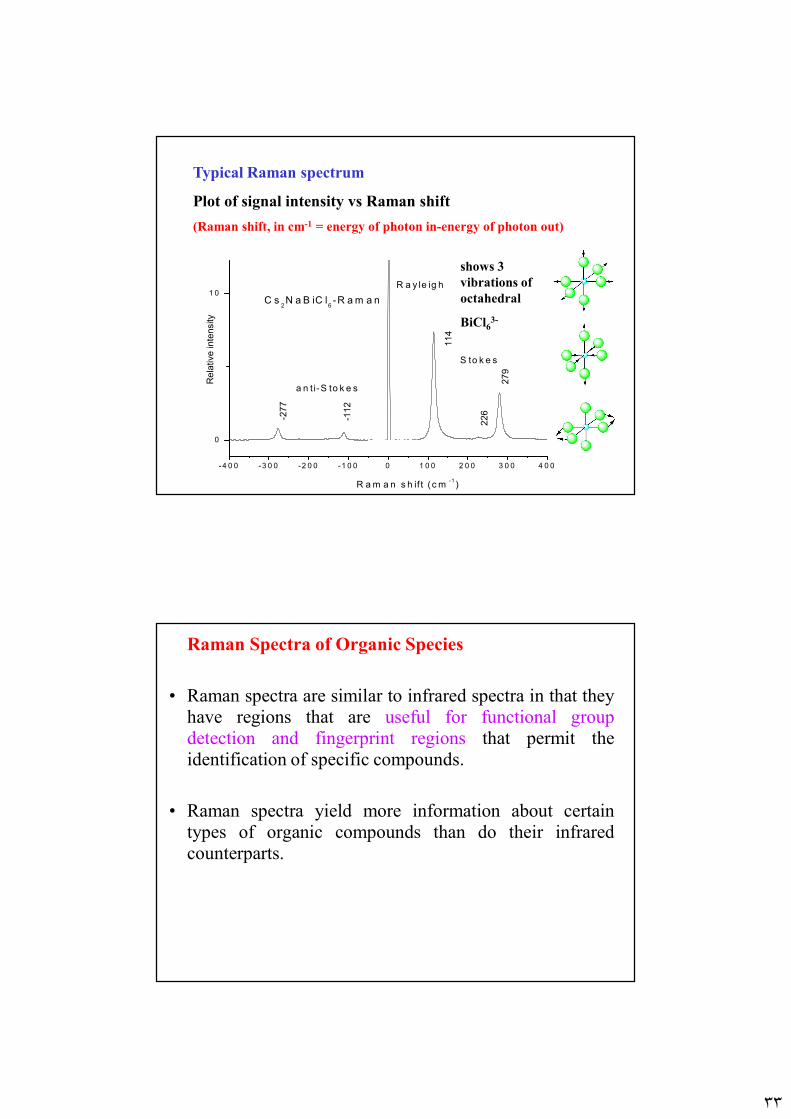
Typical Raman spectrum
Plot of signal intensity vs Raman shift
(Raman shift, in cm-1 = energy of photon in-energy of photon out)
-4 0 0 -3 0 0 -2 0 0 -1 0 0 0 1 0 0 2 0 0 3 0 0 4 0 0
0
1 0
Re
lative inte
nsity
R a m a n s h if t ( c m-1
)
S to k e s
R a y le ig h
a n t i-S to k e s
-277
-11
2
226
279
114
C s2N a B iC l
6-R a m a n
shows 3 vibrations of octahedral
BiCl63-
Raman Spectra of Organic Species
• Raman spectra are similar to infrared spectra in that theyhave regions that are useful for functional groupdetection and fingerprint regions that permit theidentification of specific compounds.
• Raman spectra yield more information about certaintypes of organic compounds than do their infraredcounterparts.

٣٤
Biological Applications of RamanSpectroscopy
Raman spectroscopy has been applied widelyfor the study of biological systems.
The advantages of this technique include:- The small sample requirement.- The minimal sensitivity toward interference
by water.- The spectral detail.- The conformational and environmental
sensitivity.
Quantitative applications
Advantages:
• Raman spectra tend to be less cluttered with peaks thaninfrared spectra.
• As a consequence, peak overlap in mixtures is less likely, andquantitative measurements are simpler.
• In addition, Raman sampling devices are not subject to attackby moisture, and small amounts of water in a sample do notinterfere.
• Disadvantages:
• Despite these advantages, Raman spectroscopy has not yetbeen exploited widely for quantitative analysis.
• This lack of use has been due largely to the rather high cost ofRaman spectrometers relative to that of absorptioninstrumentation.

٣٥
Resonance Raman Spectroscopy
• Resonance Raman scattering refers to a phenomenonin which Raman line intensities are greatly enhancedby excitation with wavelengths that closely approachthat of an electronic absorption peak of an analyte.
• Under this circumstance, the magnitudes of Ramanpeaks associated with the most symmetric vibrationsare enhanced by a factor of 102 to 106.
• As a consequence, resonance Raman spectra have beenobtained at analyte concentrations as low as 10-8 M.
٣٦
Resonance Raman Spectroscopy (Biological applications)
• The most important application of resonance Ramanspectroscopy has been to the study of biological moleculesunder physiologically significant conditions; that is , in thepresence of water and at low to moderate concentrationlevels.
• As an example, the technique has been used to determinethe oxidation state and spin of iron atoms in hemoglobinand cytochrome-c.
• In these molecules, the resonance Raman bands are duesolely to vibrational modes of the tetrapyrrolechromophore. None of the other bands associated with theprotein is enhanced, and at the concentrations normallyused these bands do not interfere as a consequence.
Surface-Enhanced Raman Spectroscopy (SERS)
• Surface enhanced Raman spectroscopy involves obtainingRaman spectra in the usual way on samples that are adsorbedon the surface of colloidal metal particles (usually silver, gold,or copper) or on roughened surfaces of pieces of these metals.
• For reasons that are not fully understood, the Raman lines ofthe adsorbed molecule are often enhanced by a factor of 103 to106.
• When surface enhancement is combined with the resonanceenhancement technique discussed in the previous section, thenet increase in signal intensity is roughly the product of theintensity produced by each of the techniques. Consequently,detection limits in the 10-9 to 10-12 M range have beenobserved.

٣٧
Nature of SERS• Not extremely well understood. Arises from two effects:
– Electromagnetic interactions– Chemical enhancement
• Electromagnetic: Dominant. Depends on the metalsurfaces’ roughness features, which can be attained viasmall metal particles. The metal particles create an EMfield (plasmon) proximal to the analyte, enhancing itsRaman signal.
• Chemical: Electronic coupling with the metal surface,creating a higher Raman scattering cross-section via avariety of pathways (charge-transfer intermediates,interactions with free electrons, etc.).
Advanced Vitreous State 2007, Raman spectroscopy 2, M. Affatigato
Surface-enhanced Raman• Can increase the Raman signal by a
factor of 104-106 regularly, with even108-1014 for some systems.
• Surface selective, highly sensitive:allows for trace analysis.
• Best when (Au, Ag, Cu) or (Li, Na,K) used
The spectra at right show the regular spectra of a-C:H and a-C (bottom curves), and the SERS enhancement (top curves)
(From Veres, M. et al, 2004, see ref.)
a-C:H
a-C
٣٨
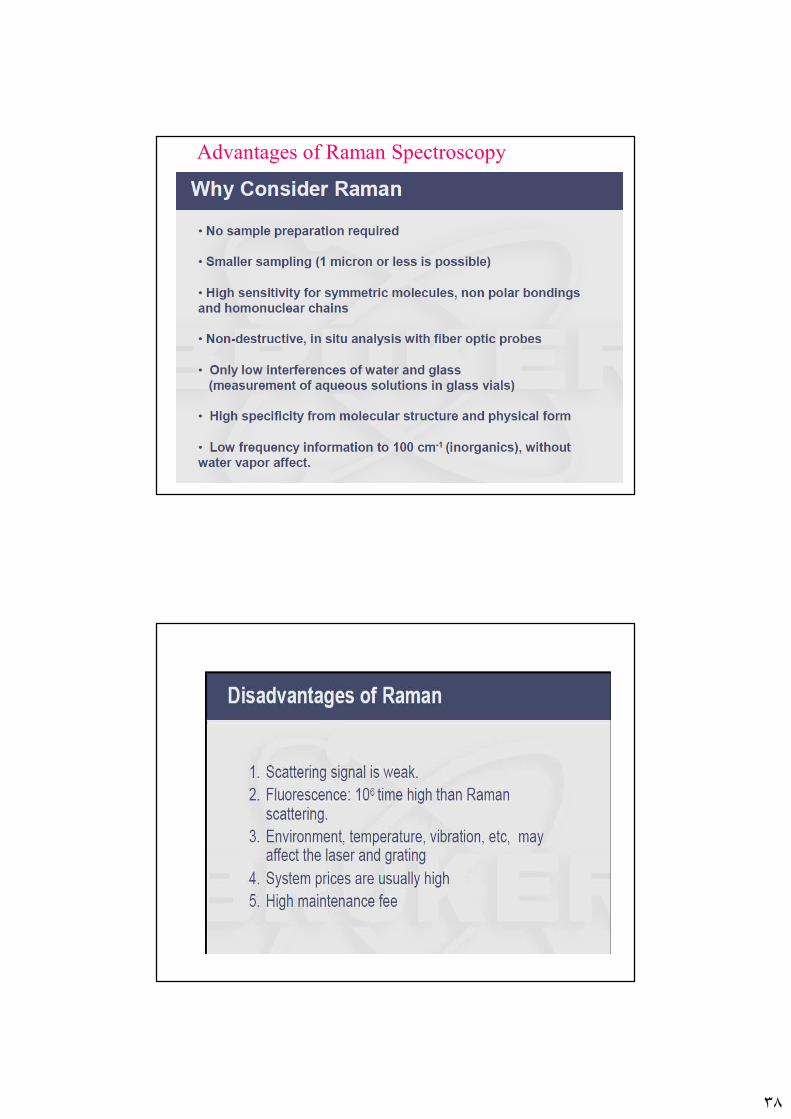
Advantages of Raman Spectroscopy
٣٩
78
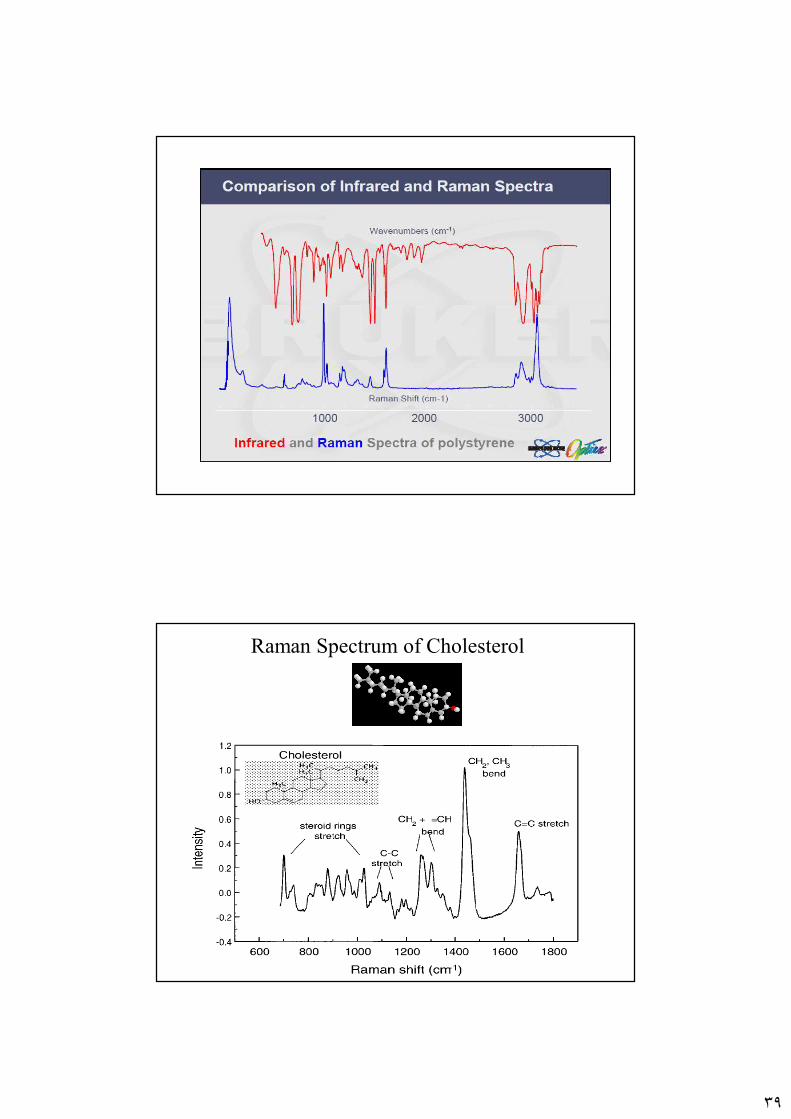
Raman Spectrum of Cholesterol

٤٠
79
General Applications of Raman Spectroscopy
• Structural chemistry• Solid state• Analytical chemistry• Applied materials analysis• Process control• Microspectroscopy/imaging• Environmental monitoring• Biomedical
80
General Comparison to Infrared Absorption• (N)IR absorption directly interrogates molecular vibrations
– Requires change in dipole moment• No symmetric stretches observed• No diatomic activity
– Only observed in NIR and IR spectral regions– High water absorption– Broad spectral features
• Raman requires a change in polarizability with vibrational motion– Occurs at all wavelengths– Weak signal– Sharp spectral features for molecular fingerprinting
• Complementary techniques– Symmetric molecules with a center of inversion have
vibrations which are either Raman or IR active, but not both (e.g. benzene)
– Molecules with no symmetry are active in both methods
٤١
82
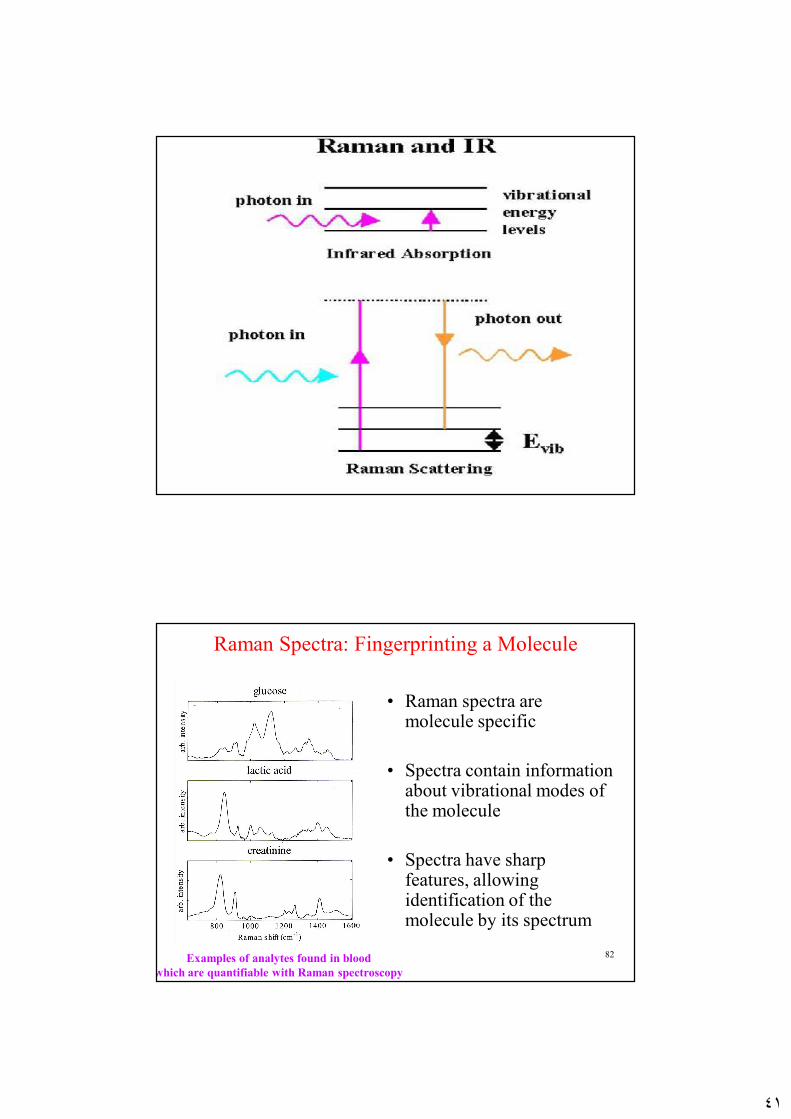
Raman Spectra: Fingerprinting a Molecule
• Raman spectra are molecule specific
• Spectra contain information about vibrational modes of the molecule
• Spectra have sharp features, allowing identification of the molecule by its spectrum
Examples of analytes found in blood which are quantifiable with Raman spectroscopy
٤٢
83
Raman vs. Infrared Spectroscopy
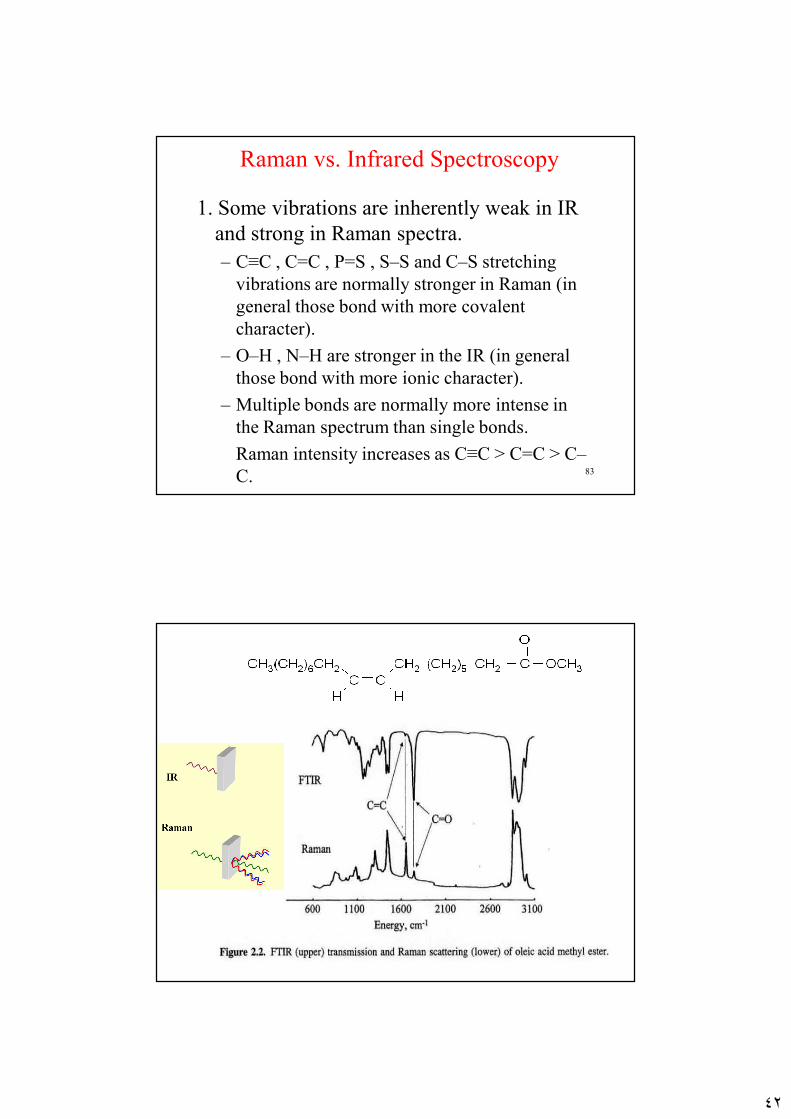
1. Some vibrations are inherently weak in IR and strong in Raman spectra.– C≡C , C=C , P=S , S–S and C–S stretching
vibrations are normally stronger in Raman (in general those bond with more covalent character).
– O–H , N–H are stronger in the IR (in general those bond with more ionic character).
– Multiple bonds are normally more intense in the Raman spectrum than single bonds.Raman intensity increases as C≡C > C=C > C–C.
Raman vs Infrared Spectra
٤٣
85
Raman vs. Infrared Spectroscopy
86
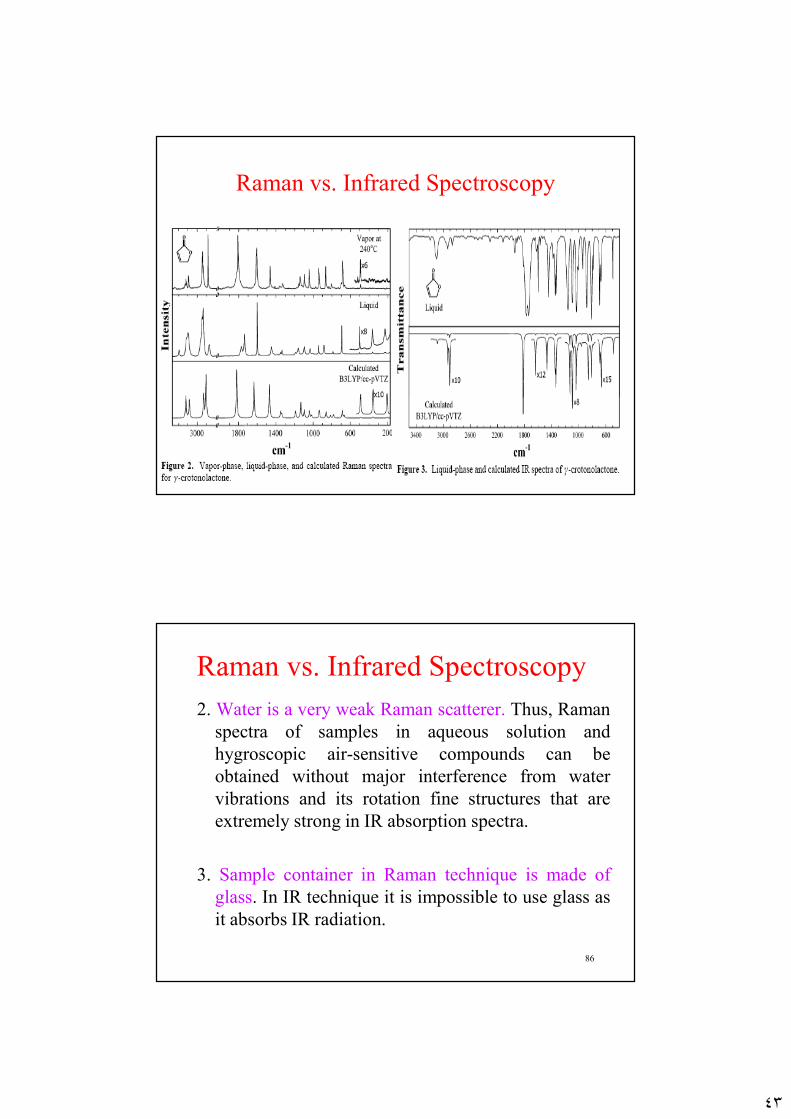
Raman vs. Infrared Spectroscopy2. Water is a very weak Raman scatterer. Thus, Raman
spectra of samples in aqueous solution andhygroscopic air-sensitive compounds can beobtained without major interference from watervibrations and its rotation fine structures that areextremely strong in IR absorption spectra.
3. Sample container in Raman technique is made ofglass. In IR technique it is impossible to use glass asit absorbs IR radiation.
٤٤
87
4. Raman experiment uses a laser beam of a very smalldiameter (1-2 mm). Thus a very small quantity ofthe sample is needed to be characterized.
5. The laser source used by Raman needs to becarefully dealt with. It could cause local heating forthe sample, burn the sample, or cause it todecompose.
6. Raman instruments need careful calibration as theyrecord the shift in frequencies, unlike the IRtechnique.
88
7. The Raman technique is often superior to infraredfor spectroscopy investigating inorganic systemsbecause aqueous solutions can be employed.In addition, the vibrational energies of metal-ligandbonds are generally in the range of 100 to 700 cm-1,a region of the infrared that is experimentallydifficult to study.These vibrations are frequently Raman active,however, and peaks with ∆ν values in this range arereadily observed.Raman studies are potentially useful sources ofinformation concerning the composition, structure,and stability of coordination compounds.
٤٥
89
8. Raman spectra tend to be less cluttered withpeaks than infrared spectra. As aconsequence, peak overlap in mixtures isless likely, and quantitative measurementsare possibly simpler.
9. Raman spectroscopy has not yet beenexploited widely for quantitative analysis.This lack of use has been due largely to therather high cost of Raman spectrometersrelative to that of absorption instrumentation.
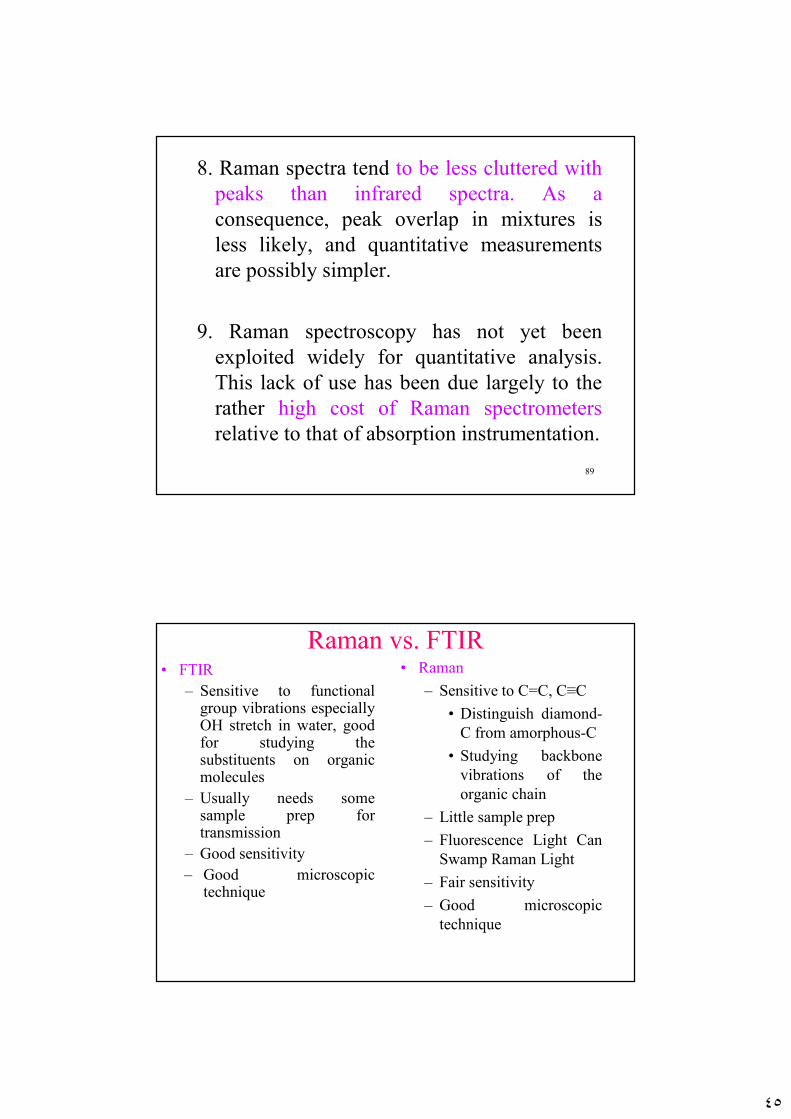
Raman vs. FTIR• FTIR
– Sensitive to functionalgroup vibrations especiallyOH stretch in water, goodfor studying thesubstituents on organicmolecules
– Usually needs somesample prep fortransmission
– Good sensitivity– Good microscopic
technique
• Raman– Sensitive to C=C, C≡C
• Distinguish diamond-C from amorphous-C
• Studying backbonevibrations of theorganic chain
– Little sample prep– Fluorescence Light Can
Swamp Raman Light– Fair sensitivity– Good microscopic
technique