raman spectroscopy, x-ray diffraction and electrical properties of fullerene-based poly...
TRANSCRIPT

July 21, 2014 11:16 WSPC/Guidelines-IJMPB S0217979214501914
International Journal of Modern Physics BVol. 28 (2014) 1450191 (9 pages)c© World Scientific Publishing Company
DOI: 10.1142/S0217979214501914
Raman spectroscopy, X-ray diffraction and electrical properties of
fullerene-based poly (methylmethacrylate) polymers
Supriya Singh∗,§, Ashutosh Dwivedi∗, R. K. Shukla† and Meet Kamal‡
∗Maharana Pratap Engineering College,
Kothi, Mandhana, Kanpur, Uttar Pradesh 209217, India†Harcourt Butler Technological Institute,
Nawabganj, Kanpur, Uttar Pradesh 208002, India‡Christ Church P. G. College,
The Mall, Kanpur, Uttar Pradesh 208001, India§[email protected]
Received 17 February 2014Revised 3 June 2014
Accepted 15 June 2014Published 21 July 2014
Fullerene grafted poly (methylmethacrylate) polymers have been studied using X-raydiffraction and raman spectroscopy to analyze their polymeric structure. The electricalproperties of prepared polymers have also been studied. The X-ray diffraction and ra-man spectroscopy pattern of pure buckminster fullerene (C60) has been compared withprepared polymeric samples. Raman spectroscopy indicates that a structural changeoccurs due to grafting. The vibrations in the relative intensity of peaks and shifts inenergy are observed. The lower scattering efficiency of pure fullerene (C60) is observedat 1468 cm−1.The values for poly (methylmethacrylate) are observed at 3000 cm−1.The result show a large shift in the intense raman spectral region of fullerene-based poly(methylmethacrylate) which lies between 2500 cm−1 and 3000 cm−1. X-ray diffrac-
tion shows an unusual variation in crystallite size of polymeric samples. Generally it hasbeen observed that polymers are insulators, but noticeably fullerene-based poly (methyl-methacrylate) show conducting behavior.
Keywords: Fullerene; Raman shift; XRD; crystallite size; conductivity.
PACS numbers: 61.05.cp, 66.30.hk, 68.55.ap, 81.05.Tp, 82.35.Cd, 87.64.kp, 72.80.-r
1. Introduction
Ever since the production of carbon clusters (i.e., fullerenes) in quantities of grams,1
worldwide interests and efforts have thus been stimulated to investigate all their
possible uses.2–4 A special form of such carbon clusters that possesses high symme-
try (soccer ball shape) is Csn. People incidentally found that its optical property is
somewhat similar to the absorption spectrum of the interstellar dusts.5 The interac-
tion between polymers and nanoscopic particles can lead to highly organized hybrid
1450191-1
Int.
J. M
od. P
hys.
B D
ownl
oade
d fr
om w
ww
.wor
ldsc
ient
ific
.com
by S
TO
NY
BR
OO
K U
NIV
ER
SIT
Y o
n 10
/15/
14. F
or p
erso
nal u
se o
nly.

July 21, 2014 11:16 WSPC/Guidelines-IJMPB S0217979214501914
S. Singh et al.
Table 1. Variation of fullerene with poly (methylmethacrylate).
Sample name Fullerene (mol/L) Poly (methylmethacrylate) (mol/L)
A 1.26 × 10⁻⁴ 4.27B 1.73 × 10⁻⁴ 2.35C 1.38 × 10⁻⁴ 3.77
materials. The morphology of such components depends not only on the character-
istics of the polymer but also on the features of the nanoparticle. Recently there
are a number of reports dealing with fullerene grafted polymers. These C60-based
polymeric materials are designed to combine the interesting physical properties.
Raman spectroscopy is concerned with detection of light scattered inelastically due
to interaction of molecules with incident monochromatic radiation. When EM radi-
ation interacts with matter a certain fraction of the incident radiation is scattered
elastically such that its frequency remains unchanged. Raman spectroscopy has
been performed on these samples to understand how the polymer conformation
changes with the phases. Here X-ray technique is used as a tool for investigating
the structure of crystals as well as polymeric samples. In recent years it has been
shown that the electrical characteristics of fullerene-based polymers are sensitive
to environmental factors. Another noticeable feature of solid fullerene structures is
the intercalation of molecular gases into the interstitial sites of these structures.
Previous studies have shown influence of oxygen gas and temperature changes on
the electrical, optical and structural properties of fullerene materials as determined
by electron paramagnetic resonance (EPR) intensity changes and X-ray diffraction
patterns6 as well as more conventional electrical measurements.7–9 The curvature
and topology required for fullerene formation strongly enhances the electronega-
tivity of the carbon clusters and as a result C60 readily accepts electrons. Solid
C60 undergoes doping with alkali metal vapors to produce intercalation compounds
which are conductors. The highest conductivities occur with thin films of C60-doped
with potassium.10 Polymeric samples of fullerene grafted poly (methylmethacry-
late)11 has been given in Table 1 and it shows a very good conducting behavior.
2. Experimental Details
In order to analyze the whole range of possible structures, materials with nominal
compositions have been studied. Purified solvents were used as received. Benzoylper-
oxide (BPO) was used and recrystallized in chloroform. Fullerene (Alfa Aesar 99.9%
C60) was used as received and was dissolved in toluene as required. Samples (A, B
and C) of fullerene-based poly (methylmethacrylate) were synthesized by system-
atic variation of fullerene and methylmethacrylate using benzolperoxide (BPO) as
initiator and toluene as solvent for one hour at 90◦C temperature under a blanket
of nitrogen. The polymer was precipitated in acidified methanol and vaccum dried
until a constant weight was obtained. The material was then analyzed by X-ray
1450191-2
Int.
J. M
od. P
hys.
B D
ownl
oade
d fr
om w
ww
.wor
ldsc
ient
ific
.com
by S
TO
NY
BR
OO
K U
NIV
ER
SIT
Y o
n 10
/15/
14. F
or p
erso
nal u
se o
nly.

July 21, 2014 11:16 WSPC/Guidelines-IJMPB S0217979214501914
Raman spectroscopy, X-ray diffraction and electrical properties
diffraction by using a ARL X-TRA powder diffractrometer (Thermoelectron cor-
poration) and also by Raman scattering using NSOM (near-field scanning optical
microscope) in which an Ar-ion laser at 514.5 nm was used for excitation. The line
broadening is significant that spreads out the neighboring lines in order to reduce
laser heating effect. The probe power was controlled to be less than 10 mW by
inserting neutral density filters and also by using cylindrical focusing. The power
density used was below 20 W/cm2, which is suitable for obtaining clean spectrum.
The polarization scattering technique was also adopted which enables to distinguish
the adjacent peaks.
The conductivity behavior of fullerene grafted poly (methylmethacrylate) was
also observed. The disc-shaped sample (pellet) of diameter 0.9 mm and thicknesses
0.5 mm was made of fullerene grafted poly (MMA). The conductivity measurements
were taken in a vacuum 10−5 Torr by mounting the samples in a specially designed
sample holder. The sample holder has two parts. The upper part consists of two
electrodes and an evacuation port. The samples were mounted between the jaws
of two electrodes having a spring arrangement. At the end of two electrodes, two
UHF connectors were used for the electrical connections of the sample. A calibrated
copper-constantan thermocouple was mounted very near to the sample to measure
its temperature. An O-ring was provided between the two parts of the sample
holder for proper evacuation inside the chamber. The resistance was measured using
Kiethely electrometer (model 614).
3. Result and Discussion
The X-ray diffraction results are shown in Figs. 1–3 for samples A–C. The crystallite
size can be found by the relation:
t = 0.9 λ/β cos θβ .
The observations of X-ray diffraction for the polymeric samples are given as
under:
(i) Sample A (Fullerene: 1.26 × 10⁻⁴ mol/l and poly (methylmethacrylate):
4.27 mol/l) At wavelength (λ) = 1.54 A, acquired results from XRD analysis are,
FWHM (β) = 0.12, 0.10, 0.19 and 0.31, angle of diffraction (θβ) = 13.87, 15.0,
15.91 and 30.05 (deg.), crystallite size (t) = 12, 14, 8 and 5 A.
(ii) Sample B: (Fullerene: 1.73 × 10⁻⁴ mol/l and poly (methylmethacrylate):
2.35 mol/l) At wavelength (λ) = 1.54 A, acquired results from XRD analysis are,
FWHM (β) = 0.17, 0.16, 0.17, 0.16, 0.16 and 0.15, angle of diffraction (θβ) = 12.81,
15.65, 16.27, 17.25, 14.41 and 30.55 (deg.), crystallite size (t) = 8, 9, 9, 9, 9 and
11 A.
(iii) Sample C: (Fullerene: 1.38 × 10⁻⁴ mol/l and poly (methylmethacrylate):
3.77 mol/l) At wavelength (λ) = 1.54 A, acquired results from XRD analysis are,
FWHM (β) = 0.16, 0.16, 0.17, 0.17, 0.16 and 0.17, angle of diffraction (θβ) = 14.85,
13.26, 16.54, 29.22, 18.84 and 43.42 (deg.), crystallite size (t) = 9, 9, 9, 9, 9 and
11 A.
1450191-3
Int.
J. M
od. P
hys.
B D
ownl
oade
d fr
om w
ww
.wor
ldsc
ient
ific
.com
by S
TO
NY
BR
OO
K U
NIV
ER
SIT
Y o
n 10
/15/
14. F
or p
erso
nal u
se o
nly.

July 21, 2014 11:16 WSPC/Guidelines-IJMPB S0217979214501914
S. Singh et al.
75.065.065.055.055.045.045.035.035.025.025.015.015.000
100
200
300
400
500
Inte
nsity (
CP
S)
2 Theta (deg.)
Fig. 1. X-ray diffraction of sample A.
65.055.045.035.025.015.00
100
200
300
Inte
nsity (
CP
S)
2 Theta (deg.) �
Fig. 2. X-ray diffraction of sample B.
0
100
200
300
400
500
25.015.0 65.055.045.035.0
2 Theta (deg.)
Inte
nsity (
CP
S)
Fig. 3. X-ray diffraction of sample C.
1450191-4
Int.
J. M
od. P
hys.
B D
ownl
oade
d fr
om w
ww
.wor
ldsc
ient
ific
.com
by S
TO
NY
BR
OO
K U
NIV
ER
SIT
Y o
n 10
/15/
14. F
or p
erso
nal u
se o
nly.

July 21, 2014 11:16 WSPC/Guidelines-IJMPB S0217979214501914
Raman spectroscopy, X-ray diffraction and electrical properties
Table 2. Results drawn from X-ray diffraction.
Interchain Maximum CrystalliteSample name 2θ (deg.) separation d(A) intensity (cps) size t(A) FWHM (β)
A 15.91 3.50 550 8 0.19B 15.65 3.56 340 9 0.16C 13.26 4.19 530 9 0.16
Table 3. Comparative data of crystallite size.
Samples t0(in A) t1(in A) t2(in A) t3(in A) t4(in A) t5(in A)
A 12 14 8 5 — —B 8 9 9 9 9 11C 9 9 9 9 9 11
Table 4. Comparative data of interchain separation.
Samples d0(in A) d1(in A) d2(in A) d3(in A) d4(in A) d5(in A)
A 4.01 3.71 3.51 1.92 — —B 4.35 3.58 3.43 3.24 3.86 1.89C 3.75 4.20 3.39 1.97 2.98 1.40
All the parameters drawn from X-ray results have been depicted in Table 2. A
comparative tabular representation of crystallite size and interchain separation of
all the samples has been depicted in Tables 3 and 4 which shows the nonuniform
variation in the value of crystallite size. X-ray results show fullerene-based poly
(methylmethacrylate) polymers are not having perfect crystalline structure but
have semi crystalline structure, their interchain separation varies as we increase the
concentration of fullerene among these samples. As the concentration of fullerene
increases in the polymeric samples, the full width of half maxima increases. However
the crystallite size shows unusual variation. It initially decreases to a certain extent
thereafter it goes on increasing.
Information about the near-surface structure and composition on a micrometer
scale can be obtained from Raman scattering investigations and selected Raman
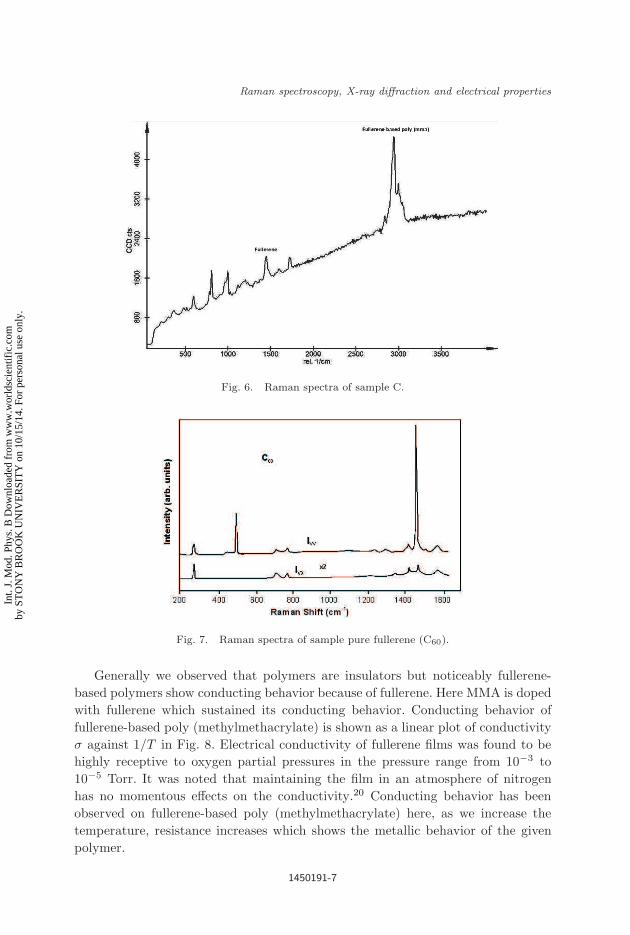
data are therefore presented in Figs. 4–7. These figures show the Raman spectra for
samples A, B, C and pure fullerene12 respectively. The near surface region of our
samples, sampled by Raman spectroscopy seems to be even more inhomogeneous
than the bulk material sampled by the X-ray diffraction studies and significant dif-
ferences were observed between different grains in some samples.13–15 Though some
people had observed the intermolecular vibrations below 200 cm−1 and the second-
order scattering above 1650 cm−1, we contemplate on the second-order Raman scat-
tering from the intramolecular vibrations, which is in the spectral region between
500 cm−1 and 3500 cm−1, with very good agreement.17 The resolution of ≈ 1 cm−1
1450191-5
Int.
J. M
od. P
hys.
B D
ownl
oade
d fr
om w
ww
.wor
ldsc
ient
ific
.com
by S
TO
NY
BR
OO
K U
NIV
ER
SIT
Y o
n 10
/15/
14. F
or p
erso
nal u
se o
nly.

July 21, 2014 11:16 WSPC/Guidelines-IJMPB S0217979214501914
S. Singh et al.
Fig. 4. Raman spectra of sample A.
Fig. 5. Raman spectra of sample B.
most intense raman shift of pure fullerene lies between 1400 cm−1 and 1600 cm−1
and that of fullerene-based poly (methylmethacrylate) lies between 2500 cm−1 and
3000 cm−1. This is due to tangential vibrations of the five-fold pentagon carbons.
Other peak of fullerene is observed at 495 cm−1 and that of fullerene-based poly
(methylmethacrylate) lies between 500 cm−1 and 1000 cm−1 which is the result
of the symmetrical radial breathing motion according to some theoretical calcula-
tions, both peaks show narrow widths in pure fullerene but have a slight width in
fullerene-based poly (methylmethacrylate), with the observation and synthesis of
the fullerenes, this point becomes interesting.18,19
1450191-6
Int.
J. M
od. P
hys.
B D
ownl
oade
d fr
om w
ww
.wor
ldsc
ient
ific
.com
by S
TO
NY
BR
OO
K U
NIV
ER
SIT
Y o
n 10
/15/
14. F
or p
erso
nal u
se o
nly.
July 21, 2014 11:16 WSPC/Guidelines-IJMPB S0217979214501914
Raman spectroscopy, X-ray diffraction and electrical properties
Fig. 6. Raman spectra of sample C.
Fig. 7. Raman spectra of sample pure fullerene (C60).
Generally we observed that polymers are insulators but noticeably fullerene-
based polymers show conducting behavior because of fullerene. Here MMA is doped
with fullerene which sustained its conducting behavior. Conducting behavior of
fullerene-based poly (methylmethacrylate) is shown as a linear plot of conductivity
σ against 1/T in Fig. 8. Electrical conductivity of fullerene films was found to be
highly receptive to oxygen partial pressures in the pressure range from 10−3 to
10−5 Torr. It was noted that maintaining the film in an atmosphere of nitrogen
has no momentous effects on the conductivity.20 Conducting behavior has been
observed on fullerene-based poly (methylmethacrylate) here, as we increase the
temperature, resistance increases which shows the metallic behavior of the given
polymer.
1450191-7
Int.
J. M
od. P
hys.
B D
ownl
oade
d fr
om w
ww
.wor
ldsc
ient
ific
.com
by S
TO
NY
BR
OO
K U
NIV
ER
SIT
Y o
n 10
/15/
14. F
or p
erso
nal u
se o
nly.

July 21, 2014 11:16 WSPC/Guidelines-IJMPB S0217979214501914
S. Singh et al.
Fig. 8. Conducting behavior of fullerene-based poly (methylmethacrylate).
4. Conclusion
The present experiments give a random variation in crystallite size in X-ray diffrac-
tion. Henceforth, the spectra in Figs. 1, 2, 3 are unexpectedly similar and very rich
in showing that the lattice symmetry is quite low. Similarly there is a large difference
in Raman shift of poly (methylmethacrylate) in comparison to that of pure fullerene
(C60), the bands just below 1000 cm−1 in all samples are fingerprints for intermolec-
ular bonds confirming the presence of polymer. Raman spectra of fullerene-based
poly (methylmethacrylate) polymers show shift in peak position which is due to the
change in bonding. This change affected the parameters as interchain separation
and crystallite size. We found that MMA intercalation into fullerene films has a
considerable impact on the electrical properties of fullerene-based polymers. How-
ever, the analysis is intricated by inhomogeneities in the samples used and more
detailed studies on more homogeneous materials are needed.
References
1. W. Rratschmer, I. Fostiropoulos and D. R. Huffman, Chem. Phys. Lett. 170, 167(1990).
2. P. M. Ajayan and S. Lijima, Nature 361, 333 (1993).3. Y. Wang, Nature 356, 585 (1992).4. K. C. Wang and D. Mauzerall, Nature 361, 138 (1993).5. W. Kratschmer et al., Nature 347, 354 (1990).6. E. A. Katz et al., Physica B 304, 348 (2001).7. Y. J. Xing et al., Appl. Phys. Lett. 87, 263117 (2005).8. A. Zahab and L. Firlej, Solid State Comm. 87, 893 (1993).9. C.-M. Yang, J.-L. Liao and K.-C. Chiu, J. Appl. Phys. 96, 1934 (2004).
10. R. M. Fleming et al., Res. SOC, Symp. Pro. 206, 691 (1991).
1450191-8
Int.
J. M
od. P
hys.
B D
ownl
oade
d fr
om w
ww
.wor
ldsc
ient
ific
.com
by S
TO
NY
BR
OO
K U
NIV
ER
SIT
Y o
n 10
/15/
14. F
or p
erso
nal u
se o
nly.

July 21, 2014 11:16 WSPC/Guidelines-IJMPB S0217979214501914
Raman spectroscopy, X-ray diffraction and electrical properties
11. S. Porwal, A. Dwivedi and M. Kamal, Int. J. Polymer Anal. Character. 14, 551 (2009).12. R. Roding, T. Wegberg and B. Sandqvist, J. Phys. Chem. Solids 65, 355 (2004).13. T. Wegberg and B. Sandqvist, Phys. Rev. B 65, 155421 (2002).14. M. Yasukawa and S. Yamanaka, Chem. Phys. Lett. 341, 467 (2006).15. T. Wegberg, P. Stenmark and B. Sandqvist, J. Phys Chem. Solids 65, 355 (2003).16. M. C. Lee et al., Phys. Rev. B 40, 10420 (1989).17. K. L. Lo and M. C. Lee, Chi. J. Phys. 31, 653 (1993).18. H. W. Kroto, Nature 31, 162 (1985).19. W. Kratschmer et al., Nature 347, 354 (1990).20. C.-M. Yang, J.-L. Liao and K.-C. Chiu, J. Appl. Phys. 96, 1934 (2004).
1450191-9
Int.
J. M
od. P
hys.
B D
ownl
oade
d fr
om w
ww
.wor
ldsc
ient
ific
.com
by S
TO
NY
BR
OO
K U
NIV
ER
SIT
Y o
n 10
/15/
14. F
or p
erso
nal u
se o
nly.