raman study of carbon nanotube
TRANSCRIPT
Study of Raman Scattering in Carbon nanotubes
Presented By:Ajay Singh (2010PH10821)Ankit Singla (2010PH10826)
Engineering Physics Department
Indian Institute of Technology Delhi
Supervisor:Dr. A.K. Shukla
EPL 412 B.Tech Project

Objective:
Study of size dependence of Raman scattering in Carbon nanotubes. ( 1st part)
To Study Temperature dependence of Raman spectra (mid semester evaluation)
To Study spatial distribution of temperature during laser processing To Study Temperature rise in CNTs as a function of laser power Theoretically calculated Vs Experimental Raman temperature

Raman spectra for different size of CNTs at constant laser power ,Temperature.
Study of size dependence of Raman scattering in Carbon nanotubes. ( 1st part)
Gaussian Lorentzian
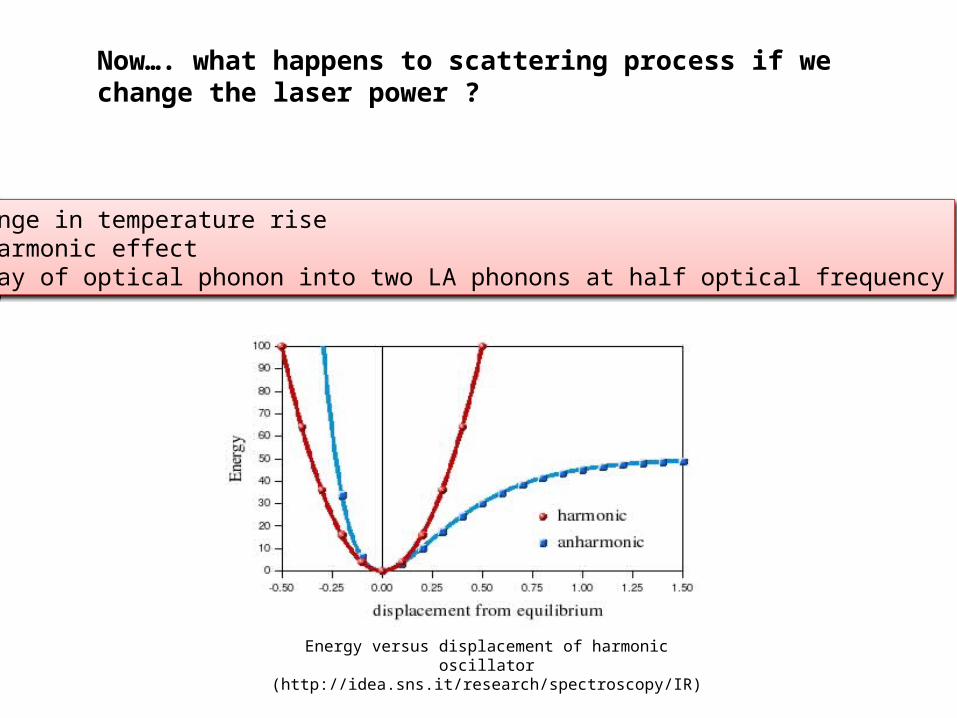
Now…. what happens to scattering process if we change the laser power ?
Change in temperature rise Anharmonic effect Decay of optical phonon into two LA phonons at half optical frequency
Energy versus displacement of harmonic oscillator (http://idea.sns.it/research/spectroscopy/IR)

nn
nP _
Average energy of a harmonic oscillator and hence of a lattice mode of angular frequency at temperature T
Energy of oscillator
1
2n n
The probability of the oscillator being in this level at temperature T is given by the Boltzman factor
exp( / )n Bk T
Einstein Model
_0
0
1 1exp /
2 2
1exp /
2
Bn
Bn
n n k T
n k T
_
/
1
2 1Bk Te
The average number of phonons is given by the Bose-Einstein distribution as (number of phonons) x (energy of phonon) = (second term in )
_
1
1)(
TBken
Γ (T )=𝐶1[1+ 2
𝑒ħ𝝎𝟐𝑲𝑻 −1 ]+𝐶2[1+ 3
𝑒ħ𝝎𝟑𝑲𝑻 −1
+ 3
(𝑒ħ𝝎𝟑𝑲𝑻 −1)2 ]
ω (T )=ω0+𝐶3[1+ 2
𝑒ħ𝝎𝟐𝑲𝑻 −1 ]+𝐶4 [1+ 3
𝑒ħ𝝎𝟑𝑲𝑻 −1
+ 3
(𝑒ħ𝝎𝟑𝑲𝑻 −1)2 ]
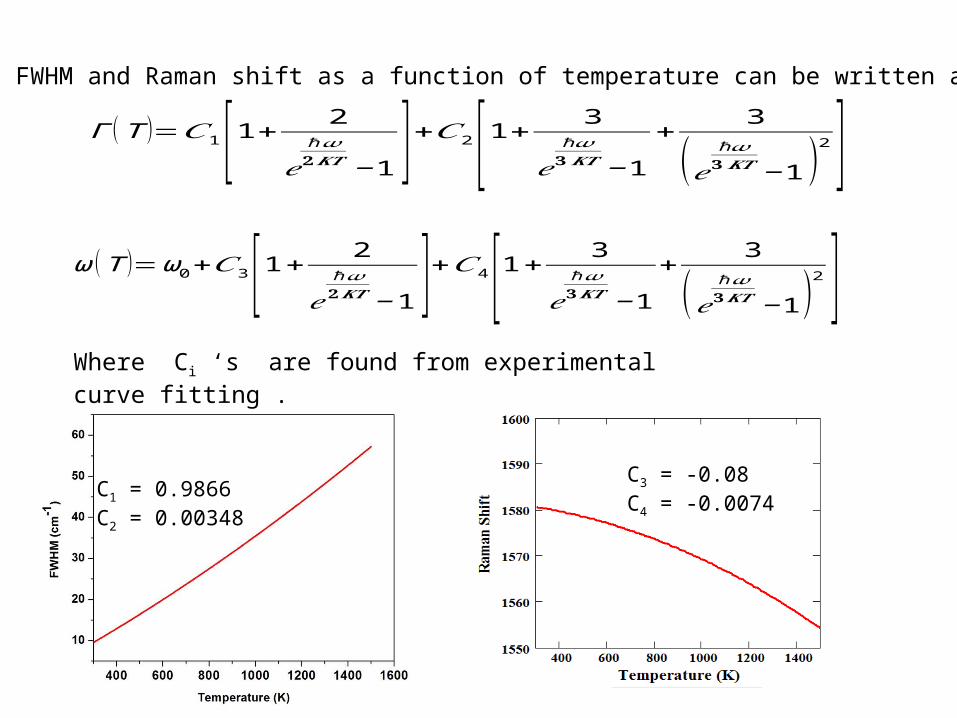
So FWHM and Raman shift as a function of temperature can be written as
Where Ci ‘s are found from experimental curve fitting .
C1 = 0.9866C2 = 0.00348
C3 = -0.08C4 = -0.0074

Theoretically calculated Raman spectra of MWNT at different Temperatures
𝐼 (𝑤 )=∫0
1
[ 𝑒−𝑞2𝐿2
4𝑎2
𝑞
[ω0+𝐶3[1+ 2
𝑒ħ𝝎𝟐𝑲𝑻 −1 ]+𝐶4 [1+ 3
𝑒ħ𝝎𝟑𝑲𝑻 −1
+ 3
(𝑒ħ𝝎𝟑𝑲𝑻 −1)2 ]−𝑤(𝑞)]
2
+(𝐶1[1+ 2
𝑒ħ𝝎𝟐𝑲𝑻 −1 ]+𝐶2[1+ 3
𝑒ħ𝝎𝟑𝑲𝑻 −1
+ 3
(𝑒ħ𝝎𝟑𝑲𝑻 −1)2 ])
2
4 ]𝑑𝑞𝐼 (𝑤 ,𝐿)∝∫
0
1𝑒−𝑞 2𝐿2
4 𝑎2
(𝑤−𝑤 (𝑞))2 +( Γ 𝑜
2 )2 𝑑
2𝑞

Temperature rise and it’s distribution
Theoretically Calculation of maximum temperature rise Spatial distribution of Temperature in CNT sample Recording Raman spectra for MWNT sample Temperature calculation from experimental values (Raman process) Comparison of Theoretical and experimental results

(a) Theoretically calculated maximum temperature rise as function of laser power(r=0.5,z=0.1), assuming conductivity to be constant for higher temperature. (b) Temperature distribution with R and Z (laser parameter 541.5nm, 0.1w)
Calculated thermal conductivity of MWNT (solid line) and a 2-D graphene sheet (dot–dashed line) and 3-D graphite (dotted line). [7)
(a) (b)

Raman Spectrometer Setup, Lampars Lab, IIT Delhi
Laser wavelength = 451.5nmBeam waist = 5µmLaser Power 0.1W-0.7W
The Experiment:

Recorded Raman spectra for a MWNT sample using laser wavelength 541.5nm.

S.No. Laser power (W) Raman peak (cm-1) FWHM (cm-1)
1 0.1 1583.89 53
2 0.2 1581.71 59
3 0.3 1575.78 62
4 0.6 1572.45 70
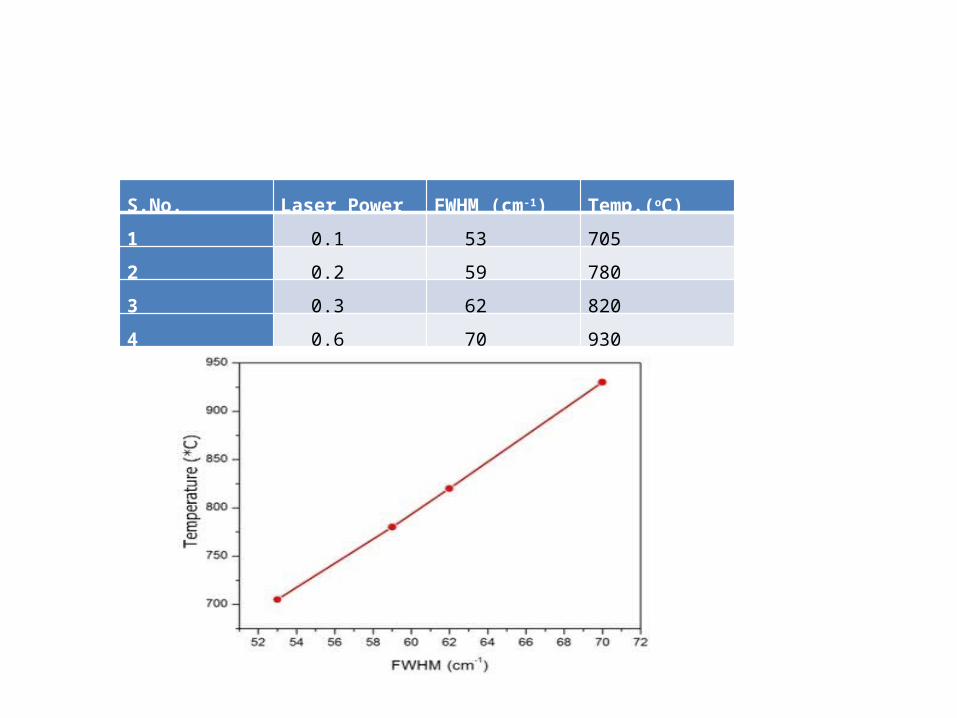
S.No. Laser Power FWHM (cm-1) Temp.(oC)
1 0.1 53 705
2 0.2 59 780
3 0.3 62 820
4 0.6 70 930

Calculated temperature rise versus experimental Raman temperature
Conclusion:
Raman peak shifts towards lower frequency and FWHM tends to higher values while decreasing CNT diameter. due to confinement, selection rule q = 0 is violated and all phonon which lies near to centre of Brillioun zone also contribute to Raman scattering
Temperature rise induced in the sample, increases with laser power which leads to Anharmonicity causing change in Raman spectra
FWHM increases with increase in temperature due to decrease in lifetime and Raman Peaks shifts to lower frequency due to phonon softening
Temperature calculated theoretically and found from the experimental values has large difference ,it may be because conduction is dominated by electrons and the Raman temperature is only due to phonons.

Future scopes:
CNTs has many potential applications in Microelectronics(transistor, high speed oscillators, interconnects and thermal management),solar cells, Hydrogen storage, Yarns, alloys, coatings and films, medicine and so on….
So it is important to study it’s electrical, thermal and mechanical properties…
Raman spectra is a simple and powerful tool to study the electronic and thermal properties. Raman spectra is unique for the material.
Using Raman spectra we can compare between different size NTs, order of defects ,Semiconducting Vs metallic NTs, NTs made of different materials, maximum allowed temperature for the device.
THANK YOU

Reference :
1. “Anharmonic effects in single-walled carbon nanotubes” By Kun Gao, Rucheng Dai, Zengming Zhang and Zejun Ding, J. Phys.: Condens. Matter 19 (2007) 486210 (10pp)
2. “Temperature rise induced by a laser beam” By M. Lax, 3919 JAP, vol. 48, No. 9, September 1977
3. “Temperature rise induced by a laser beam II. The nonlinear case” By M. Lax, Appl. Phys. Lett. 33(8), 15, October 1977, PACS number: 79.20.Ds,44.40.+a,42.60.He
4. https://www.google.com/url?sa=t&rct=j&q=&esrc=s&source=web&cd=3&ved=0CDoQFjAC&url=http%3A%2F%2Fwww.phys.ttu.edu%2F~cmyles%2FPhys5335%2FLectures%2FVibrations-Phonons3.ppt&ei=jpgIU5mWF4_NrQeXkoGABg&usg=AFQjCNHtC8Q1qJYvaEHvMQHo2lZcnaVWEQ&sig2=WRDi8qlHXKxHNOixz651KQ&bvm=bv.61725948,d.bmk&cad=rja
5. H.S Mavi, Sudakshina Prusty, A.K. Shukla, S.C. Abbi Revised 23 August 2002, H.S. Mavi et al. / Thin Solid Films 425 (2003) 90-96
6. M.L. Burgener and R.E. Reedy, Revised 30 October 1981, PACS numbers: 79.20.Ds , J Appl. Phys. 53(6), June 1982
7. Carbon Nanotubes: Thermal Properties J. Hone Columbia University, New York, New York, U.S.A.