rampant drift in the endangered tidewater goby
TRANSCRIPT

i
RAMPANT DRIFT IN THE ENDANGERED TIDEWATER GOBY
(EUCYCLOGOBIUS NEWBERRYI): COMPARING GENETIC VARIATION OF
NATURALLY AND ARTIFICIALLY FRAGMENTED POPULATIONS
W. Tyler McCraney and Andrew P. Kinziger
Department of Fisheries Biology Humboldt State University
One Harpst Street, Arcata, CA 95521
Produced Under Contract Agreement Between US Geological Survey and the Humboldt State University Sponsored Programs Foundation. Full Contract Title: Conservation Genetics of the Federally Endangered Tidewater Goby (Eucyclogobius newberryi) in Northern California. Cooperative Agreement number 1434-HQ-97-01547, Research Work Order No. 79
June 2009

ii
SUMMARY
The objective of this project was to estimate levels of genetic differentiation,
genetic diversity, and migration among geographically isolated North Coast tidewater
goby (Eucyclogobius newberryi) populations. The data set consisted of 621 tidewater
goby sampled from 13 populations including eight Humboldt Bay populations and five
coastal lagoon populations. All individuals were genotyped at nine microsatellite loci
and a subset of 103 individuals was sequenced at the mitochondrial control region.
Based on the genetic data, natural and artificial habitat fragmentation has caused
marked divergence among North Coast tidewater goby. Thus all populations warrant
conservation because they may contain unique genetic material not replicated elsewhere
within the species. Additionally, the genetic structure in Humboldt Bay versus coastal
lagoon populations is very different and we recommend different management
approaches at the two scales.
The Humboldt Bay populations exhibited very high levels of among population
genetic differentiation, extremely low levels of within population genetic diversity, and
no among population migration making them vulnerable to extirpation. We recommend
habitat restoration activities that would increase the potential for between population
migration among Humboldt Bay populations. Migration would likely erase existing
among population genetic differentiation which would potentially restore Humboldt Bay
tidewater goby to the presumptive historical population structure for this system.
Restoration of among population migration would also allow for re-colonization and (or)
colonization of suitable habitats. Lastly, migration should also increase within

iii
population genetic diversity which could potentially increase fitness of the Humboldt Bay
populations.
Coastal lagoon populations also exhibited very high levels of among population
genetic differentiation, but in contrast, contained substantial levels of within population
genetic diversity with infrequent migration among lagoons. All coastal lagoon
populations appear to be stable and genetically healthy with the exception of Lake Earl,
which exhibited reduced levels of genetic diversity in comparison to similar coastal
lagoon populations. The reduced genetic diversity observed within Lake Earl is
consistent with repeated population bottlenecking. In Lake Earl population bottlenecks
are most likely caused by artificial breaching. We recommend institution of breaching
methods in Lake Earl that do not cause mass mortality of tidewater goby.

iv
ACKNOWLEDGEMENTS
Funding for this thesis was provided by the United States Fish and Wildlife
Service. We would also like to thank Greg Goldsmith for his wealth of tidewater goby
knowledge and for assisting with the production of maps. Dr. Dave Jacobs from the
University of California Los Angeles graciously provided several primer sequences that
expedited laboratory work. Thanks to Dr. Eric Loudenslager and Dr. Ed Metz for
reviewing a draft of this manuscript. Lastly, we would like to thank Adam Frimodig and
Anthony Scheiff for collecting the tissue samples used in this study.
v
TABLE OF CONTENTS
Page
SUMMARY ......................................................................................................................ii
ACKNOWLEDGEMENTS ..............................................................................................iv
LIST OF TABLES ............................................................................................................vi
LIST OF FIGURES .........................................................................................................vii
INTRODUCTION ............................................................................................................1
MATERIALS AND METHODS .....................................................................................8
RESULTS ........................................................................................................................14
DISCUSSION ..................................................................................................................30
CONCLUSIONS .............................................................................................................40
LITERATURE CITED ....................................................................................................41

vi
LIST OF TABLES
Table Page
1 North Coast tidewater goby study populations included in the bay and coast scales (listed from north to south), with sample identification codes, habitat area, and geographic coordinates, California, 2006.......................................................6 2 North Coast tidewater goby microsatellite information, including primer sequences, repeat lengths, number of alleles, size ranges, and quality control results (percent missing data, percent errors per allele, percent errors per reaction), California, 2006....................................................................................16 3 Pairwise FST estimates among all North Coast tidewater goby populations, California, 2006. All estimates were statistically significant (P ≤ 0.0006) at the five percent level with exception to Stone Lagoon - Big Lagoon (P = 0.003; marked with an asterisk) .....................................................................................21 4 Populations samples size (n), percent missing data, number of monomorphic loci (nML), number of private alleles (Ap), and measures of genetic diversity [mean ± standard error: alleles per locus (A), rarified allelic richness (Ar), expected heterozygosity (HE), observed heterozygosity (HO)] in North Coast tidewater goby, California, 2006 ........................................................................................24 5 Distribution of tidewater goby haplotypes per population, California, 2006. “H” refers to the specific haplotype composed of the nucleotide substitutions shown under numbers corresponding to location in the 522 base sequence of mitochondrial DNA control region ....................................................................28 6 Populations with samples size (n), number of haplotypes (nH), number of private haplotypes (npH), and measures of mitochondrial DNA control region diversity [mean ± standard error: haplotype diversity (h), nucleotide diversity (π)] in North Coast tidewater goby, California, 2006 ...............................................29

vii
LIST OF FIGURES
Figure Page
1 Tidewater goby occur in isolated lagoons along the California coast in western North America. (a.) Rectangle depicts the North Coast region of California, (b.) five sample locations at the coast scale [Lake Earl (ERL), Stone Lagoon (STN), Big Lagoon (BIG), Virgin Creek (VRG), Pudding Creek (PUD)], and (c.) eight collection sites in Humboldt Bay [McDaniel Slough (MCD), Gannon Slough (GAN), Gannon Pond (PND), Jacoby Creek (JAC), Wood Creek (WDC), Elk River (ELK), Salmon Creek (SAL), Eel River (EEL)] .......................................4 2 ΔK and L(K) values as a function of K, the number of genetically distinct population clusters of North Coast tidewater goby, California, 2006 ................18 3 Proportional membership coefficient (Q) plots of North Coast tidewater goby (California, 2006) for two to nine groups (K) of genetically distinct individuals. Collection localities are blocked by vertical black lines, population names are listed above the plots, and approximate geographic distance separating populations in each scale are below the plots. a The greatest ΔK was at K=2 groups and b, the L(K) was highest at K=9 groups ............................................19 4 Neighbor-joining phenogram of North Coast tidewater goby populations (California, 2006) constructed using Cavalli-Sforza and Edwards (1967) chord genetic distances. Support on branches was estimated with 1,000 bootstrap pseudoreplicates and a consensus tree ..............................................................20 5 The relationships between pairwise genetic differentiation (FST) and geographic distance for the bay scale (white squares, dotted line) and the coast scale (black circles, solid line) of North Coast tidewater goby, California, 2006. The only significant relationship was in the coast scale (R2=0.7504, P=0.0006; Mantel Test) ..................................................................................................................23 6 The relationships between rarefied allelic richness and habitat area for the bay scale (white squares, dotted line) and the coast scale (black circles, solid line) of North Coast tidewater goby populations, California, 2006. The only significant relationship was in the bay scale (R2=0.5873, P=0.0261; Mantel Test) ..........25 7 The correlations between pairwise genetic differentiation (FST) and average of observed heterozygosity (HO) for the bay scale (white squares, dotted line), the coast scale (black squares, solid line), and between scales (crosses, dashed line) of North Coast tidewater goby, California, 2006. The only significant relationship was between scales (R2=0.8398, P<0.0001; Mantel Test) ..............................27

1
INTRODUCTION
Habitat fragmentation is an important process in both evolutionary and
conservation biology (Freeman and Herron 2007, Meffe and Carrol 1997). Natural
fragmentation often occurs over geologic time scales, increases genetic differentiation of
populations, leads to phylogeographic structure, and can result in speciation through a
combination of evolutionary mechanisms (Barton and Charlesworth 1984, Dawson et al.
2002). In contrast to these natural processes, artificial fragmentation occurs over recent
time scales and typically results in more extreme outcomes, including increases in genetic
differentiation and loss of genetic diversity in remnant habitat patches (Templeton et al.
1990). The final outcomes of artificial fragmentation are reduced fitness and adaptive
potential of a population (Frankham 2003, Allendorf and Luikart 2007, Johansson et al.
2007).
While the effects of natural fragmentation and limited dispersal on
phylogeographic structure and evolution are well known (Avise et al. 1987, Dawson et al.
2001, Gysels et al. 2004), and many studies have shown that artificial fragmentation
results in drastic changes to the genetic variation of historically continuous populations
(Frankham 1995, Keller and Largiader 2003, Johnson et al. 2004), artificial
fragmentation of a species that is already naturally fragmented can lead to the most
severe genetic consequences (Templeton et al. 1990, Hitchings and Beebee 1998, Clark
et al. 1999, Fumagalli et al. 2002). Evaluating these consequences is important to the
conservation of estuarine species due to the natural fragmentation of their habitats
combined with increasing artificial fragmentation from recent, widespread, and

2
continuing habitat destruction from coastal development (Helfman 2007). Efforts to
delineate marine reserves may also benefit from research that compares population
genetics among naturally and artificially fragmented coastal habitats (Palumbi 2003).
Due to inherent fragmentation from the discrete distribution of habitat combined with
recent artificial fragmentation from coastal development, the estuaries of western North
America provide a model system to study conservation genetics of a species among
different forms of fragmentation.
The endangered tidewater goby (Eucyclogobius newberryi) is subject to both
natural and artificial fragmentation. It is a small (< 55 mm total length) annual teleost
endemic to naturally fragmented lagoon environments along the entire coast of
California, USA (Swift et al. 1989, United States Fish and Wildlife Service 1994). The
tidewater goby is unique among eastern Pacific bay gobies because it lacks an explicit
marine dispersal stage and spends its entire life cycle within discrete coastal wetlands
naturally fragmented by the presence of sand bars that restrict access to the Pacific Ocean
(Swift et al. 1989, Swenson 1999, Dawson et al. 2002). These sand bars generally breach
one to two times a year during periods of high surf and freshwater input resulting in rapid
draining of the estuary (Kraus et al. 2002). Thus, successful migration between lagoon
habitats requires coordination of the breaching events. Further, populations are separated
by one to 20 km of inhospitable coastline, and although the species is tolerant of full
strength seawater, migration between lagoons is thought to be very rare (Crabtree 1985,
Swift et al. 1989, Lafferty et al. 1999, Swenson 1999, Dawson et al. 2001, Dawson et al.
2002).

3
In addition to natural fragmentation, habitat destruction from agriculture and
coastal development resulted in a drastic decline in the number of known populations,
resulting in the listing of tidewater goby as endangered under the United States
Endangered Species Act (United States Fish and Wildlife Service 1994). Presently, about
21 percent of the 135 historically documented populations are extirpated, and about 50
percent of the remaining populations are considered vulnerable to extinction due to
severe habitat degradation (United States Fish and Wildlife Service 2005, 2007). This
study focuses on the 13 extant populations of tidewater goby inhabiting the North Coast
region of California (United States Fish and Wildlife Service 2005) (Figure 1).
North Coast tidewater goby represent a distinct mitochondrial DNA clade
divergent from all other populations (Dawson et al. 2001). They also possess a fully
developed cephalic lateral line canal system - a morphological adaptation thought to
improve sensory ability in the generally wetter climate of the North Coast region (Ahnelt
et al. 2004). In addition, tidewater goby have remained relatively abundant in the North
Coast region, with only two well documented population extirpations within the last 60
years (United States Fish and Wildlife Service 2008). Taken together, these features
make North Coast tidewater goby ideal for studying conservation genetics of an
endangered species within the broader ecological context of habitat fragmentation.
Tidewater goby populations are found at two spatial scales in the North Coast
region, bay and coast (Figure 1). The bay scale consists of eight artificially fragmented
populations within Humboldt Bay, California’s second largest estuary (Barnhart et al.
1992). These populations inhabit the lower reaches of streams flowing into Humboldt

4
Figure 1. Tidewater goby occur in isolated lagoons along the California coast in western North America. (a.) Rectangle depicts the North Coast region of California, (b.) five sample locations at the coast scale [Lake Earl (ERL), Stone Lagoon (STN), Big Lagoon (BIG), Virgin Creek (VRG), Pudding Creek (PUD)], and (c.) eight collection sites in Humboldt Bay [McDaniel Slough (MCD), Gannon Slough (GAN), Gannon Pond (PND), Jacoby Creek (JAC), Wood Creek (WDC), Elk River (ELK), Salmon Creek (SAL), Eel River (EEL)].

5
Bay, and habitat area available for tidewater goby in these sites varies from
approximately 0.2 to 396.9 ha (United States Fish and Wildlife Service 2008) (Table 1).
A combination of tide gates and levees mute tidal exchange within bay habitats
(Chamberlain 2006), and all populations are isolated from each other by reclaimed
wetlands modified for human uses. An average pairwise distance of 12.9 km separates
bay populations, with a range of 0.3 to 8.4 km between sites (United States Fish and
Wildlife Service 2008). The coast scale is comprised of five populations in Del Norte,
Humboldt, and Mendocino counties, covering the northernmost 300 km of coastline in
the species range. These populations occupy lagoons that range in size from 4.5 to
1085.4 ha and are isolated from each other by 1.9 to 190.5 km of inhospitable coastline
(United States Fish and Wildlife Service 2008) (Table 1). An average pairwise distance
of 146.8 km separates coast populations. All coast scale populations are isolated by sand
bars that restrict tidal exchange between the Pacific Ocean and the lagoon (Chamberlain
2006).
The objective of this study was to evaluate how fragmentation has influenced
neutral genetic variation of the endangered tidewater goby in the North Coast region.
Specifically, we asked the following questions:
1. How do levels of genetic differentiation compare among artificially and naturally
fragmented populations? Despite the lack of an explicit marine dispersal phase in
the life history of the tidewater goby, both abundance survey and genetic evidence
suggest that periodic migration between neighboring populations must sometimes
occur (Lafferty et al. 1999, Swenson 1999, Dawson et al. 2001). While this

6
Table 1. North Coast tidewater goby study populations included in the bay and coast scales (listed from north to south), with sample identification codes, habitat area, and geographic coordinates, California, 2006.

7
species appears to maintain some gene flow among populations that are naturally
fragmented, we propose that migration will be reduced among artificially
fragmented populations, resulting in a pattern of increased genetic differentiation
at smaller spatial scales (Bohonak 1999).
2. Can a species that is well-suited to natural fragmentation maintain genetic
diversity in an artificially fragmented situation? The tidewater goby possesses
several adaptations to living in the naturally fragmented estuaries of California,
including an annual life history that is completed entirely within lagoons, early
sexual maturation, multiple spawning periods, and tolerance to a broad range of
environmental conditions (Goldberg 1977, Swift et al. 1989, Swenson 1999,
Dawson et al. 2002, McGourty et al. 2008). While the species persists and is
often abundant in these seasonally dynamic and isolated environments, we predict
that reductions in available habitat from artificial fragmentation will lead to lower
levels of genetic diversity.

8
MATERIALS AND METHODS
Sample Collections
Tissue samples were collected August and September 2006 from 706 individuals
representing all known populations in the North Coast region at the time of this study
(United States Fish and Wildlife Service 2005, Figure 2, Table 1). Approximately equal
numbers of individuals were gathered from each scale with beach seine or dip net. Tissue
samples were obtained non-lethally by dissection of a small (one mm2) piece of the pelvic
disc and were either dried or preserved in 95 percent ethanol. Individuals were held in a
recovery tank to ensure survival before release. Mortalities were stored as voucher
specimens in the Humboldt State University Fish Collection (Catalog Numbers: HSU
4498-4512). Genomic DNA was extracted using spin columns lined with a silica
membrane (Qiagen DNeasy® Blood and Tissue Kit) following the manufacturers
protocols.
Microsatellite DNA Analysis
Variation was assayed at eight microsatellite loci recently developed from
samples collected throughout the species’ range (primer sequences provided by D. K.
Jacobs, Department of Ecology and Evolutionary Biology, University of California Los
Angeles, Los Angeles, CA 90095), and one microsatellite locus previously developed
from central California populations (Mendonca et al. 2001). Genotypes were assayed by
polymerase chain reaction with fluorescent labeling of the forward primer and automated
capillary gel electrophoresis. Reactions were performed using Master Mix® (Promega,
Madison, WI) in an MJ Research (Waltham, MA) PTC-100 thermal cycler with 12.5 µl

9
volumes. Cycling conditions were standardized over all loci as follows: 95°C for 15 min,
12 cycles of 94°C 30 s, 60°C 90 s -0.5°C per cycle, 72°C 60 s, 33 cycles of 89°C 30 s,
55°C 90 s, 72°C 60 s, followed by 60°C for 30 min and then cooled to 4°C. All
microsatellite genotypes were read and scored using the Beckman-Coulter CEQ 8000
Genetic Analysis System. We verified all fragment sizes estimated by Beckman-Coulter
Genetic Fragment Analysis software by visual inspection of the electropherograms.
Test of Assumptions
We estimated the microsatellite scoring error rate in my dataset by randomly re-
sampling 10 percent of the individuals assayed from each population and re-genotyping
them. The original electropherograms were compared to the test electropherograms to
evaluate levels of large allele dropout and technical sizing errors. We calculated the error
rate per allele and per reaction for each locus, and then averaged the rate over all loci
(Bonin et al. 2004, Dewoody et al. 2006). ARLEQUIN 3.1 (Schneider et al. 2000) was
used to test microsatellite genotypes for deviations from Hardy-Weinberg Equilibrium at
each locus within each population with a Markov Chain Monte Carlo procedure of
Fisher’s exact test. Strict Bonferroni corrections were applied to critical significance
levels to adjust for multiple comparisons (Rice 1989). We used FSTAT 2.9.3.2 (Goudet
1995) to test for genotypic disequilibrium on each locus pair across all populations with
9,360 permutations.

10
Population Structure
We used the Bayesian assignment algorithm implemented in the computer
program STRUCTURE 2.2 (Pritchard et al. 2000, Falush et al. 2003) to estimate the
number of genetically distinct clusters (K) of individuals based on their multi-locus
genotypes. The default options were utilized in the program. To do this we used the
admixture model, ignoring sample collection locality, and assuming allele frequencies
were correlated. We began with a series of pilot runs to estimate the likelihood of K
based upon the data at each K from one to 13 (i.e., the total number of distinct geographic
sampling localities) by running four independent runs of 1,000,000 iterations each
preceded by a burn in period of 100,000 iterations. From these pilot runs we determined
that the L(K) increased in a step-wise manner up to nine clusters. We focused on the
range of one to 10 clusters and ran 16 more independent runs at each of these K for a total
of 20 replicates. We evaluated the hierarchical patterns of population clustering by
plotting the proportional membership coefficients (Q) of individuals based on admixture
analyses at several levels of population structure in DISTRUCT 1.1 (Rosenberg 2004).
In the documentation for STRUCTURE 2.2, the authors suggest caution in
determining the number of genetically distinct clusters of individuals in situations when
the L(K) increases in a step-wise manner with increasing parameter (K) values (Pritchard
and Wen 2003). To avoid overestimating K, we relied on ΔK (Evanno et al. 2005), which
takes into account the rate of change and variance in the probability between replicate
runs at each value of K, to infer the most biologically meaningful amount of population
structure.
11
We constructed a phenogram of North Coast tidewater goby populations using
PHYLIP 3.67 (Felsenstein 1993). Cavalli-Sforza and Edwards (1967) chord distances
were estimated between population pairs and an unrooted neighbor-joining tree was
generated. Support for branches was estimated by building 1,000 bootstrap
pseudoreplicates and a majority-rule consensus tree.
FSTAT was used to estimate genetic differentiation (FST) between population
pairs and test for their significance (Weir and Cockerham 1984). We assessed relative
influences of migration and drift on population structure at each scale by correlating FST
with geographic distance and testing for statistical significance with 20,000 permutations
of Mantel’s (1967) test in FSTAT (Hutchinson and Templeton 1999). A significant
linear relationship of increased genetic differentiation at greater geographic distances is
expected under the stepping-stone model of gene flow when the opposing forces of
migration and drift are in equilibrium (Johnson et al. 2003, Jordan and Snell 2008). In
contrast, a non-significant linear relationship between genetic differentiation and
geographic distance combined with large variance in population divergence is expected
under the scenario of drift in extreme isolation (Hutchinson and Templeton 1999).
Genetic Diversity
We used HP-RARE 1.0 (Kalinowski 2005) and GENALEX 6.1 (Peakall and
Smouse 2001) to estimate mean number of alleles per locus, rarefied allelic richness, and
number of private alleles per population. Rarefied allelic richness provides a better
estimate of the average number of alleles in a population and reduces bias when
comparing samples of different sizes (Kalinowski 2004). ARLEQUIN was used to
estimate observed (HO) and Nei’s (1978) unbiased expected heterozygosity (HE). Tests

12
for significant differences in estimates of rarefied allelic richness and observed
heterozygosity between bay and coast scales were performed with 15,000 permutations of
the populations between scales in FSTAT.
We evaluated the influence of demography on the genetic diversity and
differentiation of North Coast tidewater goby in two ways. First, to investigate the
effects of habitat area on genetic diversity within populations, we plotted rarefied allelic
richness as a function of Log10 habitat area (ha) for each population scale, and tested the
null hypothesis that levels of genetic diversity are independent of population size (with
available habitat area assumed to be a correlate of population size) (Jordan and Snell
2008). A significant relationship is expected between these two variables when
reductions in available habitat area have resulted in population bottlenecks. Second, to
evaluate the role of fluctuating population sizes on genetic differentiation, we correlated
FST with the average of observed heterozygosity for each population pair at inter and
intra-scale levels (Hedrick 1999, Goodman et al. 2001, Jordan and Snell 2008). A
significant negative correlation between FST and mean pairwise HO is expected when drift
in isolation has reduced genetic diversity and inflated estimates of population
differentiation. All tests for statistical significance were conducted with 20,000
permutations of the Mantel test in FSTAT.
Mitochondrial DNA
In addition to the microsatellite assays, we also sequenced a total of 103
individuals from the 13 populations at the D-loop region of the mitochondrial control
region using primers CR-A and CR-M (Lee et al. 1995). Polymerase chain reactions were
performed using Master Mix® (Promega, Madison, WI) in a MJ Research (Waltham,

13
MA) PTC-100 thermal cycler with 25 µl volumes following cycling conditions as in
Dawson et al. (2001). Template was sequenced using the forward primer CR-A at High-
Throughput Sequencing Solutions (University of Washington, Department of Genome
Sciences). We visually inspected sequences using the computer program FINCH TV 1.4
(Geospiza, Inc.) and aligned them in CLUSTALX2 (Larkin et al. 2007). MACCLADE
4.06 (Maddison and Maddison 2008) was used to manually edit the aligned sequences.
We used ARLEQUIN to calculate a mismatch distribution for North Coast
tidewater goby and to test the observed distribution for goodness-of-fit to the expected
distribution of a rapidly expanding population with 10,000 bootstrap pseudoreplicates
(Rogers and Harpending 1992). Sequence variation was assessed by estimating
haplotype diversity (h) and nucleotide diversity (π) for each population (Nei 1987).

14
RESULTS
Tests of Assumptions
The microsatellite loci assayed exhibited varying levels of polymorphism that
ranged from three to 30 alleles per locus (Table 2). On average, less than five percent of
the microsatellite genotypes were missing from the final dataset, and levels of missing
data are reported per locus (Table 2). We checked for microsatellite scoring errors in the
dataset by re-analyzing a random subset of individuals. The results indicated that some
mistakes were present due to large allele dropout and technical sizing errors of the
automated capillary gel electrophoresis procedure. Average error rates were within the
generally accepted range of five percent of alleles and two percent of reactions
(DeWoody et al. 2006) and are reported for each locus (Table 2). The errors discovered
were corrected and all of the electropherograms were carefully re-inspected for evidence
of similar microsatellite scoring errors.
Testing for Hardy-Weinberg Equilibrium at each locus in each population gave a
possibility of 117 tests. All populations except Lake Earl, Virgin Creek, and Pudding
Creek contained at least one monomorphic locus, which could not be tested. Excluding
the monomorphic loci gave a total of 89 possible tests. Four tests showed departure from
Hardy-Weinberg Equilibrium (CATG2 in Lake Earl, CATG2 and TAGA11 in McDaniel
Slough, and B113 in Eel River), but after strict Bonferroni corrections for multiple
comparisons (P=0.0006, for an experiment-wide significance at α=0.05) all loci in all
populations conformed. None of the tests for genotypic disequilibrium were significant
15
after 9360 permutations at the adjusted five percent nominal significance level of
P≤0.0001.

16
Table 2. North Coast tidewater goby microsatellite information, including primer sequences, repeat lengths, number of alleles, size ranges, and quality control results (percent missing data, percent errors per allele, percent errors per reaction), California, 2006.

17
Population Structure
The Bayesian cluster analysis performed in STRUCTURE returned the highest
likelihood at nine clusters of genetically distinct individuals (Figure 2). After examining
the membership coefficient plots at nine clusters it was apparent that the L(K) alone was
overestimating the number of genetically distinct clusters of individuals because all of the
genotypes within some populations were split in half between groups (Figure 3). With
consideration to the author’s warnings on the potential for overestimating K based on
L(K) alone (Pritchard and Wen 2003), we relied on ΔK to infer the most biologically
meaningful grouping of populations. The highest ΔK was at two groups of populations
(Figure 2). One group consisted of all bay scale populations and the other group
consisted of all coast scale populations (Figure 3).
The neighbor-joining phenogram that we constructed using Cavalli-Sforza and
Edwards (1967) chord distances was consistent with the Bayesian results of population
structure (Figure 4). The longest branch separated bay samples from coast samples with
100 percent bootstrap support. Within the coast scale, populations south of Humboldt
Bay were strongly divergent (100 percent bootstrap support) from populations north of
Humboldt Bay (82 percent bootstrap support).
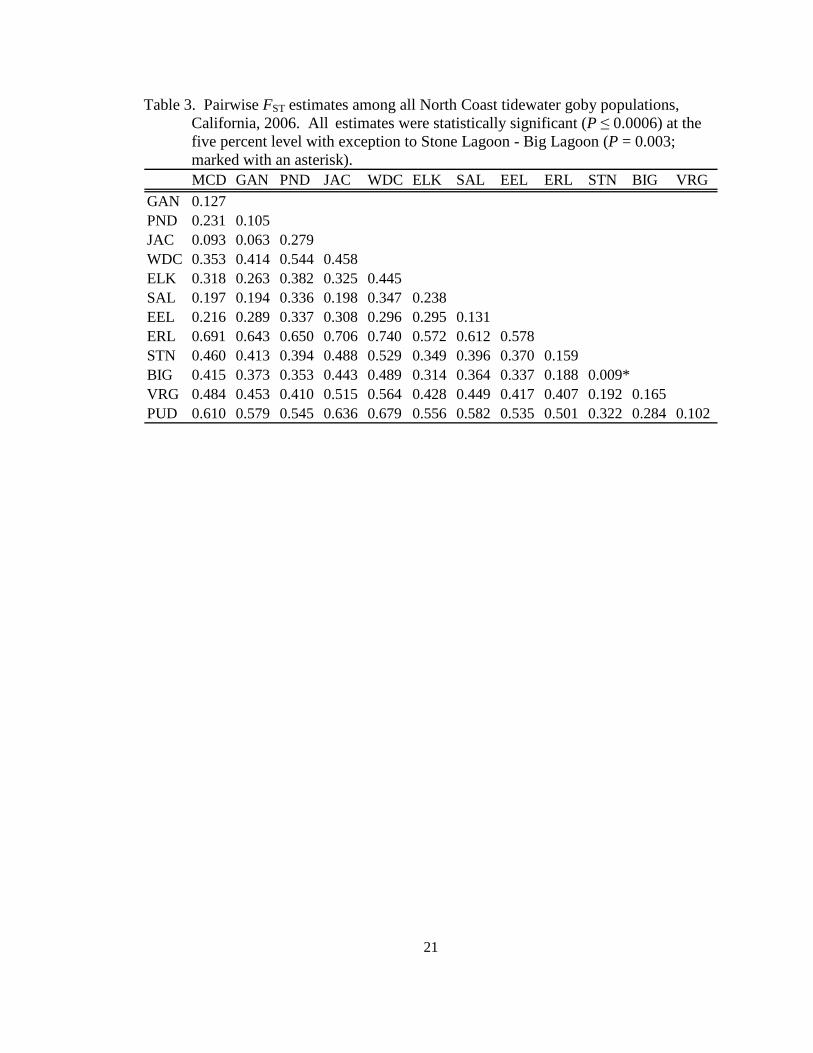
Pairwise estimates of FST ranged from 0.01 to 0.74, with a mean of 0.39,
indicating very high levels of genetic differentiation over all populations (Table 3). All
estimates of FST were significant after 1,560 permutations (adjusted five percent
significance level for multiple comparisons was at P≤0.0006) with exception to the test

18
Figure 2. ΔK and L(K) values as a function of K, the number of genetically distinct population clusters of North Coast tidewater goby, California, 2006.

19
Figure 3. Proportional membership coefficient (Q) plots of North Coast tidewater goby (California, 2006) for two to nine groups (K) of genetically distinct individuals. Collection localities are blocked by vertical black lines, population names are listed above the plots, and approximate geographic distance separating populations in each scale are below the plots. a The greatest ΔK was at K=2 groups and b, the L(K) was highest at K=9 groups.

20
Figure 4. Neighbor-joining phenogram of North Coast tidewater goby populations (California, 2006) constructed using Cavalli-Sforza and Edwards (1967) chord genetic distances. Support on branches was estimated with 1,000 bootstrap pseudoreplicates and a consensus tree.
21
Table 3. Pairwise FST estimates among all North Coast tidewater goby populations, California, 2006. All estimates were statistically significant (P ≤ 0.0006) at the five percent level with exception to Stone Lagoon - Big Lagoon (P = 0.003; marked with an asterisk).
MCD GAN PND JAC WDC ELK SAL EEL ERL STN BIG VRGGAN 0.127PND 0.231 0.105JAC 0.093 0.063 0.279WDC 0.353 0.414 0.544 0.458ELK 0.318 0.263 0.382 0.325 0.445SAL 0.197 0.194 0.336 0.198 0.347 0.238EEL 0.216 0.289 0.337 0.308 0.296 0.295 0.131ERL 0.691 0.643 0.650 0.706 0.740 0.572 0.612 0.578STN 0.460 0.413 0.394 0.488 0.529 0.349 0.396 0.370 0.159BIG 0.415 0.373 0.353 0.443 0.489 0.314 0.364 0.337 0.188 0.009*VRG 0.484 0.453 0.410 0.515 0.564 0.428 0.449 0.417 0.407 0.192 0.165PUD 0.610 0.579 0.545 0.636 0.679 0.556 0.582 0.535 0.501 0.322 0.284 0.102
22
between Stone and Big Lagoons (P=0.003). Mean FST was 0.28 in the bay scale and 0.23
in the coast scale. The highest levels of genetic differentiation were detected between the
two scales, where average FST was 0.47. The relationship between genetic differentiation
and geographic distance was not significant in the bay scale (R2=0.0241; P=0.4325), with
large amounts variance in population divergence apparent at all pairwise geographic
distances (Figure 5). The model of isolation-by-distance in the coast scale was highly
significant (P=0.0006), with geographic distance explaining 75 percent of the variation in
genetic differentiation between populations (Figure 5).
Genetic Diversity
The mean number of alleles per locus within populations ranged from 1.4 to 3.0 at
the bay scale and 3.2 to 6.8 at the coast scale (Table 4). Levels of rarified allelic richness
were 1.4 to 2.7 at the bay scale and 2.9 to 5.0 at the coast scale. Private alleles were
detected within one bay population and in four coast populations. Observed
heterozygosity ranged from 0.10 to 0.28 at the bay scale and from 0.27 to 0.59 at the
coast scale. Unbiased expected heterozygosity in the bay populations ranged from 0.12
to 0.31, and in the coast populations ranged from 0.27 to 0.57 (Table 4). Permutation
tests indicated that the bay scale populations contained significantly lower levels of
rarefied allelic richness (P=0.0009) and observed heterozygosity (P=0.0046) than the
coast scale populations.
The relationship between habitat area and rarefied allelic richness was significant
at the bay scale (P=0.0261; Mantel Test) with habitat area, a surrogate for population
size, explaining 59 percent of the variation in allelic richness (Figure 6). In contrast,

23
Figure 5. The relationships between pairwise genetic differentiation (FST) and geographic distance for the bay scale (white squares, dotted line) and the coast scale (black circles, solid line) of North Coast tidewater goby, California, 2006. The only significant relationship was in the coast scale (R2=0.7504, P=0.0006; Mantel Test).

24
Table 4. Populations samples size (n), percent missing data, number of monomorphic loci (nML), number of private alleles (Ap), and measures of genetic diversity [mean ± standard error: alleles per locus (A), rarified allelic richness (Ar), expected heterozygosity (HE), observed heterozygosity (HO)] in North Coast tidewater goby, California, 2006. Population n Missing Data (%) n ML A p A (±SE) [A r (±SE)] H E (±SE) H O (±SE)
Bay ScaleMCD 32 2.1 4 0 1.9 (0.3) [1.8 (0.3)] 0.18 (0.07) 0.18 (0.08)GAN 52 6.4 3 0 2.1 (0.4) [1.9 (0.3)] 0.22 (0.09) 0.22 (0.09)PND 17 2.6 5 0 1.6 (0.2) [1.6 (0.2)] 0.21 (0.09) 0.23 (0.10)JAC 52 5.3 3 0 1.9 (0.3) [1.7 (0.2)] 0.15 (0.06) 0.16 (0.07)WDC 52 5.6 5 0 1.4 (0.2) [1.4 (0.2)] 0.12 (0.06) 0.10 (0.06)ELK 51 7.8 2 0 2.0 (0.2) [1.8 (0.2)] 0.27 (0.07) 0.28 (0.08)SAL 52 3.0 3 1 2.7 (0.7) [2.2 (0.6)] 0.25 (0.09) 0.23 (0.09)EEL 52 6.6 1 0 3.0 (0.7) [2.7 (0.5)] 0.31 (0.09) 0.28 (0.09)Coast ScaleERL 52 3.8 0 2 5.0 (1.6) [3.2 (1.0)] 0.27 (0.10) 0.27 (0.10)STN 53 9.4 1 4 6.6 (2.2) [4.9 (1.4)] 0.52 (0.09) 0.52 (0.09)BIG 52 6.2 1 6 6.8 (2.3) [5.0 (1.3)] 0.57 (0.09) 0.59 (0.09)VRG 52 2.6 0 3 4.3 (0.8) [3.7 (0.6)] 0.57 (0.07) 0.58 (0.07)PUD 52 2.6 0 0 3.2 (0.9) [2.9 (0.7)] 0.43 (0.08) 0.45 (0.09)

25
Figure 6. The relationships between rarefied allelic richness and habitat area for the bay scale (white squares, dotted line) and the coast scale (black circles, solid line) of North Coast tidewater goby populations, California, 2006. The only significant relationship was in the bay scale (R2=0.5873, P=0.0261; Mantel Test).
26
rarefied allelic richness was not related to population size in the coast scale (R2=0.1881,
P=0.4054; Mantel Test). Inter-scale levels of genetic differentiation were significantly
correlated with genetic diversity (P<0.00001; Mantel Test), where the mean observed
heterozygosity of population pairs explained 84 percent of the variation in FST between
the bay and coast scales (Figure 7).
Mitochondrial DNA
Five hundred and twenty-two bases of mitochondrial DNA control region from
103 tidewater goby were aligned. We detected a total of nine different haplotypes from
the 13 populations assayed, of which one haplotype (H1) occurred at a high frequency in
both bay and coast scales, occurring in 78 percent of individuals sampled (Table 5). The
remaining eight haplotypes were restricted to the coast scale and occurred at low
frequencies (one to eight percent). Each coast scale population contained at least one
private haplotype (Table 6).
Pairwise sequence differences were distributed exponentially, with an average of
0.59 differences, ranging from zero to four mismatches. The mismatch distribution was
not significantly different than the distribution expected under the model of rapid
expansion (P = 0.8688). Haplotype diversity was absent throughout the bay scale but
ranged from 0.25 to 0.75 in the coast scale (Table 6). Nucleotide diversity was not
detected in any bay scale population but ranged from 0.0005 to 0.0018 in the coast scale.

27
Figure 7. The correlations between pairwise genetic differentiation (FST) and average of observed heterozygosity (HO) for the bay scale (white squares, dotted line), the coast scale (black squares, solid line), and between scales (crosses, dashed line) of North Coast tidewater goby, California, 2006. The only significant relationship was between scales (R2=0.8398, P<0.0001; Mantel Test).

28
Table 5. Distribution of North Coast tidewater goby haplotypes per population, California, 2006. “H” refers to the specific haplotype composed of the nucleotide substitutions shown under numbers corresponding to location in the 522 base sequence of mitochondrial DNA control region.
0 0 2 2 3 4 4 Bay Scale Coast Scale6 9 5 6 7 5 84 5 3 0 1 8 4 MCD GAN PND JAC WDC ELK SAL EEL ERL STN BIG VRG PUD
H1 G A A C A C A 4 9 4 9 9 9 9 9 7 4 4 2H2 . . . . . . G 1H3 . . . . . T . 6 2H4 . . . . G . . 1H5 . . . T . . . 1H6 . . G . . T . 6H7 . G . . . . . 2 3H8 . G . T . . . 1H9 T . . T . T . 1

29
Table 6. Populations with samples size (n), number of haplotypes (nH), number of private haplotypes (npH), and measures of mitochondrial DNA control region diversity [mean ± standard error: haplotype diversity (h), nucleotide diversity (π)] in North Coast tidewater goby, California, 2006. Population n n H n pH h (±SE) π (±SE)Bay ScaleMcDaniel Slough 4 1 0 0.00 (0.00) 0.0000 (0.0000)Gannon Slough 9 1 0 0.00 (0.00) 0.0000 (0.0000)Gannon Pond 4 1 0 0.00 (0.00) 0.0000 (0.0000)Jacoby Creek 9 1 0 0.00 (0.00) 0.0000 (0.0000)Wood Creek 9 1 0 0.00 (0.00) 0.0000 (0.0000)Elk River 9 1 0 0.00 (0.00) 0.0000 (0.0000)Salmon Creek 9 1 0 0.00 (0.00) 0.0000 (0.0000)Eel River 9 1 0 0.00 (0.00) 0.0000 (0.0000)Coast ScaleLake Earl 8 2 1 0.25 (0.06) 0.0005 (0.0020)Stone Lagoon 8 4 2 0.75 (0.05) 0.0018 (0.0006)Big Lagoon 8 3 1 0.68 (0.04) 0.0015 (0.0005)Virgin Creek 9 3 1 0.56 (0.06) 0.0016 (0.0005)Pudding Creek 8 2 1 0.43 (0.06) 0.0008 (0.0003)

30
DISCUSSION
Historical Context
The coastal lagoons and estuaries that North Coast tidewater goby inhabits were
formed when the last rapid rise of sea level slowed approximately 7,000 years ago. This
allowed sandbars to build and extend across open embayments (Barnhart et al. 1992,
Stanley and Warne 1994). Range-wide phylogoegraphic analyses suggest that tidewater
goby expanded from their ancestral range in central California and colonized the North
Coast region during this Holocene deceleration of sea level rise (Dawson et al. 2001,
Dawson et al. 2002). The mitochondrial DNA mismatch distribution and haplotype data
herein are consistent with this hypothesis, suggesting that colonization of the North Coast
region occurred as a single, recent episode of rapid expansion to newly formed habitats
(Rogers and Harpending 1992).
We found no haplotype or nucleotide diversity within or between any of the bay
scale populations, suggesting either recent drift or a lack of mitochondrial DNA
divergence prior to artificial fragmentation (Fumagalli et al. 2002). In agreement with
previous studies, the presence of private haplotypes in every coast scale population
indicates that migration is rare (Swift et al. 1989, Lafferty et al. 1999, Dawson et al.
2001, Dawson et al. 2002).
Bay Scale
Extreme genetic consequences are expected for artificially fragmented
populations (Templeton et al. 1990, Frankham 1995). The eight populations in the bay
exhibited very high levels of genetic differentiation at small spatial scales combined with

31
low genetic diversity. My results strongly suggest these patterns are due to recent drift in
isolation as shown by:
1. Lack of any mitochondrial DNA sequence variation.
2. No relationship between genetic differentiation and geographic distance.
3. The prevalent fixation of polymorphic microsatellite loci.
4. A strong correlation between habitat area and rarefied allelic richness.
Humboldt Bay has suffered a 90 percent reduction in marsh habitat from
anthropogenic manipulation of the estuary beginning 120 years ago (Barnhart et al.
1992). Construction of jetties at the bay entrance, persistent dredging of the sand bar,
human induced erosion, and the ubiquitous diking and draining of surrounding wetlands
have resulted in drastic changes to the morphology of Humboldt Bay (Barnhart et al.
1992). It has been suggested that prior to artificial fragmentation, a large population of
tidewater goby was distributed throughout the 4,047 ha of potentially suitable habitat
recently lost through these land use practices (United States Fish and Wildlife Service
2008). Human activities around Humboldt Bay have threatened the historically large
population in two critical ways. First, destruction of 90 percent of the tidewater goby’s
habitat reduced the size of the ancestral population. Second, the presence of tide gates
and levees around suitable habitat patches has restricted gene flow between the
insularized and (or) recently founded populations. These two processes have resulted in a
scenario of rampant drift in isolation; driving extreme genetic differentiation at small
spatial scales and reducing genetic diversity through demographic stochasticity and
inbreeding over the last 120 years.

32
In most circumstances, artificially fragmented populations are not expected to
behave as a metapopulation, as dispersal is often severely restricted and local extinctions
are not followed by recolonization (Hanski and Gilpin 1991). However, surveys
conducted throughout Humboldt Bay have indicated the alternating presence and absence
of tidewater goby at certain sites. Further, the observation that flooding during severe
winter storms inundates reclaimed wetlands that separate habitat patches has led to
speculation that the artificially fragmented bay populations comprise a metapopulation
(United States Fish and Wildlife Service 2008). Whereas seasonal flooding has been
shown to explain a small (but statistically non-significant) portion of tidewater goby
recolonization rates in the naturally fragmented coast populations of southern California
(Lafferty et al. 1999), all evidence from this study suggests population interaction among
the artificially fragmented bay scale is not an important component influencing genetic
variation. Thus, while assuming a metapopulation model and treating the bay scale
populations as a single unit may be convenient for management purposes (Chamberlain
2006, United States Fish and Wildlife Service 2008), we suspect that the variance in
detectability of bay populations may represent an artifact of sampling rather than
metapopulation dynamics (Swift et al. 1989, Swenson 1999).
Coast Scale
Natural fragmentation often occurs over geologic timescales and is expected to
increase the genetic differentiation of subpopulations when dispersal is limited. The five
populations in the coast scale generally exhibited high levels of genetic differentiation
combined with substantial amounts of genetic diversity. My results suggest that most of

33
these populations have remained large and stable since Holocene colonization, and that
migration between them occurs on an infrequent basis, as shown by:
1. Mitochondrial DNA sequence variation and private haplotypes.
2. Strong genetic isolation-by-distance.
3. Considerable microsatellite DNA polymorphism.
4. No relationship between habitat area and rarefied allelic richness.
The coast scale populations are found in the largest habitats separated by some of
the longest geographic gaps present throughout the species range (Swift et al. 1989,
United States Fish and Wildlife Service 2007). The inherent isolation and discrete
distribution of lagoon habitats appears to not entirely eliminate migration among these
naturally fragmented coast populations. The strong genetic isolation-by-distance reflects
the infrequent nature of chance migration among populations, whereby a combination of
unlikely events must occur for successful gene flow, including coordination of distinct
lagoon breaching and passive dispersal of the small benthic fish into new habitats
(Swenson 1999). However, the non-significant estimate of population differentiation
between Stone and Big Lagoon populations (8.55 km apart) suggests that there is enough
gene flow between these two naturally fragmented populations to prevent genetic
divergence. Taken together, this information supports the hypothesis that migration
occurs among isolated populations of tidewater goby, and is more likely between
geographically proximate habitats (Lafferty et al. 1999, Dawson et al. 2001).
Genetic diversity appeared substantial within most of the coast scale populations.
Locus fixation was rare, private alleles were common, and levels of allelic richness
indicated a considerable degree of microsatellite DNA polymorphism within populations.

34
Estimates of heterozygosity were similar among the coast populations with one notable
exception: Lake Earl contained markedly reduced levels of heterozygosity (Table 4).
This result has been confirmed by comparison of our 2006 heterozygosity estimate to that
generated by an analysis of 48 Lake Earl tidewater goby from 1999 (authors, unpublished
data) that revealed consistently low levels of heterozygosity (Ho = 0.29 (0.06 SE)) in
Lake Earl.
Lake Earl is California’s largest coastal lagoon and is thought to support the most
abundant population range-wide of a few million tidewater gobies (Swift et al. 1989,
United States Fish and Wildlife Service 2005). Unlike the other four coast scale
populations studied, Lake Earl is artificially breached several times a year during the fall
and winter months (United States Fish and Wildlife Service 2008). This management
practice has occurred for at least 75 years, initially for the purpose of increasing
pastureland for livestock grazing, and recently to prevent flooding of private property
around the lagoon (California Coastal Commission 1999). Each artificial breach results
in rapid draining of the lagoon and reductions in habitat for the tidewater goby (United
States Fish and Wildlife Service 2008). Many thousands of individuals are swept into the
Pacific Ocean immediately after each breach, and stranding of tidewater gobies within
small pools around the perimeter of the lagoon is well documented (United States Fish
and Wildlife Service 2005). This problem is so pervasive that special conditions outlined
in the permit to breach Lake Earl require the permittees to survey for stranded gobies and
return them to the main basin of the lagoon following each breaching event (California
Coastal Commission 1999, United States Fish and Wildlife Service 2008). We suspect

35
that the markedly reduced levels of heterozygosity in Lake Earl may be due to the
numerous population bottlenecks resulting from artificial breachings.
Artificial versus Natural Fragmentation
Artificial fragmentation has resulted in extreme genetic consequences to the bay
scale populations. The severity of these genetic effects are emphasized by the fact that
the artificially fragmented bay populations are separated by merely 0.3 to 28.5 km of
reclaimed wetlands, however they contain higher amounts of population structure than
the coast populations (Figure 3, Table 3), which are naturally fragmented by up to 267.8
km of inhospitable coastline. This drastic difference in geographic magnitude
exemplifies the significance of the increased population structure detected within the
artificially fragmented bay scale. Thus, migration among the bay populations has been
reduced or eliminated due to the artificial fragmentation, yet the coast populations appear
to maintain small amounts of gene flow in their naturally fragmented distribution (Figure
5).
Artificial habitat fragmentation has resulted in a severe reduction of genetic
diversity within the bay populations, whereas genetic diversity appears to be maintained
in most of the naturally fragmented coast populations (Table 4, Table 6). The artificially
fragmented bay populations contained, on average, less than half the amount of genetic
diversity as the naturally fragmented coast populations. One concern when comparing
genetic diversity among populations of varying size is that large populations are expected
to contain more alleles than small populations. Levels of heterozygosity, however are
thought to generally remain independent of population size, and can thus be used to
36
compare genetic diversity among populations found in both large and small habitats
(Allendorf and Luikart 2007). The permutation test between scales confirmed that
observed heterozygosity was significantly lower in the bay populations. Therefore, the
reductions of genetic diversity in the bay scale have been due to the consequences of
artificial habitat fragmentation. In contrast, my results from the coast scale suggest that
even populations persisting in small habitats have maintained robust levels of genetic
diversity. For example, expected heterozygosity in Virgin Creek (HE=0.57), a population
found in an estuary smaller than most of the bay group habitats (4.5 ha), matches that of
Big Lagoon (HE=0.57), one of the largest tidewater goby habitats range-wide (612.5 ha).
The extreme levels of genetic differentiation (mean pairwise FST = 0.39) estimated
across all North Coast populations were surprising. By hierarchically examining
estimates, we found that the average pairwise genetic differentiation between the bay and
coast scales was 0.47. This is approximately twice the amount of differentiation
estimated within either scale. The significant correlation of mean pairwise observed
heterozygosity and genetic differentiation between bay and coast scales explains these
extreme FST estimates (Figure 7). This relationship together with the significant
correlation of rarefied allelic richness and habitat area in the bay scale (Figure 6) suggests
that rampant drift in bay populations has resulted in the extreme estimates of genetic
differentiation between scales.
Conservation Strategies
Due to the extent that both natural and artificial habitat fragmentation have caused
marked divergence among North Coast tidewater goby, all populations are of
conservation concern because they may contain unique genetic material not replicated

37
elsewhere within the species. However, the threat of extirpation exists at different
intensities at the two scales examined. The Humboldt Bay populations appear to be at an
extreme risk of extinction due to low levels of genetic diversity and lack of among
population migration. Within Humboldt Bay we recommend habitat restoration activities
that would increase the potential for between population migration. Population surveys
conducted before and after restoration projects in artificially fragmented terrestrial
habitats have shown increases in dispersal, recolonization, and population growth
following the return to natural conditions (Brisson et al. 2003). If habitat restoration
results in increased migration among the bay scale populations, the amount of genetic
diversity within populations should increase. To evaluate the effect of restoring
connectivity among bay populations, we determined the amount of genetic diversity
within all eight bay populations combined. In this analysis we detected the fixation of
only one locus, which is comparable to the level of fixation in robust coast populations
Stone and Big Lagoon (Table 4). The reduction in the number of fixed loci would
ultimately increase mean heterozygosity in the bay. In contrast, mean allelic richness
would remain lower in the bay than in the coast populations (A=3.889 (0.964 SE), Ar=
3.053 (0.686 SE)) (Table 4). Allelic richness increases very slightly because the bay
populations all have the same alleles, but at different frequencies, having lost the same
rare alleles due to drift (Table 4). Thus, restoring connectivity would likely increase
heterozygosity and minimize some of the detrimental effects genetic diversity loss.
However, no increase in allelic diversity would be realized until mutations replaced them.
Proposed restoration projects in Humboldt Bay aimed at modifying or removing
tide gates to allow passage of threatened anadromous salmonids have not been approved

38
by managers because of concerns regarding the potentially harmful effects to the
tidewater goby (United States Fish and Wildlife Service 2008). These concerns are valid
because construction projects may result in the extirpation of some populations
(Stillwater Sciences 2006). Nonetheless, managers should consider the long-term
consequences of restricted migration and low genetic diversity of these populations, as
taking risks to modify or remove tide gates may be acceptable if habitat is restored.
Unfortunately, not all habitat restoration projects result in improved status of
imperiled species that have undergone extreme changes in genetic structure. Extended
periods of drift and inbreeding can force populations into an ‘extinction vortex’ requiring
ex situ conservation strategies (Westemeier et al. 1998). Due to this possibility, research
that measures inbreeding depression and other fitness related characters in North Coast
tidewater goby populations is essential to future conservation planning (Fumagalli et al.
2002, Johansson et al. 2007).
Professional opinions differ as to what is the best strategy for conservation of an
endangered species when populations are highly divergent and may differ in their long-
term potential for recovery. Traditionally, conservation priority is given to those
populations that have been severely threatened by habitat loss or reductions in census size
(Primack 1998). However, some scientists see this strategy as faulty and recommend
putting conservation efforts into those populations that have eminent threats but which
otherwise remain healthy (Hankin, D. G. 2008. Personal Communication. Department
of Fisheries Biology, Humboldt State University, 1 Harpst Street, Arcata, CA 95521).
Fortunately, most of the robust coast group populations of tidewater goby are already
protected within California State Parks, so preservation of these habitats should continue.
39
Lake Earl, in contrast, affords some protection through its designation as a California
Department of Fish and Game Wildlife Area, however the artificial lagoon breaching
activity appears to be reducing genetic diversity. Lake Earl presumably contains the
largest population of tidewater goby range-wide and has been assumed to be an important
source of genetic diversity in the region (United States Fish and Wildlife 2008). Thus,
prioritizing conservation of the Lake Earl population may be the most sensible approach
to the long-term recovery of the species in northern California.
40
CONCLUSIONS
Artificial fragmentation has reduced gene flow in the bay populations, resulting in
extreme consequences to the genetic structure of the tidewater goby. The levees and tide
gates isolating habitats pose obstacles that this species cannot circumvent. Levees and
tide gates will continue to threaten the long term persistence of the tidewater goby within
Humboldt Bay. In contrast, natural fragmentation has not completely eliminated gene
flow, and the genetic structure of coastal populations remains stable. The isolation
caused by the naturally formed sand bars restricts regular marine dispersal, yet migration
does occur on an infrequent basis.
The tidewater goby cannot maintain genetic diversity in artificially fragmented
populations. The species’ evolutionary history of persistence in the naturally fragmented
estuaries of California is not sufficient to mitigate degradation of genetic diversity in an
artificially fragmented situation, and the bay populations may suffer reduced fitness and
adaptive potential. Naturally fragmented coast populations, in contrast, should maintain
genetic diversity and long-term potential if their habitat is protected.
41
LITERATURE CITED
Ahnelt, H., J. Goschl, M. N. Dawson, and D. K. Jacobs. 2004. Geographical variation in the cephalic lateral line canals of Eucyclogobius newberryi (Teleostei, Gobiidae) and its comparison with molecular phylogeography. Folia Zoologica 53:385-398. Allendorf, F. W. and G. Luikart. 2007. Conservation and the genetics of populations. Blackwell Publishing, Malden, Massachusetts. Avise, J. C., J. Arnold, R M. Ball, E. Bermingham, T. Lamb, J. E. Neigel, C. A. Reeb, and N. C. Saunders. 1987. Intraspecific phylogeography: The mitochondrial DNA bridge between population genetics and systematics. Annual Review of Ecology and Systematics 18:498-522. Barnhart, R. A., M. J. Boyd, and J. E. Pequegnat. 1992. The ecology of Humboldt Bay, California: an estuarine profile. United States Department of the Interior, Fish and Wildlife Service, Biological Report 1, Washington, D. C. Barton, N. H. and B. Charlesworth. 1984. Genetic revolutions, founder effects and speciation. Annual Review of Ecology and Systematics 15:133-146. Bohonak, A. J. 1999. Dispersal, gene flow, and population structure. The Quarterly Review of Biology 74:21-45. Bonin, A., E. Bellemain, P.B. Eidesen, P. Pompanon, C. Brochmann, and P. Taberlet. 2004. How to track and assess genotyping errors in population genetics studies. Molecular Ecology 13:3261–3273. Brisson, J. A., J. L. Strasburg, and A. R. Templeton. 2003. Impact on fire management on the ecology of collared lizard (Crotaphytus collaris) populations living on the Ozark Plateau. Animal Conservation 6:247-254. California Coastal Commission. 1999. Staff report regular calendar. Application file number: 1-97-76. San Francisco, California. Cavalli-Sforza, L. L. and A. F. W. Edwards. 1967. Phylogenetic analysis: models and estimation procedures. American Journal of Human Genetics 19:233-257. Chamberlain, C. D. 2006. Environmental variables of northern California lagoons and estuaries and the distribution of tidewater goby (Eucyclogobius newberryi). United States Fish and Wildlife Service, Arcata Fisheries Technical Report TR 2006-04, Arcata, California.
Clark, A. M., B. W. Bowen, and L. C. Branch. 1999. Effects of natural habitat fragmentation on an endemic scrub lizard (Sceloporus woodi): an historical

42
perspective based on a mitochondrial DNA gene geneology. Molecular Ecology 8:1093-104. Crabtree, C. B. 1985. Allozyme variability in the tidewater goby, Eucyclogobius newberryi (Pisces: Gobiidea). Isozyme Bulletin 18:70. Dawson, M. N., K. D. Louie, D. K. Jacobs, and C. C. Swift. 2002. Comparative phylogeography of sympatric sister species, Clevelandia ios and Eucyclogobius newberryi (Teleostei, Gobiidae), across the California transition zone. Molecular Ecology 11:1065-75. Dawson, M. N., J. L. Stanton, and D. K. Jacobs. 2001. Phylogeography of the tidewater goby, Eucyclogobius newberryi (Teleostei, Gobiidae), in coastal California. Evolution 55:1167-1179. DeWoody, J., J. D. Nason, and V. D. Hipkins. 2006. Mitigating scoring errors in microsatellite data from wild populations. Molecular Ecology Notes 6:951–957. Evanno, G., S. Regnaut, and J. Goudet. 2005. Detecting the number of clusters of individuals using the software STRUCTURE: a simulation study. Molecular Ecology 14:2611-2620. Falush, D., M. Stephens, and J. K. Pritchard. 2003. Inference of population structure using multilocus genotype data: linked loci and correlated allele frequencies. Genetics 164:1567–1587. Felsenstein, J. 1993. PHYLIP-Phylogenetic Inference Package, Version 3.5c. University of Washington, Seattle, Washington. Frankham, R. 1995. Conservation genetics. Annual Review of Genetics 29:305-327. Frankham, R. 2003. Genetics and conservation biology. CR Biologies 326:S22-S29. Freeman, S. and J. C. Herron. 2007. Evolutionary analysis. 4th edition. Pearson Prentice Hall, Upper Saddle River, New Jersey. Fumagalli, L., A. Snoj, D. Jesensek, F. Balloux, T. Jug, O. Duron, F. Brossier, A. J. Crivelli, and P. Berrebi. 2002. Extreme genetic differentiation among the remnant populations of marble trout (Salmo marmoratus) in Slovenia. Molecular Ecology 11:2711-2716. Geospiza, Inc. 2006. FINCH TV 1.4. Seattle, Washington. Goldberg, S. R. 1977. Seasonal ovarian cycle in the tidewater goby, Eucyclogobius newberryi (Gobiidae). The Southwestern Naturalist 22:557-559.

43
Goodman, S. J., H. B. Tamate, R. Wilson, J. Nagata, S. Tatsuzawa, G. M. Swanson, J. M. Pemberton, and D. R. McCullough. 2001. Bottlenecks, drift and differentiation: the population structure and demographic history of sika deer (Cervus nippon) in the Japanese archipelago. Molecular Ecology 10:1357–1370. Goudet, J. 1995. FSTAT Version 1.2.: a computer program to calculate F-statistics. Journal of Heredity 86:485-486. Gysels, E. S., B. Hellemans, C. Pampoulie, and F. A. M. Volckaert. 2004. Phylogeography of the common goby, Pomatoschitus microps, with particular emphasis on the colonization of the Mediterranean and the North Sea. Molecular Ecology 13:403-417. Hanski, I. and M. Gilpin. 1991. Metapopulation dynamics: brief history and conceptual domain. Biological Journal of the Linnean Society 42:3-16. Hedrick, P. W. 1999. Perspective: highly variable loci and their interpretation in evolution and conservation. Evolution 53:313–318. Helfman, G. S. 2007. Fish conservation. Island Press, Washington, D. C. Hitchings, S. P. and T. J. C. Beebee. 1998. Loss of genetic diversity and fitness in Common Toad (Bufo bufo) populations isolated by inimical habitat. Journal of Evolutionary Biology 11:269-283. Hutchinson, D. W. and A. R. Templeton. 1999. Correlation of pairwise genetic and geographic distance measures: inferring the relative influences of gene flow and drift on the distribution of genetic variability. Evolution 53:1898-1914. Johansson, M., C. R. Primmer, and J. Merila. 2007. Does habitat fragmentation reduce fitness and adaptability? A case study of the common frog (Rana temporara). Molecular Ecology 16:2693–2700. Johnson, J. A., J. E. Toepfer, and P. Dunn. 2003. Contrasting patterns of mitochondrial and microsatellite population structure in fragmented populations of greater prairie-chickens. Molecular Ecology 12:3335-3347. Johnson, J. A., M. R. Bellinger, J. E. Toepfer, and P. Dunn. 2004. Temporal changes in allele frequencies and low effective population size in greater prairie-chickens. Molecular Ecology 13:2617–2630. Jordan, M. A. and H. L. Snell. 2008. Historical fragmentation of islands and genetic drift in populations of Galapagos lava lizards (Microlophus albemarlensis complex). Molecular Ecology 17:1224-1237.

44
Kalinowski, S. T. 2004. Counting alleles with rarefaction: private alleles and hierarchical sampling designs. Conservation Genetics 5:539-543. Kalinowski, S. T. 2005. hp-rare 1.0: a computer program for performing rarefaction on measures of allelic richness. Molecular Ecology Notes 5:187–189. Keller, I. and C. R. Largiader. 2003. Recent habitat fragmentation caused by major roads leads to reduction of gene flow and loss of genetic variability in ground beetles. Proceeding of the Royal Society of London 270:417–423. Krauss, N. C., A. Militello, and G. Todoroff. 2002. Barrier breaching process and barrier spit breach, Stone Lagoon, California. Shore and Beach 70:21-28. Lafferty, K. D., C. C. Swift, and R. F. Ambrose. 1999. Extirpation and recolonization in a metapopulation of an endangered fish, the tidewater goby. Conservation Biology 12:1447-1453. Larkin, M. A., G. Blackshields, N. P. Brown, R. Chenna, P. A. McGettigan, H. McWilliam, F. Valentin, I. M. Wallace, A. Wilm, R. Lopez, J. D. Thompson, T. J. Gibson, and D. G. Higgins. 2007. ClustalW2 and ClustalX version 2. Bioinformatics 21:2947-2948. Lee, W.-J., J. Conroy, W. H. Howell, and T. D. Kocher. 1995. Structure and evolution of teleost mitochondrial control regions. Journal of Molecular Evolution 41:54-66. Maddison, W. P. and D. R. Maddison. 2008. MacClade. Sinauer Associates, Sunderland, Massachusetts. Mantel, N. 1967. The detection of disease clustering and a generalized regression approach. Cancer Research 27:209-220. McGourty, K., A. Kinziger, and G. Goldsmith. 2008. Spawning time, fecundity, habitat utilization, and parasites of a northern California population of tidewater goby, Eucyclogobius newberryi. California Fish and Game 94:18-32. Meffe, G. K. and C. R. Carroll. 1997. Principles of conservation biology. Sinauer Associates, Sunderland, Massachusetts. Mendonca, H., J. Smith, and C. Brinegar. 2001. Isolation and characterization of four microsatellite loci in the tidewater goby (Eucyclogobius newberryi). Marine Biotechnology 3:91-95. Nei, M. 1978. Estimation of average heterozygosity and genetic distance for small number of individuals. Genetics 89:583-590.

45
Nei, M. 1987. Molecular evolutionary genetics. Columbia University Press, New York, New York. Palumbi, S. R. 2003. Population genetics, demographic connectivity, and the design of marine reserves. Ecological Applications 13:5146-5158. Peakall, R. E. and P. E. Smouse. 2001. GENALEX V5: Genetic Analysis in Excel. Population genetic software for teaching and research. Australian National University, Canberra. Available at http://www.anu.edu.au/BoZo/GenAIEx. Primack, R. B. 1998. The essentials of conservation biology. Sinauer Associates, Sunderland, Massachusetts. Pritchard, J. K., P. Stephens, and P. Donnelly. 2000. Inference of population structure using multilocus genotype data. Genetics 155:945–959. Pritchard, J. K. and W. Wen. 2003. Documentation for STRUCTURE software: Version 2. Available at http://pritch.bsd.uchicago.edu. Rice, W. R. 1989. Analyzing tables of statistical tests. Evolution 43:223-225. Rogers, A. R. and H. Harpending. 1992. Population growth makes waves in the distribution of pairwise genetic differences. Molecular Biology and Evolution 9:552–569. Rosenberg, N. A. 2004. Distruct: a program for the graphical display of population structure. Molecular Ecology Notes 4:137-138. Schneider, S., D. Roessli, and L. Excoffier. 2000. ARLEQUIN, Version 2000: a software for population genetics data analysis. Genetics and Biometry Laboratory, Department of Anthropology, University of Geneva, Switzerland. Stanley. D. J. and A. G. Warne. 1994. Worldwide initiation of Holocene marine deltas by deceleration of sea level rise. Science 265:228-231. Stillwater Sciences. 2006. Guidelines to evaluate, modify, and develop estuarine restoration projects for tidewater goby habitat. Report of Stillwater Sciences to United States Fish and Wildlife Service, Arcata, California. Swenson, R. O. 1999. The ecology, behavior, and conservation of the tidewater goby, Eucyclogobius newberryi. Environmental Biology of Fishes 55:99-114. Swift, C. C., J. L. Nelson, C. Maslow, and T. Stein. 1989. Biology and distribution of the tidewater goby, Eucyclogobius newberryi (Pisces: Gobiidae) of California.

46
Contributions in Science 404, Natural History Museum of Los Angeles County, Los Angeles, California. Templeton, A. R., K. Shaw, E. Routman, and S. K. Davis. 1990. The genetic consequences of habitat fragmentation. Annals of the Missouri Botanical Garden 77:13-27. United States Fish and Wildlife Service. 1994. Endangered and threatened wildlife and plants: determination of endangered species status for the tidewater goby. Federal Register 59:5494-5498. United States Fish and Wildlife Service. 2005. Recovery plan for the tidewater goby (Eucyclogobius newberryi). United States Fish and Wildlife Service, Portland, Oregon. United States Fish and Wildlife Service. 2007. Tidewater goby (Eucyclogobius newberryi) 5-year review: summary and evaluation, Ventura Fish and Wildlife Office, Ventura, California. United States Fish and Wildlife Service. 2008. Endangered and threatened wildlife and plants: revised designation of critical habitat for the tidewater goby (Eucyclogobius newberryi): final rule. Federal Register 73:5920-6006. Weir, B. S. and C. C. Cockerham. 1984. Estimating F-statistics for the analysis of population structure. Evolution 38:1358–1370. Westemeier, R. L., J. D. Brawn, S. A. Simpson, T. L. Esker, R. W. Jansen, J. W. Walk, E. L. Kershner, J. L. Bouzat, and K. N. Paige. 1998. Tracking the long-term decline and recovery of an isolated population. Science 282:1695-1698.