r&d day
TRANSCRIPT

R&D DayOctober 12, 2021

Today’s agenda
Introduction Grace Rauh | V.P. Communications, BridgeBio Pharma
Genetic Basis of Disease Richard Scheller, Ph.D. | Chairman of R&D, BridgeBio Pharma
BridgeBio’s Endless Summer Neil Kumar, Ph.D. | Founder and CEO, BridgeBio Pharma
Precision Cardiorenal Introduction Cameron Turtle, D. Phil. | Chief Strategy Officer, BridgeBio Pharma
Acoramidis: TTR Stabilizer for ATTR Jonathan Fox, M.D., Ph.D. | Chief Medical Officer, BridgeBio Cardiorenal
Encaleret: CaSR Inhibitor for ADH1 Mary Scott Roberts, M.D. | Sr. Director, Clinical Development, BridgeBio Cardiorenal
Gene Therapy Platform Eric David, M.D., J.D. | CEO, BridgeBio Gene Therapy
Mendelian Programs: PH1, LGMD2i, RDEB Uma Sinha, Ph.D. | Chief Scientific Officer, BridgeBio Pharma
Precision Oncology Programs: KRAS, SHP2 Eli Wallace, Ph.D. | Chief Scientific Officer, BridgeBio Oncology
BridgeBioX Charles Homcy, M.D. | Chairman of Pharmaceuticals, BridgeBio Pharma
Conclusion Neil Kumar, Ph.D. | Founder and CEO, BridgeBio Pharma
Q&A
TTR = Transthyretin amyloidosis, ADH1 = Autosomal Dominant Hypocalcemia Type 1, PH1 = Primary Hyperoxaluria Type 1, LGMD2i = Limb-Girdle Muscular Dystrophy Type 2i, RDEB = recessive dystrophic epidermolysis bullosa 2

3
Forward-Looking Statements and Disclaimer
Statements in this Presentation that are not statements of historical fact are forward-looking statements within the meaning of Section 27A of the Securities Act of 1933, as amended, and Section 21E of the Securities Exchange Act of 1934, as amended. Such forward-looking statements include, without limitation, statements regarding BridgeBio Pharma, Inc.’s (the “Company’s”) research and clinical development plans, expected manufacturing capabilities, commercialization and general strategy, regulatory matters, market size and opportunity, future financial position, future revenue, projected costs, prospects, plans, objectives of management, and the Company’s ability to complete certain milestones. Words such as “believe,” “anticipate,” “plan,” “expect,” “intend,” “will,” “may,” “goal,” “potential,” “should,” “could,” “aim,” “estimate,” “predict,” “continue” and similar expressions or the negative of these terms or other comparable terminology are intended to identify forward-looking statements, though not all forward-looking statements necessarily contain these identifying words. These forward-looking statements are neither forecasts, promises nor guarantees, and are based on the beliefs of the Company's management as well as assumptions made by and information currently available to the Company. Such statements reflect the current views of the Company with respect to future events and are subject to known and unknown risks, including business, regulatory, economic and competitive risks, uncertainties, contingencies and assumptions about the Company, including, without limitation, risks inherent in developing therapeutic products, the success, cost, and timing of the Company’s product candidate research and development activities and ongoing and planned preclinical studies and clinical trials, including for its four (4) core value driver programs, the success and timing of preclinical study and clinical trial results, the success of its clinical trial designs, the fact that successful preliminary preclinical study or clinical trial results may not result in future clinical trial successes and/or product approvals, trends in the industry, the legal and regulatory framework for the industry, the success of the Company’s engagement with the U.S. Food and Drug Administration (“FDA”) and other regulatory agencies, the Company’s ability to obtain and maintain regulatory approval for its product candidates and FDA-approved products, including NULIBRYTM (fosdenopterin) for the treatment of MoCD Type A and TRUSELTIQTM (infigratinib) for the treatment of adults with previously treated, unresectable locally advanced or metastatic cholangiocarcinoma with a fibroblast growth factor receptor 2 (FGFR2) fusion or other rearrangement as detected by an FDA-approved test, the Company’s ability to receive approval for and commercialize its product candidates and FDA-approved products, the success of current and future agreements with third parties in connection with the development or commercialization of the Company’s product candidates and FDA-approved products, the size and growth potential of the market for the Company’s product candidates and FDA-approved products, the accuracy of the Company’s estimates regarding expenses, future revenue, future expenditures and needs for and ability to obtain additional financing, the Company’s ability to be a sustainable genetic medicine innovation engine and to build the next great genetic medicine company, the Company’s ability to obtain and maintain intellectual property protection for its product candidates and approved products, the potential for NULIBRY as the first and only FDA-approved therapy for MoCD Type A, the efficacy of each of NULIBRY and TRUSELTIQ, the safety profile of each of NULIBRY and TRUSELTIQ, plans for the supply, manufacturing and distribution of each of NULIBRY and TRUSELTIQ, the competitive environment and clinical and therapeutic potential of the Company’s product candidates and FDA-approved products, the Company’s international expansion plans, potential adverse impacts due to the ongoing global COVID-19 pandemic such as delays in clinical trials, preclinical work, overall operations, regulatory review, manufacturing and supply chain interruptions, adverse effects on healthcare systems and disruption of the global economy, and those risks and uncertainties described under the heading “Risk Factors” in the Company’s most recent Annual Report on Form 10-K filed with the U.S. Securities and Exchange Commission (“SEC”) and in subsequent filings made by the Company with the SEC, which are available on the SEC’s website at www.sec.gov. In light of these risks and uncertainties, many of which are beyond the Company’s control, the events or circumstances referred to in the forward-looking statements, express or implied, may not occur. The actual results may vary from the anticipated results and the variations may be material. You are cautioned not to place undue reliance on these forward-looking statements, which speak to the Company’s current beliefs and expectations only as of the date this Presentation is given. Except as required by law, the Company disclaims any intention or responsibility for updating or revising any forward-looking statements contained in this Presentation in the event of new information, future developments or otherwise. No representation is made as to the safety or effectiveness of the product candidates for the therapeutic use for which such product candidates are being studied.
Certain information contained in this Presentation relates to or is based on studies, publications, surveys and other data obtained from third-party sources and the Company’s own internal estimates and research. While the Company believes these third-party sources to be reliable as of the date of this Presentation, it has not independently verified, and makes no representation as to the adequacy, fairness, accuracy or completeness of, any information obtained from third-party sources. In addition, all of the market data included in this Presentation involves a number of assumptions and limitations, and there can be no guarantee as to the accuracy or reliability of such assumptions. Finally, while the Company believes its own internal research is reliable, such research has not been verified by any independent source.
The Company is the owner of various trademarks, trade names and service marks. Certain other trademarks, trade names and service marks appearing in this Presentation are the property of third parties. Solely for convenience, the trademarks and trade names in this Presentation are referred to without the ® and TM symbols, but such references should not be construed as any indicator that their respective owners will not assert, to the fullest extent under applicable law, their rights thereto.

Genetic basisof disease
Richard Scheller, Ph.D.
Chairman of R&D
4

DNA structure
23 chromosomes
3.4 billion base pairs
55
6
The human genome differs from our closest animal relatives by approximately 50M changes
6

7

We differ from each other by 4-5 million variants -African genomes are the most diverse
Source: A. Auton et al. Nature 526, 68-74 (2015) doi: 10. 1038/nature15393 8

Investing in computational genetics and academic partnerships for:
Monogenic target identification & validation
Indication expansion into common diseases
9

Single gene variants can cause or contribute to disease
0
20,000
40,000
60,000
80,000
100,000
120,000
0
500
1,000
1,500
2,000
2,500
3,000
3,500
4,000
1994 1996 1998 2000 2002 2004 2006 2008 2010 2012 2014 2016 2018 2020
Draft human genome
Co
mm
on
dise
ase
GW
AS asso
ciation
s
Source: Claussnitzer et al., Nature 2020
Hundreds of monogenic disease-causing variants are discovered every year…
…and common disease associations are increasing exponentially
Ge
ne
s th
at c
ause
m
on
oge
nic
dis
eas
es
High-throughput sequencing
UKBiobankrecruitment begins
GWAS results catalogue initiated
ClinVarlaunches
>1 million GWAS samples
10

Convergence of genetic innovation driving drug development
Large-scale genotype-phenotype databases
Improving characterization tools
Expanding therapeutic modalities
Small Molecules
Gene Therapy
Oligonucleotides
Single-Cell Sequencing
Cryo-EM
Unique opportunity for BridgeBio to efficiently
translate genomic information into meaningful therapies
DeepMind
Proteins
Antibodies
11

12
BridgeBio’s endless summer
Neil Kumar, Ph.D.
Founder and CEO
12

Big pharma R&D destroys value in aggregate Biotech companies have expectations that can’t be met
The biotech market requires constant and significant
innovation to create long term stable ROIC
▪ Currently, biotech EV is ~$1.4 trillion▪ Assume – One wants to grow market cap by
12% YoY▪ Roughly, capital leaving the system by
dividends + M&A = capital raised by IPOs + follow-ons
▪ If 70% of the value comes from new drugs, biotech would need to generate drugs worth ~$2 trillion over the next 10 years, or approvals with aggregate ~$40 billion peak year sales every year
Big pharma R&D IRR
▪ R&D IRR is less than cost of capital for big pharma
Source: Deloitte, FactSet, Internal BridgeBio analysis
Currently, few examples of sustainable innovation engines for genetic medicines
13

Criteria #1: Need to solve for diseconomies of scale early, and economies of scale late
Eco
no
mie
s o
f Le
arn
ing
Decentralized R&D enables focus at the level of each asset
driving value (Biotech)
Scale and economies of learning drive value in a commercial organization
(consolidation)
What does a sustainable genetic medicine innovation ecosystem look like? Criteria #1
14

Each program is NPV positive
Beautiful science
Realistic market size estimatesOnly 2.3% of brands today >$2 Bn
Capital efficient IND cost < $15 Mn for small molecule
High POTS programsMore like engineering, less biology
Product market fitTherapies which match patient need
Criteria #2: Each program needs to be NPV positive and supported by beautiful science
What does a sustainable genetic medicine innovation ecosystem look like? Criteria #2
Source: Evaluate Pharma15

Criteria #1
Criteria #2
▪ The willingness and scale to fail and to re-allocate capital, within a decentralized company model
▪ Focus at the level of individual diseases and assets. Drug R&D is a game of details
▪ Experienced, product-focused R&D leadership that can define go / no-go’s, required product attributes, and can drive programs through the clinic efficiently
▪ Distinctive early-stage asset selection, based on a deep understanding of clinical unmet need, genetics, and underlying molecular pathophysiology
▪ Efficient corporate structure that cuts no corners on science and medicine, but limits G&A, infrastructure and needless management
Key attributes of BridgeBio
PeopleKey
cri
teri
a o
f a
sust
ain
able
gen
etic
m
edic
ine
inn
ova
tio
n e
ngi
ne
BridgeBio satisfies the criteria of a sustainable genetic medicine innovation engine
16

Traditional genetic medicines players fall into 1 of 2 archetypes
Smaller products, large
pipeline
Blockbuster product, limited
pipeline
1 2
Acoramidis for ATTR as a blockbuster market opportunity
Large pipeline, high probability of success
Fully integrated rare disease commercial org
Putting it all together: The opportunity to build the next great genetic medicine company
17

In less than 6 years since inception, BridgeBio has delivered…
2APPROVEDPRODUCTS
30+ACTIVE R&D PROGRAMS ACROSS 4 MODALITIES
20ONGOING CLINICAL TRIALS
ACROSS >450 SITES
460FULL-TIME
EMPLOYEES
15INDs
(AVERAGE ~3 PER YEAR)
ATTR
New Program
IND Cleared
Ph 3 Start
Ph 3 Readout
New Program
IND Cleared
Ph 2 Start
Ph 2b Initial Data
Select Programs:
Ph 3Start
2016 2017 2018 2019 2020 2021 ’21/’22
ADH1
Concept to Ph3 in ~3 years
Concept to Ph3 in ~3 years
…building the framework for efficient, repeatable results
Fingerprints of hope – #1 BridgeBio’s distinctive productivity
18
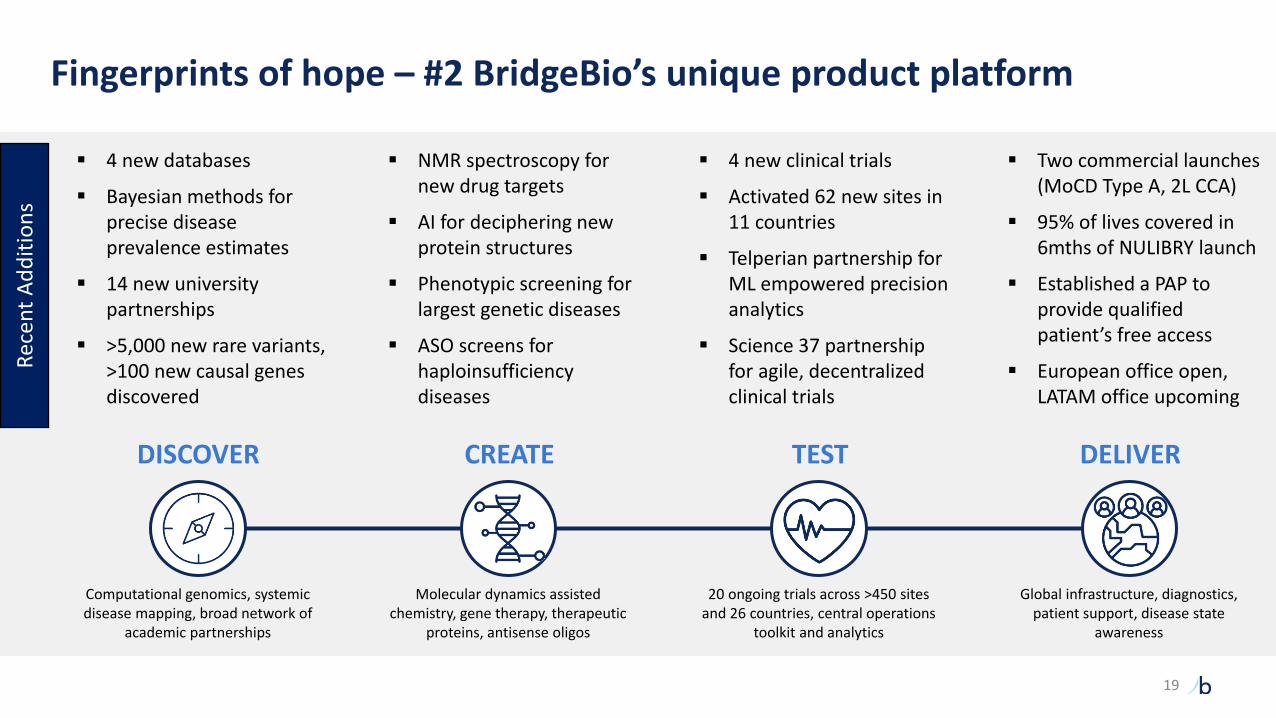
DELIVERTESTCREATEDISCOVER
Computational genomics, systemic disease mapping, broad network of
academic partnerships
Molecular dynamics assisted chemistry, gene therapy, therapeutic
proteins, antisense oligos
20 ongoing trials across >450 sites and 26 countries, central operations
toolkit and analytics
Global infrastructure, diagnostics, patient support, disease state
awareness
Rec
ent
Ad
dit
ion
s
▪ 4 new databases
▪ Bayesian methods for precise disease prevalence estimates
▪ 14 new university partnerships
▪ >5,000 new rare variants, >100 new causal genes discovered
▪ NMR spectroscopy for new drug targets
▪ AI for deciphering new protein structures
▪ Phenotypic screening for largest genetic diseases
▪ ASO screens for haploinsufficiency diseases
▪ 4 new clinical trials
▪ Activated 62 new sites in 11 countries
▪ Telperian partnership for ML empowered precision analytics
▪ Science 37 partnership for agile, decentralized clinical trials
▪ Two commercial launches (MoCD Type A, 2L CCA)
▪ 95% of lives covered in 6mths of NULIBRY launch
▪ Established a PAP to provide qualified patient’s free access
▪ European office open, LATAM office upcoming
Fingerprints of hope – #2 BridgeBio’s unique product platform
19

20
Charles Homcy, MDFounder and Chairman of
Pharmaceuticals
Frank McCormick, PhDFounder and Chairman of
Oncology
Richard Scheller, PhDChairman of R&D
Len Post, PhDAdvisor
Phil Reilly, MD, JDAdvisor
Scientific insight and judgment from industry leaders with a proven track record
Experienced team of R&D operators responsible for 100+ INDs and 20+ approved products
Uma Sinha, PhDChief Scientific Officer
Robert Zamboni, PhDChemistry
Jonathan Fox, MD, PhDChief Medical Officer,
Cardiorenal
Eli Wallace, PhDChief Scientific Officer, Oncology
Pedro Beltran, PhDSVP, Oncology
Mendelian / Cardiorenal Oncology
Fingerprints of hope – #3 BridgeBio’s great drug developers

Indication Drug MechanismPt. pop.(US+EU)
Discovery Pre-IND Phase 1 Phase 2 Phase 3 Approved Partner
Men
de
lian
MoCD type A NULIBRYTM (Synthetic cPMP, fosdenopterin) 100Achondroplasia Low-dose FGFRi (infigratinib) 55kLGMD2i Glycosylation substrate (ribitol) 7kRDEB Recombinant COL7 (BBP-589) 2kPKAN / organic acidemia Pank activator (BBP-671) 7kVM / LM Topical PI3K inhibitor (BBP-681) 117kNetherton Topical KLK inhibitor (BBP-561) 11kPTEN autism PI3Kb inhibitor (BBP-472) 120k4 undisclosed small molecule programs >500k4 undisclosed antisense oligonucleotide programs >300k
Pre
cisi
on
C
ard
iore
nal ATTR amyloidosis TTR stabilizer (acoramidis) >400k
ADH1 CaSR antagonist (encaleret) 12k1
PH1 / frequent stone formers GO1 inhibitor (BBP-711) 5k / 1.5mUndisclosed DCM small molecule program
>250kUndisclosed DCM AAV gene therapy program
Pre
cisi
on
On
colo
gy
FGFR2+ cholangiocarcinoma (2L) TRUSELTIQTM (FGFRi, infigratinib)4k
FGFR2+ cholangiocarcinoma (1L) FGFRi (infigratinib)FGFR3+ adjuvant urothelial FGFRi (infigratinib) 21kFGFR1-3+ tumor agnostic FGFRi (infigratinib) 24kFGFR1-3+ gastric cancer FGFRi (infigratinib) 41k2
MAPK / RAS-driven cancer SHP2i monotherapy (BBP-398)
>500kSHP2i combo therapy (BBP-398)
KRAS-driven cancerKRAS G12C dual inhibitor
>500kPI3Ka:RAS BreakerKRAS G12Di
Solid tumors GPX4i >500k
Gen
e Th
erap
y CAH AAV5 gene therapy (BBP-631) >75kCanavan AAV9 gene therapy (BBP-812) 1kTMC1 hearing loss AAV gene therapy (BBP-815) 2kGalactosemia AAV gene therapy (BBP-818) >7kTSC1/2 AAV gene therapy >100kCystinuria AAV gene therapy 20k3 capsid discovery collaborations
1US carriers2China + Japan patient population
Fingerprints of hope – #4 BridgeBio’s pipeline, including potential best-in-class candidates
21

BridgeBio’s endless summer
MoCD Type A
2L CCA
ATTR-CM/PN
ADH1
Achon
CAH
PKAN/OA
PH1/FSF, VM
SHP2, UC, RDEB
LGMD2i, Canavan
KRAS
ALS, Autism
CF, A1AT, GALT
TMC1, TSC1/222

Presentations to come
■ Precision Cardiorenal: ■ Introduction – Cameron Turtle■ Acoramidis, a TTR stabilizer, for ATTR – Jonathan Fox ■ Encaleret, a CaSRi, for ADH1 – Mary Scott Roberts
■ Gene therapy platform – Eric David
■ Wave 3 Mendelian programs – Uma Sinha
■ Precision Oncology – Eli Wallace
■ BridgeBioX – Charles Homcy
23

Precision cardiorenal
Cameron Turtle, D. Phil.
Chief Strategy Officer
24

Genetic drivers of cardiac disease are unlocking precision medicine targets
HFpEFHFrEF
HFrEF = heart failure reduced ejection failure; HFpEF = heart failure preserved ejection failure Note: Proportions not to scale, genetic associations not exhaustive
Diagnosis by phenotype Diagnosis by mechanism – genetic associations
Hyperlipidemia – PCSK9, LDLR
Contractile – MYH7, MYBPC3, TNNT2
Structural/signaling – TTN, LAMP2, BAG3
Amyloid – TTR
Other
25

Precision medicines have delivered increased treatment effect sizes
30%
RAAS Inhibitor in hypertensive patients1
TTR Stabilizer in ATTR-CM patients2
5%
% reduction in mortality
1van Vark et al., EHJ 2012. 2Maurer et al., NEJM 2018. 3Damask et al., Circ 2020
Mendelian disease High genetic risk in broader diseases
% reduction in mortality
Alirocumab in high genetic risk ACS patients3
Alirocumab in low genetic risk ACS patients3
13%
37%
26

Indication Drug MechanismPt. pop.(US+EU)
Discovery Pre-IND Phase 1 Phase 2 Phase 3
Pre
cisi
on
Car
dio
ren
al
ATTR amyloidosis TTR stabilizer (acoramidis) >400k
ADH1 CaSR antagonist (encaleret) 12k1
PH1 / frequent stone formers GO1 inhibitor (BBP-711) 5k / 1.5m
Undisclosed DCM small molecule program>250k
Undisclosed DCM AAV gene therapy program
1US carriers
Cardiorenal pipeline overview
Featured Programs
27

28
Acoramidis: TTR stabilizer for ATTR
Jonathan Fox, M.D., Ph.D.
Chief Medical Officer, Cardiorenal
Precision cardiorenal
Acoramidis is an investigational drug. Its safety and efficacy have not been full evaluated by any regulatory authority. 28

Acoramidis for transthyretin (TTR) amyloidosis (ATTR)
Destabilized TTR leading to amyloid accumulation
Genetic Driver
TTR stabilizer designed to mimic protective T119M mutation
Therapeutic Hypothesis
Pathophysiology
Systemic disease most commonly presenting as cardiomyopathy or peripheral neuropathy
Prevalence
400k+Worldwide
Design Criteria for Optimal Therapy
Preservation of TTR tetramer
Near-complete stabilization of TTR
Oral Dosing
LenLiving with ATTR-CM 29

ATTR is a systemic disease with multiple manifestations
30
Clinical Presentation
Diagnostic Approach
Therapeutic Approach
Published Data
Pivotal Trial Design
6MWD Importance
Upcoming Milestones
Source: Grogan, M et al. JACC 2016, 68:1014-20; Planté-Bordeneuve, V. and Said, G. Lancet Neurol 2011, 10:1086-97
Central nervous system
Ocular
Gastrointestinal
Nephropathy
Carpal tunnel
Cardiomyopathy (ATTRwt-CM or ATTRv-CM)
• Deposition of wild-type or variant (e.g., V122I) TTR amyloid in the heart, leading to predominantly diastolic heart failure
• Likely affects 400K+ worldwide, majority undiagnosed
• Late onset (age 50+), progressive and fatal with median survival of 3-5 years from diagnosis
Polyneuropathy (ATTR-PN)
• Affects ~10K worldwide, primarily in EU and Japan
• Exclusively caused by variant TTR (e.g., V30M)
• Onset between ages of 30 and 50, progressive and fatal with median survival of 5-10 years from diagnosis
30

Rapid increase in patient finding driven by non-invasive diagnosis techniques
Source: Lane et al., 2019; Johns Hopkins Medicine; American College of Cardiology
New ATTR-CM diagnoses per year at single site
Non-invasive technetium scans
Invasive heart biopsiesClinical Presentation
Diagnostic Approach
Therapeutic Approach
Published Data
Pivotal Trial Design
6MWD Importance
Upcoming Milestones
31

TTR plays a physiological role in the body
32
“Leaky pipe”
Clinical Presentation
Diagnostic Approach
Therapeutic Approach
Published Data
Pivotal Trial Design
6MWD Importance
Upcoming Milestones
Healthy TTR metabolism
32

Targeting diseases at their source optimizes safety and efficacy
Clinical Presentation
Diagnostic Approach
Therapeutic Approach
Published Data
Pivotal Trial Design
6MWD Importance
Upcoming Milestones
Shut down the entire water line(Target upstream)
Fix the leak(Target the source)
33
1 2
Two ways to stop a leaky pipe
33

Acoramidis was designed to treat ATTR at its source
Native TTR circulates in blood as a tetramer
Dissociation into monomers initiates
pathogenesis
Monomers aggregate, causing disease
Acoramidis was designed to mimic protective T119M variant by stabilizing TTR tetramers to slow or halt disease progression
Disease mechanism
Therapeutic hypothesis
~130 known destabilizing variants
ProtectiveT119M variant
Clinical Presentation
Diagnostic Approach
Therapeutic Approach
Published Data
Pivotal Trial Design
6MWD Importance
Upcoming Milestones
34
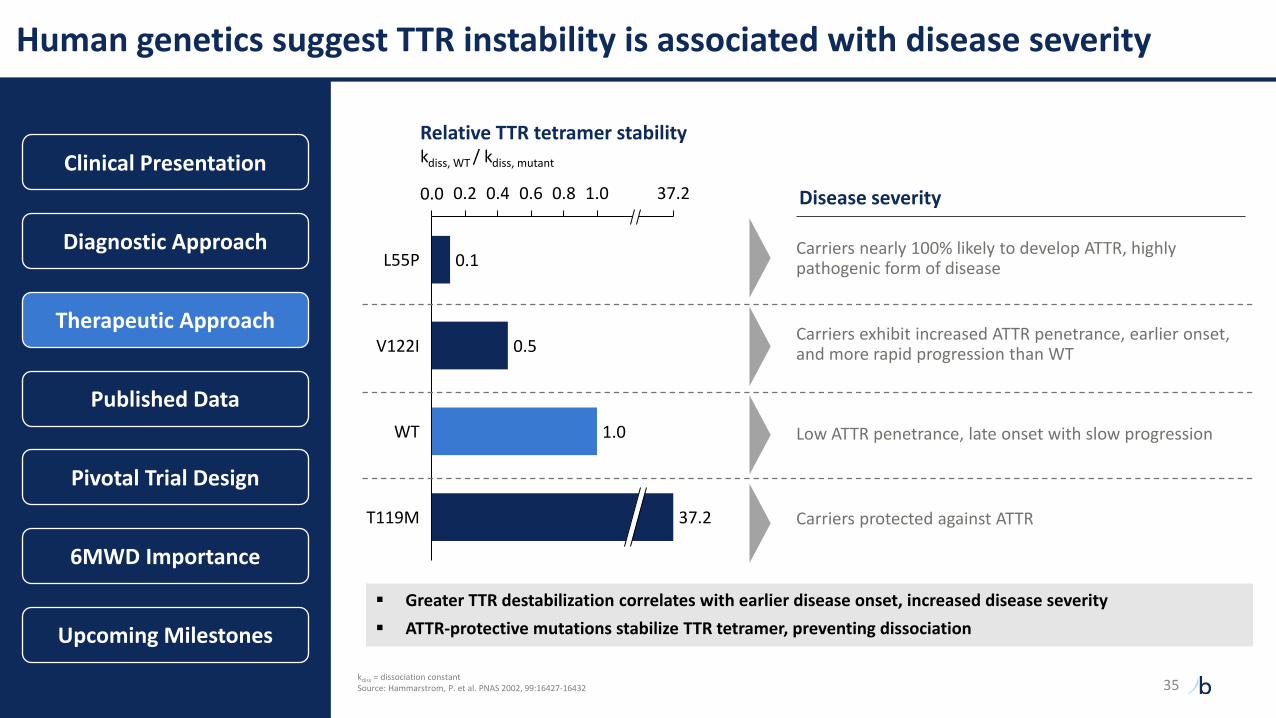
Human genetics suggest TTR instability is associated with disease severity
0.1
0.5
1.0
1.00.0 0.2 0.4 0.6 0.8 37.2
V122I
T119M
Relative TTR tetramer stabilitykdiss, WT / kdiss, mutant
L55P
WT
37.2
Disease severity
Carriers protected against ATTR
Low ATTR penetrance, late onset with slow progression
Carriers exhibit increased ATTR penetrance, earlier onset, and more rapid progression than WT
Carriers nearly 100% likely to develop ATTR, highly pathogenic form of disease
▪ Greater TTR destabilization correlates with earlier disease onset, increased disease severity
▪ ATTR-protective mutations stabilize TTR tetramer, preventing dissociation
kdiss = dissociation constantSource: Hammarstrom, P. et al. PNAS 2002, 99:16427-16432
Clinical Presentation
Diagnostic Approach
Therapeutic Approach
Published Data
Pivotal Trial Design
6MWD Importance
Upcoming Milestones
35

Higher dose of tafamidis increased stabilization and improved clinical benefit
1FDA CDER Clinical Pharmacology and Biopharmaceutics, Clinical Review (Vyndaqel/Vyndamax), 20192Damy T, et al. Eur J Heart Fail. 2020. “Efficacy and safety of tafamidis doses in the Tafamidis in Transthyretin Cardiomyopathy Clinical Trial (ATTR-ACT) and long-term extension study"
Phase 3 ATTR-ACT study tested two doses of tafamidis (20 mg & 80 mg) vs. placebo
TTR stabilization1 All-cause mortality2
▪ Participants receiving 80 mg of tafamidis (vs. 20 mg) exhibited greater TTR stabilization1
▪ Benefit of tafamidis 80 mg vs. 20 mg was evident on all-cause mortality in analysis of ATTR-ACT combined with long-term extension (LTE)2
Clinical Presentation
Diagnostic Approach
Therapeutic Approach
Published Data
Pivotal Trial Design
6MWD Importance
Upcoming Milestones
36

Acoramidis demonstrates near-complete stabilization of TTR
TTR target site occupancy by FPE assay1
%, mean +/- SD
Source: Ji, A.X., et al. Differential Transthyretin Binding, Kinetic Stability and Additive Ex Vivo Stabilization by AG10 Compared to Tafamidis. American Heart Association Scientific Sessions 20191FPE characterization of TTR binding site occupancy in serum incubated with stabilizer, n = 12*Tafamidis 80 mg mean Cmin and Cmax per FDA review of tafamidis meglumine ATTR-CM NDA
Acoramidis demonstrated near-complete TTR stabilization in vitro at clinical concentrations
Clinical Presentation
Diagnostic Approach
Therapeutic Approach
Published Data
Pivotal Trial Design
6MWD Importance
Upcoming Milestones
0
20
40
60
80
100
Tafamidis 16 µM Tafamidis 26 µM Acoramidis 10 µM* *
37

Phase 2 ATTR-CM trial provided randomized 28-day and 15-month OLE data
Schematic of acoramidis Phase 2 studies4 Outcomes
Randomized portion
28 days
Open label extension
Ongoing
17 Placebo
49 Patients underwent randomization
16AcoramidisHCl 400 mg 16
AcoramidisHCl 800 mg
2 Declined1
47 (96%) Continue onto open label extension (OLE)2
41 On study (as of 8/31/2019)
6 discontinued• 3 died• 1 received heart
transplant• 2 other
Publications to date:
• Randomized 28-day study3
• Open label extension analysis as of 8/31/2019, median 65 weeks from acoramidis 201 initiation (randomized), median 53 weeks on acoramidis4
PrimarySecondary and
Exploratory
Safety and tolerability
▪ Adverse events
▪ Clinical events and vital signs
▪ Clinical laboratory parameters
Pharmacokinetics
Pharmacodynamics
Echocardiographic parameters
1Both declined participation due to geographical constraints regarding study visits2Median rollover period of 72 days (range 41-152 days)3Judge, D.P. et al. JACC Vol. 74, No. 3, 2019:285 – 954Judge, D.P. et al. American Heart Association 2019
Clinical Presentation
Diagnostic Approach
Therapeutic Approach
Published Data
Pivotal Trial Design
6MWD Importance
Upcoming Milestones
38

Acoramidis has been well-tolerated and demonstrated near-complete TTR stabilization in preclinical, Ph 1, and Ph 2 studies
Randomized portionPlaceboN = 17
Acoramidis(pooled doses)
N = 32
Any Adverse Event 15 (88%) 21 (66%)
Mild 6 (35%) 11 (34%)
Moderate 8 (47%) 9 (28%)
Severe 1 (6%) 1 (3%)
Any SAE 2 (12%) 1 (3%)
AF and CHF 1 (6%)1 0
Leg cellulitis 1 (6%) 0
Dyspnea 0 1 (3%)
TTR stabilization at steady-state trough level%, mean ± SEM
Visit Day
Phase 2 safety summary1 Phase 2 OLE TTR stabilization2
0
20
40
60
80
100
120
140
14 45 90 180
1Judge, D.P. et al. JACC Vol. 74, No. 3, 2019:285 – 952Judge, D.P. et al. American Heart Association 2019
Clinical Presentation
Diagnostic Approach
Therapeutic Approach
Published Data
Pivotal Trial Design
6MWD Importance
Upcoming Milestones
In long-term OLE, acoramidis was generally well tolerated with a pattern of adverse events consistent with underlying disease
severity, concurrent illnesses, and age of participants
39

-0.6
-0.3
0
0.3
0.6
0.9
1.2
1.5
Serum TTR concentrationΔ from baseline to day 28 (%)
ATTRwt-CM ATTRv-CM
Note: Serum TTR concentrations not available at baseline for one 400 mg subject and at Day 28 for one 400 mg and one placebo subjectSource: Judge, D.P. et al. J Am Coll Cardiol. 2019;74(3):285-295.1Normal reference range for serum TTR 20-40 mg/dL (3.6-7.3 µM)
▪ Dose-dependent increase in serum TTR concentrations in acoramidis-treated subjects
▪ Greater effect observed in ATTRv subjects – final TTR concentrations normalized to comparable levels as in treated ATTRwt subjects
-60%
-30%
0%
30%
60%
90%
120%
150%
Below normal TTR at Day 281
400 mg acoramidis HClMean = 36%
Median = 28%
800 mg acoramidis HClMean = 50%
Median = 43%
PlaceboMean = -7%
Median = -3%
p < 0.0001 p < 0.0001
Clinical Presentation
Diagnostic Approach
Therapeutic Approach
Published Data
Pivotal Trial Design
6MWD Importance
Upcoming Milestones
Acoramidis increased serum TTR concentrations in a dose-dependent manner
40

NT-proBNP and TnI remained stable in acoramidis-treated participants throughout OLE
NT-proBNP1
Acoramidis 202 (OLE) Visit Day
1 14 45 90 180 270
pg/mL; 95% confidence interval, quartiles, median
TnI1
ng/mL; 95% confidence interval, quartiles, median
Acoramidis 202 (OLE) Visit Day
1 14 45 90 180 270
Clinical Presentation
Diagnostic Approach
Therapeutic Approach
Published Data
Pivotal Trial Design
6MWD Importance
Upcoming Milestones
1 Judge, D.P. et al. American Heart Association 2019. NT-proBNP = N-Terminal pro B-type Natriuretic Peptide. TnI = troponin I41

Echocardiography parameters remained stable in acoramidis-treated participants throughout OLE
Left ventricular mass1
g; 95% confidence interval, quartiles, median
Left ventricular stroke volume index1
mL/m2; 95% confidence interval, quartiles, median
1 90 180 270 1 90 180 270
Acoramidis 202 (OLE) Visit Day Acoramidis 202 (OLE) Visit Day
Clinical Presentation
Diagnostic Approach
Therapeutic Approach
Published Data
Pivotal Trial Design
6MWD Importance
Upcoming Milestones
1 Judge, D.P. et al. American Heart Association 201942

Embedded Ph3 design includes 12-month and 30-month primary endpoints
Secondary endpoints include: Kansas City Cardiomyopathy Questionnaire, serum TTR, TTR stabilization6MWD = Six minute walk distance; NYHA = New York Heart Association;99mTc = Technetium labeled pyrophosphate (PYP) or bisphosphonate (e.g., DPD); dx = diagnosis;CV hosp = cardiovascular-related hospitalizations
800 mg acoramidis HCltwice daily
Screening and randomization Open label extension
12-month primary endpoint:Change in 6MWD
Part A Part BTafamidis usage allowed
▪ Subjects with diagnosed ATTR-CM (WT or variant)
▪ NYHA Class I-III
▪ ATTR-positive biopsy or 99mTc scan
▪ Light chain amyloidosis excluded if diagnosis by 99mTc
Keyinclusioncriteria
800 mg acoramidis HCl twice daily
N ~ 422
Placebo twice daily
N ~ 211
Clinical Presentation
Diagnostic Approach
Therapeutic Approach
Published Data
Pivotal Trial Design
6MWD Importance
Upcoming Milestones
30-month primary endpoint:Hierarchical composite
43

6-Minute Walk Test is a clinically meaningful, treatment-responsive endpoint
Clinical Presentation
Diagnostic Approach
Therapeutic Approach
Published Data
Pivotal Trial Design
6MWD Importance
Upcoming Milestones
Higher rates of mortality observed with lower 6MWD in multiple cardiopulmonary diseases1,2
Simple, sub-maximal exercise test to assess aerobic capacity and endurance
Demonstrated to measure treatment benefit in heart failure, COPD, and pulmonary arterial hypertension
“The 6-minute walk test (6MWT), a measure of functional capacity, was identified as a predictor of overall survival in patients with ATTR-CM.”
- Maurer et al., 2020
1 Ingle, L. et al., Biomed Res Int 20142 Lane, T. et al., Circulation 2019 44

Rapid functional decline in untreated ATTR-CM patients provides opportunity to demonstrate robust clinical benefit
250
275
300
325
350
375
0 6 12
Follow-up durationMonths
6MWDMeters Tafamidis (ATTR-ACT)2
Placebo (ATTR-ACT)2
Healthy elderly adults1
Summary of 6MWD data in ATTR and healthy cohorts
12-month decline:
• Healthy elderly adult: -7m
• ATTR-ACT (tafamidis): -25m
Hypothesis: near-complete stabilization
of TTR by acoramidis may slow or halt
functional decline in 6MWD
1Enright, P.L. et al. Chest 2003. N = 3333 healthy elderly adults, baseline set to match ATTR-ACT placebo group 2Maurer, M.S. et al. NEJM 2018. N = 264 (tafamidis), N = 177 (placebo) ATTR-CM trial participants
ATTRibute-CM 6MWD baseline comparable
to ATTR-ACT
Clinical Presentation
Diagnostic Approach
Therapeutic Approach
Published Data
Pivotal Trial Design
6MWD Importance
Upcoming Milestones
45

Acoramidis Part A topline data
NDA and MAA filings
Acoramidis Part B topline data
Timeline of upcoming milestones
YE 2021
Mid-2022
2023
Clinical Presentation
Diagnostic Approach
Therapeutic Approach
Published Data
Pivotal Trial Design
6MWD Importance
Upcoming Milestones
Note: NDA/MAA filings to occur upon receipt of positive Part A
46

47
Encaleret: CaSR inhibitor for ADH1
Mary Scott Roberts, M.D.
Sr. Director, Clinical Development,
Cardiorenal
Precision cardiorenal
Encaleret is an investigational drug. Its safety and efficacy have not been full evaluated by any regulatory authority. 47

Alexis and JacksonLiving with ADH1
Encaleret for autosomal dominant hypocalcemia type 1 (ADH1)
Hyperactivation of calcium-sensing receptor (CaSR)
Genetic Driver
Selectively antagonize CaSR to normalize downstream effects
Therapeutic Hypothesis
Pathophysiology
Decreased blood calcium, elevated urine calcium, and lower
parathyroid hormone secretion
Prevalence
12k+US
Design Criteria for Optimal Therapy
Phase 2 data suggests potential to normalize blood Ca and urine Ca
Directly target CaSR to potentially resolve key
symptoms
Oral Dosing
48

Ca2+PTH
Disease Overview
DecreasedPTH
secretion
Therapeutic ApproachNormal CaSR senses and regulates serum Ca
levels to maintain calcium homeostasis
ADH1 CaSR is hyperactiveCa2+
Hyperactive CaSR causes dysregulation of calcium homeostasis
Decreasedserum
calcium
Increasedurine
calcium
Presenting symptoms
• Hypocalcemic seizures
• Paresthesia
• Tetany
• Muscle cramps
Long-term complications
• Nephrocalcinosis
• Nephrolithiasis
• Chronic kidney disease
Phase 2 Design
Disease Mechanism Clinical Manifestation
27%
31%
42%
0%
25%
50%
75%
100%
% o
f A
DH
1 C
ase
s SevereMild/ModerateAsymptomatic
Symptom presentation1
ADH1-causing variants hyperactivate the CaSR and disrupt calcium homeostasis leading to potentially life-threatening symptoms
Phase 2 Clinical Data
Summary & Next Steps
1Roszko, et al., ASBMR Annual Meeting, 2021. Abbreviations: dx = diagnosis. Age of dx presented as median (range)
Median age of ADH1 dx1: 25 (0-77) years
Ca2+
49

4
5
6
7
8
9
10
ADH1 symptom severity is associated with blood calcium levels and current treatment inadequately addresses symptom burden
ADH1 medical intervention
ULN = upper limit of normal, LLN = lower limit of normal. ** p-value <0.01. **** p-value < 0.0001. n.s. = not statistically significant
1Roszko, et al., ASBMR Annual Meeting, 2021
22%29%
2%
22%
0%
20%
40%
60%
80%
100%
Normalized blood
calcium
Normalized urine
calcium
Normalized blood
and urine calcium
Improved symptoms
Only 2% of individuals normalized both blood and urine calcium, and only 22% reported symptom
improvement on-treatment1
Individuals on calcium and/or active vitamin D %
Blood calcium at clinical presentation
ULN
LLN
Blood corrected calciummg/dL, mean
Severely symptomatic individuals exhibited significantly lower blood calcium compared to asymptomatic and moderately symptomatic1
******
n.s.
Nosymptoms
Moderate Severe
Disease Overview
Therapeutic Approach
Phase 2 Design
Phase 2 Clinical Data
Summary & Next Steps
50

Successful CaSR antagonism would increase PTH secretion and renal calcium reabsorption
Figures adapted from: 1Berne and Levy Physiology, 6th ed. Chapter 39; 2Toka, H.R., et al. Physiology. 2015
Parathyroid and renal CaSR antagonist action
Parathyroid cell Renal tubule
CaSR
CaSR
Ca2+
Urine Blood
Disease Overview
Therapeutic Approach
Phase 2 Design
Phase 2 Clinical Data
Summary & Next Steps
Ca2+
Nucleus
Gaq + Gai
PTH Gene
PTH mRNA
PTH
PTH
Ca2+
Encaleret is designed to antagonize the CaSR to increase PTH release, increase blood calcium, and reduce urine calcium
51

Encaleret is designed to address the underlying disease mechanism and simultaneously normalize blood calcium and urine calcium
ULN = upper limit of normal, LLN = lower limit of normal
Source: Pearce et al., NEJM 1996. PTH values reported as below detection limit or undetectable were recorded as “0”
Summary of key disease measures in ADH1 patients with and without supplementation
Blood corrected calciummg/dL, mean
Urine calciumCalcium: Creatinine ratio, mean
Blood parathyroid hormonepg/mL, mean
4
5
6
7
8
9
10
N = 1919
Normal range
Without supplementation With supplementation
0.0
0.2
0.4
0.6
0.8
1.0
Normal range
10100
5
10
15
20
25
30
35
40
45
50
55
60
65Normal range
88
ULN
LLN
ULN
ULN
LLN
Encaleret Target
Encaleret Target
Encaleret Target
Disease Overview
Therapeutic Approach
Phase 2 Design
Phase 2 Clinical Data
Summary & Next Steps
52

Encaleret Phase 2 study design
Program Overview
Key study objectives:
• Safety and tolerability
• Blood calcium concentration
• Urine calcium concentration
• Intact parathyroid hormone concentration
Additional measures:
• Blood 1,25-(OH)2 Vitamin D, magnesium, and phosphate
• Urine creatinine, cAMP, citrate, phosphate, sodium, magnesium
• Bone turnover markers (serum collagen C-telopeptide, serum
procollagen Type 1 N-propeptide)
Complete
Period 1 Period 2
Individualized dose escalation
Individualized dose titration
Period 3
Outpatient extension
March 2021
Proof of concept
early results
October 2021
Phase 2 Period 2
results
5 days, inpatient (N=13)5 days, inpatient (N=6) 6 months, outpatient (N=13) Outpatient
Long-term extension
LTE
Q4 2021
Planned FDA
interaction
Disease Overview
Therapeutic Approach
Phase 2 Design
Phase 2 Clinical Data
Summary & Next Steps
53

Day 1 Day 2 Day 3 Day 4 Day 5
0
90
180
270
360
Me
an
en
ca
lere
t d
os
e (
mg
/da
y)
Period 2 individualized dose titration phase resulted in a lower Day 5 mean encaleret dose as compared to Period 1
Period 1 and Period 2 encaleret dosing summary
Data reported as mean±SD.
Period 1 DosingDefined dose escalationDay 5 Mean: 350.0±22.4 mg/day
Period 2 DosingIndividualized dose titrationDay 5 Mean: 187.7±128.2 mg/day
Day 1 Day 2 Day 3 Day 4 Day 5
0
90
180
270
360
Me
an
en
ca
lere
t d
ose (
mg
/day)
BID dosing BID dosingQD dosing
Disease Overview
Therapeutic Approach
Phase 2 Design
Phase 2 Clinical Data
Summary & Next Steps
54

Study participants exhibited hypocalcemia, elevated urine calcium, suppressed PTH, and elevated phosphate at baseline
Data reported as mean±SD. ECG QTcB = electrocardiogram Bazett-corrected Q-T interval. *Measurements taken pre-dose Day 1 in Period 1 or Period 2
Baseline characteristics
CharacteristicStudy Population
N = 13Normal Range
Age, mean, yr (range) 39 (22-60)
Female, n (%) 8 (62%)
Nephrocalcinosis, n (%) 10 (77%)
ECG QTcB (msec) 452 ± 16 < 440
Corrected Calcium (mg/dL)* 8.0 ± 0.7 8.4 –10.2
Intact PTH (pg/mL)* 2.8 ± 3.4 15 – 65
Phosphate (mg/dL)* 5.1 ± 1.1 2.3 – 4.7
Magnesium (mg/dL)* 1.8 ± 0.1 1.6 – 2.6
24h Urine Calcium (mg/24h) 441 ± 258 < 250-300
Supplements
Elemental Calcium (mg/day) [mean (range)] 2628 (750-4800)
Calcitriol (µg/day) [mean (range)] 0.8 (0.2-2.0)
CASR VariantsC131Y (2), P221L (2), E604K (1), A840V (3), F788C (1),
T151M (1), Q245R (1), I692F (1), E228K (1)
Disease Overview
Therapeutic Approach
Phase 2 Design
Phase 2 Clinical Data
Summary & Next Steps
55

Encaleret continues to be generally well-tolerated with no serious adverse events reported1
1Data as of September 3, 2021. 2Treatment-related adverse events were transient and resolved with dose-adjustment. Treatment-related AEs were counted as the number of events per period and are presented as a percentage of the total number of AEs. The most common AEs (≥ 2 subjects) were hypophosphatemia, hypocalcemia, and headache
Summary of Period 1 and Period 2 safety measures
Period 1
N = 6
Period 2
N=13
Number of subjects experiencing any Serious Adverse Event 0 (0%) 0 (0%)
Number of subjects experiencing any Adverse Event 6 (100%) 10 (77%)
Mild 6 (100%) 10 (77%)
Moderate 1 (17%) 0 (0%)
Severe 0 (0%) 0 (0%)
Number of Adverse Events Reported 19 12
Mild 18 (95%) 12 (100%)
Moderate 1 (5%) 0 (0%)
Severe 0 (0%) 0 (0%)
Treatment-related Adverse Events2 3 (16%) 8 (67%)
Hypocalcemia 1 (33%) 0 (0%)
Hypophosphatemia 2 (67%) 7 (88%)
Hypercalcemia 0 (0%) 1 (12%)
Disease Overview
Therapeutic Approach
Phase 2 Design
Phase 2 Clinical Data
Summary & Next Steps
56

0
30
60
90
120
0
200
400
600
800
1000
6
7
8
9
10
11
All Subjects All Subjects
Encaleret treatment increased blood calcium and parathyroid hormone and decreased urine calcium in ADH1 participants during Period 1
†^ ^All Subjects Mean ±SD
Mean ±SD
Mean ±SD
Blood corrected calciummg/dL
Urine calciummg/day
Blood parathyroid hormonepg/mL
Individual and mean responses on Day 1 and 5 of Period 1 (N=6)
Baseline Value (Day 1) Mean Value (Day 5) on encaleret 180 mg BID§
§ Encaleret dose adjusted to 180/120 in 1 subject on Day 5.^Values below limit of assay quantitation recorded as “0”. † Day 4 values used in two subjects given Day 5 values unavailable. Gray shading reflects normal range. ** p-value < 0.01.
Blood phosphate and magnesium levels also normalized over 5-day dose escalation, on average. Data not plotted above.
** **
**
Disease Overview
Therapeutic Approach
Phase 2 Design
Phase 2 Clinical Data
Summary & Next Steps
57

Encaleret treatment normalized mean blood and urine calcium during Period 2
Mean responses on Day 1 through Day 5 in Period 2 (N=13)
Data reported as mean±SD. Values below limit of assay quantitation recorded as “0”. Gray shading reflects normal range. Solid line for urine calcium reflects the upper limit for men and dashed line reflects upper limit for women
0
200
400
600
800
Uri
ne C
a (
mg
/24 h
)
Day 1N=13
Day 2 Day 3 Day 4 Day 5
6
7
8
9
10
11
Blo
od
cC
a (
mg
/dL
)
Day 1N=13
Day 2 Day 3 Day 4 Day 5
Increasing urine calcium is likely due to both increasing corrected calcium and decreasing encaleret dose
Disease Overview
Therapeutic Approach
Phase 2 Design
Phase 2 Clinical Data
Summary & Next Steps
58

Encaleret increased PTH and decreased mean blood phosphate during Period 2
Mean responses on Day 1 through Day 5 in Period 2 (N=13)
Data reported as mean±SD. Values below limit of assay quantitation recorded as “0”. Gray shading reflects normal range
0
1
2
3
4
5
6
Ph
osp
hate
(m
g/d
L)
Day 1N=13
Day 2 Day 3 Day 4 Day 5
0
35
70
105
140
175
210
iPT
H (
pg
/mL
)
Day 1N=13
Day 2 Day 3 Day 4 Day 5
Disease Overview
Therapeutic Approach
Phase 2 Design
Phase 2 Clinical Data
Summary & Next Steps
59

Summary reported Phase 2 data and next steps
Summary of encaleret development program
■ In 13 participants, encaleret normalized mean blood calcium and 24-hour urine calcium excretion,
increased PTH, and decreased phosphate into the normal range during both Periods 1 and 2
■ Individualized BID dosing in Period 2 resulted in a decrease in the mean Day 5 encaleret dose as
compared to Period 1
■ Encaleret was well-tolerated when administered once or twice daily over 5 days, with no serious
adverse events reported
■ Consistent improvements in mineral homeostasis suggest encaleret may become an effective
treatment for ADH1
■ Granted Fast Track Designation and Orphan Drug Designation by the FDA
Next 12 months
■ Interact with FDA
■ Present complete Phase 2 data
■ Initiate Phase 3 registrational study
Planned activities
■ Pediatric development program in ADH1
■ Evaluation of encaleret in non-genetic
hypoparathyroidism
Disease Overview
Therapeutic Approach
Phase 2 Design
Phase 2 Clinical Data
Summary & Next Steps
60

61
BridgeBio Gene Therapy
Eric David, M.D., J.D.
CEO, BBGT
61

Indication Drug MechanismPt. pop.(US+EU)
Discovery Pre-IND Phase 1 Phase 2 Phase 3
Ge
ne
Th
era
py
CAH AAV5 gene therapy (BBP-631) >75k
Canavan AAV9 gene therapy (BBP-812) 1k
TMC1 hearing loss AAV gene therapy (BBP-815) 2k
Galactosemia AAV gene therapy (BBP-818) >7k
Tuberous sclerosis complex 1 AAV gene therapy>100k
Tuberous sclerosis complex 2 AAV gene therapy
Cystinuria AAV gene therapy 20k
Undisclosed DCM gene therapy program AAV gene therapy
3 capsid discovery collaborations
Gene therapy pipeline overview
62
Featured Programs

Facility | 20,000 sq ft lab space in Raleigh, NC
External Manufacturing | Dedicated GMP manufacturing suite at Catalent
People | 60+ gene therapy employees (>50% in research or CMC)
Capabilities | Vector development, optimization, analytical development, and production (200L)
Research and manufacturing capabilities
63

64
BBGT program updates
Program Status Update Next Catalyst
Congenital Adrenal Hyperplasia (CAH) Trial enrollment underway Initial Phase 1/2 data
Canavan Trial enrollment underway Initial Phase 1 biomarker data
Transmembrane Channel Protein 1 (TMC1)Proof-of-concept established in
multiple disease modelsIND enabling studies
GalactosemiaProof-of-concept established in
disease modelIND enabling studiesNEW
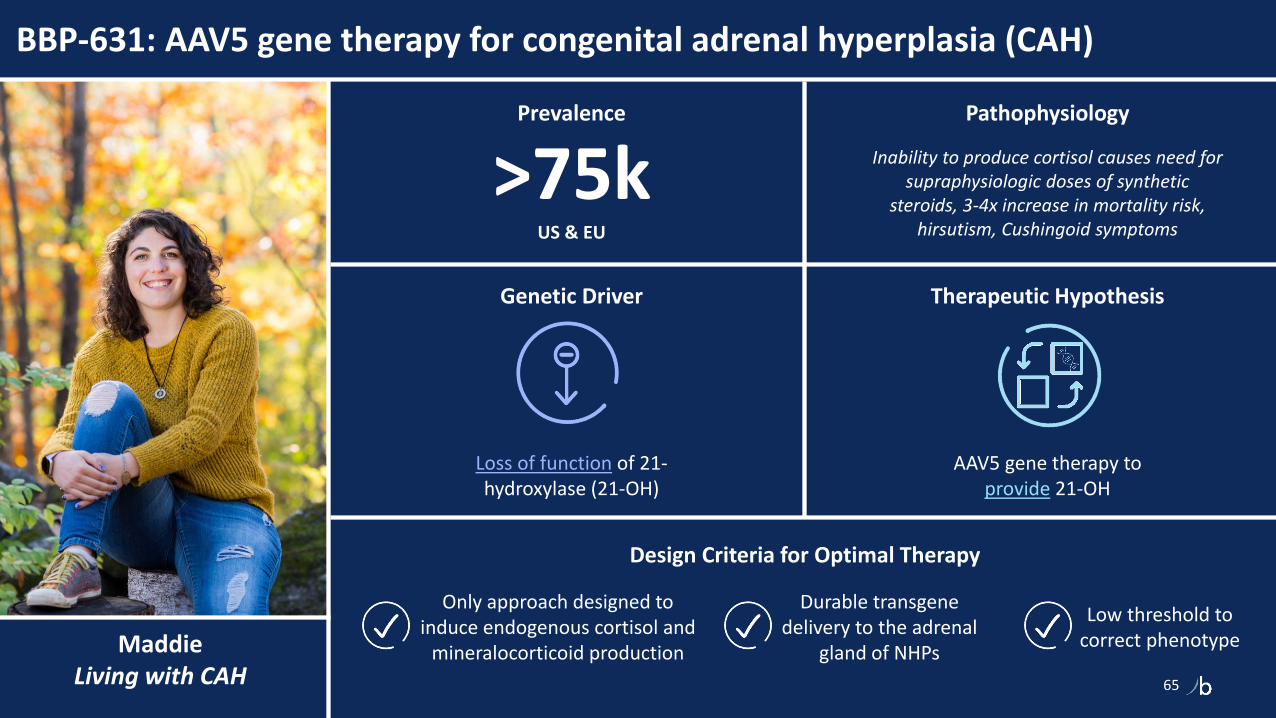
MaddieLiving with CAH
BBP-631: AAV5 gene therapy for congenital adrenal hyperplasia (CAH)
65
Loss of function of 21-hydroxylase (21-OH)
Genetic Driver
AAV5 gene therapy to provide 21-OH
Therapeutic Hypothesis
Pathophysiology
Inability to produce cortisol causes need for supraphysiologic doses of synthetic
steroids, 3-4x increase in mortality risk, hirsutism, Cushingoid symptoms
Prevalence
>75kUS & EU
Design Criteria for Optimal Therapy
Durable transgene delivery to the adrenal
gland of NHPs
Only approach designed to induce endogenous cortisol and
mineralocorticoid production
Low threshold to correct phenotype

5-10% of WT enzyme may be sufficient for clinical impact
66
Stimulated cortisol (µg/dl)
NHP protein data suggests potentially therapeutic levels of
21-hydroxylase enzyme
Human 21-hydroxylase protein as a % of NHP 21-hydroxylase protein (Mass Spec quantification)
5e12 vg/kg
9%
1.5e13 vg/kg
24%
13%
4.5e13 vg/kg
As little as 5% of WT enzyme activity is
associated with the mild/asymptomatic non-classic form of
CAH
Genotype-phenotype studies show that >5-10% of enzyme
activity results in nonclassical CAH
Asymptomatic
Salt-wasting
(0-1%)Non-classic
P30L mutation
(5-10%)
Non-classicV281L
(20%)
Heterozygotes
(~50%)
(% Enzyme activity)
5
10
15
20
Source: Perdomini, Gene Therapy 2017; ESGCT 2019; data on file
■ Mass-spec methods to quantify protein expression
by identifying differential peptides between human
and NHP 21-OH
■ Data suggest dose-dependent enzyme expression
in the adrenal cortex from 9%-24% of WT levels
Preclinical Data
Phase 1/2 Design

Phase 1/2 first-in-human trial design
67
Status Eligibility
■ Age >18 years with classic CAH (simple virilizing or
salt-wasting) due to 21-Hydroxylase Deficiency (21-OHD)
■ Screening/baseline 17-OHP levels > 5-10 × ULN
■ Trial enrollment underway
FIH Trial Design Dose Escalation Design
Expansion possible at any dose
level
Three dose levels of BBP-631 are planned for the study
Dose level 1:N=3 | 1.5 × 10¹³ vg/kg
Dose level 2:N=3 | 3.0 × 10¹³ vg/kg
Dose level 3:N=3 | 6.0 × 10¹³ vg/kg
Cumulative safety data review before dose escalation or
dose expansion
Follow-up
Follow-up
Follow-up
Primary Objectives
■ Evaluate safety
■ Levels of endogenous cortisol (pre- and post-ACTH stimulation)
■ Quality-of-life assessment
Screening
Baseline5 Days
Treatment & Follow-Up Period52-Weeks
Long-term Follow-Up4 Years
Preclinical Data
Phase 1/2 Design
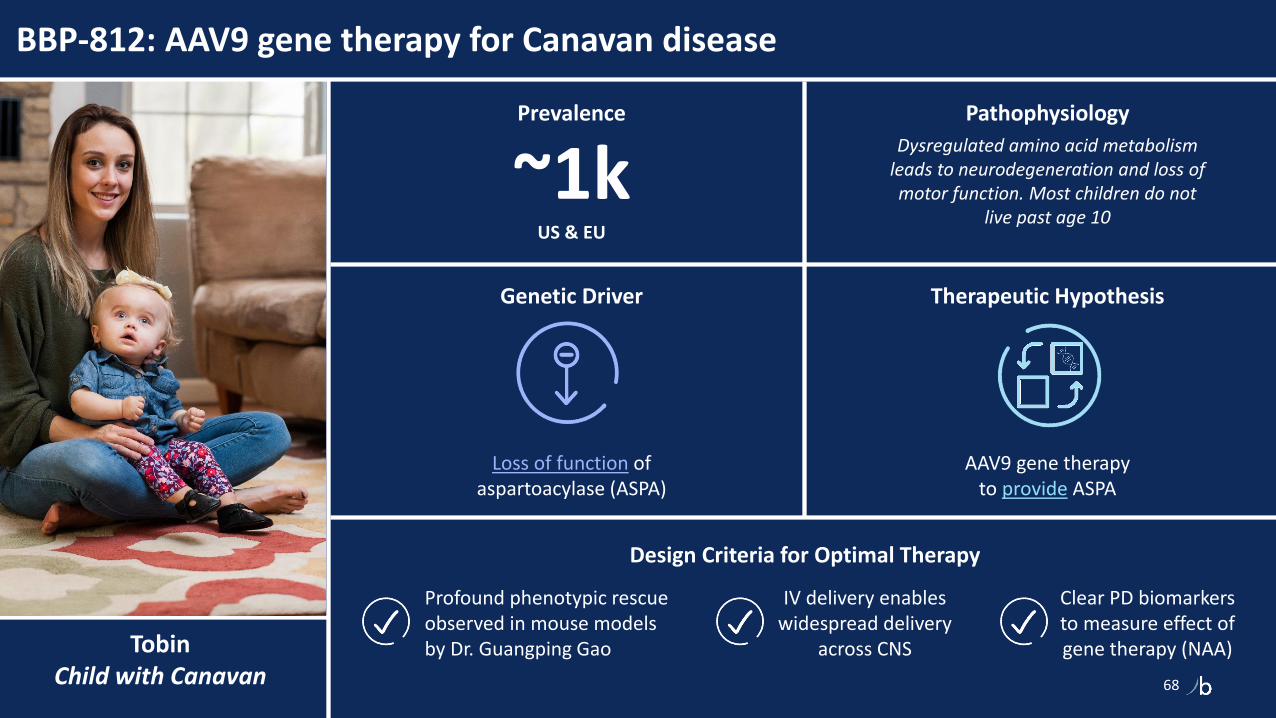
TobinChild with Canavan
BBP-812: AAV9 gene therapy for Canavan disease
68
Loss of function of aspartoacylase (ASPA)
Genetic Driver
AAV9 gene therapy to provide ASPA
Therapeutic Hypothesis
Pathophysiology
Dysregulated amino acid metabolism leads to neurodegeneration and loss of motor function. Most children do not
live past age 10
Prevalence
~1kUS & EU
Design Criteria for Optimal Therapy
IV delivery enables widespread delivery
across CNS
▪ Profound phenotypic rescue observed in mouse models by Dr. Guangping Gao
Clear PD biomarkers to measure effect of gene therapy (NAA)

CANAspire, our FIH trial for BBP-812, will assess two doses before expanding
69
Phase 1/2 Design
Status Eligibility
■ Age ≤ 30 months with Canavan disease
■ Stable health with no acute or chronic renal and liver disease
■ Negative for AAV9 total antibodies
■ Trial enrollment underway
FIH Trial Design Dose Escalation and Expansion Design
Two dose levels of BBP-812 are planned for the study
Dose level 1:N=3 | 1.3 × 10¹⁴ vg/kg
Dose level 2:N=3 | 3.0 × 10¹⁴ vg/kg
Expansion cohort:N=12+ | Selected dose
Cumulative safety data review before dose escalation or
dose expansion
Follow-up
Follow-up
Primary Objectives
■ Evaluate safety and tolerability
■ Levels of NAA (CSF, urine)
■ Developmental milestones (e.g., TIMPSI, GMFM-88, Canavan Disease Rating Scale)
Screening
Treatment & Follow-Up Period52-Weeks
Long-term Follow-Up4 Years

BBP-815: AAV gene therapy for TMC1 genetic hearing loss
70
Loss of function of transmembrane channel
protein 1 (TMC1)
Genetic Driver
Intracochlear delivery of AAV gene therapy to provide TMC1 and enable
natural hearing processes
Therapeutic Hypothesis
Pathophysiology
Lack of functional TMC1 protein in the inner and outer hair cells of the cochlea
leads to severe-to-profound bilateral hearing loss
Addressable Prevalence
~2kUS & EU
Design Criteria for Optimal Intervention
Dose-dependent, durable rescue of the hearing phenotype in
profoundly deaf mice
Only approach designed to enable
natural hearing
Near complete transduction of inner and
outer hair cells in NHPs

Gene therapy is the only modality designed to address TMC1 hearing loss at its source and allow for endogenous production of the TMC1 protein
71
BBP-815 is the only intervention designed to enable natural hearing
BBP-815 is designed to produce
the TMC1 protein directly in hair
cells of the cochlea and enable
mechanotransduction of sound
TMC1 = transmembrane channel protein 1
Sound-evoked displacement of hair cell stereocilia
Sensory Hair cell
TMC1
K+
Ca2+
Functional TMC1 enables hair cell depolarization
Mutated TMC1 disrupts electrical response to sound
mTMC1
K+
Ca2+
Therapeutic Approach
Preclinical Data

BBP-815 durably rescues hearing in profoundly-deaf mice
72
Durability of Auditory Brainstem Response (ABR) in TMC1-N193I mice dosed with BBP-815
Source: BridgeBio Gene Therapy data on file
Therapeutic Approach
Preclinical Data

BBP-818: AAV gene therapy for classic galactosemia type I
73
Loss of function of galactose-1-phosphate uridylyltransferase
(GALT)
Genetic Driver
AAV gene therapy to provideGALT enzyme and enable
galactose metabolism
Therapeutic Hypothesis
Pathophysiology
Inability to metabolize galactose leads to impaired speech, developmental delays,
impaired motor function, primary ovarian insufficiency, and osteopenia
Prevalence
7k+US & EU
Design Criteria for Optimal Therapy
Dose-dependent, durable restoration of the GALT enzyme in liver and CNS
Only approach designed to enable galactose metabolism, reduce gal-1p, and restore
galactosylation of lipids and proteins
Low threshold to correct phenotype

Classic galactosemia is a slowly progressive disease that impacts development of the CNS, ovaries, and bone despite strict dietary restrictions
74Source: Berry. Classic Galactosemia and Clinical Variant Galactosemia. 2021
Toddlers/Children
■ Speech/ language disorders
■ Developmental delays
■ Impaired growth
■ Cataracts
■ Learning delays
■ Neurological Impairments, including gait, balance, fine motor tremors
■ Behavioral and emotional issues
■ Tremor
Teens
■ Puberty and fertility problems (females)
■ Primary ovarian insufficiency (POI)
■ Anxiety
■ Growth delays
■ Social challenges
■ Learning difficulties
■ Tremor
Adults
■ Tremor
■ Seizures
■ Anxiety
■ Depression
■ ADHD
■ Cataracts
■ Early-onset dementia
Top 3 Lifelong Complications (despite dietary restriction):• 85% had impaired CNS development• 80% had impaired ovarian development• 26.5% had impaired bone development
Unmet Need
Therapeutic Approach
Preclinical Data
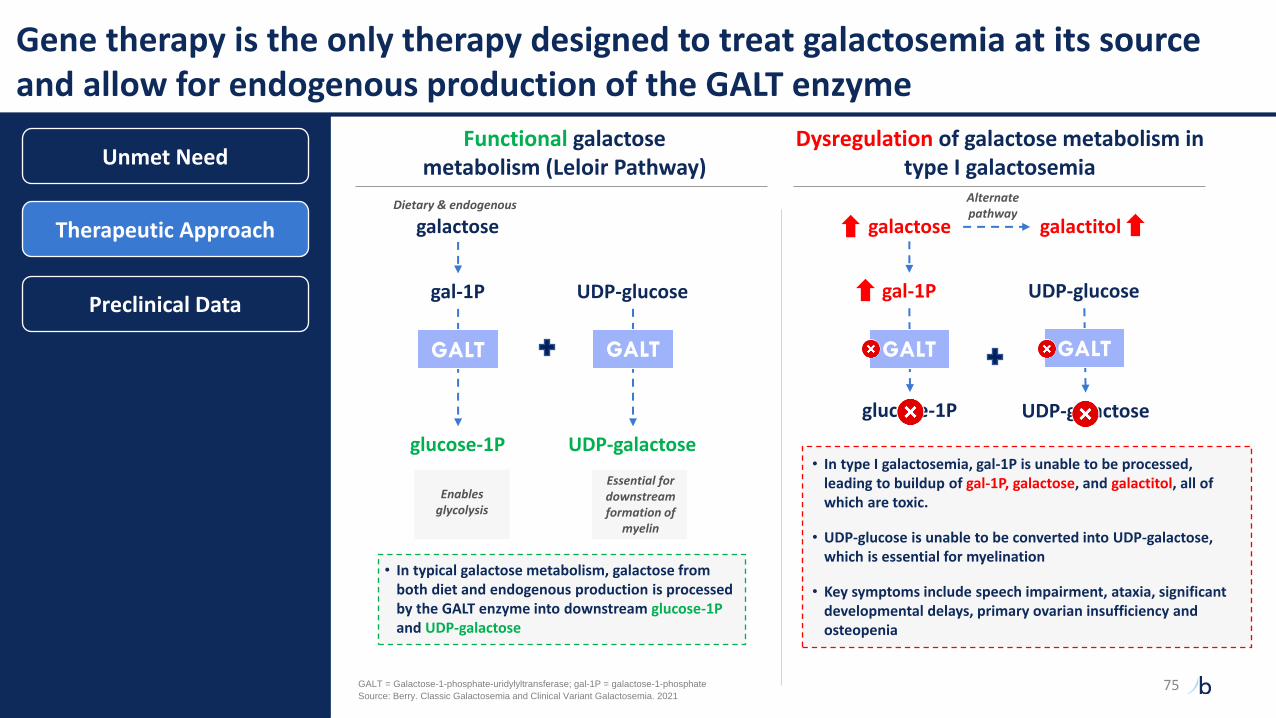
Gene therapy is the only therapy designed to treat galactosemia at its source and allow for endogenous production of the GALT enzyme
Functional galactose metabolism (Leloir Pathway)
Dysregulation of galactose metabolism in type I galactosemia
• In typical galactose metabolism, galactose from both diet and endogenous production is processed by the GALT enzyme into downstream glucose-1Pand UDP-galactose
galactose
gal-1P
Essential for downstream formation of
myelin
glucose-1P
UDP-glucose
GALT
UDP-galactose
galactose
glucose-1P
galactitol
UDP-galactose
• In type I galactosemia, gal-1P is unable to be processed, leading to buildup of gal-1P, galactose, and galactitol, all of which are toxic.
• UDP-glucose is unable to be converted into UDP-galactose, which is essential for myelination
• Key symptoms include speech impairment, ataxia, significant developmental delays, primary ovarian insufficiency and osteopenia
GALT = Galactose-1-phosphate-uridylyltransferase; gal-1P = galactose-1-phosphate 75
Enables glycolysis
Alternate pathway
GALT
gal-1P UDP-glucose
GALT GALT
Dietary & endogenous
Source: Berry. Classic Galactosemia and Clinical Variant Galactosemia. 2021
Unmet Need
Therapeutic Approach
Preclinical Data

BBP-818 achieves significant, dose-dependent production of the GALT enzyme in GALT-KO mouse brain; these levels may be sufficient for clinical impact
76
Human GALT activity levels (as a % of WT control)
GALT-KO mouse data suggests potentially therapeutic levels of
GALT enzyme production
GALT activity levels in GALT-KO mouse brain post-dosing with BBP-818
(as a % of WT mouse GALT levels)
Genotype-phenotype studies show patients with >10% of GALT activity tend to be
asymptomatic, and those with >1% tend to have much milder phenotype
Source: BridgeBio Gene Therapy data on file, Berry 2021, Fridovich-Keil 2014
52%
High DoseUntreated Low Dose Mid Dose
0%
20%
72%
0
10
20
30
40
50
60
70
80
In a study of children aged 6-12y with Duarte
galactosemia, no detectable difference in
developmental outcomes compared
with peers
No POI, mild cognitive
delaysImpaired
development of CNS, ovary
& bone
Asymptomatic
Classic e.g. Q188R
(0-1%)
Clinical variantS135L
(1-10%)
Biochemicale.g. Duarte(10-25%)
(% Enzyme activity)
Unmet Need
Therapeutic Approach
Preclinical Data
■ Data suggest dose-dependent enzyme expression
in the brain from 20%-72% of WT levels
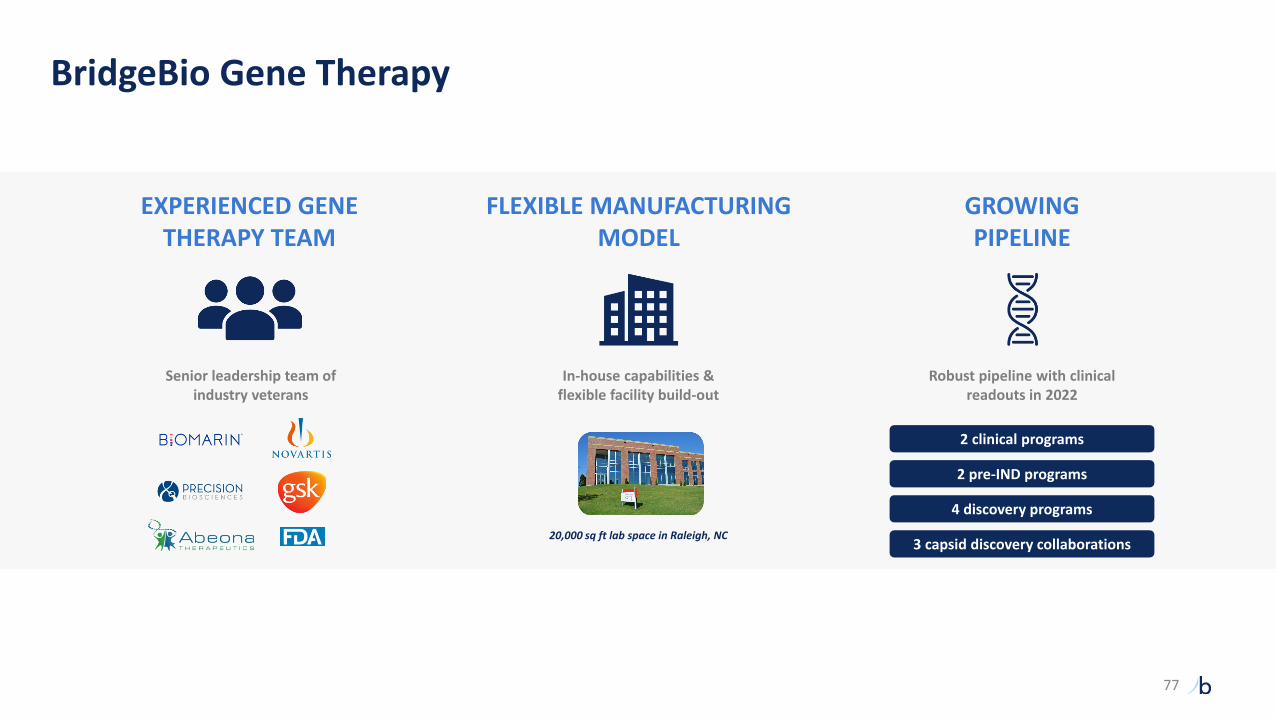
BridgeBio Gene Therapy
77
EXPERIENCED GENE THERAPY TEAM
FLEXIBLE MANUFACTURING MODEL
GROWINGPIPELINE
Senior leadership team of industry veterans
In-house capabilities & flexible facility build-out
Robust pipeline with clinical readouts in 2022
20,000 sq ft lab space in Raleigh, NC
2 clinical programs
2 pre-IND programs
4 discovery programs
3 capsid discovery collaborations

78
MendelianWave 3 Programs
Uma Sinha, Ph.D.
Chief Scientific Officer
78

1US carriers
Mendelian pipeline overview
Indication Drug MechanismPt. pop.(US+EU)
Discovery Pre-IND Phase 1 Phase 2 Phase 3 Approved
Me
nd
elia
n
MoCD type ANULIBRYTM (synthetic cPMP, fosdenopterin)
100
Achondroplasia Low-dose FGFRi (infigratinib) 55k
LGMD2i Glycosylation substrate (ribitol) 7k
RDEB Recombinant COL7 (BBP-589) 2k
PKAN / organic acidemia Pank activator (BBP-671) 7k
VM / LM Topical PI3Ki (BBP-681) 117k
Netherton Topical KLKi (BBP-561) 11k
PTEN autism PI3Kb inhibitor (BBP-472) 120k
4 undisclosed small molecule programs >500k
4 undisclosed antisense oligonucleotide programs >300k
Pre
cisi
on
C
ard
iore
nal
ATTR amyloidosis TTR stabilizer (acoramidis) >400k
ADH1 CaSR antagonist (encaleret) 12k1
PH1 / frequent stone formers GO1 inhibitor (BBP-711) 5k / 1.5m
2 undisclosed DCM programs >250k
Featured Programs
79

VioletLiving with PH1
Primary Hyperoxaluria Type 1 (PH1)
Loss of function of AGXT gene causing excess oxalate
Genetic Driver
GO1 inhibitor to reduce oxalate production
Therapeutic Hypothesis
Pathophysiology
Excess oxalate result in the buildup of oxalate stones in the kidneys,
urinary tract, and other vital organ
Prevalence
5kUS & EU
Design Criteria for Optimal Therapy
Highest pharmacodynamic response (max inhibition of GO)
Oral dosing
GO = glycolate oxidase
80

GO1 inhibitor (BBP-711) is designed to treat PH1 at its genetic source
Disease Mechanism Therapeutic Approach
Loss of function mutation in AGXT results in excess oxalate production, causing oxalate stone formation
Functional AGXT metabolizes glyoxylate into glycine resulting in normal oxalate production
Hyper - oxal - uria = Excess - oxalate - in the urine
Excess oxalate production
Kidney stones & nephrocalcinosis (tissue calcification in kidneys)
Glycolate Glyoxylate GlycineGO AGT
Inhibition of GO reduces the precursor substrate (glyoxylate) for oxalate production
Genetic mutation in AGXT results in AGT enzyme deficiency
Glycolate Glyoxylate GlycineGO AGT
GO inhibitor
Increased glycolate is safely excreted in
the urine
1
2
3
Urinary oxalate returns to normal or near normal levels
Potential reduction in oxalate stone formation
Inhibition of GO reduces glyoxylate
1
2
3
PH1 Program Overview
Phase 1 Clinical Data
Expansion opportunity
81

Well tolerated in Phase 1 with dose-dependent increases in plasma glycolate
0
50
100
150
200
250
1Placebo 2 13 4 5 2 3
PH1 Program Overview
Phase 1 Clinical Data
Expansion opportunity
Oral doses in healthy adult volunteers
Key Endpoints
Phase 1 data& Phase 2/3 start
2022
Timeline
• Increase in plasma glycolate
• Safety and tolerability
• Pharmacokinetic profile
Mean maximal plasma glycolate concentrationMean ± SD (µM)
Well tolerated• No safety signals of clinical
concern• All AEs were mild or
moderate
Favorable PK/PD profile• Potential to maximally inhibit GO
with once-daily dosing• Largest glycolate response
observed to date by targeting GO
Preliminary and interim data
Single dose cohorts Multiple dose cohorts (day 7)
Lumasiran 3 mg/kg
Human HAO1 knockout
Source: Frishberg, Yaacov, et al. CJASN (2021); McGregor, Tracy et al. eLife (2020)
82

Expansion opportunity in recurrent stone formers with hyperoxaluria
PH1 Program Overview
Phase 1 Clinical Data
Expansion opportunity
Epigenomic changes in AGXT results in excess oxalate production, causing oxalate stone formation
Kidney stones & greater risk of CKD
Glycolate Glyoxylate GlycineGO AGT
1
2
3
Excess oxalate production
Reduced expression of AGXT
Prevalence
~1.5MUS & EU
Epigenomic Driver
Hypermethylation and downregulation of AGXT
causing excess oxalate
Disease Mechanism
Gianmoena, Kathrin, et al. "Epigenomic and transcriptional profiling identifies impaired glyoxylate detoxification in NAFLD as a risk factor for hyperoxaluria." Cell Reports 36.8 (2021): 109526.
83

SeamusLiving with LGMD2i
Limb-Girdle Muscular Dystrophy Type 2i (LGMD2i)
Loss of function of FKRP gene
Genetic Driver
Add glycosylation substrate to drive residual enzyme activity
Therapeutic Hypothesis
Pathophysiology
Progressive muscle weakness resulting in the loss of ability to perform routine daily functions
Prevalence1
7kUS & EU
Design Criteria for Optimal Therapy
Naturally occurring compound with strong safety profile
First potential disease targeting therapy
1Includes all patients with potentially treatable mutations
Oral dosing
84

Ribitol (BBP-418) is being investigated as an upstream substrate to drive residual activity of the mutant FKRP enzyme
LGMD2i Program Overview
Disease Mechanism Therapeutic Approach
Endogenous ribitol
CDP- endogenous ribitol
Partial loss of function mutation in FKRP result in dysfunctional, hypo-glycosylated α-DG in muscle cells which increases cell susceptibility to damage
Mutations in FKRP prevent addition of CDP-ribitol to alpha-dystroglycan (hypo-glycosylated α-DG) limiting α-DG’s ability to function as a “shock
absorber” for muscle fibers
Functional FKRP fully glycosylates alpha-dystroglycan (α-DG) which stabilizes cells by binding extracellular ligands
Supply supraphysiological levels of ribitol upstream to drive residual activity of mutant FKRP enzyme and increase α-DG glycosylation levels
Orally-administered exogenous ribitol (BBP-418)
CDP- ribitol
Potential partial restoration of α-DG glycosylation
Update / Next Steps
85

Strong safety profile in Phase 1 with first LGMD2i patient dosed in 1Q21
LGMD2i Program Overview
Update / Next Steps
Key Endpoints
Phase 2 Data
2022
Strong safety profile with all doses well-tolerated
Dose-proportional exposures up to the highest dose tested
Informed Phase 2 dosing selection
Phase 2 ongoing
• Safety and tolerability
• Functional clinical assessments
• Glycosylated α-DG
• Creatine Kinase (marker of muscle breakdown)
0
100
200
300
400
500
600
700
800
900
0 2 4 6 8 10 12 14 16 18
Total Daily Dose (g)
AU
C (
ug*
h/m
l)
1MAD cohorts include 1.5g QD, 3g QD, 3g BID, 6g BID, 9g BID
SAD MAD1
Phase 1 findings: Exposure by total daily dose for healthy volunteers Timeline
86

Child Living with RDEB
Recessive Dystrophic Epidermolysis Bullosa (RDEB)
Loss of function of collagen type VII protein (C7)
Genetic Driver
Systemic treatment by providing C7 replacement therapy through IV infusion
Therapeutic Hypothesis
Pathophysiology
Loss of structural adhesion causes debilitating blistering, tearing and
scarring of the skin and impacts oral and GI
Prevalence
2kUS & EU
Potential to provide GI & oral benefits while also proactively
improving the quality of wounds
Only systemic treatment
targeting RDEB
Convenient dosing schedule for patient
and families
Design Criteria for Optimal Therapy
87

PTR-01 is currently the only systemic treatment targeting RDEB at its source
RDEB Program Overview
Update / Next Steps
Disease Mechanism Therapeutic Approach
RDEB Patient
Functional C7 forms anchoring fibrils (AFs) to secure the epidermis to the dermis in healthy skin Collagen 7
Mutated C7 causes severe blistering due to loss of structural adhesion
Blistering
Unanchored Reticular Fibrils
Symptoms
Localized skin Universal skin Systemic tissues
■ Severe blistering
■ Wounding
■ Extensive scarring
■ Dystrophy and
loss of nails
■ Mitten deformity of
hand and feet
■ Higher risk for
aggressive
squamous-cell
carcinoma
■ Joint contractures
■ Oral and dental
malformations
■ Severe impact to
upper GI track
■ Nutritional deficits
and anemia
BBP-589
Unanchored Reticular Fibrils
Blistering
BBP-589 deposits
in the skin,
assembles into
functional AFs, and
reconstitutes DEJ
adhesion in
patients with RDEB
Treated Patient
IV infusion of BBP-589
DEJ: dermal-epidermal junction
Epidermis layer
Dermis layer
88

Well tolerated in Phase 1 with dose-dependent increase in C7 skin deposition
RDEB Program Overview
Update / Next Steps
Key Endpoints
Phase 2 data
1H22
All 3 patients receiving 3mg/kg dose exhibitedincreased C7 deposition at the DEJ
Phase 1: Immunofluorescence C7 Deposition Timeline
0
20
40
60
80
100
120
0
20
40
60
80
100
120
140
NC
1 S
tain
ing
NC
2 S
tain
ing
Patient 1 Patient 2 Patient 3
3 mg/kg 0.3 mg/kg
C7
De
po
siti
on
at
DEJ
(%
of
NH
S)C
7 D
ep
osi
tio
n a
t D
EJ
(% o
f N
HS)
Days following initial BBP-589 dose
B 29 43 71 85 127
B 29 43 71 85 127
Treatment window: Pts received 3 doses of BBP-589 (3mg/kg) during this time
B 127 B 127
B 127B 127
29 43 71 85 29 43 71 85
29 43 71 85 29 43 71 85
Days following initial BBP-589 dose
Patients 1 and 2 participated in the 3mg/kg and 0.3mg/kg cohorts. DEJ: dermal-epidermal junction
• Wound improvement
• Deposition of C7 in skin biopsy
• Safety and tolerability
89

Mendelian program summary
15+ Mendelian Disease Programs
1 FDA approval MoCD Type A
5 mid/late-stage programs ATTR, Achondroplasia, ADH1, RDEB, LGMD2i
3 early clinical programs PH1, PKAN, VM/LM
10+ preclinical programs
Catalysts (YE21 / 2022)
Acoramidis – Part A readout 4Q 2021
Achondroplasia, RDEB, LGMD2i, PH1 2022
90

91
Precision Oncology:Program Updates
Eli Wallace, Ph.D.
Chief Scientific Officer,
Oncology
91

Indication Drug MechanismPt. pop.(US+EU)
Discovery Pre-IND Phase 1 Phase 2 Phase 3 Approved
Pre
cisi
on
On
colo
gy
FGFR2+ cholangiocarcinoma (2L) TRUSELTIQTM (FGFRi, infigratinib)4k
FGFR2+ cholangiocarcinoma (1L) FGFRi (infigratinib)
FGFR3+ adjuvant urothelial FGFRi (infigratinib) 21k
FGFR1-3+ tumor agnostic FGFRi (infigratinib) 24k
FGFR1-3+ gastric cancer FGFRi (infigratinib) 41k1
MAPK / RAS-driven cancerSHP2i monotherapy (BBP-398)
>500kSHP2i combo therapy (BBP-398)
KRAS-driven cancer
KRAS G12C dual inhibitor
>500kPI3Ka:RAS Breaker
KRAS G12Di
Solid tumors GPX4i >500k
1China + Japan patient population
Precision oncology pipeline overview
Featured Programs
92

BasiaLiving with pancreatic
cancer (>90% KRAS-driven)
KRAS mutant-driven cancers
Pathophysiology
RAS is the most frequently mutated oncogene, leading to abnormal cell
proliferation and survival
Prevalence
>500kUS & EU
MOA: first to block RAS-driven PI3Kα activation with the potential to avoid
adverse effects on glucose metabolism
MOA: first to directly bind and inhibit both GTP (active) and GDP (inactive)
states of KRASG12C
Program Highlights
G12C dual inhibitor PI3Ka:RAS Breaker
MOA: directly bind and inhibit KRASG12D -the single most prevalent KRAS mutant
G12D inhibitor
MOA = mechanism of action
93

Partnerships afford us exceptional collaborators and resources
■ Partnership with the National RAS Initiative, including 60 of the world’s foremost academic RAS researchers
■ Cutting edge RAS structural biology expertise
■ Utilization of cutting-edge instrumentation and techniques, as well as the expertise to lead experiments
■ Home to Sierra: the world’s 3rd fastest computing system
■ Enables multi-microsecond molecular dynamics simulations of protein complexes, and highly efficient in silico docking simulations
■ This computing power, combined with RAS structural biology expertise at the NCI, delivers unique insights that fuel our drug design
Research Capabilities
G12C Dual Inhibitor
PI3Ka:RAS Breaker
94

We hypothesize that a compound that inhibits both GTP (active) and GDP (inactive) forms of KRASG12C will be superior to one that only inhibits the latter
Ras“OFF”
Ras“ON”
Newly made RASGTP
BBP
AMG510MRTX849
BBP
GTP (active) / GDP (inactive) dual inhibitor e.g. BBP compounds
GDP (inactive) inhibitors e.g. AMG510, MRTX849
Blocks oncogenic signaling from KRASG12C GTP (active)
Prevents KRASG12C GDP (inactive) from cycling to KRASG12C GTP (active)
Prevents resistance from residual KRASG12C GTP (active) signaling
1
2
3
Source: Adapted from Schoneborn & Heumann, IJMS, 2018. Note: Conclusions based on preclinical models
Research Capabilities
G12C Dual Inhibitor
PI3Ka:RAS Breaker
95

BridgeBio G12C inhibitors modify both GTP (active) and GDP (inactive) forms of KRASG12C
BBP AMG510 MRTX849
% modified
KRASG12C GTP (active)
15’ 100 0 0
120’ 100 0 0
KRASG12C GDP (inactive)
15’ 100 80 73
120’ 100 83 80
KRASG12C : RAF1 Effector Binding IC50 (nM)
35 >100,000 20,000
H358 pERK IC50 @ 30’ (nM) 8 50 310
Multiple series of dual inhibitors progressing to identify development candidate
Research Capabilities
G12C Dual Inhibitor
PI3Ka:RAS Breaker
Note: Conclusions based on preclinical models 96

RAS-GTP “locked” mutant A59G, provides strong evidence for cellular GTP-state inhibitor activity
Impact of KRAS Mutations on Nucleotide Turnover
KRAS(inactive)
GDP
KRAS(active)
GTP
G12C
A59GX
A59G is a 'transition state' mutant that abrogates GTPase activity and locks KRAS in GTP-state
Strong pAKT, pMek and pERK inhibition observed with BBP KRAS-GTP/GDP dual inhibitor
DMSOAMG-510 (µM) BBP (µM)
0.3 1 3 10 0.3 1 3 10
Vinculin
AKT
pAKT
(S473)
ERK
pERK
KRAS
MEK
pMEK
Research Capabilities
G12C Dual Inhibitor
PI3Ka:RAS Breaker
KRASG12C/A59G
Note: Conclusions based on preclinical models 97

BridgeBio G12C dual inhibitors engage KRASG12C more quickly and potently than inhibitors that only target the GDP (inactive) form
KRASG12C homozygous, p53 mutant CRC
Vinculin
AKT
pAKT (S473)
ERK
pERK
KRAS4b
6 h
DMSO AMG MRTX BBP1 BBP2
24 h
DMSO AMG MRTX BBP1 BBP2
30 min
DMSO AMG MRTX BBP1 BBP2
2 h
DMSO AMG MRTX BBP1 BBP2
GTP/GDP dual inhibitors:✓ Quickly engage the target because they do not depend on nucleotide cycling to
reveal the substrate✓ Show faster and greater inhibition of pERK and pAKT than GDP (inactive) inhibitors
Research Capabilities
G12C Dual Inhibitor
PI3Ka:RAS Breaker
Note: Conclusions based on preclinical models 98

BBP AMG510 MRTX849
Day 6 < 1 7 5
Day 13 < 1 32 19
Day 34 < 1 107 36
% Confluence (IC50, nM)
Clonogenic Assay
BridgeBio G12C dual inhibitors are more potent and retain activity compared to inhibitors that only target the GDP (inactive) form
Research Capabilities
G12C Dual Inhibitor
PI3Ka:RAS Breaker
GTP/GDP dual inhibitors:✓ Potently inhibit colony formation✓ Retain potent activity suggesting that inhibiting both states of mutant KRAS
reduces or delays development of resistance
Day 6 Day 13 Day 34
0.1 1 10 100 1000
0
20
40
60
80
nM
% C
on
flu
en
ce
0.1 1 10 100 1000
0
20
40
60
80
100
120
nM
% C
on
flu
en
ce
0.1 1 10 100 1000
0
20
40
60
80
100
120
nM
% C
on
flu
en
ce
AMG510
MRTX849
BBP
Note: Conclusions based on preclinical models 99

Vehicle 2 4 8 24 48
0
20
40
60
80
100
120
MIA PaCa-2(100 mg/kg BBP time course)
Hours
%p
ER
K (
No
rmalized
to
Veh
)
*
One-way ANOVA with Tukey's test vs vehicle *p<0.0001
** *
*
BridgeBio dual GTP/GDP inhibitors show potent and sustained inhibition of pERK in vivo
Dose Response Time Response
Vehicle 30 60 100
0
20
40
60
80
100
120
MIA PaCa-2(4 hours post BBP dose)
Dose (mg/kg)
%p
ER
K (
No
rmalized
to
Veh
)
*
One-way ANOVA with Tukey's test vs vehicle *p<0.001, **p<0.0001
***
Research Capabilities
G12C Dual Inhibitor
PI3Ka:RAS Breaker
GTP/GDP dual inhibitors:✓ Dose dependently inhibit pERK✓ Provide sustained pERK inhibition over 48 hours after a single dose
Note: Conclusions based on preclinical models 100

BBP induces tumor regressions and is well tolerated in the MIA PaCa-2 CDX model
MIA PaCa-2 pancreatic CDX (KRASG12C) Research Capabilities
G12C Dual Inhibitor
PI3Ka:RAS Breaker
Note: Conclusions based on preclinical models
0 7 14
0
200
400
600
800
Days on Treatment
Tu
mo
r vo
lum
e (
mm
3)
0 7 14
-40
-20
0
20
40
Days on Treatment
Bo
dy W
eig
ht
Ch
an
ge (
%)
Tumor volume Body weight % change
101

Novel approach to target PI3Ka is tumor cell specific and differentiates from kinase inhibitors
Normal Cells
RTK
PI3K
AKT
Glucose metabolism, survival
Alpelisib(PI3Ka)
XXX
insulinRTK
PI3K
AKT
RAS
XXX
Alpelisib(PI3Ka)
BBPBreaker
Survival & proliferation
Often mutated in cancer
Tumor Cells
Research Capabilities
G12C Dual Inhibitor
PI3Ka:RAS Breaker
■ PI3Ka kinase inhibitors block normal cell signaling as well as RAS-driven PI3Ka pathway activation in tumor cells, resulting in dose-limiting hyperglycemia and insulin-driven resistance
■ Our novel approach of inhibiting PI3Kα:RAS PPI with a “PI3Kα Breaker” should avoid hyperglycemia and insulin-driven resistance by specifically targeting tumor cells and may provide multiple therapeutic opportunities:
Tumors with RAS or PI3Kα helical mutations and RTK mutant/amplified drivers
Potential combination with ERK pathway inhibition (BRAFi, MEKi, ERKi, KRASG12Ci)
102

Impairing the PI3Ka:RAS interaction blocks oncogene-driven NSCLC tumor growth in vivo
▪ Mutating the RBD of PIK3CA in NSCLC models has profound effects on EGFR- and KRASG12D-driven tumorigenesis
▪ RBD mutant mice have normal glucose metabolism
Sources: Gupta et al Cell 2007; Castellano et al Cancer Cell 2013; Murillo et al., Cell Reports 2018
Research Capabilities
G12C Dual Inhibitor
PI3Ka:RAS Breaker
KRASG12D-driven tumor growth is inhibited in mice with T208D and
K227A mutations in the RAS-Binding Domain (RBD) of PIK3CA
Mutating the RBD of PIK3CA in the EGFRT790M/L858R mutant NSCLC
model H1975 abrogates xenograft tumor growth
103

BridgeBio has discovered potent and selective PI3Ka:RAS breakers
▪ Structural insights provide a novel approach to develop PI3Kα:RAS breakers
▪ PI3Kα:RAS breakers selectively bind to PI3Kα
PI3Kα amino acid sequence in the region of the binding pocket is unique amongst all the isoforms
No binding affinity to KRAS
▪ PI3Kα:RAS breakers do not affect kinase activity of PI3Kα
BBP Alpelisib
PI3Kα Binding (IC50, nM) 177 N/A
pAKT (IC50, nM) 21 169
Cell Viability 134 744
Multiple series of compounds have been identified as potent PI3Kα:RAS PPI inhibitors
RTK
PI3K
AKT
RAS
XXX
Alpelisib(PI3Ka)
BBPBreaker
Survival & proliferation
Often mutated in cancer
Tumor CellsResearch Capabilities
G12C Dual Inhibitor
PI3Ka:RAS Breaker
104

Cellular experiments show that only PI3Ka breaker differentiates between RAS and IRS-driven pAKT activation
IRS-dependent Cells
RAS-dependent Cells
Survival & Proliferation
IGF-1
IGF-1R
IRS
Glucose Metabolism
PI3K
IGF-1
IGF-1R
PI3Kai
BBPBreaker
PI3K
AKTP
AKTP
RAS
% AKT inhibition in cells treated with IGF
These data suggest that PI3Ka breakers may avoid the on-target hyperglycemia associated with PI3Ka kinase inhibitors
0.001 0.01 0.1 1 10
0
20
40
60
80
100
120
mM
% p
AK
T In
hib
itio
n
IGF Stimulation
pan PI3Ki
Alpelisib
BBP
Ras-dependant IRS-dependant
IRS – insulin receptor substrate; IGF-1 – insulin-like growth factor-1
Research Capabilities
G12C Dual Inhibitor
PI3Ka:RAS Breaker
Ras-dependent IRS-dependent
105

BBP-398: SHP2 inhibitor for treatment resistant cancer
Potential to be best-in-class based on optimal PK profile that may enable
tolerable once-daily dosing
BBP-398 is a selective, orally bioavailable,
allosteric SHP2 inhibitor
Program Highlights
Monotherapy dose escalation is ongoing with plans to initiate combination studies
next year
Pathophysiology
SHP2 acts upstream of RAS/ERK in RTK and cytokine signaling to
regulate cell proliferation, survival, adhesion, and migration
Prevalence
>500kUS & EU
BBP-398, a SHP2 inhibitor
SHP2
EGFR Mutation
EGFR
106

BBP-398 shows best-in-class potential in a large cancer market
Overview
Preclinical Data
Phase 1 Dose Escalation
Our SHP2i blocks downstream MAPK signaling and abrogates
T cell exhaustion
1US incidence estimated from SEER, TCGA; all scaled for WW incidence
KRASGDP
KRAS GTP
RAS(OFF)
RAS(ON)
SHP2
Receptor tyrosine kinase signals (EGFR, ALK, TRK, RET)
RAS effectors
Tumor cell proliferation and survival
Programmed death-ligand 1 (PD-L1)
Programmed death -1 (PD-1) receptor
SHP2
Downstream signaling
T cell exhaustion
We believe BBP-398 has the ideal properties for combination with a
multitude of other therapeutic classes
Combination Agent Patient Population1
KRAS G12Ci 70,000
EGFRi 150,000
PD-1 700,000
Initial clinical combinations of focus based on SHP2i preclinical data
✓ Human half life: ~10-15 hours
✓ Optimal PK profile which may enable better tolerability in combination
(LianBio)
107

Predicted BBP-398 pharmacokinetics support once daily oral administration to achieve target coverage
Overview
Preclinical Data
Phase 1 Dose Escalation
BBP-398 steady-state PK simulation for optimal efficacy
Predicted clinical exposure supports coverage of efficacy target in patients may be achieved with continuous once daily dosing
0 7 14 21 28
0
200
400
600
800
1000
1200
Days on Treatment
Tu
mo
r vo
lum
e (
mm
3)
Vehicle
BBP-398 (1 mg/kg)
BBP-398 (3 mg/kg)
BBP-398 (10 mg/kg)
BBP-398 (30 mg/kg)
BBP-398 (100 mg/kg)
*
**
*
ED50
(mg/kg)
ED90
(mg/kg)
3.99 10.1
All groups dosed QD, PO
Two-way mixed-effects ANOVA: *p < 0.0001 vs vehicle
HCC827 (EGFRex19del & EGFRamp) - NSCLC CDX
108

BBP-398 dose escalation ongoingDose expansion at RP2D and combinations with Nivolumab and G12Ci planned for 2022
Phase 1 dose escalation with BBP-398 is ongoing: Observed PK/PD is in-line with preclinical predictions
Overview
Preclinical Data
Phase 1 Dose Escalation
Cohort 1
Cohort 2
Cohort 3
Cohort 6 Expansion Cohort 1Advanced or metastatic KRASG12C NSCLC
Expansion Cohort 2Advanced or metastatic KRASG12C non-NSCLC
solid tumor
Expansion Cohort 3Advanced or metastatic solid tumor with other
MAPK-pathway alterations
Expansion Cohort 4Advanced or metastatic osimertinib-resistant
NSCLC
Key enrollment criteria: Patients with MAPK-pathway alterations (e.g., KRASG12C, EGFR-mutant, but excluding BRAFV600X mutations).
Cohort 5
Cohort 4
Dose escalation cohorts Dose expansion (at RP2D)
109

Precision oncology summary
BridgeBio Oncology
■ Infigratinib approved for 2nd line FGFR2 fusion cholangiocarcinoma with multiple late-stage studies
ongoing
■ Identified multiple series of differentiated novel KRASG12C GTP/GDP inhibitors
■ Identified multiple series of differentiated novel PI3Ka:RAS Breakers
■ Progressing potentially best-in-class SHP2 inhibitor BBP-398 with differentiated pharmacokinetic profile
that may enable once-daily dosing in combination studies
2022 Targets
■ RAS development candidate
■ Present BBP-398 Phase 1 monotherapy data
■ Initiate BBP-398 combination studies (KRAS G12Ci, IO, EGFRi)
110

111
BridgeBioXCharles Homcy, M.D.
Chairman of Pharmaceuticals
111

BridgeBioX lab at Stanford
Our discovery lab is located in the Stanford Life Sciences District – we aim to create an academic/industry hybrid environment, and foster a culture driven by intellectual curiosity and a dedication to patient impact
112