randomized phase 2 study of low-dose decitabine vs low
TRANSCRIPT

Regular Article
CLINICAL TRIALS AND OBSERVATIONS
Randomized phase 2 study of low-dose decitabine vs low-dose azacitidinein lower-risk MDS and MDS/MPNElias Jabbour,1 Nicholas J. Short,1 Guillermo Montalban-Bravo,1 Xuelin Huang,1 Carlos Bueso-Ramos,1 Wei Qiao,1
Hui Yang,1 Chong Zhao,1 Tapan Kadia,1 Gautam Borthakur,1 Naveen Pemmaraju,1 Koji Sasaki,1 Zeev Estrov,1
Jorge Cortes,1 Farhad Ravandi,1 Yesid Alvarado,1 Rami Komrokji,2 Mikkael A. Sekeres,3 David P. Steensma,4 Amy DeZern,5
Gail Roboz,6 Hagop Kantarjian,1 and Guillermo Garcia-Manero1
1The University of Texas MD Anderson Cancer Center, Houston, TX; 2Moffitt Cancer Center, Tampa, FL; 3Cleveland Clinic, Cleveland, OH; 4Dana-Farber
Cancer Institute, Boston, MA; 5Johns Hopkins University, Baltimore, MD; and 6Cornell Medical College, New York, NY
Key Points
• Low-dose hypomethylatingagents are safe and effectivein patients with lower-riskMDS and MDS/MPN.
• Decitabine was associatedhigher response ratescompared with azacitidine,especially in patients withhigher-risk features.
Hypomethylating agents (HMAs) improve survival in patients with higher-risk myelodys-
plastic syndromes (MDS) but are less well-studied in lower-risk disease. We compared
the safety and efficacy of low-dose decitabine vs low-dose azacitidine in this group of
patients.Adultswith low-or intermediate1-riskMDSorMDS/myeloproliferativeneoplasm
(MPN), including chronic myelomonocytic leukemia, according to the International
Prognostic Scoring System, were randomly assigned using a Bayesian adaptive design
to receive either azacitidine 75 mg/m2 intravenously/subcutaneously daily or decitabine
20 mg/m2 intravenously daily for 3 consecutive days on a 28-day cycle. The primary
outcome was overall response rate (ORR). Between November 2012 and February 2016,
113 patients were treated: 40 (35%) with azacitidine and 73 (65%) with decitabine. The
median age was 70 years; 81% of patients were intermediate 1-risk patients. The median
number of cycles received was 9. The ORRs were 70% and 49% (P 5 .03) for patients
treated with decitabine and azacitidine, respectively. Thirty-two percent of patients
treatedwith decitabine became transfusion independent comparedwith 16%of patients treatedwith azacitidine (P5 .2). Cytogenetic
response rates were 61% and 25% (P 5 .02), respectively. With a median follow-up of 20 months, the overall median event-free
survival was 18 months: 20 and 13 months for patients treated with decitabine and azacitidine, respectively (P 5 .1). Treatment was
well tolerated, with a 6-week mortality rate of 0%. The use of low-dose HMAs is safe and effective in patients with lower-risk MDS
and MDS/MPN. Their effect on the natural history of lower-risk disease needs to be further studied. This trial was registered at
clinicaltrials.gov (identifier NCT01720225). (Blood. 2017;130(13):1514-1522)
Introduction
Myelodysplastic syndromes (MDSs) are a heterogeneous group ofmyeloid malignancies with variable prognoses.1,2 Patients can begenerallydivided into lower- andhigher-risk groups.3-5 The outcomeofpatients with lower-risk MDS (low- and intermediate 1-risk by theInternational Prognostic Scoring System [IPSS]) is heterogeneous.3,6
For instance, using the MD Anderson lower-risk scoring system,patients can be separated in subsets with distinct survival outcomes,ranging from a 4-year survival rate of 65% for patients with morefavorable disease to only 7% for patients with poor-risk features.6
Until now, most strategies in lower-risk MDS have focused onimproving transfusion requirements (eg, hematopoietic growth factors)or are only active in a small subset of patients (eg, lenalidomide inpatientswithdeletionof chromosome5q).7Given the poor prognosis ofa fraction of patients with so-called lower-risk MDS, strategies thatcould potentially alter the natural history of this disease and improveoverall survival (OS) are needed. The hypomethylating agents (HMAs)azacitidine and decitabine have been shown to improve survival or
delay disease progression in patients with higher-risk MDS.8-11 How-ever, the use of HMAs is less well-studied in patients with lower-riskdisease.
The standard dose/schedules of decitabine (20 mg/m2/day 3 5days) and azacitidine (75mg/m2/day37days) that are commonly usedfor patients with higher-riskMDS tend to bemyelosuppresive andmayhave a less favorable risk-benefit balance in patients with lower-riskMDS. Several studies have previously suggested that low doses ofHMAs administered using shorter treatment schedules are active inlower-riskMDS.12-14 Low-dose decitabine (20 mg/m2 daily3 3 days)showed promising results in a small trial, with an objective re-sponse rate of 23% and a transfusion independency rate of 67%.12
Furthermore, a phase 1 study of oral azacitidine (CC-486) indicatedthat lower drug doses with more prolonged exposure may have animproved toxicity profile.13 An objective response rate of 73% wasdocumented in patients with previously untreated MDS with oralazacitidine.
Submitted 31 May 2017; accepted 24 July 2017. Prepublished online as Blood
First Edition paper, 3 August 2017; DOI 10.1182/blood-2017-06-788497.
The online version of this article contains a data supplement.
The publication costs of this article were defrayed in part by page charge
payment. Therefore, and solely to indicate this fact, this article is hereby
marked “advertisement” in accordance with 18 USC section 1734.
© 2017 by The American Society of Hematology
1514 BLOOD, 28 SEPTEMBER 2017 x VOLUME 130, NUMBER 13
For personal use only. on March 6, 2018. by Fredrik Schjesvold www.bloodjournal.orgFrom

We conducted a randomized study to assess response rates andevent-free survival (EFS) in patients with lower-riskMDS treated withlow-dose HMAs, the risk-benefit profile of which is better alignedwith less severe MDS.
Patients and methods
Patients
Adult patientswith low- or intermediate 1-riskMDSor chronicmyelomonocyticleukemia (CMML), as per IPSS, were eligible for this study. The IPSSwas usedto classify both patients withMDS and patients with CMML to have a consistentset of inclusion criteria across disease subgroups. Patients were required to havean Eastern Cooperative Oncology Group performance status of 0 to 2 andadequate liver function (bilirubin ,2 mg/dL) and renal function (creatinine,2mg/dL). Nursing and pregnant womenwere excluded. Patients of childbearingpotential were required to practice effective methods of contraception. Otherexclusions included active and uncontrolled infection and uncontrolledintercurrent illnesses. Patients could not have received any prior therapy withHMAs, although patients who had received other prior treatments for MDS,including growth factors, were eligible. Hydroxyurea was permitted to controlwhite blood cell counts before study treatment. All patients signed informedconsent according to institutional guidelines and in accordance with theDeclaration of Helsinki. This trial was registered at clinicaltrials.gov (identifierNCT01720225).
Study design and therapy
A Bayesian response-adaptive design was used to assign patients to 1 of the2 treatment arms: armA, decitabine 20mg/m2 intravenously (IV) over the courseof 1 hour daily for 3 days; or arm B, azacitidine 75 mg/m2 IV over the course of1 hour or subcutaneously daily for 3 days.15,16 Courses were repeated every4weekswhenpossible.Dose reductions for grade3 and4 toxicitieswere allowedfor decitabine (to 15 mg/m2 and 10 mg/m2) and azacitidine (to 50 mg/m2 and25mg/m2daily).Respondingpatientswereallowed tocontinue therapy indefinitely.Bone marrow aspiration and/or biopsy were performed at the end of course 2 andevery 3 months during the first year, and then every 3 to 6 months thereafter.
Statistical considerations and response criteria
An adaptive randomization designwas used to assign patients to treatment basedon response rate after the second cycle of therapy.15,16 Response after 2 cycleswas used to facilitate adaptive randomization, although overall response rate(ORR)was the primary endpoint of the study. Initially, 20 patientswere assignedto each arm with equal assignment probability. Then, as efficacy data ac-cumulated, patient assignment to each treatment arm depended on responserates. A sample size of 120 patientswas planned,which can provide 90%powerto detect a difference in the ORR between the 2 treatment arms.
Responses were coded according to the modified 2006 InternationalWorking Group criteria.17 Differences among variables were evaluated by thex-square test andMann–WhitneyU test for categorical and continuous variables,respectively.18 Cytogenetic responses were assessed in patients with abnormalkaryotype at the time of enrollment. Complete cytogenetic response was definedas the achievement of a diploid karyotype among at least 20 metaphasesanalyzed. Partial cytogenetic responsewas defined as the reduction of 50%of theabnormal metaphases without the acquisition of any new abnormality among atleast 20metaphases analyzed.19 EFSwas defined as the time between the start oftherapy and the date of determination of lack of response, loss of response,transformation to acute myeloid leukemia, or death, whichever occurred first.Leukemia-free survival (LFS) was calculated as the number of months fromtreatment initiation to transformation to leukemia. OS was defined as the timebetween the start of therapy and death. Patients whowere alive at the last follow-updatewere censored in survival analyses. Survival probabilitieswere calculatedby using the Kaplan-Meier method and were assessed from the time of therapyinitiation; they were compared by the log-rank test.20 Univariate Cox pro-portional hazards were used to identify association between survival and
potential risk factors. Statistical analysis was performed using SPSS version 22statistical software (IBM Corporation). Generalized linear models were used tostudy the association of ORR, complete response (CR), and risk factors. TheORRand adverse eventsweremonitored during the study, and all datawere usedto update the prior distributions for toxicity and efficacy parameters.
Gene sequencing
We performed mutation analysis using a 53- or 28-gene panel, as previouslydescribed.21-23Briefly, genomicDNAwas extracted frombonemarrowaspiratesor peripheral blood. Amplicon-based next-generation sequencing targeting theentire coding regions of a panel of 53 or 28 genes (supplemental Methods,available on the Blood Web site) associated with myeloid neoplasms wasperformed using a MiSeq platform (Illumina, San Diego, CA). A sequencinglibrarywas prepared using 250 ngDNA template. Equal quantities ofDNA frompurified sequencing librarieswere used for TruSeq paired-end sequencing on theMiSeq sequencer, using the MiSeq Reagent Kit v2 (500 cycles). Variant callingwas performed with Illumina MiSeq Reporter Software, using human genomebuild 19 (hg 19) as a reference. For clinical reporting, a minimum sequencingcoverage of 2503 (bidirectional true paired-end sequencing) was required. Theanalytical sensitivitywas establishedat 5%mutant reads in abackgroundofwild-type reads. Previously described somatic mutations registered at the Catalogueof Somatic Mutations in Cancer (COSMIC: http://cancer.sanger.ac.uk/cosmic)were considered as potential driver mutations. In addition, sequencing ofSF3B1 (exons 14 and 15), SRSF2 (exon 1),U2AF1 (exons 2 and 6), andZRSR2(exons 1-11) was performed onwhole-bonemarrowDNAby Sanger sequencingon a total of 52 patients.
Results
Patient characteristics
In total, 113 patients were enrolled and treated between November2012 and February 2016 (supplemental Figure 1). The median follow-up was 20 months (range, 2-43 months). Seventy-three patients wererandomly assigned to receive decitabine, and 40 were randomlyassigned to receive azacitidine. The imbalance of the arms was a resultof a higher response rate seen with decitabine, which contributed to theskewed randomization. The median time from diagnosis to therapywith decitabine and azacitidine was 6 weeks (range, 1-216 weeks) and4 weeks (range, 1-271 weeks), respectively. Patient characteristicsare summarized in Table 1. Treatment arms were well-balanced forpatient and disease characteristics. The median age of the enrolledpopulation was 70 years (range, 44-84 years). The majority of patientshad MDS; 18% had therapy-related MDS, 6 (5%) had an overlapMDS/myeloproliferative neoplasm (MPN) other than CMML, and 16(14%) had CMML. One-half of patients had 2 to 3 cytopenias, and53% were transfusion dependent at enrollment. Twenty-eight percentof patients had 5% or more bone marrow blasts, and 90% of patientshad good or intermediate-risk cytogenetics by the IPSS classification.3
In both arms, most patients had intermediate 1-risk MDS by IPSS.By the MD Anderson lower-risk scoring system, most patients hadintermediate- or high-risk disease. Twenty-two patients (19% of theentire cohort) had received prior growth factors, including erythropoietin-stimulating agents (ESAs) or granulocyte colony-stimulating factor.
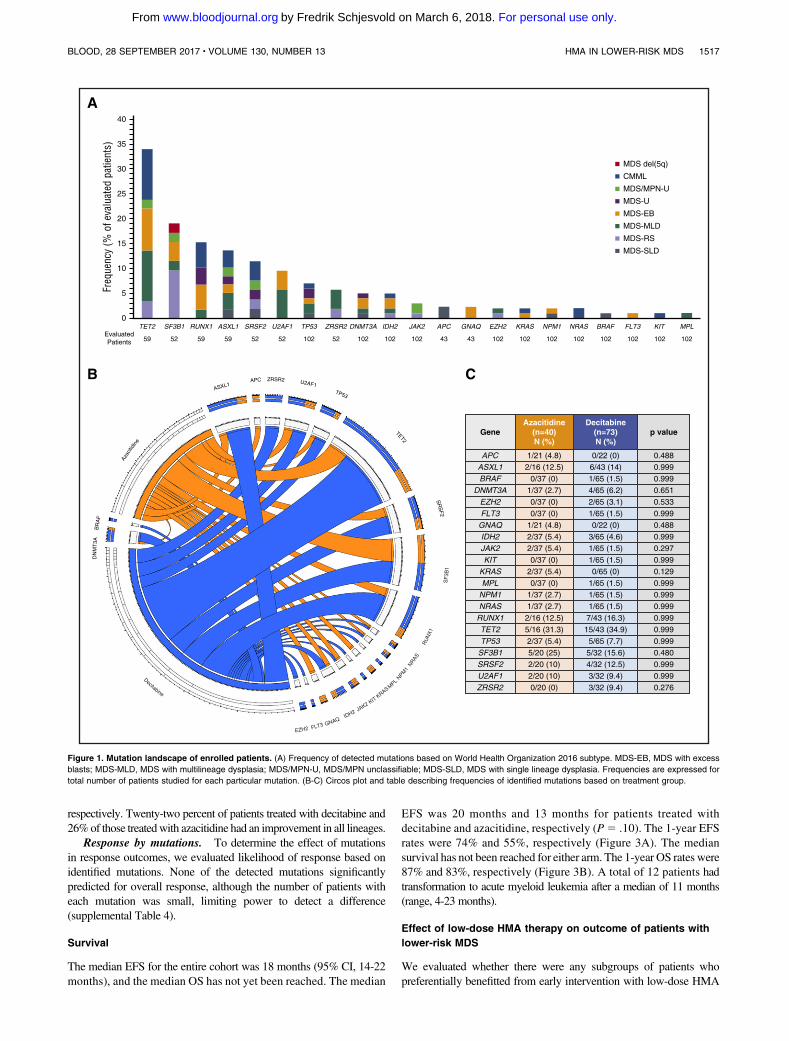
Molecular alterations
Baseline targeted next-generation sequencing was performed in 102patients (90%; 59 with the 28-gene panel, 43 with the 53-gene panel).In addition, sequencing analysis of splicing genes (SF3B1, SRSF2,U2AF1, and ZRSR2) was available in 52 patients (46%).Mutations aredetailed in Figure 1 and supplemental Table 1. A total of 64 patients(63%)hadat least 1 detectablemutation.Characteristics of patientswith
BLOOD, 28 SEPTEMBER 2017 x VOLUME 130, NUMBER 13 HMA IN LOWER-RISK MDS 1515
For personal use only. on March 6, 2018. by Fredrik Schjesvold www.bloodjournal.orgFrom

no detectable mutations are detailed in supplemental Table 2. Themedian number of detectable mutations was 1 (range, 0-4). The mostfrequently detectedmutations includedTET2 (n520/59; 34%),SF3B1(n5 10/52; 19%), RUNX1 (n5 9/59, 15%), ASXL1 (n5 8/59, 14%),and SRSF2 (n5 6/52, 12%), all present in more than 10% of evaluatedpatients. No significant differences in the distribution of mutationsin evaluated genes were observed between both treatment arms(Figure 1B-C).
Response to therapy
Overall response. One hundred nine patients (96% of enrolledpatients) received at least 2 cycles of HMAs and were evaluable forresponse (Table 2). The ORR for the entire cohort was 62% (68/109),with 37% of patients (40/109) achieving a CR. Marrow CR (mCR) wasseen in9%(10/109), andhematologic improvementwas seen in18%(20/109). Overall, 25% of patients (15/59) became transfusion independent.
The response rate after 2 cycles of therapy was 60% for decitabineand38%with azacitidine (P5 .26). TheORRwas70%with decitabineand 49%with azacitidine (P5 .03). The CR rates were similar, at 37%
and 36%, respectively (P5 .90). Hematologic improvement rateswere24% for decitabine and 8% with azacitidine. The median time to bestresponse was 2 months (range, 1-20 months). The median numberof cycles received was 9 (range, 1-41 cycles). The median duration ofresponse in both armswas 18months (range, 2-401months in patientstreated with decitabine and 2-301 in patients treated with azacitidine).No early mortality (defined as death within 6 weeks) was observed.
We evaluated whether there were any subgroups of patients,including based on age, number of cytopenias, cytogenetics, molecularmutation status, transfusion dependency, and disease risk categories,that were associated with a higher response rate within a particulartreatment arm (Figure 2). PatientswithMDS/MPN, a higher percentageof bone marrow blasts (5% and more), intermediate 1-risk diseaseby IPSS, and high-risk disease by the MD Anderson Cancer Centerlower-risk scoring were associated with significantly higher re-sponse rates in patients who received decitabine compared withazacitidine.
Transfusion independency. Atotal of 57patientswere transfusion-dependent at baseline, and therefore evaluable for transfusionresponse: 38 patients treated with decitabine and 19 with azacitidine.Overall, 32% of patients treated with decitabine became transfusionindependent compared with 16% of patients treated with azacitidine(P5 .20; Table 2).
Baseline serum erythropoietin (EPO) levels were available in 52 of72 patientswhohad a hemoglobin level lower than 10 g/dL and/orwereRBC transfusion-dependent at enrollment; 14 of these patients hadprior ESA exposure. The EPO levels and transfusion requirements ofthese 38 ESA-naive patients are shown in supplemental Table 3.
In a post hoc analysis, we attempted to correlate EPO levels witherythroid hematologic improvement. Pretreatment EPO level wasavailable on 36 patients with RBC transfusion dependency at the timeof enrollment. Nine of these patients (25%) became transfusionindependent with HMA therapy (2 in the azacitidine arm and 7 in thedecitabine arm). EPO levels were lower in those who achievedtransfusion independency (median, 108 IU/L [range, 23.5-1141 IU/L])than in thosewhodid not (median, 337.9 IU/L [range, 22.9-2684 IU/L];P 5 .11). In the subset of patients with transfusion dependency atbaseline, 16 had been treated with prior ESA. Three patients (19%)with prior ESA exposure achieved transfusion independence. TheEPO levels of these patients were 48 IU/L (decitabine), 386.9 IU/L(decitabine), and not tested (azacitidine).
Cytogenetic response. A total of 44 patients had abnormalcytogenetics at baseline and were evaluable for cytogenetic response:28 were treated with decitabine and 16 with azacitidine. A total of 18%of patients (8/44) achieved a complete cytogenetic response. Sixty-onepercent of patients treated with decitabine had at least a partialcytogenetic response, with 25% achieving a complete cytogeneticresponse. In contrast, 25% of patients (n 5 4) treated with azacitidineachieved at least a partial cytogenetic response, with 1 patient onlyachieving a complete cytogenetic response (P5 .02).
Response by bone marrow blasts ‡5% vs <5%. We assessedresponses by baseline blast percentage. Only those with at least 5%blasts can be assessed for CR and mCR, whereas those with less than5% blasts can at best have a hematologic improvement. All patientswith bone marrow blasts at least 5% treated with decitabine respondedfor an ORR of 100% compared with 36% of patients treated withazacitidine (P, .001). The CR rates were 57% and 18%, respectively,in this subset of patients.
Among patients with baseline bone marrow blast lower than5% and cytopenias, there was no difference in the rates of hemato-logic improvement: 36% and 48% of patients treated with decitabineand azacitidine had a hematologic improvement in at least 1 lineage,
Table 1. Patient characteristics
Parameter n (%)/median[range]
Overall(n 5 113)
Decitabine(N 5 73)
Azacitidine(N 5 40)
Age, years 70 [44-88] 70 [44-88] 70 [53-84]
WHO diagnosis
RCUD 15 (13) 10 (14) 5 (13)
RCMD 40 (35) 29 (40) 11 (28)
MDS with ringed
sideroblasts
3 (3) 2 (3) 1 (3)
MDS-EB 25 (22) 14 (19) 11 (28)
5q- 2 (2) 0 2 (5)
MDS-U 6 (5) 6 (8) 0
MDS/MPN-U 6 (5) 2 (3) 4 (10)
CMML 16 (14) 10 (14) 6 (15)
Therapy-related MDS 20 (18) 13 (18) 7 (18)
$2 cytopenias 68 (50) 34 (47) 22 (55)
Transfusion dependence 59 (52) 39 (53) 20 (50)
BM blasts percentage 3 [0-10] 2 [0-10] 3 [0-10]
Blasts $5% 32 (28) 21 (29) 11 (27)
Cytogenetic risk (IPSS)
Good 69 (61) 43 (63) 26 (65)
Intermediate 30 (27) 17 (23) 13 (33)
Poor 11 (10) 10 (14) 1 (3)
IPSS risk group
Low 22 (19) 16 (22) 6 (15)
Intermediate-1 91 (81) 57 (78) 34 (85)
IPSS-R risk group
Very low 14 (12) 10 (14) 4 (10)
Low 41 (36) 25 (34) 16 (40)
Intermediate 34 (30) 21 (29) 13 (33)
High 23 (20) 16 (22) 7 (18)
Very high 1 (1) 1 (1) 0
MDACC LR-MDS score
Low 13 (11) 10 (14) 3 (8)
Intermediate 52 (46) 35 (48) 14 (43)
High 48 (42) 28 (38) 20 (40)
Prior therapy
Growth factors 22 (19) 12 (16) 10 (25)
Others 9 (8) 5 (7) 4 (10)
Time from diagnosis, weeks 5 [1-271] 6 [1-216] 4 [1-271]
BM, bone marrow; MDACC, MD Anderson Cancer Center; MDS-EB, MDS with
excess blasts; MDS-U, MDS, unclassified; MPN-U, myeloproliferative neoplasm,
unclassified; RCMD, refractory cytopenia with multilineage dysplasia; RCUD,
refractory cytopenia with unilineage dysplasia; WHO, World Health Organization.
1516 JABBOUR et al BLOOD, 28 SEPTEMBER 2017 x VOLUME 130, NUMBER 13
For personal use only. on March 6, 2018. by Fredrik Schjesvold www.bloodjournal.orgFrom
respectively. Twenty-two percent of patients treated with decitabine and26%of those treatedwith azacitidine had an improvement in all lineages.
Response by mutations. To determine the effect of mutationsin response outcomes, we evaluated likelihood of response based onidentified mutations. None of the detected mutations significantlypredicted for overall response, although the number of patients witheach mutation was small, limiting power to detect a difference(supplemental Table 4).
Survival
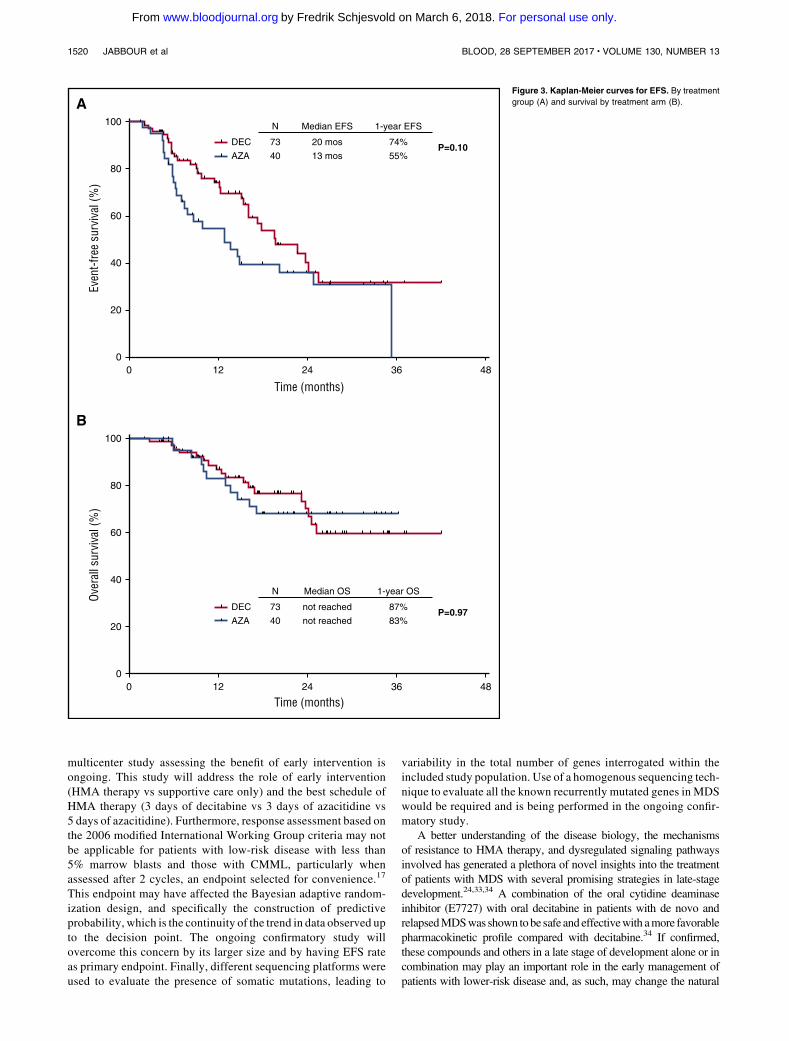
The median EFS for the entire cohort was 18 months (95% CI, 14-22months), and the median OS has not yet been reached. The median
EFS was 20 months and 13 months for patients treated withdecitabine and azacitidine, respectively (P5 .10). The 1-year EFSrates were 74% and 55%, respectively (Figure 3A). The mediansurvival has not been reached for either arm. The 1-year OS rates were87% and 83%, respectively (Figure 3B). A total of 12 patients hadtransformation to acute myeloid leukemia after a median of 11 months(range, 4-23 months).
Effect of low-dose HMA therapy on outcome of patients with
lower-risk MDS
We evaluated whether there were any subgroups of patients whopreferentially benefitted from early intervention with low-dose HMA
59EvaluatedPatients 59 5952 52 52 52102 102 102 102 43 43 102 102 102 102 102 102 102 102
0
5
10
15
20
25
30
Freq
uenc
y (%
of e
valu
ated
pat
ient
s) 35
40
TET2 SF3B1 RUNX1 ASXL1 SRSF2 U2AF1 TP53 ZRSR2 DNMT3A IDH2 JAK2 APC GNAQ EZH2 KRAS NPM1 NRAS BRAF FLT3 KIT MPL
MDS del(5q)
CMML
MDS/MPN-U
MDS-U
MDS-EB
MDS-MLD
MDS-RS
MDS-SLD
A
C
1/21 (4.8) 0/22 (0) 0.488
0.999
0.999
0.651
0.533
0.999
0.488
0.999
0.297
0.999
0.129
0.999
0.999
0.999
0.999
0.999
0.999
0.480
0.999
0.999
0.276
6/43 (14)
1/65 (1.5)
4/65 (6.2)
2/65 (3.1)
1/65 (1.5)
0/22 (0)
3/65 (4.6)
1/65 (1.5)
1/65 (1.5)
0/65 (0)
1/65 (1.5)
1/65 (1.5)
1/65 (1.5)
7/43 (16.3)
15/43 (34.9)
5/65 (7.7)
5/32 (15.6)
4/32 (12.5)
3/32 (9.4)
3/32 (9.4)
2/16 (12.5)
0/37 (0)
1/37 (2.7)
0/37 (0)
0/37 (0)
1/21 (4.8)
2/37 (5.4)
2/37 (5.4)
0/37 (0)
2/37 (5.4)
0/37 (0)
1/37 (2.7)
1/37 (2.7)
2/16 (12.5)
5/16 (31.3)
2/37 (5.4)
5/20 (25)
2/20 (10)
2/20 (10)
0/20 (0)
APC
ASXL1
BRAF
DNMT3A
EZH2
FLT3
GNAQ
IDH2
JAK2
KIT
KRAS
MPL
NPM1
NRAS
RUNX1
TET2
TP53
SF3B1
SRSF2
U2AF1
ZRSR2
GeneAzacitidine
(n=40)N (%)
Decitabine(n=73)N (%)
p value
BASXL1
APC ZRSR2 U2AF1 TP53 TET2 SR
SF
2
D
NM
T3A
B
RA
F
Aza
citid
ine
EZH2 FLT3 GNAQIDH2 JAK2
KRAS
KIT
MPL
NPM1
NRAS
RU
NX
1
SF
3B1
Decitabine
Figure 1. Mutation landscape of enrolled patients. (A) Frequency of detected mutations based on World Health Organization 2016 subtype. MDS-EB, MDS with excess
blasts; MDS-MLD, MDS with multilineage dysplasia; MDS/MPN-U, MDS/MPN unclassifiable; MDS-SLD, MDS with single lineage dysplasia. Frequencies are expressed for
total number of patients studied for each particular mutation. (B-C) Circos plot and table describing frequencies of identified mutations based on treatment group.
BLOOD, 28 SEPTEMBER 2017 x VOLUME 130, NUMBER 13 HMA IN LOWER-RISK MDS 1517
For personal use only. on March 6, 2018. by Fredrik Schjesvold www.bloodjournal.orgFrom

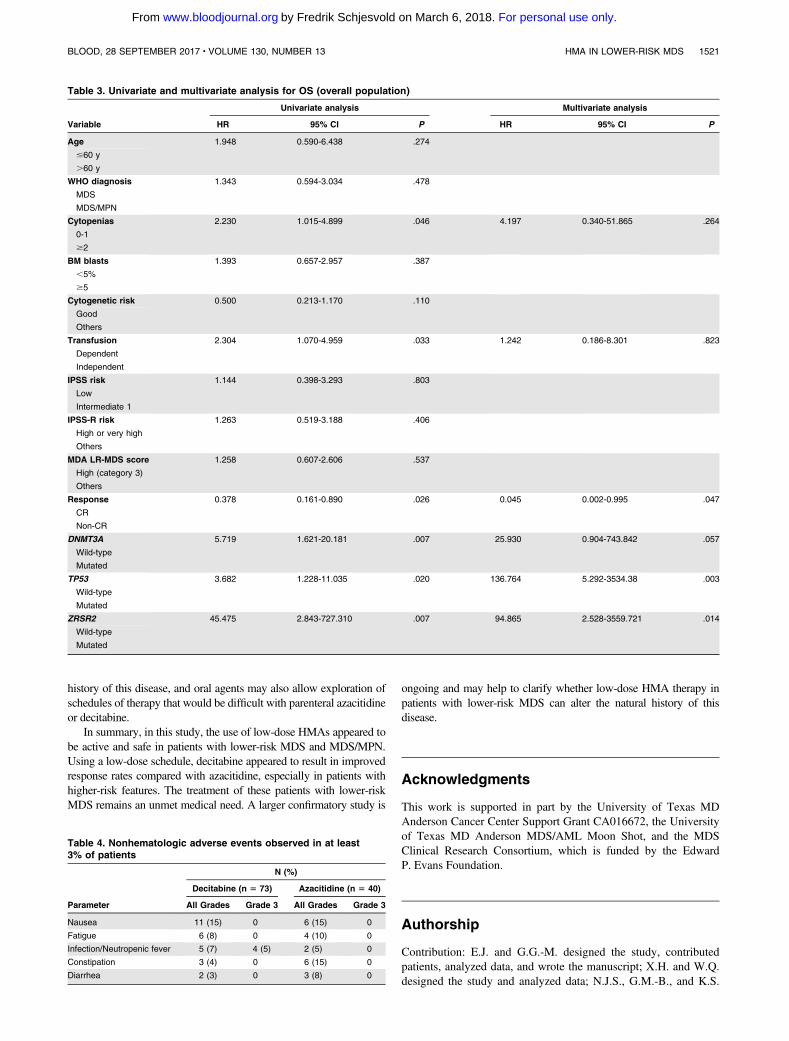
(either arm). By univariate analysis for OS, transfusion dependencebefore enrollment (4-year OS rate, 71% vs 55%; HR, 2.3 [95%CI 1.1-4.9];P5 .033) and presence of 2 or more cytopenias (4-yearOS rate, 72% vs 56%; HR, 2.2 [95% CI, 1.0-4.9]; P 5 .046]affected survival unfavorably, whereas achievement of CR affectedsurvival favorably (4-year OS rate, 78% vs 67%; HR, 0.38 [95%
CI, 0.2-0.9];P5 .026). Age group (,60 vs$60 years),WorldHealthOrganization subgroup (MDS vs MDS/MPN), bone marrow blastpercentage (,5% vs$5%), cytogenetic risk (good vs others), IPSS(low vs intermediate 1), IPSS-R (very low, low, or intermediate vshigher or very high), norMDA lower-risk prognosis scoring systemcategory (high vs others) significantly affected survival of patients.
WHO diagnosis
Cytopenia
BM blasts
Cytogenetic risk
Mutation risk
Transfusion
IPSS risk
MDA LR-MDS score
Age
Subgroup No. of Patients (%) DAC
109 (100) 49/70 (70)
11/14 (79)38/56 (68)
38/56 (64)13/14 (93)
24/36 (67)25/34 (74)
28/49 (57)21/21 (100)
33/44 (75)16/26 (62)
12/16 (75)28/41 (68)
24/37 (65)
8/14 (57)41/56 (73)
29/42 (69)20/28 (71)
25/33 (76)
19 (17)90 (83)
88 (81)21 (19)
54 (50)55 (50)
77 (71)32 (29)
70 (64)39 (36)
20 (18)68 (62)
56 (51)53 (49)
20 (18)89 (82)
47 (43)
AZA
Odds Ratio
OR 95% CI P Value P Value for Interaction
19/39 (49)
2/5 (40)17/34 (50)
17/32 (53)2/7 (29)
8/18 (44)11/21 (52)
15/28 (54)4/11 (36)
14/26 (54)5/13 (39)
1/4 (25)15/27 (56)
8/19 (42)
2/6 (33)17/33 (52)
11/20 (55)
0 0.5DAC Better AZA Better
1 1.5 2 2.5 3
11/20 (55)
8/19 (42)
0.407
0.1820.474
0.630.031
0.40.396
0.8650
0.3890.391
0.1110.58
0.394
0.3750.389
0.548
0.391
0.291
(0.181 - 0.915)
(0.020 - 1.638)(0.197 - 1.137)
(0.260 - 1.524)(0.002 - 0.420)
(0.125 - 1.275)(0.126 - 1.246)
(0.340 - 2.201)0 <0.001
(0.139 - 1.089)(0.099 - 1.535)
(0.009 - 1.395)(0.213 - 1.585)
(0.127 - 1.224)
(0.051 - 2.772)(0.158 - 0.959)
(0.183 - 1.641)
(0.119 - 1.282)
(0.085 - 0.991)
0.030
0.1280.094
0.3050.009
0.1210.113
0.865
0.0720.178
0.0890.288
0.107
0.3370.040
0.283
0.121
0.048
0.374
0.032
0.990
<0.05
0.996
0.302
0.993
0.974
0.490
62 (57)
Overall
<= 60> 60
MDS
0-1
<5%
GoodOthers
OthersAdverse
Dependent
Low
HighOthers
Intermediate-1
Independent
>=2
>=5%
MDS/MPN or CMML
Figure 2. Subgroup analysis: a forest plot showing the odds ratios for overall response of various subgroups by treatment group.
Table 2. Response
Parameter Overall, n (%) Decitabine, n (%) Azacitidine, n (%) P
Morphologic response, N 109 70 39
CR 40 (37) 26 (37) 14 (36)
mCR 8 (7) 6 (9) 2 (5)
HI 20 (18) 17 (24) 3 (8)
Overall 68 (62) 49 (70) 19 (49) .03
Transfusion response, N 57 38 19
RBC 11/46 (24) 8/29 (28) 3/17 (18)
Platelets 3/5 (60) 3/4 (75) 0/1
RBC 1 Platelets 1/6 (17) 1/5 (20) 0/1
Overall 15 (26) 12 (32) 3 (16) .2
Cytogenetic response, N 44 28 16
Complete 8 (18) 7 (25) 1 (6)
Partial 13 (30) 10 (36) 3 (19)
Overall 21 (48) 17 (61) 4 (25) .02
Morphologic response (BM blasts ‡5%), N 32 21 11
CR 14 (44) 12 (57) 2 (18)
mCR 8 (25) 6 (29) 2 (18)
HI 3 (9) 3 (14) 0
Overall 25 (78) 21 (100) 4 (36) ,.001
Hematologic response (BM blasts <5%), N 72 45 27
$1 lineage 29 (40) 16 (36) 13 (48)
All lineages 17 (24) 10 (22) 7 (26)
HI, hematologic improvement; RBC, red blood cell.
1518 JABBOUR et al BLOOD, 28 SEPTEMBER 2017 x VOLUME 130, NUMBER 13
For personal use only. on March 6, 2018. by Fredrik Schjesvold www.bloodjournal.orgFrom

In addition, mutations in DNMT3A (median OS, 13 months vs notreached [NR]; HR, 5.7 [95% CI, 1.6-20.2]; P 5 .007), TP53(median OS, 13.7 months vs NR; HR, 3.7 [95% CI, 1.2-11.0];P5 .02), and ZRSR2 (median OS, 6.8 months vs NR; HR, 45.5 [95%CI, 2.8-727.3]; P 5 .007) affected OS unfavorably (Table 3;supplemental Table 5).
By multivariate analysis for OS, achievement of CR (favorable)and presence of TP53 or ZRSR2 mutations (adverse) retained theirsignificant effect in survival (Table 3).
When evaluating LFS, achievement of a CR (4-year LFS rate of71% vs 65%; HR, 0.5 [95% CI, 0.2-0.9]; P5 .018) and mutations inDNMT3A (medianLFS, 13months vsNR;HR, 4.5 [95%CI, 1.3-15.5];P5 .018), TP53 (median LFS, 13.7 months vs NR; HR, 3.9 [95% CI,1.5-10.7];P5 .006), andZRSR2 (median LFS, 6.8months vsNR;HR,22.8 [95%CI, 2.1-251.6];P5 .011) were associated with significantlyshorter LFS by univariate analysis (supplemental Table 6). By multi-variate analysis for LFS, only DNTM3A, TP53, and ZRSR2 retainedtheir significant effect in LFS (supplemental Table 7).
Toxicity
The treatment was overall well-tolerated in both arms, with mostadverse events being of grade 1 to 2 (Table 4). Grade 3 and highernonhematologic adverse events were rare. Infection or neutropenicfever occurred in 7% and 5% of patients treated with decitabine andazacitidine, respectively. Grade 3 adverse events were rare, and nograde 4 adverse events were observed. More myelosuppression wasencountered in patients treatedwith decitabine, resulting in cycledelaysand dose reductions. Cycle delays and dose reduction were required in38% and 12% of patients treated with decitabine and 20% and 5% ofpatients treated with azacitidine. These dose or schedule modificationswere usually a result of myelosuppression.
Discussion
Outcomes of patients with lower-riskMDS are heterogeneous, rangingfrom a 4-year survival rate of 65% for patients withmore favorable riskdisease to only 7% for patients with poor-risk features.6 Some patientswith “lower risk”MDS have a survival that is inferior to patients withmetastatic breast cancer that has failed first-line therapy. Limitedtreatment options are available for these patients: HMA therapy is oftenoffered for patients with higher-risk disease, and sometimes used forlower-risk disease, but is poorly studied in the latter group.7-10 Al-logeneic stem cell transplantation can be considered for patients withhigher-risk disease and for those with lower-risk disease at the time ofprogression.24,25
Our study indicates that the use of HMA at low dose is relativelysafe, as no treatment-related early deaths or high-grade adverse eventswere encountered. Low-doseHMAtherapywas effective in this patientpopulation,withmore thanhalf the patients benefiting, a third achievinga complete response, and the vast majority being alive and event-free at1-year landmark (1-year EFS rate, 65%; 1-year survival rate, 85%).This benefit wasmore pronounced in patients with higher-risk features.In our analysis and in a multivariate setting, the achievement of CRindependently predicted for a better survival, whereas the presence ofTP53 or ZRSR2 mutations were unfavorable factors. Interestingly,neither the IPSS category nor the MDA lower-risk prognosis scoringsystem category predicted the prognostic outcomes of these HMA-treated patients. Although this may be in part because the population isskewed toward higher-risk categories (48% of patients with category
2/intermediate risk and 38% with category 3/high risk), one couldhypothesize that itmay be a result the therapy improving the outcomesof these higher-risk patients, and therefore negating the effect of theadverse biological features.
In our comparison of 2 low-dose regimens of decitabine andazacitidine, decitabine was found to be superior mainly in patients withadvanced features, including patients with at least 5% bone marrowblasts, adverse mutation profile, and higher-risk disease by the MDAnderson Cancer Center lower-risk scoring system. Decitabineinduced higher rates of overall response (70% vs 49%), transfusionindependency (32%vs16%), and cytogenetic response (61%vs25%).It should be noted that in the current study, the 2 drugs are not used atequivalent doses. Decitabine was used at two-thirds of the approveddose, whereas azacitidine was being used at lower doses (approxi-mately45%of theoriginal doseof 75mg/m2daily for 7 days).As such,the underperformance of azacitidine could be a result of the lower doseused. A 5-day regimen may improve its efficacy, mainly in patientswith higher disease burden.
Whether early intervention with low-dose HMA therapy willaffect the outcome of these patients remains to be confirmed. Eventhough promising responses were seen in these lower-risk patients,it is unknown whether this translates to meaningful changes insurvival or quality of life compared with intervening when patientshave higher-risk disease. One concern of this approach is thatHMAs are no longer available to patients at the time of diseaseprogression, although if progression is delayed by HMA treatment,that may be less of concern. Because of the nature of our tertiarycenters, patients with lower-risk MDS are usually referred afterbeing failed by supportive care or concern that they are higher riskthan suggested by the IPSS, so a comparison with historical cohortsnot treated was not possible. The skewing of this study’s patientpopulation to a relatively “higher risk” group of IPSS lower-riskpatients may also limit the generalizability of these results to thebroader population of lower-risk patients withMDS. A randomizedstudy (NCT02269280) comparing supportive care strategy withearly intervention is ongoing and will help addressing whetherHMA therapy of lower-risk patients improves survival.
Previous studies have reported the adverse prognostic effectof several genomic abnormalities in patients with lower-riskMDS.26-31Contrary to previous studies, we did not observe an adverseprognostic effect of EZH2, ASXL1, or RUNX1 mutations, but aspreviously reported, we also observed unfavorable survival outcomesin patients with TP53 and ZRSR2 mutations, although these resultsshould be interpretedwith caution, as the number of patients harboringeach of these mutations was small. In addition, the presence ofDNMT3A, TP53, and ZRSR2mutations was associated with a higherrisk for transformation into acute myeloid leukemia. Although thereare several limitations in our sequencing methodology that couldhave affected the observed outcomes, our results may suggestearly intervention and close monitoring may be justified in lower-risk patients with MDS with higher-risk mutations. New scoringsystems that take into account molecular profiling of the patientswith lower-risk disease in addition to the clinical and biologicalfeatures may better identify patients with lower-risk disease athigher risk who may benefit from early intervention with HMAtherapy.2,6,26-28,32
This study is limited by its open-label design, the small number ofpatients enrolled, and its primary endpoint being ORR. These factorsmay limit the interpretation and extrapolation of the results to the largerpopulation of adult patients with low- or intermediate 1-risk MDS.As a consequence, larger studies are needed to confirm these data andto further understand the molecular effects of the intervention. A larger
BLOOD, 28 SEPTEMBER 2017 x VOLUME 130, NUMBER 13 HMA IN LOWER-RISK MDS 1519
For personal use only. on March 6, 2018. by Fredrik Schjesvold www.bloodjournal.orgFrom
multicenter study assessing the benefit of early intervention isongoing. This study will address the role of early intervention(HMA therapy vs supportive care only) and the best schedule ofHMA therapy (3 days of decitabine vs 3 days of azacitidine vs5 days of azacitidine). Furthermore, response assessment based onthe 2006 modified International Working Group criteria may notbe applicable for patients with low-risk disease with less than5% marrow blasts and those with CMML, particularly whenassessed after 2 cycles, an endpoint selected for convenience.17
This endpoint may have affected the Bayesian adaptive random-ization design, and specifically the construction of predictiveprobability, which is the continuity of the trend in data observed upto the decision point. The ongoing confirmatory study willovercome this concern by its larger size and by having EFS rateas primary endpoint. Finally, different sequencing platforms wereused to evaluate the presence of somatic mutations, leading to
variability in the total number of genes interrogated within theincluded study population. Use of a homogenous sequencing tech-nique to evaluate all the known recurrently mutated genes in MDSwould be required and is being performed in the ongoing confir-matory study.
A better understanding of the disease biology, the mechanismsof resistance to HMA therapy, and dysregulated signaling pathwaysinvolved has generated a plethora of novel insights into the treatmentof patients with MDS with several promising strategies in late-stagedevelopment.24,33,34 A combination of the oral cytidine deaminaseinhibitor (E7727) with oral decitabine in patients with de novo andrelapsedMDSwas shown tobe safe and effectivewith amore favorablepharmacokinetic profile compared with decitabine.34 If confirmed,these compounds and others in a late stage of development alone or incombination may play an important role in the early management ofpatients with lower-risk disease and, as such, may change the natural
100
80
60
40
20
00 12 24
Time (months)
Even
t-fre
e su
rviv
al (%
)
36 48
A
100
80
60
40
20
00 12 24
Time (months)
Over
all s
urvi
val (
%)
36 48
N
73
40
87%
83%P=0.97
not reached
not reached
DEC
AZA
Median OS 1-year OS
B
N
73
40
74%
55%P=0.10
20 mos
13 mos
DEC
AZA
Median EFS 1-year EFS
Figure 3. Kaplan-Meier curves for EFS. By treatment
group (A) and survival by treatment arm (B).
1520 JABBOUR et al BLOOD, 28 SEPTEMBER 2017 x VOLUME 130, NUMBER 13
For personal use only. on March 6, 2018. by Fredrik Schjesvold www.bloodjournal.orgFrom
history of this disease, and oral agents may also allow exploration ofschedules of therapy that would be difficult with parenteral azacitidineor decitabine.
In summary, in this study, the use of low-dose HMAs appeared tobe active and safe in patients with lower-risk MDS and MDS/MPN.Using a low-dose schedule, decitabine appeared to result in improvedresponse rates compared with azacitidine, especially in patients withhigher-risk features. The treatment of these patients with lower-riskMDS remains an unmet medical need. A larger confirmatory study is
ongoing and may help to clarify whether low-dose HMA therapy inpatients with lower-risk MDS can alter the natural history of thisdisease.
Acknowledgments
This work is supported in part by the University of Texas MDAnderson Cancer Center Support Grant CA016672, the Universityof Texas MD Anderson MDS/AML Moon Shot, and the MDSClinical Research Consortium, which is funded by the EdwardP. Evans Foundation.
Authorship
Contribution: E.J. and G.G.-M. designed the study, contributedpatients, analyzed data, and wrote the manuscript; X.H. and W.Q.designed the study and analyzed data; N.J.S., G.M.-B., and K.S.
Table 3. Univariate and multivariate analysis for OS (overall population)
Variable
Univariate analysis Multivariate analysis
HR 95% CI P HR 95% CI P
Age 1.948 0.590-6.438 .274
#60 y
.60 y
WHO diagnosis 1.343 0.594-3.034 .478
MDS
MDS/MPN
Cytopenias 2.230 1.015-4.899 .046 4.197 0.340-51.865 .264
0-1
$2
BM blasts 1.393 0.657-2.957 .387
,5%
$5
Cytogenetic risk 0.500 0.213-1.170 .110
Good
Others
Transfusion 2.304 1.070-4.959 .033 1.242 0.186-8.301 .823
Dependent
Independent
IPSS risk 1.144 0.398-3.293 .803
Low
Intermediate 1
IPSS-R risk 1.263 0.519-3.188 .406
High or very high
Others
MDA LR-MDS score 1.258 0.607-2.606 .537
High (category 3)
Others
Response 0.378 0.161-0.890 .026 0.045 0.002-0.995 .047
CR
Non-CR
DNMT3A 5.719 1.621-20.181 .007 25.930 0.904-743.842 .057
Wild-type
Mutated
TP53 3.682 1.228-11.035 .020 136.764 5.292-3534.38 .003
Wild-type
Mutated
ZRSR2 45.475 2.843-727.310 .007 94.865 2.528-3559.721 .014
Wild-type
Mutated
Table 4. Nonhematologic adverse events observed in at least3% of patients
Parameter
N (%)
Decitabine (n 5 73) Azacitidine (n 5 40)
All Grades Grade 3 All Grades Grade 3
Nausea 11 (15) 0 6 (15) 0
Fatigue 6 (8) 0 4 (10) 0
Infection/Neutropenic fever 5 (7) 4 (5) 2 (5) 0
Constipation 3 (4) 0 6 (15) 0
Diarrhea 2 (3) 0 3 (8) 0
BLOOD, 28 SEPTEMBER 2017 x VOLUME 130, NUMBER 13 HMA IN LOWER-RISK MDS 1521
For personal use only. on March 6, 2018. by Fredrik Schjesvold www.bloodjournal.orgFrom
analyzed data and wrote the manuscript; C.B.-R., H.Y., and C.Z.performed pathologic and genomic analysis; T.K., G.B., N.P., Z.E.,J.C., F.R., Y.A., and H.K. contributed patients and reviewed themanuscript; and R.K., M.A.S., D.P.S., A.D., and G.R. designedthe study and reviewed the manuscript.
Conflict-of-interest disclosure: The authors declare no competingfinancial interests.
Correspondence: Elias Jabbour, Department of Leukemia, The Uni-versity of Texas MD Anderson Cancer Center, 1515 Holcombe Blvd,Box 428, Houston, TX 77030; e-mail: [email protected].
References
1. Tefferi A, Vardiman JW. Myelodysplasticsyndromes. N Engl J Med. 2009;361(19):1872-1885.
2. Bejar R, Levine R, Ebert BL. Unraveling themolecular pathophysiology of myelodysplasticsyndromes. J Clin Oncol. 2011;29(5):504-515.
3. Greenberg P, Cox C, LeBeau MM, et al.International scoring system for evaluatingprognosis in myelodysplastic syndromes. Blood.1997;89(6):2079-2088.
4. Greenberg PL, Tuechler H, Schanz J, et al.Revised international prognostic scoring systemfor myelodysplastic syndromes. Blood. 2012;120(12):2454-2465.
5. Kantarjian H, O’Brien S, Ravandi F, et al.Proposal for a new risk model in myelodysplasticsyndrome that accounts for events not consideredin the original International Prognostic ScoringSystem. Cancer. 2008;113(6):1351-1361.
6. Garcia-Manero G, Shan J, Faderl S, et al.A prognostic score for patients with lower riskmyelodysplastic syndrome. Leukemia. 2008;22(3):538-543.
7. List A, Dewald G, Bennett J, et al; MyelodysplasticSyndrome-003 Study Investigators. Lenalidomidein the myelodysplastic syndrome withchromosome 5q deletion. N Engl J Med. 2006;355(14):1456-1465.
8. Silverman LR, Demakos EP, Peterson BL, et al.Randomized controlled trial of azacitidine inpatients with the myelodysplastic syndrome: astudy of the cancer and leukemia group B. J ClinOncol. 2002;20(10):2429-2440.
9. Fenaux P, Mufti GJ, Hellstrom-Lindberg E, et al;International Vidaza High-Risk MDS SurvivalStudy Group. Efficacy of azacitidine comparedwith that of conventional care regimens in thetreatment of higher-risk myelodysplasticsyndromes: a randomised, open-label, phase IIIstudy. Lancet Oncol. 2009;10(3):223-232.
10. Kantarjian H, Issa JP, Rosenfeld CS, et al.Decitabine improves patient outcomes inmyelodysplastic syndromes: results of a phase IIIrandomized study. Cancer. 2006;106(8):1794-1803.
11. Kantarjian H, Oki Y, Garcia-Manero G, et al.Results of a randomized study of 3 schedules oflow-dose decitabine in higher-risk myelodysplasticsyndrome and chronic myelomonocytic leukemia.Blood. 2007;109(1):52-57.
12. Garcia-Manero G, Jabbour E, Borthakur G, et al.Randomized open-label phase II study ofdecitabine in patients with low- or intermediate-risk myelodysplastic syndromes. J Clin Oncol.2013;31(20):2548-2553.
13. Garcia-Manero G, Gore SD, Cogle C,et al. Phase I study of oral azacitidine inmyelodysplastic syndromes, chronicmyelomonocytic leukemia, and acute myeloidleukemia. J Clin Oncol. 2011;29(18):2521-2527.
14. Filı C, Malagola M, Follo MY, et al. Prospectivephase II study on 5-days azacitidine fortreatment of symptomatic and/or erythropoietinunresponsive patients with low/INT-1-riskmyelodysplastic syndromes. Clin Cancer Res.2013;19(12):3297-3308.
15. Thall PF, Simon RM, Estey EH. New statisticalstrategy for monitoring safety and efficacy insingle-arm clinical trials. J Clin Oncol. 1996;14(1):296-303.
16. Thall PF, Simon RM, Estey EH. Bayesiansequential monitoring designs for single-armclinical trials with multiple outcomes. Stat Med.1995;14(4):357-379.
17. Cheson BD, Greenberg PL, Bennett JM, et al.Clinical application and proposal for modificationof the International Working Group (IWG)response criteria in myelodysplasia. Blood. 2006;108(2):419-425.
18. Agresti A. Categorical Data Analysis, 2nd ed.Hoboken, NJ: John Wiley & Sons Inc.; 1990.
19. Issa JP, Garcia-Manero G, Huang X, et al.Results of phase 2 randomized study of low-dosedecitabine with or without valproic acid in patientswith myelodysplastic syndrome and acutemyelogenous leukemia. Cancer. 2015;121(4):556-561.
20. Kaplan EL, Maier P. Non-parametric estimationfrom incomplete observations. J Am Stat Assoc.1965;53(282):457-481.
21. Patel KP, Ravandi F, Ma D, et al. Acute myeloidleukemia with IDH1 or IDH2 mutation: frequencyand clinicopathologic features. Am J Clin Pathol.2011;135(1):35-45.
22. Singh RR, Bains A, Patel KP, et al. Detection ofhigh-frequency and novel DNMT3A mutations inacute myeloid leukemia by high-resolution meltingcurve analysis. J Mol Diagn. 2012;14(4):336-345.
23. Luthra R, Patel KP, Reddy NG, et al. Next-generation sequencing-based multigenemutational screening for acute myeloid leukemiausing MiSeq: applicability for diagnostics anddisease monitoring. Haematologica. 2014;99(3):465-473.
24. Garcia-Manero G. Myelodysplastic syndromes:2015 update on diagnosis, risk-stratificationand management. Am J Hematol. 2015;90(9):831-841.
25. Jabbour EJ, Garcia-Manero G, Strati P, et al.Outcome of patients with low-risk andintermediate-1-risk myelodysplastic syndromeafter hypomethylating agent failure: a report onbehalf of the MDS Clinical Research Consortium.Cancer. 2015;121(6):876-882.
26. Bejar R. Implications of molecular geneticdiversity in myelodysplastic syndromes. Curr OpinHematol. 2017;24(2):73-78.
27. Papaemmanuil E, Gerstung M, Malcovati L, et al;Chronic Myeloid Disorders Working Group ofthe International Cancer Genome Consortium.Clinical and biological implications of drivermutations in myelodysplastic syndromes. Blood.2013;122(22):3616-3627.
28. Bejar R, Stevenson KE, Caughey BA, et al.Validation of a prognostic model and theimpact of mutations in patients with lower-riskmyelodysplastic syndromes. J Clin Oncol. 2012;30(27):3376-3382.
29. Wu SJ, Kuo YY, Hou HA, et al. The clinicalimplication of SRSF2 mutation in patients withmyelodysplastic syndrome and its stability duringdisease evolution. Blood. 2012;120(15):3106-3111.
30. Makishima H, Yoshizato T, Yoshida K, et al.Dynamics of clonal evolution in myelodysplasticsyndromes. Nat Genet. 2017;49(2):204-212.
31. Damm F, Kosmider O, Gelsi-Boyer V, et al;Groupe Francophone des Myelodysplasies.Mutations affecting mRNA splicing define distinctclinical phenotypes and correlate with patientoutcome in myelodysplastic syndromes. Blood.2012;119(14):3211-3218.
32. Nazha A, Narkhede M, Radivoyevitch T, et al.Incorporation of molecular data into the RevisedInternational Prognostic Scoring System intreated patients with myelodysplastic syndromes.Leukemia. 2016;30(11):2214-2220.
33. Giagounidis A, Platzbecker U, Germing U, et al.Luspatercept treatment leads to long termincreases in hemoglobin and reductions intransfusion burden in patients with low orintermediate-1 risk myelodysplastic syndromes(MDS): preliminary results from the phase 2PACE-MDS extension study [abstract]. Blood.2015;126. Abstract 92.
34. Garcia-Manero G, Odenike O, Amrein PC,et al. Successful emulation of IV decitabinepharmacokinetics with an oral fixed-dosecombination of the oral cytidine deaminaseinhibitor (CDAi) E7727 with oral decitabine, insubjects with myelodysplastic syndromes (MDS):final data of phase 1 study [abstract]. Blood. 2016;128. Abstract 114.
1522 JABBOUR et al BLOOD, 28 SEPTEMBER 2017 x VOLUME 130, NUMBER 13
For personal use only. on March 6, 2018. by Fredrik Schjesvold www.bloodjournal.orgFrom

online August 3, 2017 originally publisheddoi:10.1182/blood-2017-06-788497
2017 130: 1514-1522
Garcia-ManeroSekeres, David P. Steensma, Amy DeZern, Gail Roboz, Hagop Kantarjian and Guillermo Sasaki, Zeev Estrov, Jorge Cortes, Farhad Ravandi, Yesid Alvarado, Rami Komrokji, Mikkael A.Wei Qiao, Hui Yang, Chong Zhao, Tapan Kadia, Gautam Borthakur, Naveen Pemmaraju, Koji Elias Jabbour, Nicholas J. Short, Guillermo Montalban-Bravo, Xuelin Huang, Carlos Bueso-Ramos, azacitidine in lower-risk MDS and MDS/MPNRandomized phase 2 study of low-dose decitabine vs low-dose
http://www.bloodjournal.org/content/130/13/1514.full.htmlUpdated information and services can be found at:
(1796 articles)Myeloid Neoplasia (4923 articles)Free Research Articles
(4715 articles)Clinical Trials and Observations Articles on similar topics can be found in the following Blood collections
http://www.bloodjournal.org/site/misc/rights.xhtml#repub_requestsInformation about reproducing this article in parts or in its entirety may be found online at:
http://www.bloodjournal.org/site/misc/rights.xhtml#reprintsInformation about ordering reprints may be found online at:
http://www.bloodjournal.org/site/subscriptions/index.xhtmlInformation about subscriptions and ASH membership may be found online at:
Copyright 2011 by The American Society of Hematology; all rights reserved.of Hematology, 2021 L St, NW, Suite 900, Washington DC 20036.Blood (print ISSN 0006-4971, online ISSN 1528-0020), is published weekly by the American Society
For personal use only. on March 6, 2018. by Fredrik Schjesvold www.bloodjournal.orgFrom