ranking configurations of shading devices by its thermal and...
TRANSCRIPT
PLEA2013 - 29th Conference, Sustainable Architecture for a Renewable Future, Munich, Germany 10-12 September 2013
Ranking Configurations of Shading Devices by Its Thermal
and Luminous Performance
KAMILA MENDONÇA DE LIMA1, LEONARDO SALAZAR BITTENCOURT
2, ROSANA
MARIA CARAM3
1,3
Instituto de Arquitetura e Urbanismo, Universidade de São Paulo, São Carlos, Brasil
2Faculdade de Arquitetura e Urbanismo, Universidade Federal de Alagoas, Maceió, Brasil
ABSTRACT: This paper evaluates the thermal and luminous performance of different louver configurations on an office
room model located in Maceió-AL (Brazil), ranking the alternatives in a way that leads to choices for alternatives with
potential balanced performance. Parametric analyses were done, based on computer simulations on software Troplux
5 and DesignBuilder 2. The variables examined were number of slats, slat slope and slat reflectance, considering the
window facing North, South, East and West and a fixed shading mask for each orientation. Results refer to internal
average illuminance and solar heat gains through windows. It was observed that configurations of shading devices
with the same shading mask may have different luminous and thermal performance. The alternatives were ranked, so
the information here produced has the potential to support decisions on designing shading devices in practice.
Keywords: Shading devices; Solar control; Daylighting; Computer simulation; Early design
INTRODUCTION Shading is a key bioclimatic strategy on hot and humid
climates. In these regions, shading devices design must
achieve a balance between daylighting and thermal
requirements. Some authors have shown that a proper
selection of properties and geometry of the shading
device can lead to a balanced performance, by
combining experimental studies and computer
simulations [1] or addressing coefficients for thermal
and luminous performance by dynamic simulations [2].
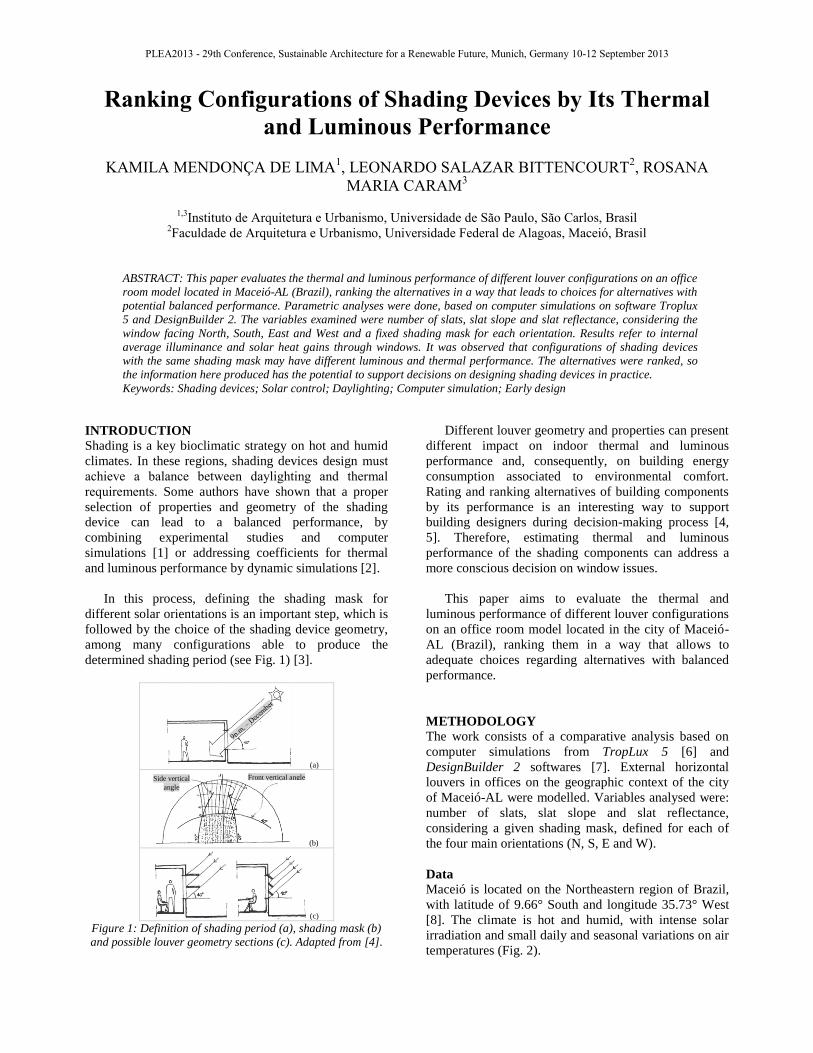
In this process, defining the shading mask for
different solar orientations is an important step, which is
followed by the choice of the shading device geometry,
among many configurations able to produce the
determined shading period (see Fig. 1) [3].
(a)
(b)
(c)
Figure 1: Definition of shading period (a), shading mask (b)
and possible louver geometry sections (c). Adapted from [4].
Different louver geometry and properties can present
different impact on indoor thermal and luminous
performance and, consequently, on building energy
consumption associated to environmental comfort.
Rating and ranking alternatives of building components
by its performance is an interesting way to support
building designers during decision-making process [4,
5]. Therefore, estimating thermal and luminous
performance of the shading components can address a
more conscious decision on window issues.
This paper aims to evaluate the thermal and
luminous performance of different louver configurations
on an office room model located in the city of Maceió-
AL (Brazil), ranking them in a way that allows to
adequate choices regarding alternatives with balanced
performance.
METHODOLOGY The work consists of a comparative analysis based on
computer simulations from TropLux 5 [6] and
DesignBuilder 2 softwares [7]. External horizontal
louvers in offices on the geographic context of the city
of Maceió-AL were modelled. Variables analysed were:
number of slats, slat slope and slat reflectance,
considering a given shading mask, defined for each of
the four main orientations (N, S, E and W).
Data
Maceió is located on the Northeastern region of Brazil,
with latitude of 9.66° South and longitude 35.73° West
[8]. The climate is hot and humid, with intense solar
irradiation and small daily and seasonal variations on air
temperatures (Fig. 2).
Front vertical angle Side vertical
angle

Figure 2: Insolation and air temperature data for Maceió-AL.
Source: Test Reference Year weather data file (Available in
[9]) on DesignBuilder 2.
Based on the solar chart for this location, the shading
devices were dimensioned following a fixed shading
mask for each orientation. Figure 3 and Table 1 register
the cut-off angle determined according to a methodology
[10] where the shading period is defined considering
acceptable limits regarding thermal comfort, expressed
on data plotted over the solar chart. For the studied
cases, this limit refers to when mensal mean air
temperature is at least 2°C above the neutral temperature
(a concept described by Auliciems [11]), and global
solar irradiation incident on the facade is above
600W/m2.
N S
E W
Figure 3: Shading mask (transparent grey colored cover) for
the four examined orientations. Source: Adapted from [12].
Table 1 – Cut-off angles correspondent to the shading masks.
Orientation Vertical Horiz. Right
Horiz. Left
Side
Right
Side
Left
N 50° - 50° 65° -
S 70° 65° - - 50°
E 15° - - 60° 60°
W 10° - - 20° 40°
The dimensions of the studied room are 5m x 6m x
3m, with a window of 5m x 1m (dimensions that are
coherent with existing office buildings in Maceió-AL).
The scenarios simulated on both software correspond to
the parameters presented on Table 2. In order to achieve
the shading masks where it would be needed vertical
shading or lateral extension, an auxiliary single slat was
modelled, with fixed properties (Fig. 4). The thicknesses
of the slats were ignored.
The code for naming the louver configurations is
formed by the first letter of the name of each parameter
(Number of louvers, Slope, Reflectance), followed by
the numeral correspondent to the value on the used
metrics (dimensionless for the number of louvers and
reflectance and degrees for slope). On East and West
orientations, some cases were not simulated for thermal
performance (N2S0R0,8, N2S0R0,8, on both
orientations; N4S0R0,8 and N4S0R0,8, on East), since
the used software only accepts slat up to 1.0m. For
visualization of possible tendencies, these situations
were maintained on luminous analysis. On final ranking,
all case scenarios with horizontal slats for East and West
orientations were not considered due to the fact that they
would correspond to unpractical dimensions in reality.
Table 2: Combination of parameters examined
Orientation
of window
No
shading Shading by louvers
North,
South, East
e West
Reference
room
Number of
slats
Slat slope1
(°)
Slat
reflectance
2; 4; 8 0; 30; 45;
60 0.5; 0,8
1- Angle between the slat plan and the normal to façade.
Figure 4: Room with louvers (Case scenario N4S0R0,8)
Input data are described on tables 3 and 4. The
software TropLux uses Monte Carlo approach, ray
tracing and daylight coefficients [13]. The software
DesignBuilder has an interface for the EnergyPlus
simulation engine [14], which simulates energy flows on
buildings.
Table 3: Model input on TropLux.
Location Maceió-AL (available on the software)
Workplane 0,75m from floor
Points Orthogonal grid of 30 points
Error 5%
Period 8a.m. to 6p.m., all year
Sky conditions CIE sky types 1,10 and 14 [15]
External
horizontal
illuminance
Data from Illuminating Engineering
Society of North America – IES (available
on the software)
Glazing Clear 3mm (available on the software)
Refletances floor=0.4, ceiling=0.7, walls=0.6
20
22
24
26
28
0
100
200
300
jan feb mar apr mai jun jul ago sep oct nov dec
°C
kWh
Direct Normal SolarDiffuse Horizontal SolarOutside Dry-bulb temperatureNeutral temperature (Auliciems, 1982)
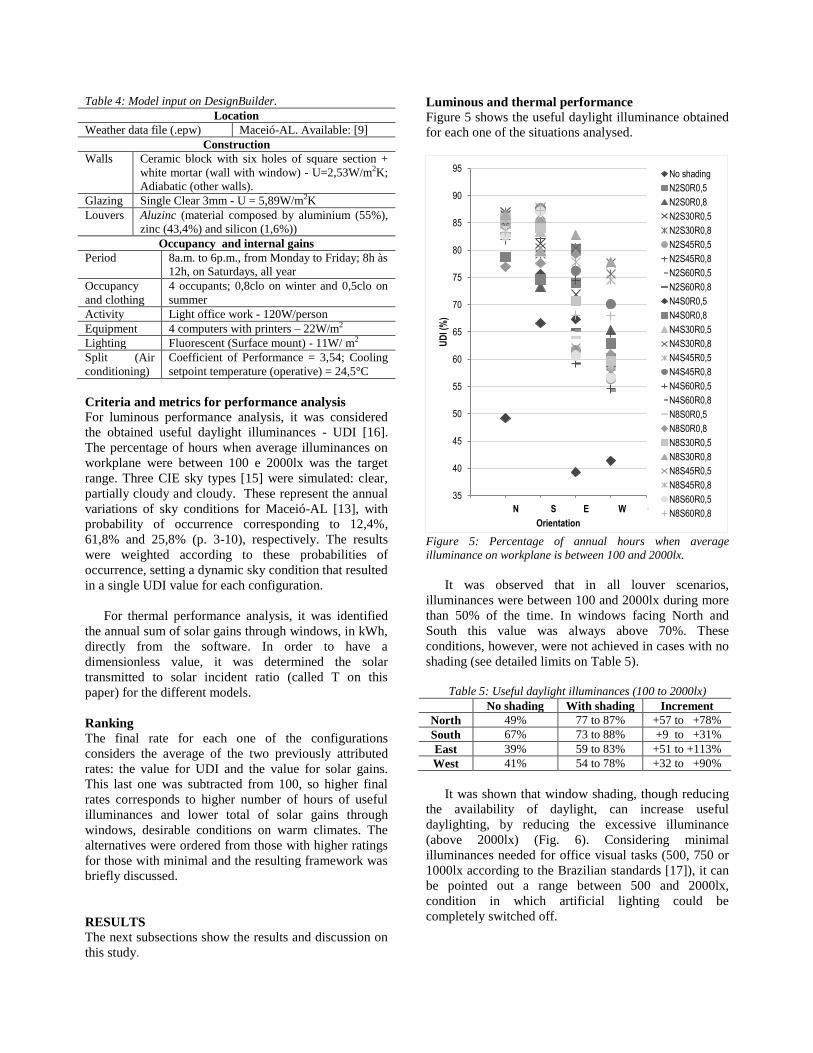
Table 4: Model input on DesignBuilder.
Location
Weather data file (.epw) Maceió-AL. Available: [9]
Construction
Walls Ceramic block with six holes of square section +
white mortar (wall with window) - U=2,53W/m2K;
Adiabatic (other walls).
Glazing Single Clear 3mm - U = 5,89W/m2K
Louvers Aluzinc (material composed by aluminium (55%),
zinc (43,4%) and silicon (1,6%))
Occupancy and internal gains
Period 8a.m. to 6p.m., from Monday to Friday; 8h às
12h, on Saturdays, all year
Occupancy
and clothing
4 occupants; 0,8clo on winter and 0,5clo on
summer
Activity Light office work - 120W/person
Equipment 4 computers with printers – 22W/m2
Lighting Fluorescent (Surface mount) - 11W/ m2
Split (Air
conditioning)
Coefficient of Performance = 3,54; Cooling
setpoint temperature (operative) = 24,5°C
Criteria and metrics for performance analysis
For luminous performance analysis, it was considered
the obtained useful daylight illuminances - UDI [16].
The percentage of hours when average illuminances on
workplane were between 100 e 2000lx was the target
range. Three CIE sky types [15] were simulated: clear,
partially cloudy and cloudy. These represent the annual
variations of sky conditions for Maceió-AL [13], with
probability of occurrence corresponding to 12,4%,
61,8% and 25,8% (p. 3-10), respectively. The results
were weighted according to these probabilities of
occurrence, setting a dynamic sky condition that resulted
in a single UDI value for each configuration.
For thermal performance analysis, it was identified
the annual sum of solar gains through windows, in kWh,
directly from the software. In order to have a
dimensionless value, it was determined the solar
transmitted to solar incident ratio (called T on this
paper) for the different models.
Ranking The final rate for each one of the configurations
considers the average of the two previously attributed
rates: the value for UDI and the value for solar gains.
This last one was subtracted from 100, so higher final
rates corresponds to higher number of hours of useful
illuminances and lower total of solar gains through
windows, desirable conditions on warm climates. The
alternatives were ordered from those with higher ratings
for those with minimal and the resulting framework was
briefly discussed.
RESULTS
The next subsections show the results and discussion on
this study.
Luminous and thermal performance
Figure 5 shows the useful daylight illuminance obtained
for each one of the situations analysed.
Figure 5: Percentage of annual hours when average
illuminance on workplane is between 100 and 2000lx.
It was observed that in all louver scenarios,
illuminances were between 100 and 2000lx during more
than 50% of the time. In windows facing North and
South this value was always above 70%. These
conditions, however, were not achieved in cases with no
shading (see detailed limits on Table 5).
Table 5: Useful daylight illuminances (100 to 2000lx)
No shading With shading Increment
North 49% 77 to 87% +57 to +78%
South 67% 73 to 88% +9 to +31%
East 39% 59 to 83% +51 to +113%
West 41% 54 to 78% +32 to +90%
It was shown that window shading, though reducing
the availability of daylight, can increase useful
daylighting, by reducing the excessive illuminance
(above 2000lx) (Fig. 6). Considering minimal
illuminances needed for office visual tasks (500, 750 or
1000lx according to the Brazilian standards [17]), it can
be pointed out a range between 500 and 2000lx,
condition in which artificial lighting could be
completely switched off.
35
40
45
50
55
60
65
70
75
80
85
90
95
0 1 2 3 4 5
UD
I (%
)
Orientation
No shading
N2S0R0,5
N2S0R0,8
N2S30R0,5
N2S30R0,8
N2S45R0,5
N2S45R0,8
N2S60R0,5
N2S60R0,8
N4S0R0,5
N4S0R0,8
N4S30R0,5
N4S30R0,8
N4S45R0,5
N4S45R0,8
N4S60R0,5
N4S60R0,8
N8S0R0,5
N8S0R0,8
N8S30R0,5
N8S30R0,8
N8S45R0,5
N8S45R0,8
N8S60R0,5
N8S60R0,8 N S E W

Figure 6: Useful daylight illuminances (All ranges)
According to the results, this condition is possible
with the window facing North or South, on until 66% of
annual occupied hours (Table 6). On East and West,
although the addition of louvers can result in a poor
luminous performance, it is also possible to increase the
useful daylight in comparison to the case without
shading. The best scenarios will be shown on the
ranking topic.
Table 6: Modified useful daylight illuminance (500 to 2000lx)
No shading With shading Increase
North 40% 40 to 59% 0 to +48%
South 58% 53 to 66% -9 to +14%
East 31% 0 to 47% -100 to +52%
West 33% 0 to 35% -100 to +6%
Concerning thermal performance, Figure 7 shows the
results obtained for the analyzed louver configurations.
Figure 7: Annual solar gains through windows
It was observed that the choice on the number of
slats presents very little influence on the solar gains (as
already discussed in [18]). The increase in slats slope,
reduces these gains. Comparing the cases with and
without shading, naturally the shaded scenarios decrease
the solar gains. This reduction was more significant on
West orientation (90%) and less significant on South
orientation (13%), as seen in Table 7. The consequent
reduction on cooling energy consumption can be seen in
Table 8.
Table 7: Solar trans to incident solar ratio
No shading With shading Increase
North 66% 32 to 49% -52 to -26%
South 63% 44 to 55% -30 to -13%
East 69% 9 to 42% -87 to -39%
West 70% 7 to 43% -90 to -39%
Comparing the results for the different orientations,
it was observed that when the window with louvers is
facing North or South the values for daylight availability
and solar gains are greater than those on orientations
East and West. As the shading mask for the analyzed
location was defined taking into consideration thermal
criteria, obstruction on windows facing these last two
orientations were very restrictive. Without shading they
would present higher values.
Table 8 shows the cooling and lighting annual
energy consumption of the simulated room. For the
purpose of comparison, both systems were assumed as
being switched on all the time (i.e. without considering
the participation of daylight or natural ventilation). In
this way, it was possible to estimate the participation of
thermal and lighting loads on total energy consumption.
It was observed that the air conditioning energy
consumption is greater than lighting consumption, in a
proportion of 60/40.
Table 8: Room annual energy consumption (kWh)
End use Orientation No shading With shading
Cooling
North 1626,8 1330,0 to 1464,2
South 1494,7 1348,4 to 1409,1
East 1706,6 1221,6 to 1477,0
West 2192,4 1328,1 to 1791,7
Lighting All 926,64
Sum
North 2553,4 2256,6 to 2390,8
South 2421,3 2275,0 to 2335,7
East 2633,2 2148,2 to 2403,6
West 3119,0 2254,7 to 2718,3
Thus, the final rates for each configuration analyzed
were attributed considering a weighting of indexes (Eq.
1), as an attempt to reflect the approximate verified
proportion.
FINAL RATE= [UDI+1.5*(100-T)]/2.5 (Eq.1)
Where:
0
20
40
60
80
100
An
nu
al H
ou
rs (%
) Insufficient Useful 100-500 lux Useful 500-2000 lux Excessive
5
10
15
20
25
30
35
40
45
50
55
60
65
70
75
0 1 2 3 4 5
sola
r tr
ans
to s
ola
r in
cid
ent r
atio
(%
)
Orientation
No shading
N2S0R0,5
N2S0R0,8
N2S30R0,5
N2S30R0,8
N2S45R0,5
N2S45R0,8
N2S60R0,5
N2S60R0,8
N4S0R0,5
N4S0R0,8
N4S30R0,5
N4S30R0,8
N4S45R0,5
N4S45R0,8
N4S60R0,5
N4S60R0,8
N8S0R0,5
N8S0R0,8
N8S30R0,5
N8S30R0,8
N8S45R0,5
N8S45R0,8
N8S60R0,5
N8S60R0,8
N S E W

UDI = percentage of hours when average illuminance on
workplane is between 100 e 2000lx
T = solar transmitted to solar incident ratio
Ranking
The ranking of louver alternatives studied is shown in
figures 8,9, 10 and 11.
Figure 8 – Ranking louvers with window facing North
Figure 9: Ranking louvers with window facing South
With the window facing North, the best case
scenarios were those with medium reflectance (0,5).
This is the orientation with more insolation time on the
analyzed city (as seen on solar chart from Figure 3), it
being possible to reach the target illuminance range even
with the presence of louvers. The medium reflective
slats, as potentially enables enough daylight availability
with less solar gains than those alternatives with high
reflectance, presented more favorable balanced results
for this orientation. The best scenarios with window
facing South were those with slat slope equals to 60°
and medium reflectance, followed by those cases with
slat slope equals to 45° and medium reflectance.
Figure 10: Ranking louvers with window facing East
Figure 11: Ranking louvers with window facing West
On orientations East (Fig. 10) and West (Fig.11), the
cases where the slats are sloped 45° presented the worst
performances. This intermediate status do not prioritizes
neither higher illuminances (such as the cases with
lower slat slopes that allows more daylight into the
room) nor the solar gains protection (such as the cases
with higher slopes). The best rates were obtained by the

configurations with slats sloped 30° in the East oriented
facade and sloped 30° or 60° in the West one, depending
on the color (reflectance) considered. If is intended to
design horizontal louvers for more than one orientation,
maintaining an uniform geometry, louvers with eight
medium reflective slats and sloped 60° can be used, as
they presented good rates for all orientations. It can also
be noted that configurations with the best thermal
performance tended to be those with the best balanced
performance, as a consequence of the weight attributed
to this aspect. It was observed a good trade-off between
thermal and lighting requirements, on North and South
orientations. In East and West oriented facades, a
balance is harder to achieve considering the louver
solutions analyzed (not movable). As mentioned earlier,
their sun exposure condition in the studied location
demands restrictive shading masks.
This work, by comparing shading devices
configurations, is a contribution to the decision-making
processes on architectural design aiming to achieve
environmental comfort and low energy consumption. It
is worth remembering that in addition to observing
tendencies, it is important to consider the specificities of
each design context.
CONCLUSION
The conclusions of this work are summarized below:
(a) Louvers with the same shading mask may present
different thermal and luminous performances.
(b) It is possible to achieve useful illuminances
(between 100 and 2000lx) in the studied office room
with any of the louver configurations analyzed, at least
in 50% of the annual occupied hours. By reducing
excessive illuminances, all shaded scenarios presented
better performance than the unshaded condition.
(c) It is possible to reduce the amount of solar
irradiation transmitted through the window by 13% to
90% in comparison to the unshaded condition.
(d) The best ranked louver alternatives include: with
window facing North, all those with medium
reflectance; with window facing South, those with slats
sloped 60°; on East and West, those with lower slope.
(e) Among the case scenarios analyzed, the louver
configurations that presented a good final performance
in all orientations were those with medium reflectance
and slat slope equals to 60°.
REFERENCES 1. Pereira, F.O.R., (1992). Luminous and thermal performance
of window shading and sunlighting reflecting devices. PhD
Thesis, University of Sheffield, School of Architectural
Studies.
2. David, M. et al., (2011). Assessment of the thermal and
visual efficiency of solar shades. Building and Environment,
46 (7): pp. 1489–1496.
3. Bittencourt, L.S., (2004). Uso das cartas solares: diretrizes
para arquitetos, 4th edition, Maceió: EDUFAL.
4. Roulet, C.A. et al., (2002). ORME: A multicriteria rating
methodology for buildings. Building and Environment, 37 (6):
pp. 579-586.
5. Kolokotsa, D. et al., (2009) Decision support methodologies
on the energy efficiency and energy management in buildings.
Advances in Building Energy Research, 3 (1): pp.121-146.
6. Cabús, R.C., (2011) TropLux, version 5.00.10.
7. Designbuilder Software Ltda., (2000-2009). DesignBuilder,
version 2.4.2.026.
8. Instituto Brasileiro de Geografia e Estatística. Cidades@:
Maceió-AL, [Online], Available: http://www.ibge.gov.br/cida
desat/painel/painel.php?codmun=270430. [07 June 2012].
9. Laboratório de Eficiência Energética em Edificações, (2011)
Arquivos climáticos, [Online], Available: http://www.labeee.
ufsc.br/downloads/arquivos-climaticos [18 Nov 2011].
10. Pereira, I.; Souza, R. V. G. (2008). ‘Proteção solar em
edificações residenciais e comerciais: desenvolvimento de
metodologia’, Encontro Nacional de Tecnologia do Ambiente
Construído, ENTAC, Fortaleza, CD-ROM.
11. Auliciems, A. (1982). Psycho-Physiological Criteria for
Global Thermal Zones of Building Design. In Proc. of Intern.
Biometeorology Congress in Journal of Biometeorology,
supplement to vol.26, 1982. Apud Bittencourt, L. S., (1993).
Ventilation as a Cooling Resource for Warm-Humid Climates:
An Investigation on Perforated Block Wall Geometry to
Improve Ventilation Inside Low-Rise Buildings. PhD Thesis,
Architectural Association Graduate School.
12. Laboratório de Conforto Ambiental e Eficiência
Energética, (2013). Softwares de Conforto: Cartas Solares
Cad, [Online], Available: http://www.usp.br/fau/pesquisa/labo
ratorios/labaut/conforto/ [13 Jul 2013].
13. Cabús, R.C., (2002). Tropical daylighting: predicting sky
types and interior illuminance in north-east Brazil., PhD
Thesis, University of Sheffield, School of Architectural
Studies.
14. U.S. Department of Energy, (2013). EnergyPlus Energy
Simulation Software, [Online], Available: http://apps1.eere.en
ergy.gov/buildings/energyplus/ [02 May 2013].
15. Commission Internationale de l'Eclairage – CIE, (2003).
CIE S 011.2/E:2003: Spatial distribution of daylight - CIE
standard general sky, Vienna: CIE Central Boureau.
16. Nabil, A; Mardaljevic, J., (2006) Useful daylight
illuminances: A replacement for daylight factors. Energy and
Buildings, 38 (7): pp. 905–913.
17. Associação Brasileira de Normas Técnicas – ABNT,
(1992). NBR 5413: Iluminância de interiores, Rio de Janeiro.
18. Lima, K.M.; Bittencourt, L.S., (2012). ‘Efeito do
espaçamento, inclinação e refletância de brises horizontais
com mesma máscara de sombra na iluminação natural e
ganhos térmicos em escritórios em Maceió-AL’. XIV Encontro
Nacional de Tecnologia do Ambiente Construído, ENTAC,
Juiz de Fora, pp. 3596-3604.
ACKNOWLEDGEMENTS
The authors thank FAPESP (Fundação de Amparo à
Pesquisa do Estado de São Paulo) and CAPES
(Coordenação de aperfeiçoamento de pessoal de nível
superior) for the financial support in different stages of
this research.