ranzi et al, 2010 - glims · and mass balance of the mandrone glacier (adamello, central alps). (it...
TRANSCRIPT
45
ABSTRACT: RANZI R., GROSSI G., GITTI A. & TASCHNER S., Energyand mass balance of the Mandrone glacier (Adamello, Central Alps). (ITISSN 0391-9838, 2010).
The Adamello Glacier is the largest glacierised area in the ItalianAlps and consists of five hydrographic units, the major in size being theMandrone Glacier which covered an area of 13.38 km2 in June 2003.
In order to assess the yearly mass balance of the Mandrone Glacierthe PDSLIM energy-balance model was applied: it is a seasonal snow-pack model, adapted to glaciers and based on a distributed physically-based two-layer snow and ice scheme. In this paper the investigated area,the model and the hydrometeorological data used in input to the modeland for its verification are described. On a large scale, the accuracy of themodel in simulating the retreat of the snow covered areas during the meltseason is verified through comparison with remote images, resulting in a86% correspondence of observed snow-covered pixels. Downstreamrunoff measurements at the outlet of the Sarca di Genova basin at thePonte Maria station were used as a term of comparison of the simulatedsummer melt. Runoff volumes measured over a twelve year period (1995-2006) were used to validate the simulation of the glacier’s melt, resultingin a correlation coefficient of 0.83.
The mean annual mass balance of the Mandrone Glacier over the1995-2006 period results in an average water equivalent net loss of 1290mm a-1, with a maximum value of 319 mm for the 2000/01 balance yearand a minimum value of –3050 mm for the 2002/03 year.
KEY WORDS: Glacier retreat, Mass balance, Energy balance, Man-drone Glacier, Southern Central Alps.
RIASSUNTO: RANZI R., GROSSI G., GITTI A. & TASCHNER S., Bilancioenergetico e di massa del Ghiacciaio del Mandrone (Adamello, Alpi Cen-trali). (IT ISSN 0391-9838, 2010).
Il ghiacciaio dell’Adamello, l’area glacializzata più estesa della AlpiItaliane, consiste di cinque unità idrografiche, la più grande della quali èil ghiacciaio del Mandrone che ricopriva una superficie di 13.38 km2 nelgiugno del 2003.
Al fine di valutare il bilancio di massa annuale del ghiacciaio delMandrone, è stato applicato il modello di bilancio energetico PDSLIM:un modello stagionale di bilancio energetico e di massa del manto nevosoe delle superfici glaciali, di tipo distribuito e che suddivide il manto nevo-so ed i ghiaccio in due strati. In questa memoria vengono descritti il mo-dello di bilancio energetico e il sistema di monitoraggio idrometeorologi-co utilizzato per le simulazioni e la loro verifica. A grande scala, dal con-fronto dell’estensione del manto nevoso simulata dal modello con quellaclassificata da immagini satellitari è risultata una corrispondenzadell’86%. I volumi di deflusso misurati alla sezione di chiusura del baci-no del Sarca di Genova alla stazione di Ponte Maria per un periodo didodici anni (1995-2006) sono stati utilizzati per verificare la simulazionedella fusione del ghiacciaio. Il confronto dei volumi di deflusso con la fusione del ghiacciaio ha dato buoni risultati, con coefficiente di correla-zione pari a 0.83.
Il bilancio di massa medio annuo del ghiacciaio del Mandrone nelperiodo 1995-2006 denuncia una perdita media netta di equivalente inacqua di 1290 mm a-1, con valori di bilancio di massa compresi tra ilmassimo di 319 mm per l’anno 2000/01 ed il minimo di –3050 mm perl’anno 2002/03.
TERMINI CHIAVE: Ritiro dei ghiacciai, Bilancio di massa, Bilancioenergetico, Ghiacciaio del Mandrone, Alpi Centrali.
INTRODUCTION
In the last decades a great attention has been devotedto the analysis of the global climate and the potential im-pact of its change on the hydrosphere and the cryosphere(IPCC, 2007). Glacial retreat, observed worldwide sincethe first decades of the 19th century at the end of the LittleIce Age, together with its recent acceleration (WGMS,2008; Paul & alii, 2004), is one of the most remarkablesigns of global warming. In most cases a variation in thephysical characteristics (e.g. area, thickness, radiative pro-
Geogr. Fis. Dinam. Quat.33 (2010), 45-60, 15 figg., 3 tabb.
ROBERTO RANZI (*), GIOVANNA GROSSI (*), ALESSANDRO GITTI (*) & STEFAN TASCHNER (*)
ENERGY AND MASS BALANCE OF THE MANDRONE GLACIER(ADAMELLO, CENTRAL ALPS)
(*) Università di Brescia, Dipartimento di Ingegneria Civile, Ar-chitettura, Territorio e Ambiente, Via Branze 43 - 25123 Brescia, [email protected]
This research was funded by the University of Brescia through thegrant MURST ex 60% 2001-2008 «Monitoring of Glaciers», by the PRIN2008 grant and by Fondazione CARIPLO within the research project«CARIPANDA» coordinated by Parco dell’Adamello. Parco Adamello-Brenta is gratefully acknowledged for having authorised the installation ofthe meteorological station of the University of Brescia at Passo della LobbiaAlta. Meteorological and runoff data were available thanks to ENEL, Me-teotrentino, Provincia Autonoma di Trento (Servizio Opere Idrauliche) andArpa Lombardia. Several students and alpine guides contributed to the fieldcampaigns: their enthusiam and help motivated and supported our work. R.Ceschini and A. Collini are thanked for their logistic and moral supportduring our eight year long field surveys.
Two anonymous reviewers are thanked for their comments.
46
perties, water content, temperature, debris cover) of aglacier is an index of a changing climate, as clearly indicat-ed by conceptual models and supported by measurementsreported in several studies (see for example Kuhn, 1979;Ohmura & alii, 1992). This is one of the reasons for an in-creasing interest in the monitoring and modelling of glaci-er dynamics worldwide and on the documentation of “sig-natures” of global warming that can result from investiga-tions on the cryosphere.
Focusing on the Southern Alps, a retreat of the ItalianAlpine glaciers has been observed on average since the be-ginning of the 1980s (Santilli & alii, 2002; Baroni & Car-ton, 1990; Calmanti & alii, 2007), at a greater velocity inthe eastern and central areas than in the western area. Ter-minus fluctuations show that Italian Alpine glaciers under-went a generalised retreat during the 20th century with onereadvance episode in the 1970s and a poorly documentedone around the early 1920s (Citterio & alii, 2007). Massbalances evaluated through the glaciological method (Ka-ser & alii, 2003), have been estimated in Italy systematical-ly since 1967 on the Caresèr Glacier (Zanon, 1992; Giada& Zanon, 1996) and are still performed there today (Car-turan & Seppi, 2007). For other mid-size glaciers, some ofthem close to the Adamello group, shorter time series areavailable (see e.g. Diolaiuti & alii, 2002, Kaser & alii, 1995).
The objective of this study is to assess the mass balanceof the largest glacierised area of the Southern Alps: theAdamello glacier. It is known (Kuhn & alii, 1985) that theresponse of a glacier to climate fluctuations depends on itsspecific geomorphological characteristics, such as topogra-phy, aspect, hypsometry and glacier surface conditions in-cluding the debris cover. Then, because of its geomorpho-logical difference compared to midsize glaciers for whichmass balances are available, the Adamello glacier can beconsidered as a representative example of large glaciers inthe same climatic subregion of the Alps as identified byAuer & alii (2007). Observations and modelling of its massbalance variability can therefore be useful for investigatingthe features of the response of glaciers to climate fluctua-tions in the southern Alps and the impact of such changeson runoff, sediment transport, local microclimate andlandscape.
Because of its large size and complex logistic it is diffi-cult to estimate the mass balance of the Adamello Glacierby using the glaciological method, and no systematic, longterm measurements of mass balance have been conductedso far, although its changes in area and its terminus retreatover the last two centuries are well documented (Marchet-ti, 1978-1993; Baroni & Carton, 1990; Marchetti, 1999-2004; Maragno & alii, 2009), marking a 200 m retreat dur-ing the 1953-2002 period. For this reason an alternativeapproach was followed in the analysis reported in thiswork: an energy balance physically-based and distributedmodel was applied to assess the seasonal and annual massbalance of the Mandrone Glacier, the major glacial unit ofthe Adamello Glacier, drained by the Sarca di Genova riv-er. To this aim meteorological, hydrological and glacio-logical data from 1995 to 2006, were collected andprocessed, as described in the second section. Then the
energy-balance model and the resulting mass balance com-putation is presented in the third section. The annual massbalance was then estimated for each of the twelve yearsand discussed as reported in the last two sections of thepaper.
THE STUDY AREA AND THEHYDROMETEOROLOGICAL DATA
THE ADAMELLO AND MANDRONE GLACIERS
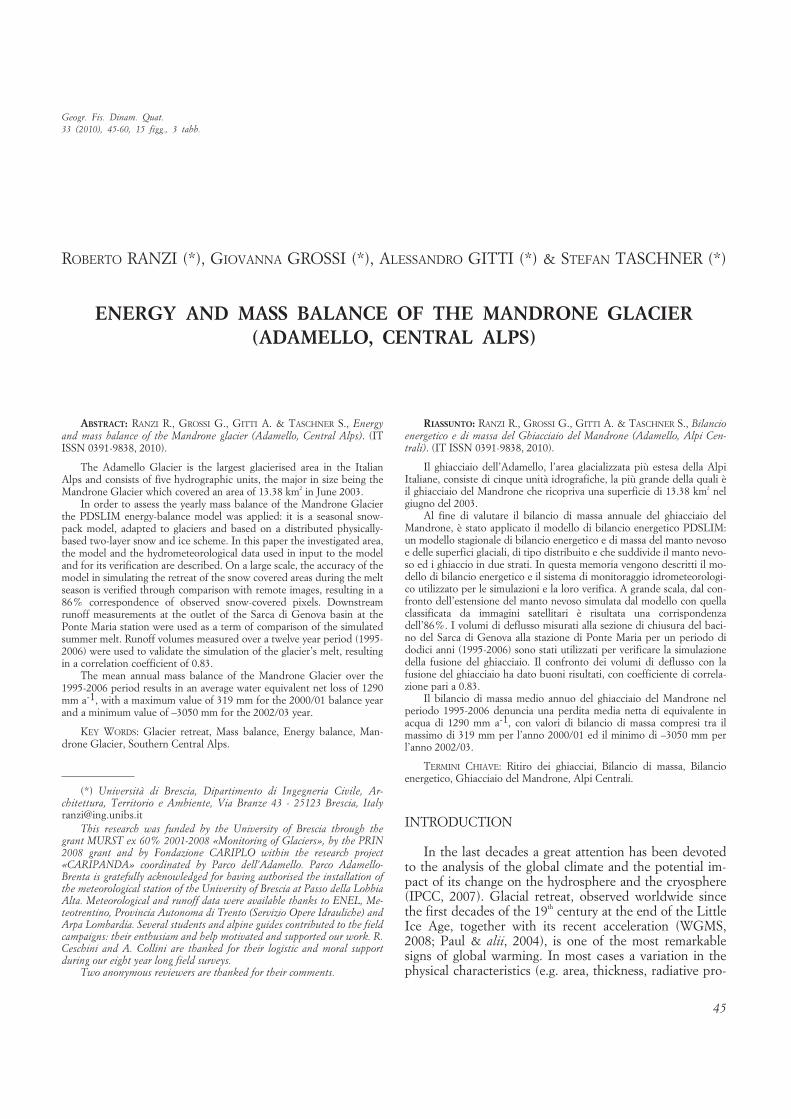
The Adamello massif, with a maximum altitude of3539 m a.s.l., is located in the eastern part of the CentralItalian Alps. Its slopes, including the Adamello Glacier,belong to two different administrative regions: the Lom-bardia region (specifically the province of Brescia) and theTrentino-Alto Adige/Südtirol region (specifically the pro-vince of Trento). Fig. 1 shows the boundaries of the studyarea and the location of some of the meteorological sta-tions and the two hydrometric monitoring sites used forour analysis.
At the end of the 19th century, as reported by Payer(1865), some authors considered the Adamello Glacier asa single glacier, consisting of one accumulation zone andseveral effluences radiating out in the respective valleys. Ifwe still consider the Adamello Glacier as a unique con-nected glacial unit (as for instance in S.G.L., 1992), thearea of its glacierized surface is the widest in Italy (Baroni& Carton, 1996). It measures 17.24 km2 according to theanalysis of the ASTER satellite image scanned on the 20th
of June 2003. The official Italian Glacier’s Inventory (Co-mitato Glaciologico Italiano - C.N.R., 1961) divides theglacier into six units: the Pian di Neve plateau and theMiller Superiore, Salarno, Adamé, Corno di Salarno andMandrone glaciers effluences, located in four separate val-leys. The mass balance study presented here is focused onthe Mandrone Glacier, the major hydrographic unit, cod-ed as I-4L01011-15 in the World Glacier Inventory, whichgenerates the major source of the Sarca di Genova river:its area measures 13.38 km2 as estimated from the 20th ofJune 2003 image, and taking into account the ice flow di-rection observed over Pian di Neve and the glacier’s divideidentified by Baroni and Carton (1996). It can be consid-ered as a valley glacier (C.G.T., 1994) with a north-eastfacing tongue, and altitude ranging from 2586 m a.s.l. to3406 m a.s.l., as detected from the ASTER image superim-posed on a digital elevation model. The mean altitude ofthe glacier was about 3040 m a.s.l. in summer 2003. Theglacier is surrounded by high mountains as MonteAdamello, Punta Venerocolo and the Lobbia Alta peaks,shown in fig. 1.
In the scientific literature several studies are reporteddealing with the Adamello Glacier. Pioneer field surveyswere carried out by Julius Payer in 1864 and publishedone year later (Payer, 1865). Since then, after the end ofthe Little Ice Age, the glacier has been monitored, with in-creasing intensity in the second decade of the last century.The terminus retreat has been monitored on a continuous

47
basis (Marchetti, 1978-1993; Marchetti, 1999-2004) untiltoday and data archived by the WGI. A first estimate ofthe glacier thickness by using geophysical methods wasprovided on the basis of seismic observations by Carabelli(1961) who estimated a maximum thickness of 260 m; As-tori & Togliatti (1964) used aerial photogrammetry to pro-duce a detailed topograpic map with 5 m interdistace in al-titude. Other works by Baroni & Carton (1990, 1996) andBaroni & alii (1992) were mainly focused on the recon-struction of the glacier variations in the past using differ-ent methods. Recent studies by Frassoni & alii (2001) pro-vided measurements with georadar of the Adamello Glaci-er’s thickness, which ranged in the 1997 and 1998 yearsfrom a maximum depth of 240 m in the Pian di Neve areaclose to Passo Adamè to 50 m in the tongue close to theterminus; Ranzi & Taschner (2005) estimated snow, firnand ice albedo with satellite images and in situ measu-rements and Baroni & alii (2004) investigated the per-mafrost environment in the surrounding areas. RecentlyMaragno & alii (2009) documented changes of the arealextent of the Adamello glacier, compared to the ongoingdecline of Alpine glaciers.
METEOROLOGICAL AND SNOW MEASUREMENTS
Meteorological and snow monitoring over the studyarea was actually conducted after a critical analysis andprocessing of meteorological and hydrometric data provid-ed by a network of gauges in the surrounding area (about
800 km2) of the Adamello Glacier (see fig. 2): data from 17meteorological stations and 15 snow depth and densitymeasurement points were processed altogether over the1995-2006 monitoring period. Most of the monitoring sitesare located at an intermediate altitude, i.e. between 900and 2000 m a.s.l., but several others are located at a high al-titude, over 2000 m a.s.l. As the hypsometry of the glacierranges from about 2600 to 3400 m a.s.l., great attention ispaid to a proper description of the physical processes andmeteorological variables occurring at high elevations. Atthis aim meteorological measurements referring to high al-titude sites as close as possible to the Mandrone Glacierwere selected to drive the model simulations.
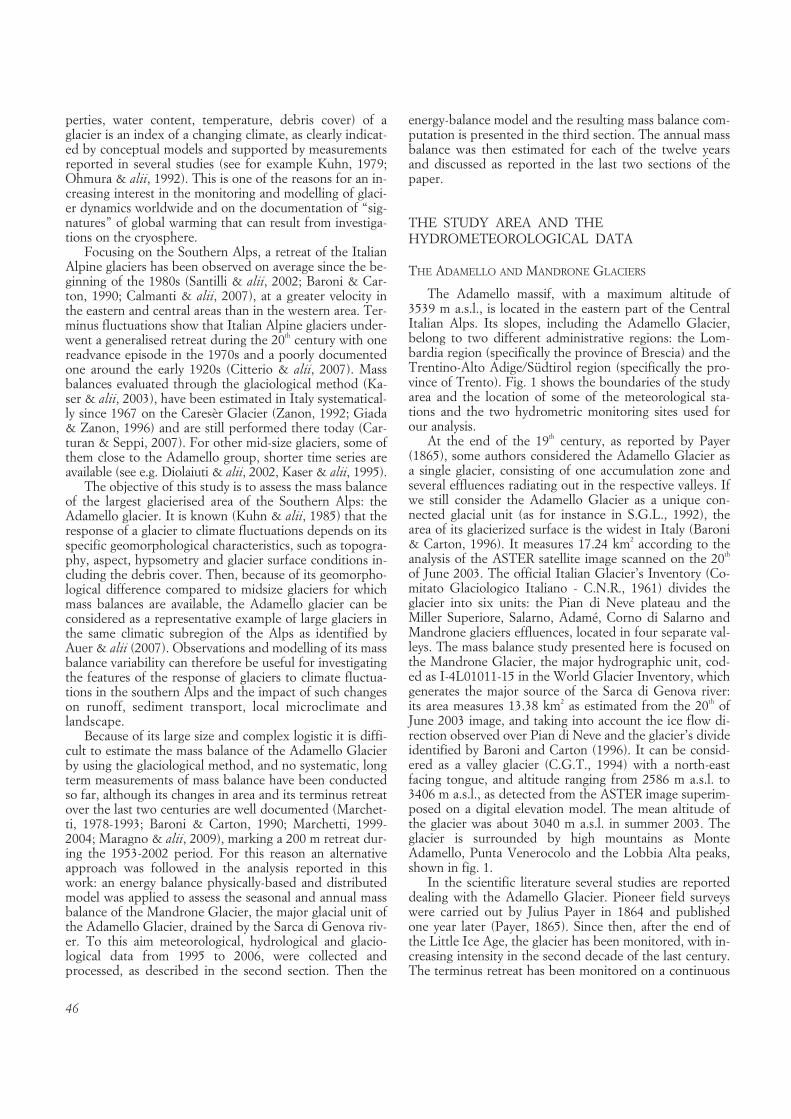
For the 1995 and 1996 ablation seasons, air tempera-ture, humidity, wind speed, incoming radiation and atmos-pheric pressure data recorded at the meteorological stationinstalled by ENEL on the glacier at Passo Adamè (3150 ma.s.l.) were assumed to be representative of the Mandroneglacier’s conditions. As this station was later no more inoperation, for the 1997 to 2000 period, the most represen-tative monitoring site was assumed to be the Cima Presenastation, located at 3015 m a.s.l. on a peak close to theglacial environment. In the following six-years period themeteorological information required to simulate the glaci-er energy and mass balance was mainly provided by theautomatic weather station installed at Passo della LobbiaAlta (3020 m a.s.l., see fig. 1) on the 9th of August 2001. Atthat time the station was based 3 m deep in the snow accu-mulated on the top of the Lobbia glacier (see fig. 3) and a
FIG. 1 - Val di Genova map on theUTM coordinates grid: the hydro-logical basins (light grey) and theglacier’s boundaries (white line)are outlined, together with thetwo hydrometric (white triangles)and the nearest meteorologicalstations (white squares). TheMandrone Glacier boundaries arein black. Black triangles indicatemajor mountain peaks surround-
ing the glacier.
48
few tens of metres away from the Mandrone glacier. Icewas found at the bottom of the basement at the time of theinstallation, but in the successive years both the Lobbiaand the Mondrone glaciers retreated some tens of metersfar from the station. The Passo della Lobbia station mea-sured air temperature and humidity, wind speed and di-rection, net shortwave and longwave radiation with LSI-
LASTEM instruments and shortwave incoming and reflect-ed global radiation with a Kipp & Zonen albedometer.Even if in the following years the Lobbia glacier retreatedfrom the station’s site, this site is still considered a good ref-erence for the meteorology of the investigated area becauseof its altitude, its location between two glaciers and becauseof the local winds and radiation conditions.
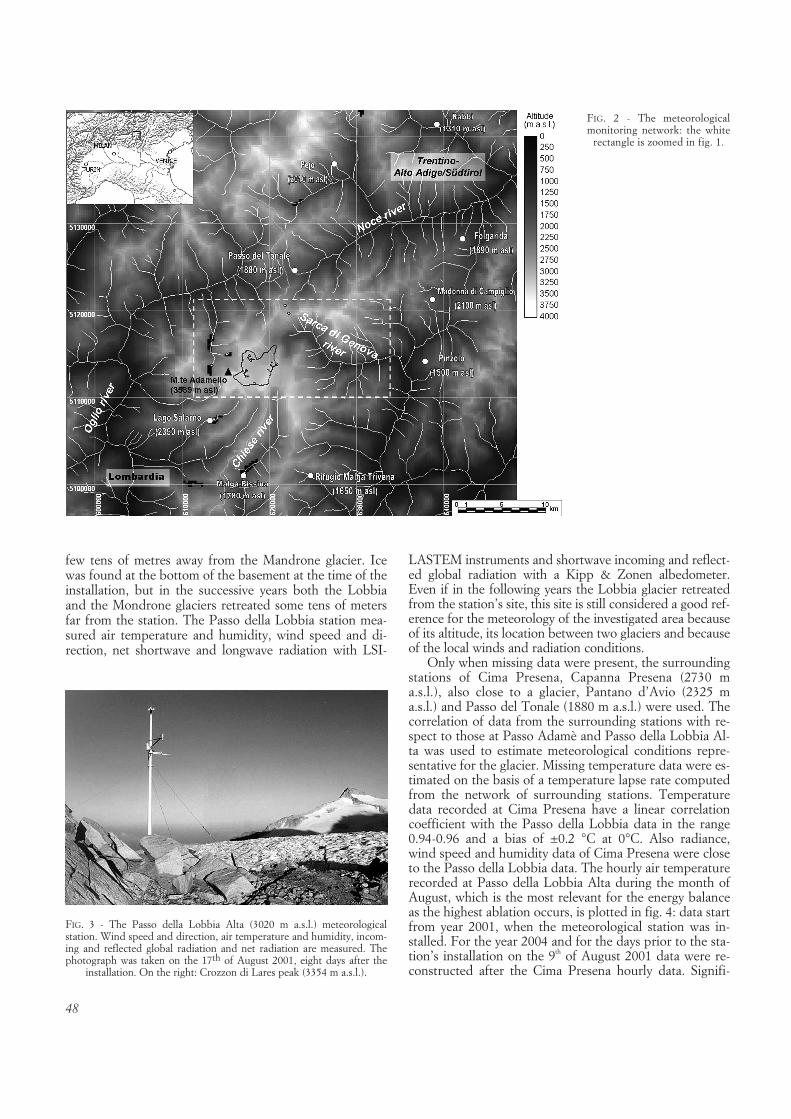
Only when missing data were present, the surroundingstations of Cima Presena, Capanna Presena (2730 ma.s.l.), also close to a glacier, Pantano d’Avio (2325 ma.s.l.) and Passo del Tonale (1880 m a.s.l.) were used. Thecorrelation of data from the surrounding stations with re-spect to those at Passo Adamè and Passo della Lobbia Al-ta was used to estimate meteorological conditions repre-sentative for the glacier. Missing temperature data were es-timated on the basis of a temperature lapse rate computedfrom the network of surrounding stations. Temperaturedata recorded at Cima Presena have a linear correlationcoefficient with the Passo della Lobbia data in the range0.94-0.96 and a bias of ±0.2 °C at 0°C. Also radiance,wind speed and humidity data of Cima Presena were closeto the Passo della Lobbia data. The hourly air temperaturerecorded at Passo della Lobbia Alta during the month ofAugust, which is the most relevant for the energy balanceas the highest ablation occurs, is plotted in fig. 4: data startfrom year 2001, when the meteorological station was in-stalled. For the year 2004 and for the days prior to the sta-tion’s installation on the 9th of August 2001 data were re-constructed after the Cima Presena hourly data. Signifi-
FIG. 2 - The meteorologicalmonitoring network: the white
rectangle is zoomed in fig. 1.
FIG. 3 - The Passo della Lobbia Alta (3020 m a.s.l.) meteorological station. Wind speed and direction, air temperature and humidity, incom-ing and reflected global radiation and net radiation are measured. Thephotograph was taken on the 17th of August 2001, eight days after the
installation. On the right: Crozzon di Lares peak (3354 m a.s.l.).
49
cant inter-annual differences, up to 15 °C, can be noticedand the extremely hot temperatures of the 2003 summerare evident from the data. Mean annual and monthly tem-peratures estimated at the site of the Passo della LobbiaAlta station are reported in tab. 1.
Precipitation recorded at Passo del Tonale or at Vascadi Genova (the closest station in the Sarca riverbasin, at900 m a.s.l. altitude) was assumed as a reference, but acorrection factor was applied as altitudinal precipitationgradients were observed in the surrounding area. In fact,thanks to measurements conducted with a precipitationtotaliser until the 1970s, a mean annual precipitation of1421 mm was measured at 2441 m a.s.l., two kilometresapart from the Mandrone glacier, over the 1963-1972 peri-od. An annual precipitation lapse rate Gp=0.312 mm m–1
and a reference annual precipitation at sea level estimated
as P0=717 mm (over a dense network which was availablein that period at high altitudes) were applied to correctprecipitation data in our simulations, assuming an altitu-dinal linear trend and a multiplicative correction factoras in Ranzi & alii (1999). See also Beniston (1997)Brunetti & alii (2000), Laternser & Schneebeli (2003) forreference on this issue.
Incoming global shortwave radiation data were used ininput to the energy balance model. Net radiation and re-flected shortwave global radiation data, collected over the2001 to 2006 period at the Passo della Lobbia Alta meteo-rological station, were used to validate the net shortwaveand longwave radiation components of the energy balancemodel, described in the next section.
Surface properties of the Mandrone glacier were sur-veyed by field investigations throughout the 2001-2008 pe-
FIG. 4 - Hourly air temperaturerecorded in the month of Augustat Passo della Lobbia Alta (2001to 2006 years). On the 7th of Au-gust 2003 a temperature value of15°C (black circle) was measuredat 12:00 local time (CET) at thestation. For the rest of August2003 and some missing values inthe other years data, e.g. in August2001 before the 9th of August, da-ta were reconstructed with valuesrecorded at Cima Presena (3015 m
a.s.l.) station.
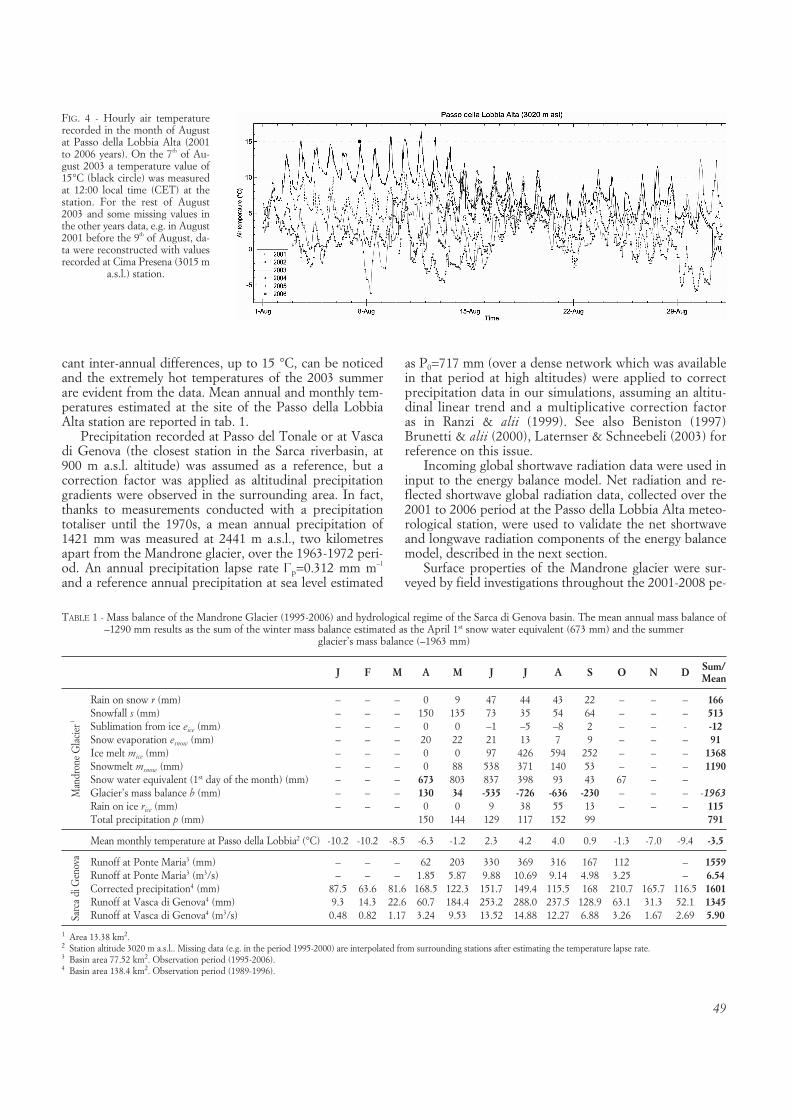
TABLE 1 - Mass balance of the Mandrone Glacier (1995-2006) and hydrological regime of the Sarca di Genova basin. The mean annual mass balance of–1290 mm results as the sum of the winter mass balance estimated as the April 1st snow water equivalent (673 mm) and the summer
glacier’s mass balance (–1963 mm)
J F M A M J J A S O N D Sum/Mean
Rain on snow r (mm) – – – 0 9 47 44 43 22 – – – 166Snowfall s (mm) – – – 150 135 73 35 54 64 – – – 513Sublimation from ice eice (mm) – – – 0 0 –1 –5 –8 2 – – - -12Snow evaporation esnow (mm) – – – 20 22 21 13 7 9 – – – 91Ice melt mice (mm) – – – 0 0 97 426 594 252 – – – 1368Snowmelt msnow (mm) – – – 0 88 538 371 140 53 – – – 1190Snow water equivalent (1st day of the month) (mm) – – – 673 803 837 398 93 43 67 – –Glacier’s mass balance b (mm) – – – 130 34 -535 -726 -636 -230 – – – -1963
Rain on ice rice (mm) – – – 0 0 9 38 55 13 – – – 115Total precipitation p (mm) 150 144 129 117 152 99 791
Mean monthly temperature at Passo della Lobbia2 (°C) -10.2 -10.2 -8.5 -6.3 -1.2 2.3 4.2 4.0 0.9 -1.3 -7.0 -9.4 -3.5
Runoff at Ponte Maria3 (mm) – – – 62 203 330 369 316 167 112 – 1559Runoff at Ponte Maria3 (m3/s) – – – 1.85 5.87 9.88 10.69 9.14 4.98 3.25 – 6.54Corrected precipitation4 (mm) 87.5 63.6 81.6 168.5 122.3 151.7 149.4 115.5 168 210.7 165.7 116.5 1601Runoff at Vasca di Genova4 (mm) 9.3 14.3 22.6 60.7 184.4 253.2 288.0 237.5 128.9 63.1 31.3 52.1 1345Runoff at Vasca di Genova4 (m3/s) 0.48 0.82 1.17 3.24 9.53 13.52 14.88 12.27 6.88 3.26 1.67 2.69 5.90
1 Area 13.38 km2.2 Station altitude 3020 m a.s.l.. Missing data (e.g. in the period 1995-2000) are interpolated from surrounding stations after estimating the temperature lapse rate.3 Basin area 77.52 km2. Observation period (1995-2006).4 Basin area 138.4 km2. Observation period (1989-1996).
Man
dron
e G
laci
er1
Sarc
a di
Gen
ova
50
riod. The objective was to observe the glacier’s surface andthe position of the transient snowline and the firn andmeasure some physical properties of snow and ice, rele-vant for the energy balance model, such as albedo andsnow density. A detailed field survey was carried out dur-ing the summer of 2002 on the Adamello Glacier, aimed atmonitoring the physical characteristics of the snow and es-timating the albedo in several sites. On the 19th and the 20th
of August 2002, air temperature, incoming and reflectedradiation were measured, together with temperature, den-sity, liquid water content, shape and size of the snowgrains in six different sites. Other snow density measure-ments were conducted in the following years. Seasonalsnow density ranged, on average, between 300 kg m–3 inJune and 510 kg m–3 in August. Point albedo measure-ments of seasonal snow at four different sites were in the0.4-0.5 range, while ice surface reflected from 20% to30% of incoming radiation.
STREAMFLOW MEASUREMENTS
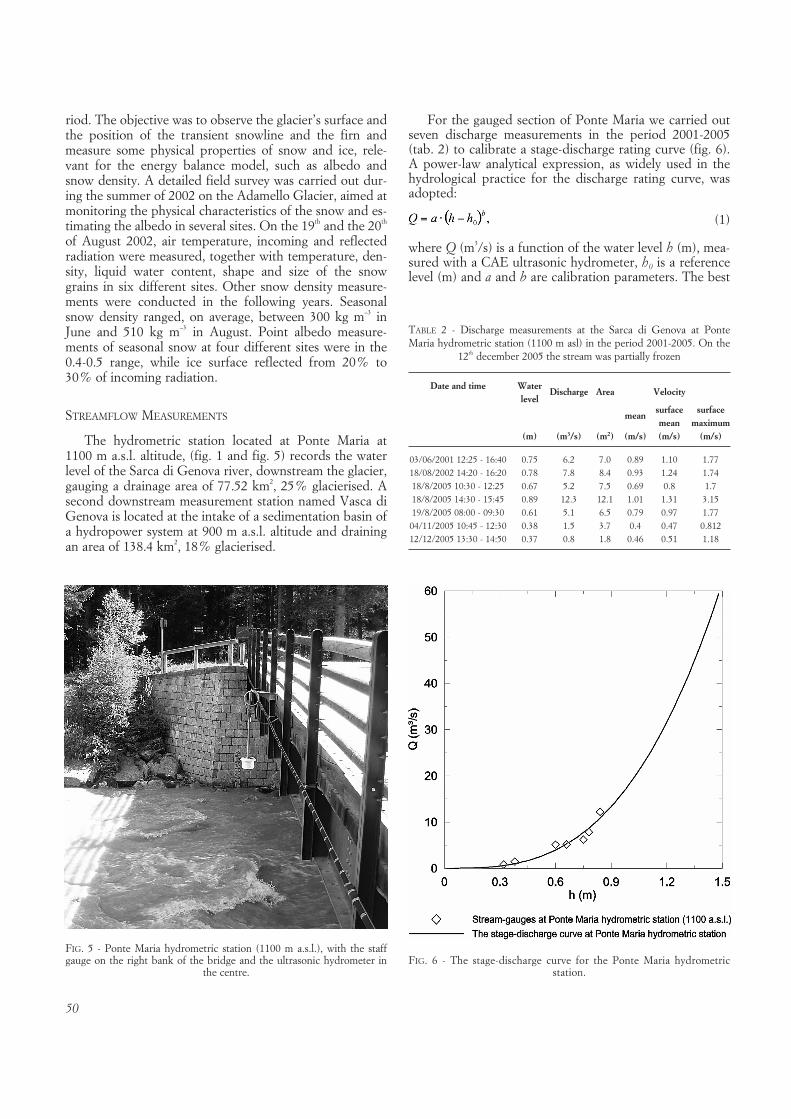
The hydrometric station located at Ponte Maria at1100 m a.s.l. altitude, (fig. 1 and fig. 5) records the waterlevel of the Sarca di Genova river, downstream the glacier,gauging a drainage area of 77.52 km2, 25% glacierised. Asecond downstream measurement station named Vasca diGenova is located at the intake of a sedimentation basin ofa hydropower system at 900 m a.s.l. altitude and drainingan area of 138.4 km2, 18% glacierised.
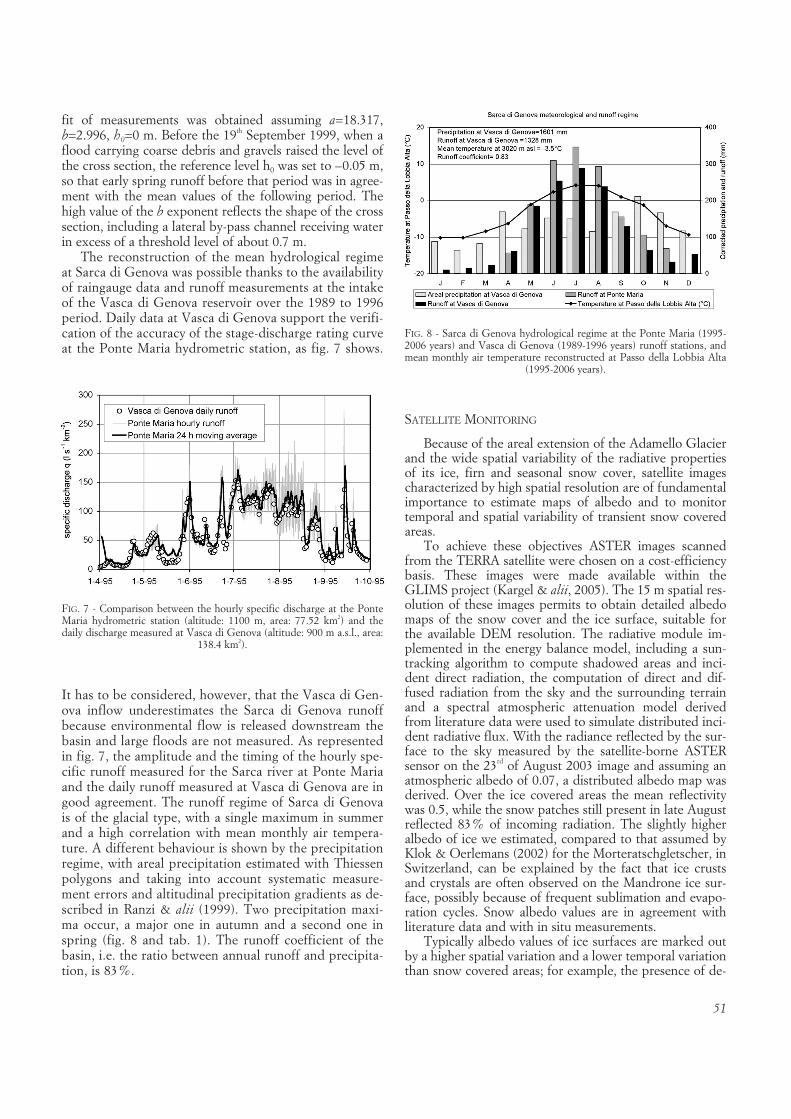
For the gauged section of Ponte Maria we carried outseven discharge measurements in the period 2001-2005(tab. 2) to calibrate a stage-discharge rating curve (fig. 6).A power-law analytical expression, as widely used in thehydrological practice for the discharge rating curve, wasadopted:
(1)
where Q (m3/s) is a function of the water level h (m), mea-sured with a CAE ultrasonic hydrometer, h0 is a referencelevel (m) and a and b are calibration parameters. The best
FIG. 5 - Ponte Maria hydrometric station (1100 m a.s.l.), with the staffgauge on the right bank of the bridge and the ultrasonic hydrometer in
the centre.
TABLE 2 - Discharge measurements at the Sarca di Genova at PonteMaria hydrometric station (1100 m asl) in the period 2001-2005. On the
12th december 2005 the stream was partially frozen
Date and time Water Discharge Area Velocitylevel
mean surface surfacemean maximum
(m) (m3/s) (m2) (m/s) (m/s) (m/s)
03/06/2001 12:25 - 16:40 0.75 6.2 7.0 0.89 1.10 1.7718/08/2002 14:20 - 16:20 0.78 7.8 8.4 0.93 1.24 1.7418/8/2005 10:30 - 12:25 0.67 5.2 7.5 0.69 0.8 1.718/8/2005 14:30 - 15:45 0.89 12.3 12.1 1.01 1.31 3.1519/8/2005 08:00 - 09:30 0.61 5.1 6.5 0.79 0.97 1.7704/11/2005 10:45 - 12:30 0.38 1.5 3.7 0.4 0.47 0.81212/12/2005 13:30 - 14:50 0.37 0.8 1.8 0.46 0.51 1.18
FIG. 6 - The stage-discharge curve for the Ponte Maria hydrometric station.
51
fit of measurements was obtained assuming a=18.317,b=2.996, h0=0 m. Before the 19th September 1999, when aflood carrying coarse debris and gravels raised the level ofthe cross section, the reference level h0 was set to –0.05 m,so that early spring runoff before that period was in agree-ment with the mean values of the following period. Thehigh value of the b exponent reflects the shape of the crosssection, including a lateral by-pass channel receiving waterin excess of a threshold level of about 0.7 m.
The reconstruction of the mean hydrological regimeat Sarca di Genova was possible thanks to the availabilityof raingauge data and runoff measurements at the intakeof the Vasca di Genova reservoir over the 1989 to 1996period. Daily data at Vasca di Genova support the verifi-cation of the accuracy of the stage-discharge rating curveat the Ponte Maria hydrometric station, as fig. 7 shows.
SATELLITE MONITORING
Because of the areal extension of the Adamello Glacierand the wide spatial variability of the radiative propertiesof its ice, firn and seasonal snow cover, satellite imagescharacterized by high spatial resolution are of fundamentalimportance to estimate maps of albedo and to monitortemporal and spatial variability of transient snow coveredareas.
To achieve these objectives ASTER images scannedfrom the TERRA satellite were chosen on a cost-efficiencybasis. These images were made available within theGLIMS project (Kargel & alii, 2005). The 15 m spatial res-olution of these images permits to obtain detailed albedomaps of the snow cover and the ice surface, suitable forthe available DEM resolution. The radiative module im-plemented in the energy balance model, including a sun-tracking algorithm to compute shadowed areas and inci-dent direct radiation, the computation of direct and dif-fused radiation from the sky and the surrounding terrainand a spectral atmospheric attenuation model derivedfrom literature data were used to simulate distributed inci-dent radiative flux. With the radiance reflected by the sur-face to the sky measured by the satellite-borne ASTERsensor on the 23rd of August 2003 image and assuming anatmospheric albedo of 0.07, a distributed albedo map wasderived. Over the ice covered areas the mean reflectivitywas 0.5, while the snow patches still present in late Augustreflected 83% of incoming radiation. The slightly higheralbedo of ice we estimated, compared to that assumed byKlok & Oerlemans (2002) for the Morteratschgletscher, inSwitzerland, can be explained by the fact that ice crustsand crystals are often observed on the Mandrone ice sur-face, possibly because of frequent sublimation and evapo-ration cycles. Snow albedo values are in agreement withliterature data and with in situ measurements.
Typically albedo values of ice surfaces are marked outby a higher spatial variation and a lower temporal variationthan snow covered areas; for example, the presence of de-
FIG. 7 - Comparison between the hourly specific discharge at the PonteMaria hydrometric station (altitude: 1100 m, area: 77.52 km2) and thedaily discharge measured at Vasca di Genova (altitude: 900 m a.s.l., area:
138.4 km2).
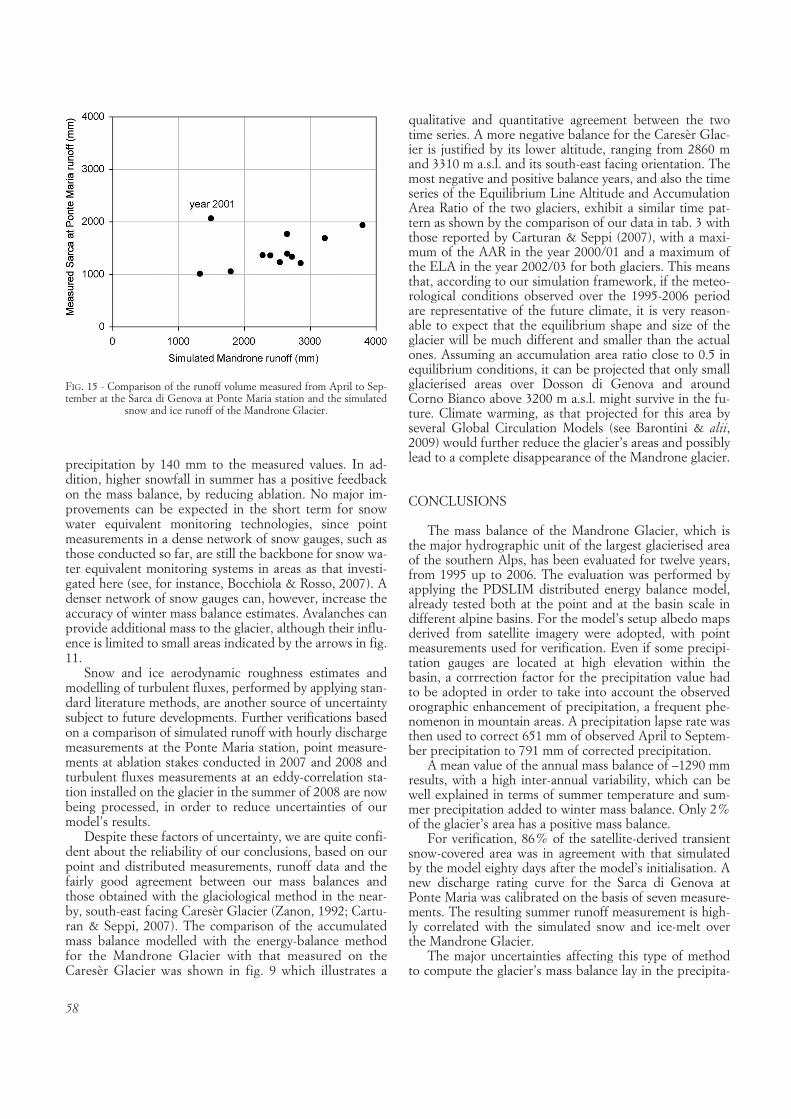
It has to be considered, however, that the Vasca di Gen-ova inflow underestimates the Sarca di Genova runoffbecause environmental flow is released downstream thebasin and large floods are not measured. As representedin fig. 7, the amplitude and the timing of the hourly spe-cific runoff measured for the Sarca river at Ponte Mariaand the daily runoff measured at Vasca di Genova are ingood agreement. The runoff regime of Sarca di Genovais of the glacial type, with a single maximum in summerand a high correlation with mean monthly air tempera-ture. A different behaviour is shown by the precipitationregime, with areal precipitation estimated with Thiessenpolygons and taking into account systematic measure-ment errors and altitudinal precipitation gradients as de-scribed in Ranzi & alii (1999). Two precipitation maxi-ma occur, a major one in autumn and a second one inspring (fig. 8 and tab. 1). The runoff coefficient of thebasin, i.e. the ratio between annual runoff and precipita-tion, is 83%.
FIG. 8 - Sarca di Genova hydrological regime at the Ponte Maria (1995-2006 years) and Vasca di Genova (1989-1996 years) runoff stations, andmean monthly air temperature reconstructed at Passo della Lobbia Alta
(1995-2006 years).

52
bris cover over a glacier decreases the value of the albedo,while ice crusts, which form as a result of sublimation andevaporation and are often observed over the Mandroneglacier, increase the value of albedo, if compared with val-ues over pure ice. Snow albedo is characterized by a high-er temporal variability, that is, albedo values can changeby 30% in a few days. For example, albedo values mea-sured at Passo della Lobbia Alta, from the 26th of May, justafter a spring snowfall, up to the 6th of June of 2005, variedfrom 0.85, a typical value for fresh snow, to 0.55 a typicalvalue for wet snow. One station installed on the Mandroneglacier in the summer of 2008 measured ice albedo in the0.3-0.5 range and fresh snow albedo in the 0.7-0.9 range.In the model, while ice albedo is assumed as a distributedmap derived from the satellite image, and constant in time,the distributed snow albedo is assumed to change accord-ing to a model described in Ranzi & Rosso (1991) whichtakes into account season, snow metamorphosis and dif-fused radiation.
METHODS
ANNUAL MASS BALANCE
Among the different methods to assess the mass bal-ance of a glacier, when the access to large glaciers is dif-ficult for the glaciological method to be adopted, the hy-drological method can be a valid alternative. It impliesthe estimation of outgoing and incoming water volumesto the glacier over a given period, typically one year or the accumulation and the ablation seasons. In orderto properly evaluate the outgoing mass, a reliable esti-mate of snowmelt and icemelt is necessary and the appli-cation of a distributed energy balance model can beadopted. Runoff measurements can also be conductedfor verification.
For each of the twelve hydrological years 1995-2006the annual mass balance of the Mandrone Glacier, ex-pressed in terms of equivalent water volume B [L3], wasestimated as the sum of the winter balance and of thesummer balance, each lasting six months. For a given hy-drological year, it is assumed that winter starts on the 1st
of October, denoted as t0w, of the previous year and endson the 31st of March, denoted as tfw, of the current year.The ablation season starts, in our working assumption,on the 1st of April, t0s = tfw, of the balance year, when thefirst spring snowmelt episodes are detected in some yearson the hydrograph at the Ponte Maria hydrometric sta-tion (see for instance fig. 7), and ends on the 30th of Sep-tember, tfs, of the balance year. For the Mandrone Glaci-er’s surface, Ag, outlined in fig. 1 and assumed to have aconstant area of 13.38 km2 over the twelve year simula-tion period, the mass balance B is computed as the sumof the balance of the snow-covered areas changing intime, Asnow(t), and that of the firn- or ice-covered areas,assumed as a single unit, with area Aice(t), also changingin time. The total glacier’s area is then constant and equalto Ag=Asnow(t)+Aice(t).
WINTER MASS BALANCE
The winter glacier’s mass balance, Bw, is estimated asthe sum of the firn and ice mass balance and of the snowmass balance. The firn and ice winter mass balance, Bw,ice,is assumed to be equal to the total volume of the snow wa-ter equivalent left at the beginning of the balance year,Sweq(t0w), which starts its metamorphosis into firn and laterice. Ice melt is assumed to be negligible in winter. Thesnow winter mass balance, Bw,snow, is given by the differ-ence, Sweq(tfw) - Sweq(t0w), between the snow water equiva-lent measured at the end, Sweq(tfw), and that simulated atthe beginning of the winter period, Sweq(t0w), the last oftenbeing small or negligible. The snow water equivalent onthe 1st of April of each year is estimated by interpolatingwith a logistic curve the snow water equivalent measure-ments available from a network of about fifteen stationsavailable in the domain of fig. 1 up to an altitude of 2700m. As a result, the glacier’s winter mass balance is:
(2)
This assumption is consistent with the literature (seefor instance Ohmura & alii, 1992).
SUMMER MASS BALANCE
Over the snow-covered areas the snow mass balance,Bs,snow, with dimension [L3] is computed as the sum of thepoint mass balance over each pixel of the domain, measur-ing dA=30 m x 30 m= 900 m2:
(3)
where r represents the rainfall rate, s is the snowfall, msnow
is the snowmelt (including drainage of the snow liquid wa-ter content) and esnow represents net snow evaporation andsublimation losses. All these terms have dimension [LT–1].Because rainfall over firn and ice areas is assumed to flowas runoff on the surface and in subsurface channels of theglacier the summer balance Bs,ice of this part of the glacier,with area Aice(t), is always negative being the sum of themelt rate, mice, and sublimation rate, eice, computed as:
(4)
As a consequence, the summer mass balance of ice andsnow over the glacier’s area Ag is
(5)
Where psnow represents total precipitation rate, eitherrain, r, or snow, s, over snow, m=msnow+ mice the total melt,including drainage from the snowpack, and e=esnow+eice eva-poration and sublimation from snow and ice, all termshaving dimension [LT–1] and negative sign when conden-

53
sation of air water vapour occurs. Total precipitation overthe glacier, p, is the sum of total precipitatiom on snow,psnow, and rain on ice, rice which does not contribute to theglacier’s mass balance because it runs off the glacier’s sur-face. The annual mass balance is given by the sum of thewinter and summer mass balances:
(6)
The annual specific mass balance over a unit surface ofthe glacier, with dimension [L], can be obtained as:
(7)
The basic terms of equations (1) to (6) are given in tab.1, where they are reported with the same notation asabove, but in units of volumes per unit surface of the glac-ier, that is expressed in millimetres of water equivalentover the computational period. Areal changes are neglect-ed in our computation as their estimation would require acontinuous monitoring of the glacier’s areal extent.
ENERGY BALANCE OF SNOW AND ICE
In the following, the hypotheses of our energy bal-ance modelling framework, called PDSLIM (Physicallybased Distributed Snow Land and Ice Model), are brieflydescribed. This model is a development of the PDSMmodel, already applied at the catchment scale to simulatesnowmelt in two alpine basins, Cordevole (Ranzi &Rosso, 1991) and Toce (see Grossi & Falappi, 2003where the model’s transpiration component is de-scribed). At the point scale the temperature and liquidwater content dynamics of the snowpack model were ver-ified with microwave radiometry during the MASMEXexperiment, in the Cordevole test-site (Cagnati & alii,2004; Macelloni & alii, 2005). The adaptation of PDSMto simulate the energy balance of glacierised basins wasalready tested for the debris-covered Belvedere Glacier(Ranzi & alii, 2004).
For a unit area and finite depth layer of ice or snow su-perimposed over ice, the melt rate can be computed fromthe energy balance equation
(8)
where the terms, with units W/m2, represent, respectively:
Hm: energy available for melt,Hc: internal energy of the ice or snow layer,Sio: net shortwave radiation,Lio: net longwave radiation,Hl: latent heat,Hs: sensible heat,Hp: advective heat from precipitation,Hg: conductive heat at the bottom surface of the ice orsnow layer.
For an ice or snow layer with finite depth Dz, specificheat C, density r and mean temperature T, thermal energychanges over time, t, with a rate
(9)
The specific heat of ice is set to C=Ci=2093.4 J kg–1 K–1
and its density is assumed r=ri=830 kg m–3, a literaturevalue for firn (Paterson, 2004) which can be adopted alsofor ice at the surface, where ice porosity is high. The rela-tively low ice density, close to literature values for firn, wasadopted because ice crusts and sublimation crystals wereoften observed on the glacier’s surface, resulting on higherporosity. For snow, instead, density r=rs changes overtime according to the snowpack simulation model already described in Ranzi & Rosso (1991) and Cagnati & alii(2004). Details of the computation of the shortwave andlongwave radiation terms of the equation, Sio and Lio, afterglobal shortwave radiation measurements, Rm, are basicallythose reported in Ranzi & Rosso (1991; 1995). In the ap-plication to glacierised areas, the diffused shortwave radia-tion from the sky, computed as Rd, and the fraction of themeasured incoming global radiation, Rm, reflected by theterrain surrounding each point with average albedo at(x,y)contribute to the flux of diffused radiation at each point,Rd(x,y). Considering the sky view factor, Vs, i.e. the frac-tion if the sky hemisphere surrounding each point, and theterrain view factor, Vt, which is its complementary valueVt=1-Vs the diffused radiatio Rd(x,y) results:
(10)
Turbulent heat fluxes of sensible and latent heat (seefor instance Hock & Holmgren, 2005; Denby & Greuell,2000), Hs and Hl respectively, are computed according tothe mixing length theory, assuming stable conditions at thesnow and ice surfaces. This is a reasonable hypothesis dur-ing the melt season, in the lack of more detailed measure-ments of the wind field and the turbulent structure whichare known to be complex (Brock & alii, 2006; Smeets &alii, 1998, 2000), but are seldom measured in detail overglaciers. Accordingly Hs and Hl can be computed as:
(11)
(12)
(13)
being Dh, Dw turbulent heat and momentum exchangecoefficients andra (kg m–3): air density,Cp (J kg–1 K–1): specific heat of air,p (Pa): atmospheric pressure,Ta (K): air temperature at height z,Ts (K): ice or snow surface temperature,ea (Pa): air vapor pressure,
54
es (Pa): vapor pressure at the ice or snow surface,Lv (J kg–1): latent heat of sublimation.uz (m s–1): wind velocity at measurement height z, assumedthe same reference height for temperature and humidity,z0 (m): surface aerodynamic roughness,k=0.4: Von Karman constant.
Surface roughness z0 is assumed 0.007 m for ice afterHock (1998), while for snow it is 0.003 m (see for instancePlüss & Mazzoni, 1994). The measurement height z is 6 min the case of the Passo della Lobbia meteorological sta-tion in late summer, when the seasonal snow is, generally,completely melted. When snow is present, according tomeasurements or simulations, the effective measurementheight is computed as the distance between the height ofthe sensor and the snow surface depth simulated by themodel. It is worth noticing that in the year the station wasinstalled, 2001, 3 m of snow were still present in August(see fig. 3), the maximum value observed for that monthover the 2001 to 2008 measurement period at that site.
Both air temperature and atmospheric pressure wereestimated at each 30 m x 30 m grid cell of the glacier’sDigital Elevation Model on the basis of the respective alti-tude gradients. No correction was applied to measuredrelative humidity.
Conductive heat, Hg, at the bottom of a surface ice orfirn layer 0.1 m deep is computed according to the Fourierlaw:
(14)
with Kt the thermal conductivity of ice (W m–1 K–1), deter-mined after Paterson (1994) as a function of the meantemperature of the ice layer, Ti
(15)
The surface ice or firn layer is assumed to exchangeconductive heat with an underlying isothermal, semi-infi-nite, ice layer at constant 0°C temperature, Tg, a reason-able assumption for a temperate glacier in the melt season.
With this assumption, the conductive heat flux gainedfrom the glacier over the time step [tk, tk+1=tk+Dt], by thesurface ice layer, with mean temperature Ti,k at the begin-ning of the time step, results:
(16)
Let a and c represent the constant terms
(17)
(18)
and Hk the heat flux
(19)
computed at the beginning of each computational timestep [tk, tk+1] in a finite difference implicit scheme to solve
in time the energy balance equation (8) for the finite vol-ume of the surface ice layer assumed 0.1 m deep. Then,combining equations (9), (16), (17), (18) and (19), assum-ing first that Hm=0 we can solve equation (8)
(20)
with respect to the unknown mean ice temperature, Ti,k+1,at the end of the computational time step:
(21)
obtaining
(22)
If Ti,k+1 results higher than 0°C the ice temperature isset to 0°C and the surplus heat available for ice melt is
(23)
The surface ice temperature, T0, which is needed tocompute the radiative and convective terms of equation(8) at the successive computational time step, assuming alinear temperature profile within the ice layer, is set twicethe mean ice layer temperature, T0,k+1=2 Ti,k+1.
A similar numerical scheme is adopted to simulate con-ductive heat fluxes in the upper snow layer, 0.1 m deep,and at the bottom of the snowpack.
When the temperature of the ice or snow layer reaches0°C, melt can occur at a rate m (m s–1) computed by divid-ing the energy flux Hm by the latent heat of fusion of ice,Lf=334944 J kg–1, and the water density, rw, being rw=1002.28 kg m–3 at 0°C:
(25)
RESULTS
MASS BALANCE OF THE MANDRONE GLACIER
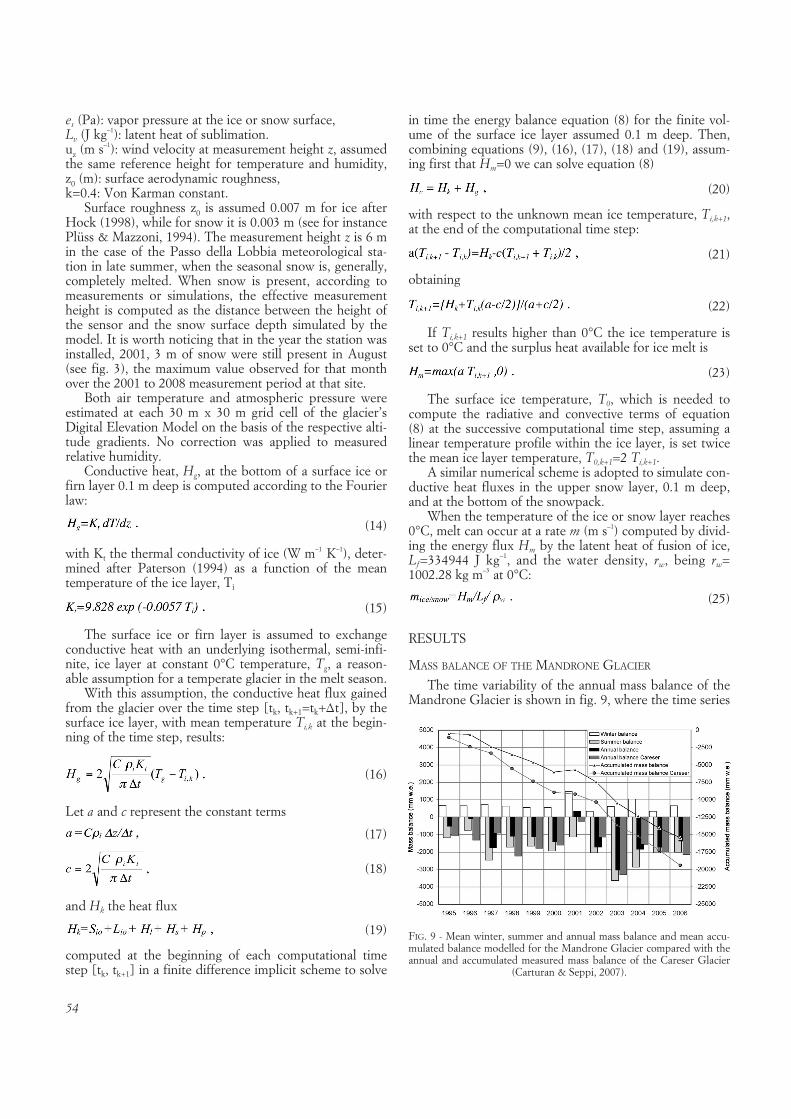
The time variability of the annual mass balance of theMandrone Glacier is shown in fig. 9, where the time series
FIG. 9 - Mean winter, summer and annual mass balance and mean accu-mulated balance modelled for the Mandrone Glacier compared with theannual and accumulated measured mass balance of the Careser Glacier
(Carturan & Seppi, 2007).

55
of the accumulated mass loss of about 15475 mm of waterequivalent, estimated for the 1995-2006 balance years, isalso represented. This corresponds to an estimated averagemass loss of 1290 mm a–1 equal to the sum of the meanwinter mass balance, 673 mm, estimated from equation (2)as the mean areal snow water equivalent on the 1st of Aprilof each year, and the mean summer mass balance, given byequation (5) and reported in tab. 1 and tab. 3 and result-ing in –1963 mm a–1. The terms of equations (3), (4) and(7) computed for the ablation season are listed in tab. 1.The ablation rate during the ablation season strongly de-pends on the meteorological conditions occurring eachyear over the melting surface. In fact the boundary meteo-rological conditions induce a meaningful change in the val-ue of the heat fluxes involved in the energy balance. Withreference to the Mandrone Glacier and to the melting sea-son, tab. 3 lists the mean annual and summer (from Juneto August) air temperature estimated at the site of the Pas-so della Lobbia Alta meteorological station, together withthe winter, summer, annual and accumulated balance esti-mated over the twelve years (1995-2006). It is possible toobserve, also from the data plotted in fig. 9, that for theyear 2003, when the highest value of the mean summertemperature (6.7 °C) was recorded, the highest mean an-nual mass loss of 3050 mm of water equivalent was ob-tained. Conversely, the highest positive balance of 319 mmw.e., was obtained for the year 2001, owing to the highestinitial mean water equivalent observed over the simulationperiod (1458 mm). This confirms an established consensusin the scientific literature, stating that key factors influenc-ing mean annual net balance, b, are summer temperatureTJJA and winter balance bw, (which is often assumed, ashere, as the end of the winter snow water equivalent)summed to summer precipitation P (Ohmura & alii, 1992).The simple multiple linear regression equation:
with TJJA expressed in °C, b, bw and P in mm, is capable toexplain 75% of the variance of the simulated annual massbalance, b, as fig. 10 shows. This means that with the actu-al mean summer temperature of TJJA=+3.5 °C at Passo del-la Lobbia, 1148 mm of winter snowfall, contributing to thewinter mass balance, and summer precipitation in additionto the actual ones would be needed to maintain the glacierin equilibrium.
TABLE 3 - Mean annual and summer (from June to August) air tempe-rature estimated at Passo della Lobbia Alta (3020 m asl), mass balancesexpressed in millimetres of water equivalent over the Mandrone Glacier.The Equilibrium Line Altitude and the Accumulation Area Ratio are
reported. Maxima are in bold, minima in italic
Annual air Summer air Winter Summer Annual AccumulatedE.L.A. A.A.R.Year temperature temperature balance balance balance balance
(m a.s.l.) (-)(°C) (°C) (mm) (mm) (mm) (mm)
1995 -4.4 2.0 658 -1187 -529 -529 3173 0.1831996 -4.9 1.8 642 -754 -112 -641 3086 0.5301997 -3.8 2.7 711 -2475 -1764 -2405 3313 0.0071998 -3.1 4.5 620 -1727 -1107 -3512 3300 0.0251999 -3.5 3.2 545 -1667 -1122 -4634 3289 0.0382000 -2.7 3.6 537 -1948 -1411 -6045 3296 0.0282001 -4.9 3.1 1458 -1139 319 -5726 2937 0.8302002 -2.9 3.6 323 -2051 -1728 -7454 3341 0.0002003 -2.6 6.7 601 -3651 -3050 -10504 >3406 0.0002004 -3.3 3.4 1022 -2874 -1852 -12356 3395 0.0002005 -3.8 3.8 323 -2056 -1733 -14089 3353 0.0002006 -2.5 4.0 640 -2025 -1385 -15474 3325 0.003
Mean -3.5 3.5 673 -1963 -1290 3268 0.137St.dev. 0.8 1.3 293 756 850 131 0.255
(26)
FIG. 10 - Comparison of the annual mass balance simulated by thePDSLIM model, on the x-axis, and that estimated by equation (26),
on the y-axis.
Even though the mean net balance over the glacier’ssurface permits to evaluate the global evolution of theglacier, it does not give information about the spatial andthe temporal variation of the accumulation and ablationareas; the capability of the distributed model to produceinstantaneous and accumulated ablation maps, reportingthe ablation rate in each cell of the glacierized area and ateach time step, enables to identify local critical conditionsand to project scenarios about the future evolution of theglacier, regarding the terminus position and the glacier’ssize and shape. Fig. 11 shows that a mean annual net bal-ance close to –4500 mm is simulated at the glacier’s termi-nus, and that a negative balance occurs over the whole sur-face with the exception of small areas over Dosson di Gen-ova and around the Corno Bianco peak. These areas with apositive balance account for only 2% of the glacier’s sur-face and are definetly insufficient to balance, through theglacier’s flow, the dramatic losses in the ablation areas.The mean specific mass balance distribution versus alti-tude is shown in fig. 12 together with the glacier’s hypsom-etry. Also the Equilibrium Line Altitude and the Accumu-lation Area Ratio, computed, respectively, as the mean alti-tude of the pixels with annual mass balance equal to ± 20mm and the ratio of the area of positive balance to the to-

56
tal glacier’s area at the end of September, are reported inthe last two columns of tab. 3. They confirm the negativemass balance losses computed by the model.
DISCUSSION
VERIFICATION WITH SATELLITE IMAGES AND RUNOFF DATA
ASTER images were used not only for the estimationof the ice albedo, as mentioned before, but for two further
purposes. The first one was to evaluate the position of theglacier’s terminus and show the progressive retreat of theglacier since 1864 (fig. 13); in this case satellite imagesshow a retreat of about 40 m from 2002 to 2003, muchmore rapid compared to the previous period when it wasof the order of 7.5 m a–1 in the 1987-2002 period, and evenslower, 4 m a–1, from 1953 to 2002, as documented by the
FIG. 11 - Simulated map of themean annual mass balance of theMandrone Glacier averaged overthe twelve years period 1995-2006.Arrows indicate the direction of
potential avalanches.
FIG. 12 - Mean 1995-2006 specific mass balance distribution versus altitude (mm w.e.) and Mandrone Glacier hypsometry.
FIG. 13 - The retreat of the Mandrone glacier’s terminus since the end ofthe Little Ice Age (dashed line drawn after Baroni and Carton, 1990) un-til year 2003. The position of the glacier’s front is superimposed over the20 June 2003 ASTER image and was redrawn after the analysis of fivemaps (Payer, 1865; K.U.K. M.I., 1886; D.Ö.A.V. 1903; Provincia Au-tonoma di Trento-CTR, 1990; Comitato Glaciologico Trentino web site,
1997) and of two Aster images scanned in 2002 and 2003.

57
terminus measurements by Marchetti (1978-1993) andMarchetti (1999-2004) collected and summarised in theWGI data base. The accumulated retreat since the LittleIce Age, as marked by the geomorphological signaturesdrawn on the map by Baroni & Carton (1996), is nowabout 2.1 km in length, corresponding to an increase ofthe glacier’s terminus altitude of about 900 m.
Another objective was to verify the accuracy of themodel in simulating the retreat of snow covered areas dur-ing the simulation period. The seasonal snowline positiondetected by setting a threshold on the map obtained fromthe radiance at sensor in the ASTER first visible band inthe June 20th 2003 satellite image in fig. 14 is comparedwith the boundary of snow simulated by the model ini-tialised on April 1st 2003 and run with meteorological forc-ing only. The pixels classified as snow-covered in both thesatellite and model-simulated maps are 35256 out of 41231pixels of the “true” snow cover as detected on the satellitemap, for the Sarca di Genova at Ponte Maria basin, thusresulting in a 86% correspondence. The same verificationwas done for the 23rd August 2003 image: both the simula-tion and the satellite image showed no remaining snow-cov-ered pixels at the end of that exceptionally hot summer.
The comparison of the satellite image scanned on June20th 2003 and the snow depth map simulated for the sameday provide a first check on the overall reliability of thesnow and ice melt model setup. In fact the snowline seemsto have quite the same shape and location in the two im-ages, as shown by some key geomorphological features in-dicated by the black arrows. The result is however depen-dent upon a correct estimate of: 1) the snow water equiva-lent depth at the beginning of the ablation season, 2) the
snowfall accumulated in the simulation period and 3) theheat fluxes estimated to compute the snow and ice melt.
A wrong estimate of any of these three variables wouldunavoidably introduce errors in the energy balance on thesimulation domain which includes the whole Sarca diGenova basin gauged at the Vasca di Genova outlet.Wrong initial conditions, snow precipitation and simulat-ed heat fluxes would result in a wrong location of the tran-sient snowline compared to the observed ones.
A further comparison was done with runoff measuredin the ablation season (from April to September) in thePonte Maria streamauge shown in fig. 15. By excluding theyear 2001 with an anomalous winter balance, the linearcorrelation coefficient between the simulated snow and icemelt and measured runoff is 0.83, thus providing a furthersupport to the reliability of our simulations. Including theyear 2001 the correlation decreases to 0.36.
UNCERTAINTIES AND FUTURE DEVELOPMENTS
Several uncertainties can affect our results and conclu-sions. Although we dedicated a lot of effort to the datacollection and analysis and to the reference to literaturedata, we are aware of the complexity of the modelling ap-proach described here.
One of the uncertainties we consider of major rele-vance is related to precipitation and snow water equivalentmeasurements. The maintainance of reliable precipitationgauges at a high altitude is of paramount importance, aswell as the correction of precipitation measurements withthe altitudinal trend. The applied precipitation correction,described in the previous paragraph, increased summer
FIG. 14 - Limits of the snow linesimulated by the PDSLIM modelon the 20th of June 2003 (in grey)superimposed on the VNIR 1 bandof the corresponding ASTER im-age. In black the limits of the Man-drone Glacier on the UTM coordi-
nates grid.
58
precipitation by 140 mm to the measured values. In ad-dition, higher snowfall in summer has a positive feedbackon the mass balance, by reducing ablation. No major im-provements can be expected in the short term for snowwater equivalent monitoring technologies, since pointmeasurements in a dense network of snow gauges, such asthose conducted so far, are still the backbone for snow wa-ter equivalent monitoring systems in areas as that investi-gated here (see, for instance, Bocchiola & Rosso, 2007). Adenser network of snow gauges can, however, increase theaccuracy of winter mass balance estimates. Avalanches canprovide additional mass to the glacier, although their influ-ence is limited to small areas indicated by the arrows in fig.11.
Snow and ice aerodynamic roughness estimates andmodelling of turbulent fluxes, performed by applying stan-dard literature methods, are another source of uncertaintysubject to future developments. Further verifications basedon a comparison of simulated runoff with hourly dischargemeasurements at the Ponte Maria station, point measure-ments at ablation stakes conducted in 2007 and 2008 andturbulent fluxes measurements at an eddy-correlation sta-tion installed on the glacier in the summer of 2008 are nowbeing processed, in order to reduce uncertainties of ourmodel’s results.
Despite these factors of uncertainty, we are quite confi-dent about the reliability of our conclusions, based on ourpoint and distributed measurements, runoff data and thefairly good agreement between our mass balances andthose obtained with the glaciological method in the near-by, south-east facing Caresèr Glacier (Zanon, 1992; Cartu-ran & Seppi, 2007). The comparison of the accumulatedmass balance modelled with the energy-balance methodfor the Mandrone Glacier with that measured on theCaresèr Glacier was shown in fig. 9 which illustrates a
qualitative and quantitative agreement between the twotime series. A more negative balance for the Caresèr Glac-ier is justified by its lower altitude, ranging from 2860 mand 3310 m a.s.l. and its south-east facing orientation. Themost negative and positive balance years, and also the timeseries of the Equilibrium Line Altitude and AccumulationArea Ratio of the two glaciers, exhibit a similar time pat-tern as shown by the comparison of our data in tab. 3 withthose reported by Carturan & Seppi (2007), with a maxi-mum of the AAR in the year 2000/01 and a maximum ofthe ELA in the year 2002/03 for both glaciers. This meansthat, according to our simulation framework, if the meteo-rological conditions observed over the 1995-2006 periodare representative of the future climate, it is very reason-able to expect that the equilibrium shape and size of theglacier will be much different and smaller than the actualones. Assuming an accumulation area ratio close to 0.5 inequilibrium conditions, it can be projected that only smallglacierised areas over Dosson di Genova and aroundCorno Bianco above 3200 m a.s.l. might survive in the fu-ture. Climate warming, as that projected for this area byseveral Global Circulation Models (see Barontini & alii,2009) would further reduce the glacier’s areas and possiblylead to a complete disappearance of the Mandrone glacier.
CONCLUSIONS
The mass balance of the Mandrone Glacier, which isthe major hydrographic unit of the largest glacierised areaof the southern Alps, has been evaluated for twelve years,from 1995 up to 2006. The evaluation was performed byapplying the PDSLIM distributed energy balance model,already tested both at the point and at the basin scale indifferent alpine basins. For the model’s setup albedo mapsderived from satellite imagery were adopted, with pointmeasurements used for verification. Even if some precipi-tation gauges are located at high elevation within thebasin, a corrrection factor for the precipitation value hadto be adopted in order to take into account the observedorographic enhancement of precipitation, a frequent phe-nomenon in mountain areas. A precipitation lapse rate wasthen used to correct 651 mm of observed April to Septem-ber precipitation to 791 mm of corrected precipitation.
A mean value of the annual mass balance of –1290 mmresults, with a high inter-annual variability, which can bewell explained in terms of summer temperature and sum-mer precipitation added to winter mass balance. Only 2%of the glacier’s area has a positive mass balance.
For verification, 86% of the satellite-derived transientsnow-covered area was in agreement with that simulatedby the model eighty days after the model’s initialisation. Anew discharge rating curve for the Sarca di Genova atPonte Maria was calibrated on the basis of seven measure-ments. The resulting summer runoff measurement is high-ly correlated with the simulated snow and ice-melt overthe Mandrone Glacier.
The major uncertainties affecting this type of methodto compute the glacier’s mass balance lay in the precipita-
FIG. 15 - Comparison of the runoff volume measured from April to Sep-tember at the Sarca di Genova at Ponte Maria station and the simulated
snow and ice runoff of the Mandrone Glacier.

59
tion measurements at high altitude and in the definition ofthe initial state of the basin in April. In particular the snowwater equivalent can be affected by avalanches in somesmall areas and in the parameterisation of turbulent fluxes.Developments which are currently in progress include theverification of ablation with a network of ablation stakes,the analysis of eddy-correlation measurements conductedin 2008 and hourly runoff simulated at the Ponte Mariastreamgauge.
With the high negative balance and the climate of therecent years the actual geomorphological condition of theMandrone Glacier is far from an equilibrium and a signifi-cant shrinkage and volume loss of the glacier is expectedfor the near future. The methodology used for this analysiscan be applied considering future climatic scenarios whichwould likely result in even more negative mass balances.
In perspective, this study can be useful also to assesschanges on the runoff and sediment transport regime, aswell as on the impact on downstream hydropower genera-tion capacity and water resources available for irrigationand environment conservation.
REFERENCES
AUER I., BÖHM R., JURKOVIC A., LIPA W., ORLIK A., POTZMANN R.,SCHOENER W., UNGERSBOECK M., MATULLA C., BRIFFA K., JONES P.,EFTHYMIADIS D., BRUNETTI M., NANNI T., MAUGERI M., MERCALLI
L., MESTRE O., MOISSELIN J.-M., BEGERT M., MUELLER-WESTER-MEIER G., KVETON V., BOCHNICEK O., STASTNY P., LAPIN M., SZALAI
S., SZENTIMREY T., CEGNAR T., DOLINAR M., GAJIC-CAPKA M., ZA-NINOVIC K., MAJSTOROVIC Z., & NIEPLOVA E. (2007) - HISTALP - historical instrumental climatological surface time series of the GreaterAlpine Region, International Journal of Climatology, 27, 17-46.
ASTORI B. & TOGLIATTI G. (1964) - Il rilievo aerofotogrammetrico delghiacciaio Pian di Neve (Adamello). Bollettino del Comitato Glaciolo-gico Italiano, serie 2, 11 (1), 33-50.
BARONI C. & CARTON A. (1990) - Variazioni oloceniche della Vedretta del-la Lobbia (Gruppo dell’Adamello Alpi Centrali). Geografia Fisica eDinamica Quaternaria, 13, 105-119.
BARONI C. & CARTON A. (1996) - Geomorfologia dell’alta Val di Genova(Gruppo dell’Adamello Alpi Centrali). Geografia Fisica e DinamicaQuaternaria, 19, 3-17.
BARONI C., CARTON A., MARTINELLI N. & PIGNATELLI O. (1992) - Den-drocronologia e variazioni glaciali oloceniche in Val di Genova (M.Adamello, Alpi Centrali). Nota preliminare. Geografia Fisica e Dina-mica Quaternaria, 15, 30-40.
BARONI C., CARTON A. & SEPPI R. (2004) - Distribution and behaviour ofrock glaciers in the Adamello-Presanella Massif (Italian Alps). Perma-frost and Periglacial Processes, 15 (3), 243-259.
BARONTINI S., GROSSI G., KOUWEN N., MARAN S., SCARONI P. & RANZI
R. (2009) - Impacts of climate change scenarios on runoff regimes inthe southern Alps, Hydrology and Earth System Sciences Discus-sions, 6, 3089-3141.
BENISTON M. (1997) Variations of snow depth and duration in the SwissAlps over the last 50 years: links to changes in large-scale climatic for-cings. Climate Change, 36, 281-300.
BOCCHIOLA D. & ROSSO R. (2007) - The distribution of daily snow waterequivalent in the central Italian Alps, Advances in Water Resources,30, 135-147.
BROCK B.W., WILLIS I.C. & SHARP M.J. (2006) - Measurements and para-metrization of aerodynamic roughness length variation at Haut Glacierd’Arolla, Switzerland. Journal of Glaciology, 52 (177), 281-297.
BRUNETTI M., MAUGERI M. & NANNI T. (2000) Variations of temperatureand precipitation in Italy from 1866 to 1995. Advances in Water Re-sources, 65, 165-174.
CAGNATI A., CREPAZ A., MACELLONI G., PAMPALONI P., RANZI R., TEDE-SCO M., TOMIROTTI M. & VALT M. (2004) - Study of the snow melt-freeze cycle using multi-sensor data and snow modelling. Journal ofGlaciology, 50 (170), 419-426.
CARABELLI E. (1961) - Misure sismiche di spessore del ghiacciaio Pian diNeve (Adamello). Bollettino del Comitato Glaciologico Italiano, serie2, 11 (1), 51-60.
CALMANTI S., MOTTA L., TURCO M. & PROVENZALE A. (2007) - Impact ofclimate variability on Alpine glaciers in northwestern Italy, Internatio-nal Journal of Climatology, 27, 2041-2053.
CARTURAN L. & SEPPI R.(2007) - Recent mass balance results and morpho-logical evolution of Careser Glaciers (Central Alps). Geografia Fisica eDinamica Quaternaria, 30 (1), 33-42.
CITTERIO M., DIOLAIUTI G., SMIRAGLIA C., D’AGATA C., CARNIELLI T.,STELLA G. & SILETTO G.B. (2007) - The fluctuations of Italian gla-ciers during the last century: a contribution to knowledge about Alpineglacier changes. Geografiska Annaler, 89, A3, 164-182.
COMITATO GLACIOLOGICO ITALIANO - C.N.R. (1961) - Catasto dei ghiac-ciai italiani. Anno geofisico 1957-1958. III: Ghiacciai della Lombardiae dell’Ortles-Cevedale, Torino, 389 pp.
C.G.T. - COMITATO GLACIOLOGICO TRENTINO (1994) - I ghiacciai del Par-co Naturale Adamello-Brenta. Catasto a cura del Comitato Glaciolo-gico del Trentino, Parco Adamello Brenta, Nuova Stampa Rapida,Trento, 126 pp.
DENBY B. & GREUELL W. (2000) - The use of bulk and profile methods fordetermining surface heat fluxes in the presence of glacier winds. Jour-nal of Glaciology, 46 (154), 445-452.
DIOLAIUTI G., SMIRAGLIA C., REYNAUD L., D’AGATA C. & PAVAN M.(2002) - Relation entre les bilans de masse de la Sforzellina et ceux desautres glaciers en Europe. Influence des facteurs localisation géographi-que et taille du glacier. La Houille Blanche. vol. 6/7, 1-5.
D.Ö.A.V. - DEUTSCHER UND ÖSTERREICHISCHER ALPENVEREIN (1903) -Karte der Adamello und Presanella Gruppe. Scale 1:50000, Zeitschriftder DÖAV.
FRASSONI A., ROSSI G.C. & TAMBURINI A. (2001) - Studio del ghiacciaiodell’Adamello mediante indagini georadar. Supplemento di GeografiaFisica e Dinamica Quaternaria, V, 77-84.
GIADA M. & ZANON G. (1996) - Elevation and volume changes in the Ca-reser glacier (Ortles-Cevedale group, Central Alps), Zeitschrift fürGletscherkunde und Glazialgeologie, 31, 143-147.
GROSSI G. & FALAPPI L. (2003) - Comparison of energy fluxes at the landsurface-atmosphere interface in an Alpine valley as simulated with dif-ferent models, Hydrology and Earth System Sciences, 7 (6), 920-936.
HOCK R. (1998) - Glacier Melt and discharge: a review of processes andtheir modelling. In Modelling of Glacier Melt and Discharge, ZurcherGeographische Schriften, Heft 70, Geographisches Institut ETH,Zurich.
HOCK R. & HOLMGREN B. (2005) - A distributed surface energy-balancemodel for complex topography and its application to Störglaciaren,Sweden. Journal of Glaciology, 51 (172), 25-36.
IPCC (2007) - Climate Change 2007: Synthesis Report. Contribution ofWorking Groups I, II and III to the Fourth Assessment Report of theIntergovernmental Panel on Climate Change. Core Writing Team, Pa-chauri R.K & Reisinger A. (eds.), IPCC, Geneva, Switzerland.
KARGEL J.S., ABRAMS M.J., BISHOP M.P., BUSH A., HAMILTON G., JISKOOT
H., KÄÄB A., KIEFFER H.H., LEE E.M., PAUL F., RAU F., RAUP B.,SHRODER J.F., SOLTESZ D., STEARNS L., WESSELS R. & THE GLIMSCONSORTIUM (2005) - Multispectral imaging contributions to GlobalLand Ice Measurements from Space. Remote Sensing of Environment,99, 187-219.

60
KASER G., MUNARI M., NOGGLER B., OBERSHIEMD C. & VALENTINI P.(1995) - Ricerche sul bilancio di massa del ghiacciaio di Fontana Bian-ca (Weissbrunnferner) nel gruppo Ortles-Cevedale, Geografia Fisica eDinamica Quaternaria, 18, 277-280.
KASER G., FOUNTAIN A. & JANSSON P. (2003) - A manual for monitoringthe mass balance of mountain glaciers, IHP Technical Documents inHydrology No. 59, UNESCO, Paris, 107 pp.
KLOK E.J. & OERLEMANS J. (2002) - Model study of the spatial distributionof the energy and mass balance of Morteratschgletscher, Switzerland,Journal of Glaciology 48 (163), 505-518.
K.U.K.M.I. - KEISERLICH UND KÖNIGLICH MILITÄRGEOGRAPHISCHES IN-STITUT (1886) - Karte Tione und M. Adamello - Scale 1:75000.
KUHN M. (1979) - Climate and glaciers. In: I. Allison (ed.) «Sea Level,Ice, and Climate Change», IAHS Publications, 131, 3-20.
KUHN M., MARKL G., KASER G., NICKUS U., OBLEITNER F. & SCHNEIDER
H. (1985) - Fluctuations of climate and mass balance: different respon-ses of two adjacent glaciers. Zeitschrift für Gletscherkunde und Gla-zialgeologie, 21, 409-416.
LATERNSER M. & SCHNEEBELI M. (2003) - Long-term snow climate trendsof the Swiss Alps (1931-99), International Journal of Climatology, 23,733-750.
MACELLONI G., PALOSCIA S., PAMPALONI P., BROGIONI M., RANZI R. &CREPAZ A. (2005) - Monitoring of melting refreezing cycles of snowwith microwave radiometers: The Microwave Alpine Snow MeltingExperiment (MASMEx 2002-2003). IEEE Transactions on Geoscien-ce and Remote Sensing, 43 (11), 2431-2441.
MARAGNO D., DIOLAIUTI G., D’AGATA C., MIHALCEA C., BOCCHIOLA
D., BIANCHI JANETTI E., RICCARDI A. & SMIRAGLIA C. (2009) - New evidence from Italy (Adamello Group, Lombardy) for analysing the ongoing decline of Alpine glaciers, Geografia Fisica e Dinamica Qua-ternaria, 32, 31-39.
MARCHETTI V. (1978-1993) - Relazioni delle campagne glaciologiche: Grup-po Adamello-Presanella (versante trentino). Ghiacciai della Lobbia edel Mandron. Geografia Fisica e Dinamica Quaternaria, 1(1) (1978);2 (2) (1979); 3 (2) (1980); 4 (2) (1981); 5 (2) (1982); 7 (2) (1985); 9(1) (1987); 9 (1) (1987); 10 (2) (1988); 11 (2) (1989); 12 (2) (1990); 13(2) (1991); 14 (2) (1992); 15 (1993).
MARCHETTI F. (1999-2004) - Relazioni delle campagne glaciologiche: Ghiac-ciai del Gruppo Adamello-Presanella. Ghiacciaio del Mandron. Geo-grafia Fisica e Dinamica Quaternaria, 22 (2) (1999); 23 (2) (2000); 24(2) (2001); 25 (2) (2002); 26 (2) (2003); 27 (2) (2004).
OHMURA A., KASSER P. & FUNK M. (1992) - Climate at the equilibrium line of glaciers, Journal of Glaciology, 38 (130), 397-411.
PATERSON W.S.B. (1994) - The physics of glaciers, Pergamon Press.
PAUL F., KÄÄB A., MAISCH M., KELLENBERGER T. & HAEBERLI W. (2004)- Rapid disintegration of alpine glaciers observed with satellite data.Geophysical Research Letters, 31, L21402.
PAYER J. (1865) - Die Adamello-Presanella-Alpen nach den Forschungenund Aufnahmen von Julius Payer - Scala 1:56000, Petermann’sGeographischen Mitteilungen, ed. Justus Perthes, Gotha, 11 (17),36 pp.
PLÜSS C. & MAZZONI R. (1994) - The role of turbulent heat fluxes in theenergy balance of high alpine snow cover. Nordic Hydrology, 25, 25-38.
RANZI R. & ROSSO R. (1991) - A physically based approach to modelling distributed snowmelt in a small alpine catchment. In: Bergmann H.,Lang H., Frey W., Issler D. & Salm B. (eds.), «Snow Hydrologyand Forests in High Alpine Areas», IAHS Publications, 205, 141-150.
RANZI R. & ROSSO R. (1995) - Distributed estimation of incoming directsolar radiation over a drainage basin. Journal of Hydrology, 166 (3-4),461-478.
RANZI R., GROSSI G. & BACCHI B. (1999) - Ten years of monitoring arealsnowpack in the Southern Alps using NOAA-AVHRR imagery,ground measurements and hydrological data. Hydrological Processes,13 (12-13), 2079-2095.
RANZI R., GROSSI G., IACOVELLI L. & TASCHNER S. (2004) - Use of mul-tispectral ASTER images for mapping debris-covered glaciers withinthe GLIMS project. International Geoscience and Remote SensingSymposium (IGARSS), 2, 1144-1147.
RANZI R. & TASCHNER S. (2005) - Energy and hydrological balance of theAdamello Glacier as an indication of current climate change, Geophy-sical Research Abstracts, 7, 06404.
SANTILLI M., OROMBELLI G. & PELFINI M. (2002) - Variations of Italianglaciers between 1980 and 1999 inferred by the data supplied by theItalian Glaciological Committee. Geografia Fisica e Dinamica Quater-naria, 25, 61-76.
S.G.L. - SERVIZIO GLACIOLOGICO LOMBARDO (1992) - Ghiacciai in Lom-bardia, Edizioni Bolis, Bergamo, Italy.
SMEETS C.J.P.P., DUYNKERKE P.G., VUGTS H.F., Turbulence characte-ristics of the stable boundary layer over a mid-latitude glacier. Part I: a combination of katabatic and large-scale forcing, Boundary-LayerMeteorology, 87, 117-145, 1998.
SMEETS C.J.P.P., DUYNKERKE P.G. & VUGTS H.F., Turbulence characteri-stics of the stable boundary layer over a mid-latitude glacier. Part II:pure katabatic forcing conditions, Boundary-Layer Meteorology, 97,73-107, 2000.
WGMS (2008) - Global Glaciers changes: facts and figures, Zemp M.,Roer I, Kääb A., Hoelzle M., Paul F., and Haeberli W. (eds),UNEP, World Glacier Monitoring Service, Zurich, Switzerland,88 pp.
ZANON G. (1992) - Venticinque anni di bilancio di massa del ghiacciaio delCareser, 1966-67/1990-91. Geografia Fisica e Dinamica Quaternaria,15, 215-220.
(Ms. presented 10 October 2009; accepted 1 April 2010)