rapala vmc corporation powerpoint master · pdf filerapala vmc corporation highlights february...
TRANSCRIPT

RAPALA VMC CORPORATIONHIGHLIGHTS
February 16, 2018

2

• Great success in testing• Re-entry into the big pike category• Launched in January in France at the Clermont-Ferrand Show• Supported by coordinated & targeted digital marketing• First weekend marketing reach totaled over 300 000 people• Full-on approach with three big pike lures in broad color selections
RAPALA PIKE LURE LAUNCH

RAPALA VMC CORPORATIONFULL YEAR 2017
February 16, 2018
NET SALES(MEUR)
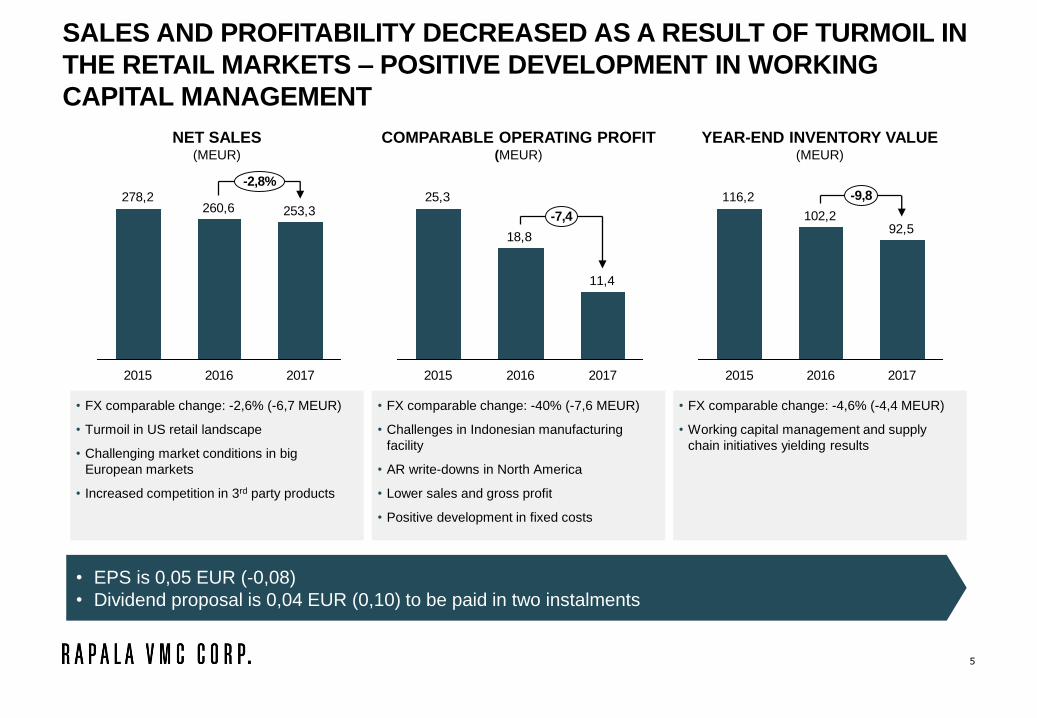
• FX comparable change: -2,6% (-6,7 MEUR)
• Turmoil in US retail landscape
• Challenging market conditions in big
European markets
• Increased competition in 3rd party products
SALES AND PROFITABILITY DECREASED AS A RESULT OF TURMOIL IN
THE RETAIL MARKETS – POSITIVE DEVELOPMENT IN WORKING
CAPITAL MANAGEMENT
5
253,3260,6278,2
2015 2017
-2,8%
2016
COMPARABLE OPERATING PROFIT(MEUR)
• FX comparable change: -40% (-7,6 MEUR)
• Challenges in Indonesian manufacturing
facility
• AR write-downs in North America
• Lower sales and gross profit
• Positive development in fixed costs
YEAR-END INVENTORY VALUE(MEUR)
• FX comparable change: -4,6% (-4,4 MEUR)
• Working capital management and supply
chain initiatives yielding results
11,4
18,8
25,3
201720162015
-7,492,5
102,2
116,2
20172015 2016
-9,8
• EPS is 0,05 EUR (-0,08)
• Dividend proposal is 0,04 EUR (0,10) to be paid in two instalments

6
REST OF EUROPE
• FX comparable change: -6,3% (-5,2
MEUR)
• Disappointing sales figures for big
markets, France and Russia
• Increased competition in certain
product categories, also some
changes in product portfolio in
Poland
REST OF THE WORLD
• FX comparable change: -3,2% (-1,1 MEUR)
• Australia’s sales impacted by changes in
product portfolio and the outsourcing of
warehouse operations
• Thailand suffered from difficult market
conditions
• Sales up in South Africa, supported by new
hunting and outdoor business
• Positive development in Latin America
+2%-6%-6%
NORTH AMERICA
• FX comparable change: +0,2% (+0,2
MEUR)
• Retail turmoil in US – two key customers
filed for chapter 11. The lost sales shifted
to other customers
• Canada well above last year, supported
by special sales campaigns
NORDIC
• FX comparable change: -1,2% (-0,7
MEUR)
• Disappointing 1st half highlighted by
Denmark’s weak hunting sales and
Finland’s unfavorable weather
conditions
• Positive development in the 2nd half,
particularly in Sweden & Norway
• Finland 100 Anniversary Knife
supporting Marttiini’s strong sales
2016 91,3 -2,1%(-1,9)2017 89,4
2017 54,3
2016 -1,7%(-0,9)
55,3
77,6
-4,5%(-3,7)
81,3
2017
2016
-2,2%(-0,7)2017 31,9
2016 32,7
WEAKENED USD PULLED NORTH AMERICA SALES DOWN FROM LAST
YEAR AND BIG MARKETS IN EUROPE DOWN

NET SALES(MEUR)
7
93,5
184,7
88,5
172,1
84,5
168,8
-4,4%
-1,9%
2015 2016 2017
GROUP
PRODUCTS
3RD PARTY
PRODUCTS
• Group fishing products sales down from last year, driven by lure
sales in North America as a consequence of retail turmoil
• Positive development in carp fishing sales followed by the
increased focus and investments in the product category
• Winter fishing sales up from last year, supported by favorable
winter conditions
• Finland 100 Anniversary Knife contributed to hunting sales
• Third party products sales drop driven by product portfolio
changes in Poland and tightened price competition in certain
product categories
COMPARABLE OPERATING PROFIT(MEUR)
3,2
22,2
1,4
17,4
-1,6
13,0
-4,3
-3,0
RETAIL MARKET TURMOIL HIT SALES OF GROUP PRODUCTS AND
THIRD PARTY PRODUCTS
2015 2016 2017
2015 2016 2017
GROUP
PRODUCTS
3RD PARTY
PRODUCTS
2015 2016 2017
• Group products profitability suffered from Indonesian lure
manufacturing challenges, AR write-down in North America and
declined sales
• Third party products operating profit suffered from decreased
sales and increased price competition

Solid financial and operational platform for long term growth
Mid- to long term target is to return to more aggressive growth track
and actively seek synergistic growth opportunities also outside of
fishing tackle business.
• Market and customer focus
• Growth from niches and specific
product categories
• Leveraging Group’s brands with
innovative marketing and brand
management
• Rigid management of product portfolio
• Securing return on capital of all
businesses
• Tight cost and capital control
• Supply chain development
• Operating in an integrated manner
• Optimizing end-to-end performance of
the Group
• Increased speed and agility,
responsiveness and efficiency
• Utilizing strong local presence
Organic growth within
fishing
Improving profitability and
lightening balance sheet
Improving operational
performance
1Competitive advantages
Brand
portfolio2 Own manufacturing
platform and established
sourcing channels
3 Research and
development
capabilities
4 Broad own distribution
network and strong
local presence
Unique competitive advantages form the foundation for Rapala’s strategy
EXECUTION OF GROUP STRATEGY PROGRESSING
• 2017 was a year of market turmoil and structural changes in retail especially in the US. There is still
somewhat lower visibility to the North American market due to the structural changes experienced during
2017. However, the Group sees continued healthy consumer demand for its products via old and new
channels. In Europe, the price competition in certain product categories has increased and the markets
continue to be competitive.
• The Group has launched various strategic initiatives to boost organic growth and improve cost and capital
efficiency as well as operational performance in the future. These initiatives will continue to trigger some
additional expenses and investments in 2018.
• The Group expects full year net sales with comparable FX rates to be above last year’s level and
comparable operating profit (excluding mark-to-market valuations of operative currency derivatives and
other items affecting comparability) to exceed 15 MEUR.
• Financial statements for 2017 and Corporate Governance Statement published in week 10
• Half Year Financial Report 2018 will be published on July 20, 2018.
9
SHORT-TERM OUTLOOK AND GUIDANCE

FINANCIALS

OPERATING PROFIT MARGIN(%)
OPERATING PROFIT(MEUR)
11
21,0
25,3
7,2
18,8
8,9
11,4
+23,6%
-39,2%
2015 2016 2017
COMPARABLE * REPORTED
2015 2016 2017
-2,7 pp.
7,6%7,2%
2,8%
4,5%
+0,7 pp.
9,1%
3,5%
2015 2016 2017
COMPARABLE * REPORTED
2015 2016 2017
COMPARABLE AND REPORTED OPERATING PROFIT
• Comparable* operating profit was 11.4 MEUR (4.5%) for 2017• The effect of translation exchange rates was slightly positive
• Burdened by lower sales, operational challenges at the factory in Indonesia and write-downs of
account receivables in North America
• Despite investments in strategic development areas, which increased fixed costs, Group’s overall fixed
costs decreased from last year
• Reported operating profit included loss of mark-to-market valuation of operative currency
derivatives of 0.3 MEUR. Net expenses of other items affecting comparability included in the
reported operating profit were 2.3 MEUR. 2017 items affecting comparability included mainly
organizational restructuring expenses and restructuring of Batam plant in Indonesia
*excluding mark-to-market valuations of operative currency derivatives and other items affecting comparability

CASH FLOW FROM OPERATIONS(MEUR)
WORKING CAPITAL(MEUR)
12
116,2
136,1
102,2
117,9
92,5104,5
-11,3%
-9,5%
2015 2016 2017
TOTAL WORKING
CAPITALINVENTORY
19,1
26,7
15,6
-28,2%
20162015 20172015 2016 2017
CASH FLOW AND WORKING CAPITAL
• Total working capital decreased to 104.5 MEUR
• Several supply chain management initiatives yielded results
• Despite lower than anticipated sales, inventories decreased to 92.5 MEUR
• Organic decrease 8.0 MEUR (excluding inventory allowance and foreign exchange changes)
• Cash flow from operations was on historically good levels of 19.1 MEUR despite the decrease from
last year’s record levels
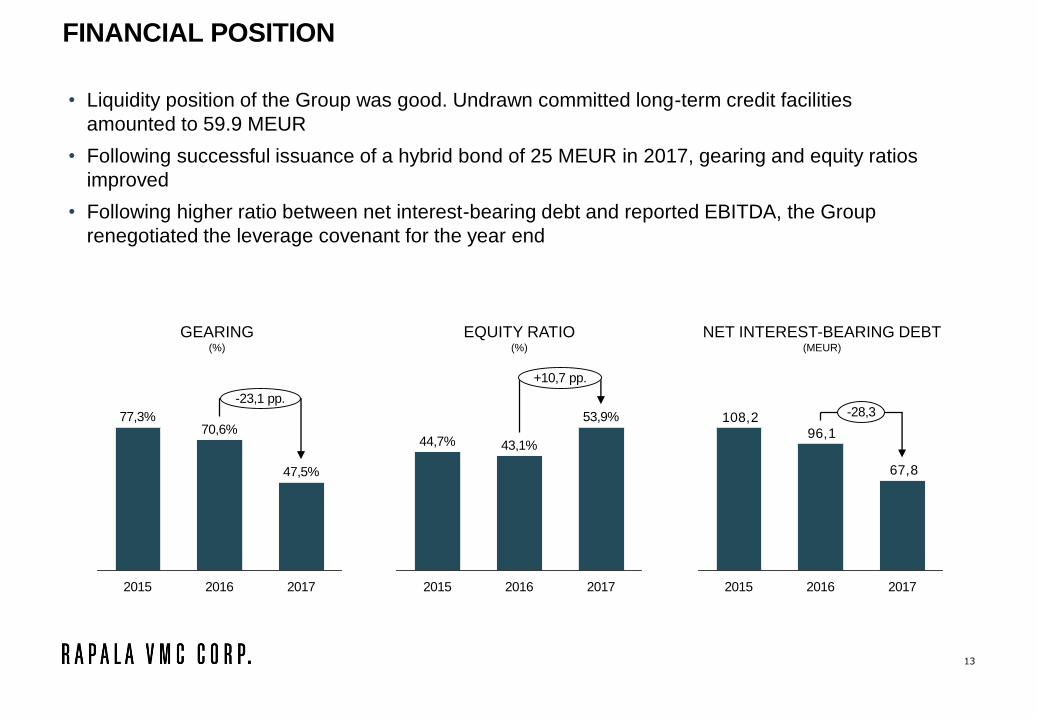
EQUITY RATIO(%)
NET INTEREST-BEARING DEBT(MEUR)
GEARING(%)
13
77,3%70,6%
2015 2017
-23,1 pp.
47,5%
2016
67,8
96,1
108,2
20162015
-28,3
2017
• Liquidity position of the Group was good. Undrawn committed long-term credit facilities
amounted to 59.9 MEUR
• Following successful issuance of a hybrid bond of 25 MEUR in 2017, gearing and equity ratios
improved
• Following higher ratio between net interest-bearing debt and reported EBITDA, the Group
renegotiated the leverage covenant for the year end
2017
+10,7 pp.
43,1%
53,9%
2015
44,7%
2016
FINANCIAL POSITION

APPENDICES
15
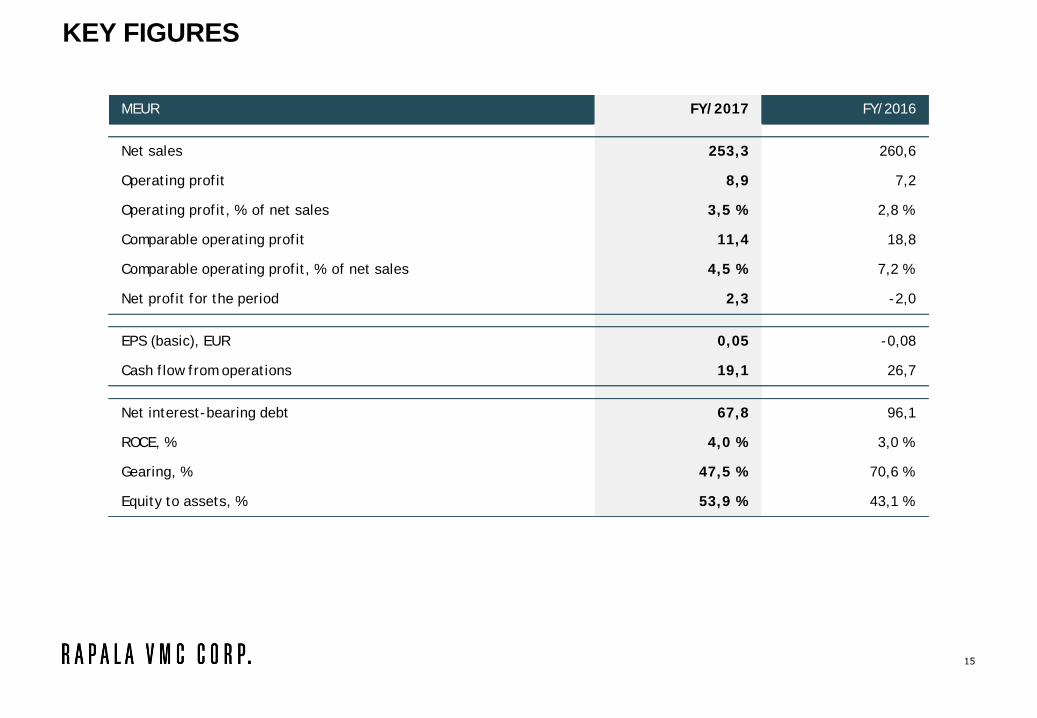
KEY FIGURES
MEUR FY/ 2017 FY/ 2016
Net sales 253,3 260,6
Operat ing prof it 8,9 7,2
Operat ing prof it , % of net sales 3,5 % 2,8 %
Comparable operat ing prof it 11,4 18,8
Comparable operat ing prof it , % of net sales 4,5 % 7,2 %
Net prof it for the period 2,3 -2,0
EPS (basic), EUR 0,05 -0,08
Cash f low f rom operat ions 19,1 26,7
Net interest-bearing debt 67,8 96,1
ROCE, % 4,0 % 3,0 %
Gearing, % 47,5 % 70,6 %
Equity to assets, % 53,9 % 43,1 %
16
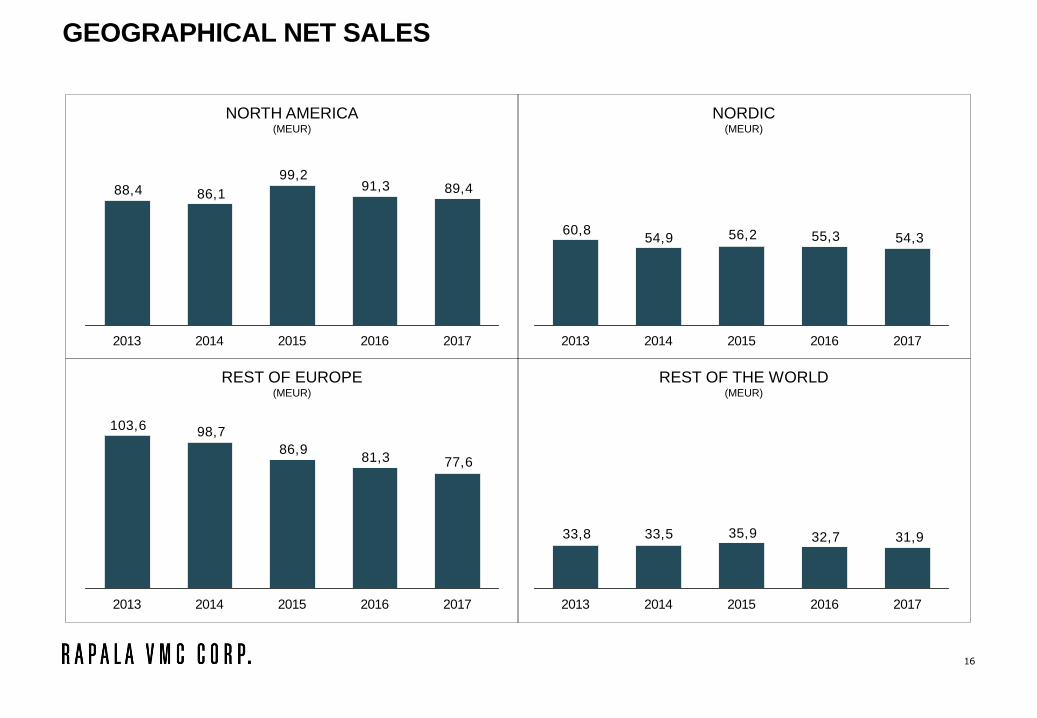
GEOGRAPHICAL NET SALES
REST OF EUROPE(MEUR)
REST OF THE WORLD(MEUR)
NORTH AMERICA(MEUR)
NORDIC(MEUR)
89,491,399,2
86,188,4
20172016201520142013
77,681,386,9
98,7103,6
20172016201520142013
31,932,735,933,533,8
20172016201520142013
54,355,356,254,960,8
20172016201520142013

17
PROFIT AND LOSS STATEMENT
MEUR FY/ 2017 FY/ 2016
Net sales 253,3 260,6
Other operat ing income 1,1 1,3
Materials and services 117,0 129,0
Personnel expenses 67,6 67,6
Other costs and expenses 54,1 51,1
Share of results in associates and joint ventures 0,0 -0,1
EBITDA 15,7 14,1
Depreciat ion, amort izat ion and impairments 6,9 6,9
OPERATING PROFIT (EBIT) 8,9 7,2
Financial income and expenses 3,2 5,0
PROFIT BEFORE TAXES 5,6 2,2
Income taxes 3,3 4,2
NET PROFIT FOR THE PERIOD 2,3 -2,0

18
BALANCE SHEETMEUR FY/ 2017 FY/ 2016
ASSETS
Non-current assets
Intangible assets 73,3 78,2
Propert y, plant and equipment 32,7 36,2
Non-current assets
Interest -bearing 0,0 0,0
Non- interest -bearing 7,1 9,1
113,2 123,5
Current assets
Inventories 92,5 102,2
Current assets
Interest -bearing 0,0 0,9
Non- interest -bearing 49,7 55,8
Cash and cash equivalents 10,3 33,8
152,4 192,7
TOTAL ASSETS 265,6 316,1
EQUITY AND LIABILITIES
Equity
Equit y at t ributable t o t he equit y holders of t he company 110,7 127,5
Non-cont rolling interests 6,9 8,6
Hybrid bond 25,0 0,0
142,7 136,1
Non-current liabilities
Interest -bearing 34,6 41,5
Non- interest -bearing 9,3 11,6
43,9 53,1
Current liabilities
Interest -bearing 43,5 89,3
Non- interest -bearing 35,5 37,6
79,0 126,9
TOTAL EQUITY AND LIABILITIES 265,6 316,1
19
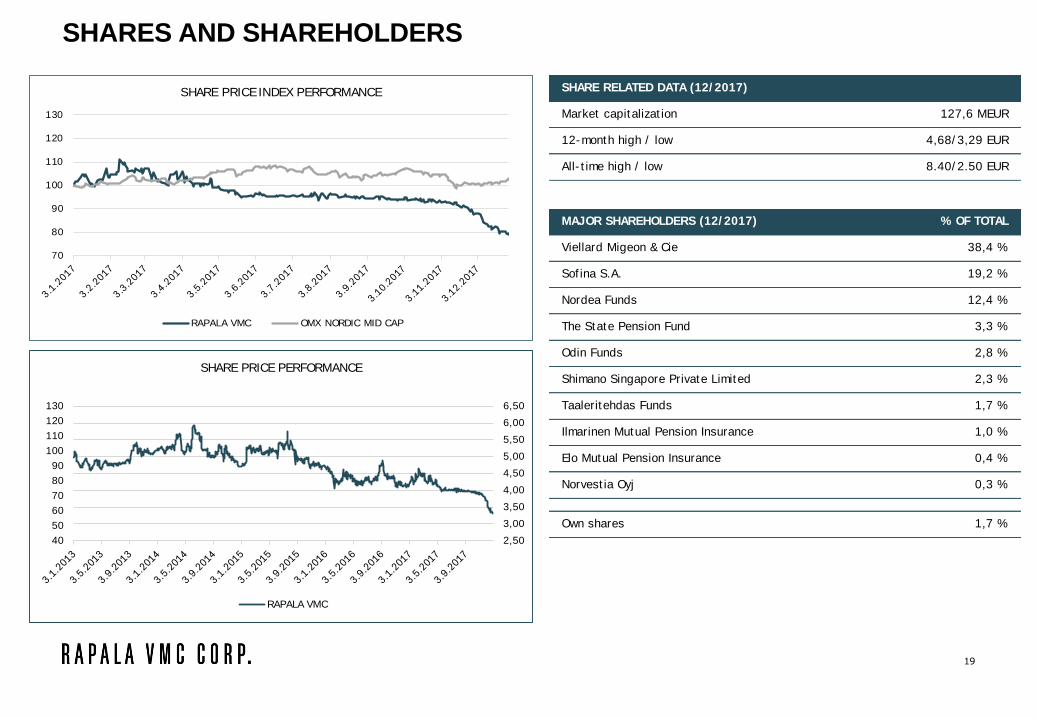
SHARES AND SHAREHOLDERS
SHARE RELATED DATA (12/ 2017)
Market capitalizat ion 127,6 MEUR
12-month high / low 4,68/ 3,29 EUR
All- t ime high / low 8.40/ 2.50 EUR
MAJOR SHAREHOLDERS (12/ 2017) % OF TOTAL
Viellard Migeon & Cie 38,4 %
Sof ina S.A. 19,2 %
Nordea Funds 12,4 %
The State Pension Fund 3,3 %
Odin Funds 2,8 %
Shimano Singapore Private Limited 2,3 %
Taaleritehdas Funds 1,7 %
Ilmarinen Mutual Pension Insurance 1,0 %
Elo Mutual Pension Insurance 0,4 %
Norvest ia Oyj 0,3 %
Own shares 1,7 %
70
80
90
100
110
120
130
SHARE PRICE INDEX PERFORMANCE
RAPALA VMC OMX NORDIC MID CAP
40
50
60
70
80
90
100
110
120
130
2,50
3,00
3,50
4,00
4,50
5,00
5,50
6,00
6,50
SHARE PRICE PERFORMANCE
RAPALA VMC
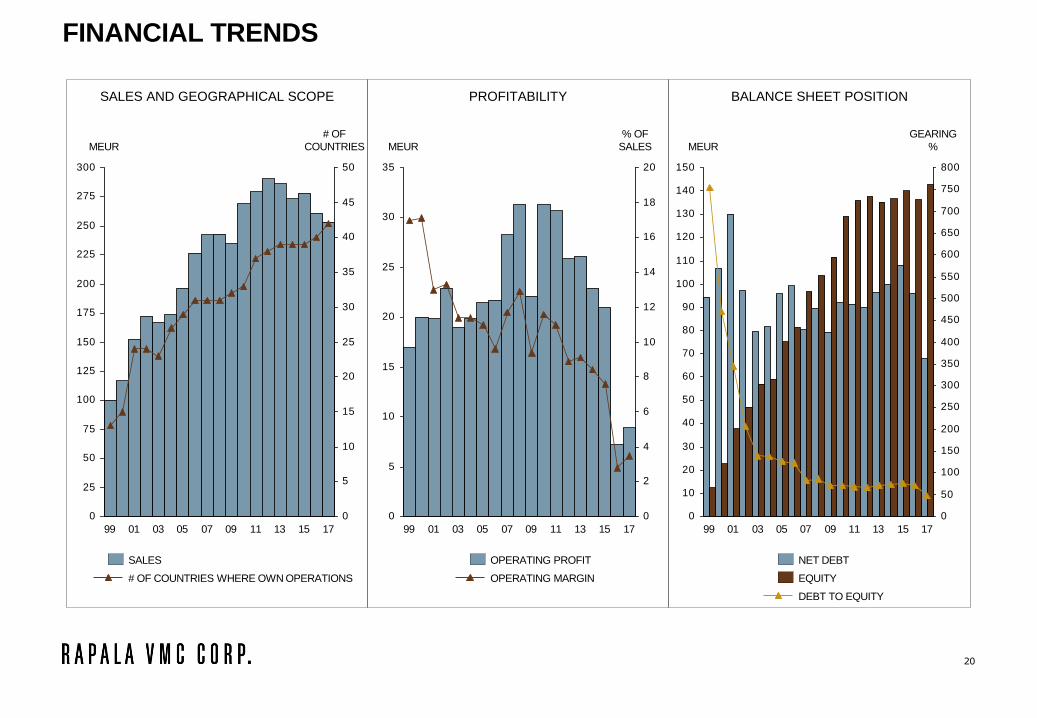
BALANCE SHEET POSITIONSALES AND GEOGRAPHICAL SCOPE PROFITABILITY
20
FINANCIAL TRENDS
0
25
50
75
100
125
150
175
200
225
250
275
300
0
5
10
15
20
25
30
35
40
45
50
MEUR
0199 15090503 1107 1713
# OF
COUNTRIES
SALES
# OF COUNTRIES WHERE OWN OPERATIONS
0
5
10
15
20
25
30
35
0
2
4
6
8
10
12
14
16
18
20
MEUR
% OF
SALES
09 131105030199 171507
OPERATING MARGIN
OPERATING PROFIT
0
10
20
30
40
50
60
70
80
90
100
110
120
130
140
150
0
50
100
150
200
250
300
350
400
450
500
550
600
650
700
750
800
GEARING
%
150905 1711 1307
MEUR
0199 03
DEBT TO EQUITY
EQUITY
NET DEBT