rapid and accurate forensics analysis using high ... · authors martin josefsson, and markus roman...
TRANSCRIPT

AuthorsMartin Josefsson, and Markus RomanNational Board of Forensic MedicineLinköping, Sweden
Bernhard Wüst, Stephen Madden, Tiffany Payne, and Lester TaylorAgilent Technologies, Inc.Santa Clara, California
Rapid and Accurate Forensics Analysis using High Resolution All Ions MS/MS
Application NoteForensic Toxicology
AbstractThis application note describes the use of the All Ions MS/MS technique to rapidly screen and identify drugs of forensic toxicological interest.
The analytical method based on a published paper 1 uses a high resolution TOF or Q-TOF mass spectrometer to quickly and easily analyze samples, determine whether target compounds are present, and at what concentration. Blood samples fortifi ed with a 30 compound test mixture at a concentration of 0.1 µg/g in replicates (n=3) were analyzed using an LC-TOF instrument with All Ions MS/MS software processing tools to validate the effectiveness of the technique for rapid generation of accurate results, despite the presence of similar and isomeric compounds at different concentrations. In addition, two post-mortem blood samples were analyzed to test the capability of All Ions MS/MS for the identifi cation of isobars and isomers. By combining MS and MS/MS experiments and using All Ions MS/MS, users experience increased analytical speed and accuracy, signifi cantly improved identifi cation of compounds of interest, and increased productivity in forensic toxicology laboratories. Laboratories that analyze panels of drugs can import All Ions MS/MS results directly into their MassHunter Quantitative Analysis software for more productive compound identifi cation and quantifi cation.

2
IntroductionThe demand for greater analytical productivity combined with legally defensible results for the screening of forensic samples have placed substantial demands on traditional analytical techniques. Scientists analyzing target drugs in forensic toxicology investigations require high quality results quickly. The analytical results must also withstand legal scrutiny. Given this, forensic laboratories must have high confidence in their results.
The Agilent All Ions MS/MS software for high resolution accurate mass data enables screening and identifi cation of compounds in a single analytical run. The technique uses both accurate mass TOF or Q-TOF LC/MS instruments and features easy setup of analytical methods, verifi cation of the compounds using MS/MS spectral libraries and chromatographic coelution of the precursor and product ions. It is also possible to include product ions as qualifi ers. Identifi cation of specifi c isomers is achieved by using retention time information and assessing the quality of product ion chromatograms.
HPLC conditionsUHPLC column Acquity UPLC, HSS T3, 2.1 mm × 150 mm, 1.8 µmMobile phase A: 10 mM ammonium formate + 0.05% formic acid in water
B: 0.05% formic acid in acetonitrileGradient program Min % B
0 1%0.6 1%0.7 5%8.0 50%10.0 95%11.0 95%11.1 1%
Stop time 12.0Flow rate 0.5 mL/min
Ion source parametersGas temperature 300 °CGas fl ow 6 L/minNebulizer 35 psiSheath gas temperature 375 °CSheath gas fl ow 10 L/minMS parameters (MS-mode)Scan range 50–1,000 amuScan rate 1.5 spectra/sAll Ions MS/MS modeThree scan segments at 0 eV, 20 eV, and 40 eVScan range 50–1,000 amuScan rate 3 spectra/sInternal referenceAutomatic internal reference mass correction was applied using purine (m/z 121.0509) and HP 921 (m/z 922.0098).
ExperimentalAuthentic post-mortem blood samples were prepared using liquid/liquid extraction with acetonitrile/ethanol 90/10 (250 mg blood + 500 µL extraction solvent). An 2 µL aliquot of this extract was injected.
In order to compare results from MS and All Ions MS/MS experiments, a 30-compound test standard and a bloodsample spiked at 0.1 µg/g were used.

3
Results and DiscussionThe data were analyzed using the Find by Formula (FbF) algorithm in MassHunter Qualitative Analysis rev. B.06.00. FbF evaluates a chemical formula and determines if a compound with that formula is present in the high resolution mass spec data. This approach uses a modified version of the FbF algorithm which supports the All Ions MS/MS technique. Mass peaks in the low energy channel are first searched against the Forensic Toxicology Personal Compound Database and Library (PCDL) rev. B.04.01 (aka Broecker, Herre & Pragst MS/MS library, version 4.1) for compounds which have the same m/z values. Figure 1 shows that FbF was able to identify zopiclone in the sample and automatically extract corresponding chromatograms for the precursor and one of the fragments. The compound spectrum for zopiclone was also extracted and showed excellent isotope matching. The isotopic cluster was displayed with a red overlay, indicating the theoretical abundance and spacing.
Once the search is complete, a set of putative identifications is automatically compiled. For this compiled list of compounds, the fragment ions in the MS/MS spectra from the PCDL are compared to the ions detected in the high energy channel in order to confirm the presence of the correct fragments. Figure 2 shows an extracted spectrum of a high energy scan of zopiclone with its fragments noted.
×105
A
B
C
×104
0123456 4.908
00.5
11.5
22.5
4.899
Acquisition time (min)
Coun
tsCo
unts
4.78 4.80 4.82 4.84 4.86 4.88 4.90 4.92 4.94 4.96 4.98 5.00 5.02 5.04 5.06 5.08 5.10
00.20.40.60.8
11.21.41.61.8
22.2 389.1129
(M+H)+
391.1104(M+H)+
390.1157(M+H)+
392.1131(M+H)+ 393.1152
(M+H)+394.1209(M+H)+
Mass-to-charge (m/z)
Coun
ts
388 389 390 391 392 393 394 395 396
×105
Figure 1. FbF identifi cation of zopiclone. A) Extracted Ion Chromatogram (EIC) of zopiclone molecular ion, B) EIC of one of the fragments of zopiclone, and C) extracted spectrum of zopiclone with isotope matching information.
Figure 2. High energy spectrum of zopiclone.
0
1
2
3
4
5
6
7
8
9
245.0229
217.0277
85.0287 121.0509
411.0944
304.2123
25 50 75 100 125 150 175 200 225 250 275 300 325 350 375 400 425
×104
Mass-to-charge (m/z)
Coun
ts
4
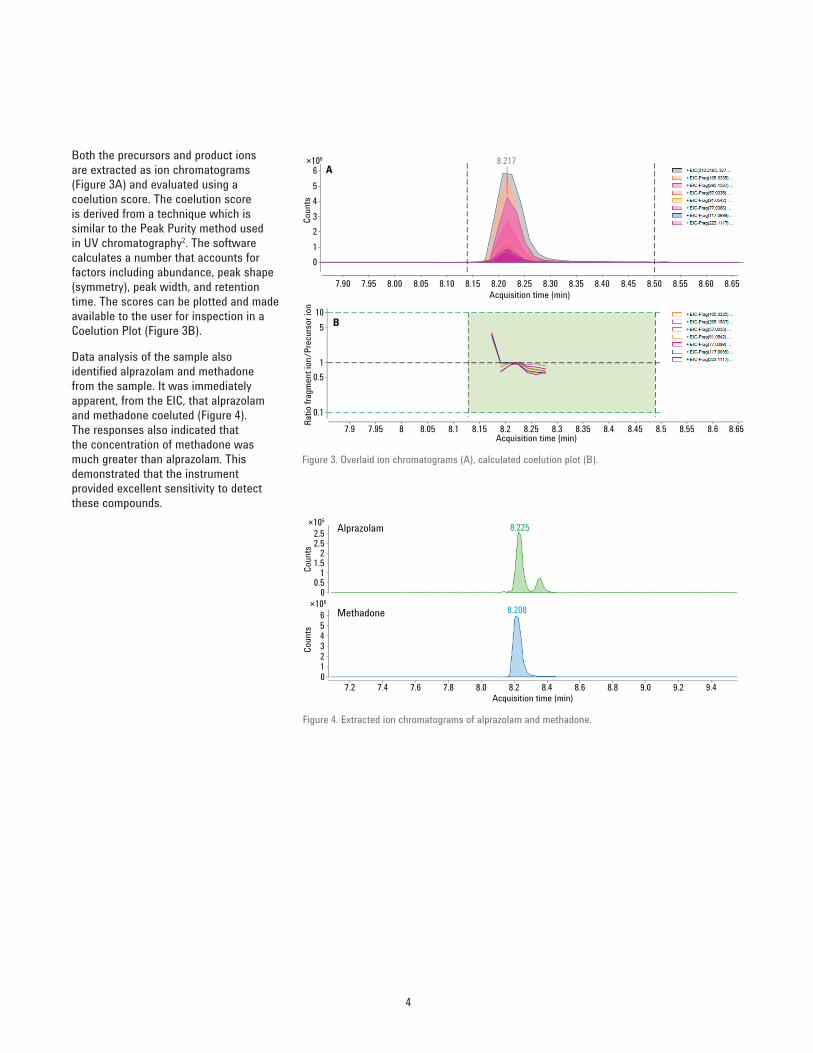
Both the precursors and product ions are extracted as ion chromatograms (Figure 3A) and evaluated using a coelution score. The coelution score is derived from a technique which is similar to the Peak Purity method used in UV chromatography2. The software calculates a number that accounts for factors including abundance, peak shape (symmetry), peak width, and retention time. The scores can be plotted and made available to the user for inspection in a Coelution Plot (Figure 3B).
Data analysis of the sample also identifi ed alprazolam and methadone from the sample. It was immediately apparent, from the EIC, that alprazolam and methadone coeluted (Figure 4). The responses also indicated that the concentration of methadone was much greater than alprazolam. This demonstrated that the instrument provided excellent sensitivity to detect these compounds.
0123456
8.217
7.90 7.95 8.00 8.05 8.10 8.15 8.20 8.25 8.30 8.35 8.40 8.45 8.50 8.55 8.60 8.65
0.1
0.51
510
Acquisition time (min)
Ratio
frag
ment
ion/
Prec
urso
r ion
7.9 7.95 8 8.05 8.1 8.15 8.2 8.25 8.3 8.35 8.4 8.45 8.5 8.55 8.6 8.65
×106
Acquisition time (min)Co
unts
A
B
Figure 3. Overlaid ion chromatograms (A), calculated coelution plot (B).
Figure 4. Extracted ion chromatograms of alprazolam and methadone.
×105
00.5
7.2
Alprazolam 8.225
8.208Methadone
7.4 7.6 7.8 8.0 8.2 8.4 8.6 8.8 9.0 9.2 9.4
11.5
22.52.5
×106
0123456
Acquisition time (min)
Coun
tsCo
unts

5
Since methadone and alprazolam have similar precursor ion values (m/z 309.088 and 310.217), it may appear diffi cult to distinctly identify either compound (Figure 5). Using another high resolution accurate mass technique, for example, targeted MS/MS or data-dependent MS/MS would have produced a mixed MS/MS spectrum that was diffi cult to interpret. However, an examination of the coelution scores and plots automatically generated by the All Ions MS/MS software clearly identifi ed the compounds in the sample using both fragment ions from the PCDL and information for their isotopic clusters. Figure 6A shows that the software was able to match seven fragment ions from methadone with coelution scores better than 90. The extracted compound spectrum also showed perfect isotope match for the molecular ion (Figure 6B). Alprazolam was also easily identifi ed based on > 90 coelution scores for two of its fragments and excellent match of the m/z value plus the isotopic pattern (Figure 7).
Figure 5. Mass spectrum of alprazolam and methadone.
0
0.5
1
1.5
2
2.5
3
3.5
4
4.5
5
5.5
6
6.5
*310.2201
311.2204
312.2239309.0906 313.2264310.7490 311.7416
309 309.5 310 310.5 311 311.5 312 312.5 313 313.5 314
Methadone
Alprazolam
Mass-to-charge (m/z)
Coun
ts
×106
Figure 6A. Methadone with seven qualifi ed fragments with coelution scores > 90.
0
0.2
0.4
0.6
0.8
1
1.2
310.2168(M+H)+
311.2203(M+H)+
312.2231(M+H)+ 313.2287
(M+H)+
310 310.5 311 311.5 312 312.5 313 313.5Mass-to-charge (m/z)
Coun
ts
×105
Figure 6B. Isotopic matching of methadone where red box shows theoretical isotope abundance and position.
6
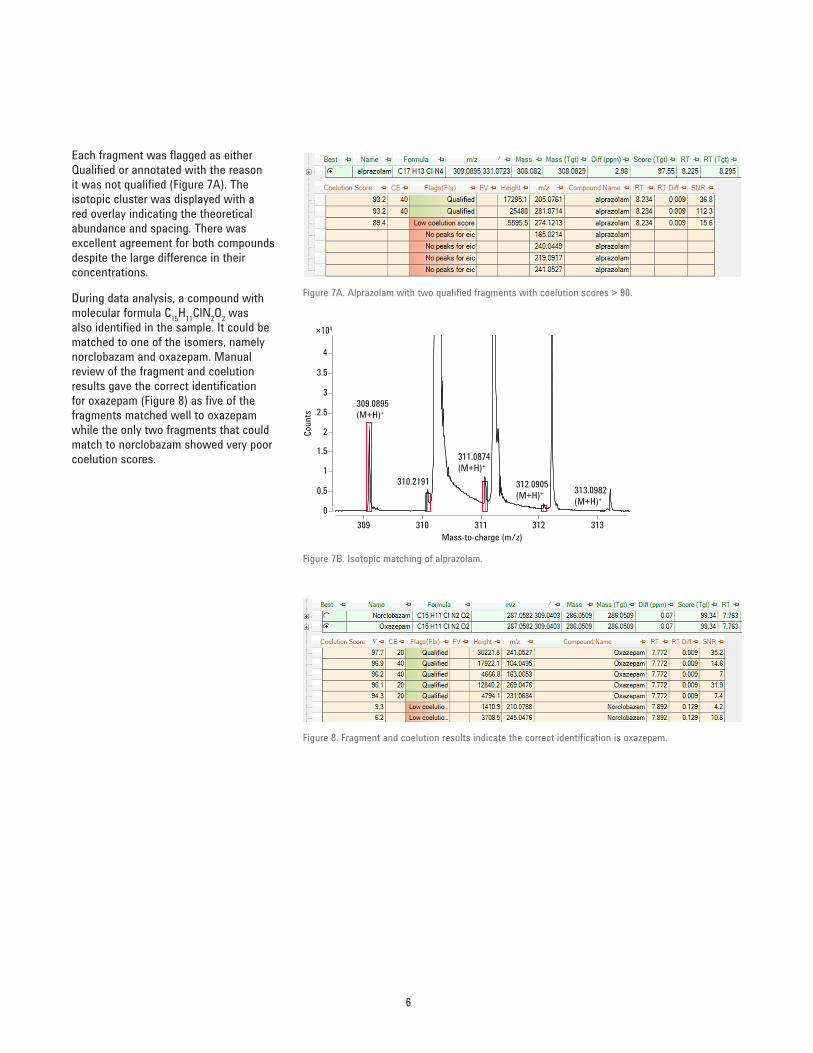
Each fragment was fl agged as either Qualifi ed or annotated with the reason it was not qualifi ed (Figure 7A). The isotopic cluster was displayed with a red overlay indicating the theoretical abundance and spacing. There was excellent agreement for both compounds despite the large difference in their concentrations.
During data analysis, a compound with molecular formula C15H11ClN2O2 was also identifi ed in the sample. It could be matched to one of the isomers, namely norclobazam and oxazepam. Manual review of the fragment and coelution results gave the correct identifi cation for oxazepam (Figure 8) as fi ve of the fragments matched well to oxazepam while the only two fragments that could match to norclobazam showed very poor coelution scores.
Figure 7A. Alprazolam with two qualifi ed fragments with coelution scores > 90.
Figure 7B. Isotopic matching of alprazolam.
0
0.5
1
1.5
2
2.5
3
3.5
4
310.2191
309.0895(M+H)+
311.0874(M+H)+
312.0905(M+H)+ 313.0982
(M+H)+
309 310 311 312 313Mass-to-charge (m/z)
Coun
ts
×104
Figure 8. Fragment and coelution results indicate the correct identifi cation is oxazepam.

7
Results of the analysis can be reviewed within two modules of the Qualitative Analysis software: Navigator View, which allows the viewing of multiple data fi les chosen from a Data Navigator window, and Compound Details View (Figure 9), which shows identifi cation results, coelution plots, MS, and fragment spectra for one compound at a time. Users are able to manually review and change compound selections in the Compound Details View by browsing through them in the Compound List.
Figure 9. Compound Details View.
Compound list
Library match results
MS spectrumOverlaid chromatograms
Coelution plot Fragment spectrum
ConclusionsDrugs of interest in forensic toxicology investigations have been used to demonstrate the analytical utility of the All Ions MS/MS software capability in MassHunter. We rapidly generated a data processing method for high resolution accurate mass data from a Q-TOF mass spectrometer. The All Ions MS/MS method was used to screen for the presence of target compounds. These compounds were identifi ed fi rst using the accurate mass and isotopic pattern of the precursor ion, and then confi rmed using the associated fragment ions.
The All Ions MS/MS approach enables easier method setup, more sophisticated data processing, and results in more confi dence in target compound identifi cations. Overall this leads to a more productive analysis. Moreover, the data can be reanalyzed to look for additional compounds without the need to reinject samples. The Compound Details View summarizes important compound information in a single window which makes data review much easier. With these tools, large batches of sample results can be processed and reviewed quickly for even greater productivity.

www.agilent.com/chem/QQQ
For Forensic Use.
This information is subject to change without notice.
© Agilent Technologies, Inc., 2013 Published in the USA, May 6, 2013 5991-2319EN
References1. Roman, Markus et al. Liquid
chromatography/time-of-fl ight massspectrometry analysis of postmortemblood samples for targetedtoxicological screening. Anal BioanalChem 2013, DOI 10.1007/s00216-013-6798-0.
2. Sievert, Hans-Jürgen P.; Drouen,Anton C.J.H.;. Spectral matchingand peak purity in Diode ArrayDetection in High Performance LiquidChromatography. 51-125, New York:Marcel Dekker. 1993.