rapid estimation of the energy content of composite...
TRANSCRIPT

18 Asia Pac J Clin Nutr 2016;25(1):18-25
Short Communication Rapid estimation of the energy content of composite foods: the application of the Calorie Answer™ Evelyn Lau BSc1, Hui Jen Goh BSc1, Rina Quek BSc1, Siang Wee Lim BSc1, Jeyakumar Henry PhD1,2 1Clinical Nutrition Research Centre, Singapore Institute for Clinical Sciences, Singapore 2Department of Biochemistry, National University of Singapore, Singapore
The estimation of calories in foods is central in the maintenance of body weight and energy regulation. Conven-tional laboratory analysis using bomb calorimetry to determine calorie content is expensive and time-consuming. There is a need to explore alternative techniques for calorie estimation that requires less processing and resources. The potential of using near infrared spectroscopy for calorie measurements with Calorie Answer™ was evaluated in this study. The caloric content of 105 different foods was measured, and compared against values reported on nutrition labels. The average percentage relative standard deviation for triplicate measurements was 1.7% for all foods. The percentage difference between stated and measured calories was modest, at 4.0% for all foods. Stated and measured calorie contents were significantly and highly correlated (R2=0.98, p<0.001). The use of near infra-red spectroscopy, using Calorie Answer™, is a rapid, reproducible and cost-effective way of measuring calorie content in a diverse range of foods. Its application in many parts of Asia Pacific and other emerging nations will generate much needed information on the calorie content of complex foods consumed by people living in these regions.
Key Words: calories, food composition, nutrition labels, near infrared spectroscopy, non destructive food analysis INTRODUCTION The estimation of calories in foods is central in the maintenance of body weight and energy regulation. There is a paucity of information on the calorie content of com-posite foods consumed in the Asia-Pacific and other re-gions in Africa and South America. Indeed, a global chal-lenge is to generate reliable and reproducible information on the calorie content of foods consumed. The current methods for estimating gross energy content of simple and composite food is based on the use of the bomb calo-rimetry. Bomb calorimetry directly measures the heat of combustion of a food and thus gives a value for gross energy.1 The gross energy is then corrected for the digest-ibility of foods (subtracting off calories excreted in urine and stools), yielding the metabolizable energy of foods.
Given how tedious, time consuming and high expenses related to the use of bomb calorimetry are, recent years have witnessed a resurgence of instruments to measure the metabolizable energy of foods. A relatively new tech-nique is the use of near infrared (NIR) spectroscopy. NIR spectroscopy uses the spectral range from 780 to 2500 x 10-9m.2 The primary constituents in foods consist of C-H, O-H and N-H groups, and these functional groups absorb energy at specific wavelength regions in the NIR spectral range.3 NIR spectroscopy can thus be used for estimating the protein, fat, carbohydrate and water content of food, which in turn is used to determine the metabolizable en-ergy of the food system. The associated advantages with NIR spectroscopy are that it is a rapid and non-destructive method; there is minimal sample preparation involved
and it requires no solvent extraction or reagent prepara-tion.
The Calorie Answer™ was developed by Joy World Pacific Co., Ltd (JWP, Japan) in 2002. This machine uti-lizes NIR spectroscopy and is calibrated against energy content of foods being derived from standard methods of analysis. The user merely selects the appropriate settings for accurate analysis as each sub-type takes into account the food matrix effect (Supplementary Table 1). The in-built computer software performs calculations to deter-mine the calorie content of the food. Previously reported studies using NIR spectroscopy include measurement of dietary fiber in cereal products and mixed meals,3-5 pre-diction of fat and protein content,6-11 and calorie content measurement in foods.12-14 The objective of this study was specifically to measure the calorie content of various types of food with NIR spectroscopy using the Calorie Answer™. The potential of using Calorie Answer™ for reliable caloric measurements was evaluated by compar-ing it with stated values provided on nutrition labels.
Corresponding Author: Dr Jeyakumar Henry, Clinical Nutri-tion Research Centre, Singapore Institute for Clinical Sciences, 14 Medical Drive, #07-02, Singapore 117599. Tel: +65 6407 0793; Fax: +65 6774 7134 Email: [email protected] Manuscript received 23 January 2015. Initial review completed 23 January 2015. Revision accepted 09 February 2015. doi: 10.6133/apjcn.2016.25.1.14

Rapid estimation of food energy using Calorie Answer™ 19
MATERIALS AND METHODS Samples and sample preparation One hundred and five food products of well-known brands were selected to represent a wide range of foods that are commonly consumed locally in Singapore. These food products were purchased from supermarkets and were categorized as: (1) grains, (2) liquids, (3) prepared foods and (4) snacks and confectionery. All items were purchased between June to September 2014.
Frozen mixed meals were heated according to the in-structions available from food packaging. The food sam-ples were homogenized immediately with a kitchen blender (BL 480, Kenwood, United Kingdom) to obtain a smooth and consistent texture. Other types of food were removed from their packaging and homogenized with a grinder (WSG 30, Waring, USA). Liquid samples were well-shaken before analysis. All samples were allowed to equilibrate to room temperature (20-25oC) before NIR analysis. NIR spectroscopy Near-infrared spectra of homogenized samples were ob-tained with Calorie Answer™ (CA-HM, JWP, Japan) over a wavelength range from (1100–2200)×10-9 m with a resolution of 7.5×10⁻⁹ m and a data interval of 2.0×10⁻⁹ m. The main components of the instrument include: a halo-gen lamp as radiation source; acousto-optic tunable filter (AOTF) as wavelength selector, and light receiving sen-sors as light detectors. The reflectance mode and trans-mittance mode were used for solid and liquid samples respectively. Reference reflectance data was obtained with a calcium carbonate filled cell, and reference trans-mittance data was obtained with air. Triplicates of each sample were scanned in cylindrical sample cells (internal diameter=0.05 m, depth=0.01 m for solid sample holders; internal diameter=0.022 m and depth=0.002 m for liquid sample holders). The relevant setting for analysis was selected for each food product. The inbuilt computer software (CA-HM Measurement Application Software, JWP, Japan) was set so that each triplicate portion was scanned 10 times, which were then averaged to give a mean spectrum for improved accuracy. The data were transformed into log 1/R and calorie content for each sample was then calculated in accordance with regression expressions pre-programmed in the software. The regres-sion expression used depended on the selected setting for analysis. The available settings, as well as the measure-ment range, are presented in Supplementary Table 1. The analysis time for each measurement (including time for
calibration) took about 5 minutes. Statistical analysis Mean measured calorie content was calculated as the av-erage of triplicate measurements. Data was represented as mean ± standard deviation (SD). The percentage relative standard deviation (%RSD) of triplicate measurements was determined using the following formula: %RSD=(SD of triplicate measurements) / (mean of triplicate meas-urements)×100. The percentage difference between stated and measured calorie values was calculated by: (Stated Calorie–Average Measured Calorie) / Stated Calorie×100. Wilcoxon signed rank test and paired sample t-test were conducted to compare measured calorie contents with stated calorie contents for individual categories and for all foods respectively. Pearson’s correlation coefficient (r) was used to examine the correlation between stated and measured calorie contents. The Bland-Altman analysis was used to evaluate the validity of comparing measured calorie content with stated calorie content. A range of agreement was defined as mean bias±2×SD. Statistical analyses were performed using SPSS software (version 16.0, USA). A p value of <0.05 was considered to be sta-tistically significant. RESULTS One hundred and five foods were purchased in Singapore and analyzed for their calorie contents using the NIR spectroscopy with Calorie Answer™. The %RSD value was used to assess the reproducibility of the technique (Table 1). Calorie Answer™ was found to give reproduc-ible results, with an average %RSD value of 1.7% for triplicate measurements for all foods measured (minimum: 0%, median: 1.1%, maximum: 12.8%). Snacks and con-fectionery showed the lowest %RSD, followed by grains, liquids and prepared foods.
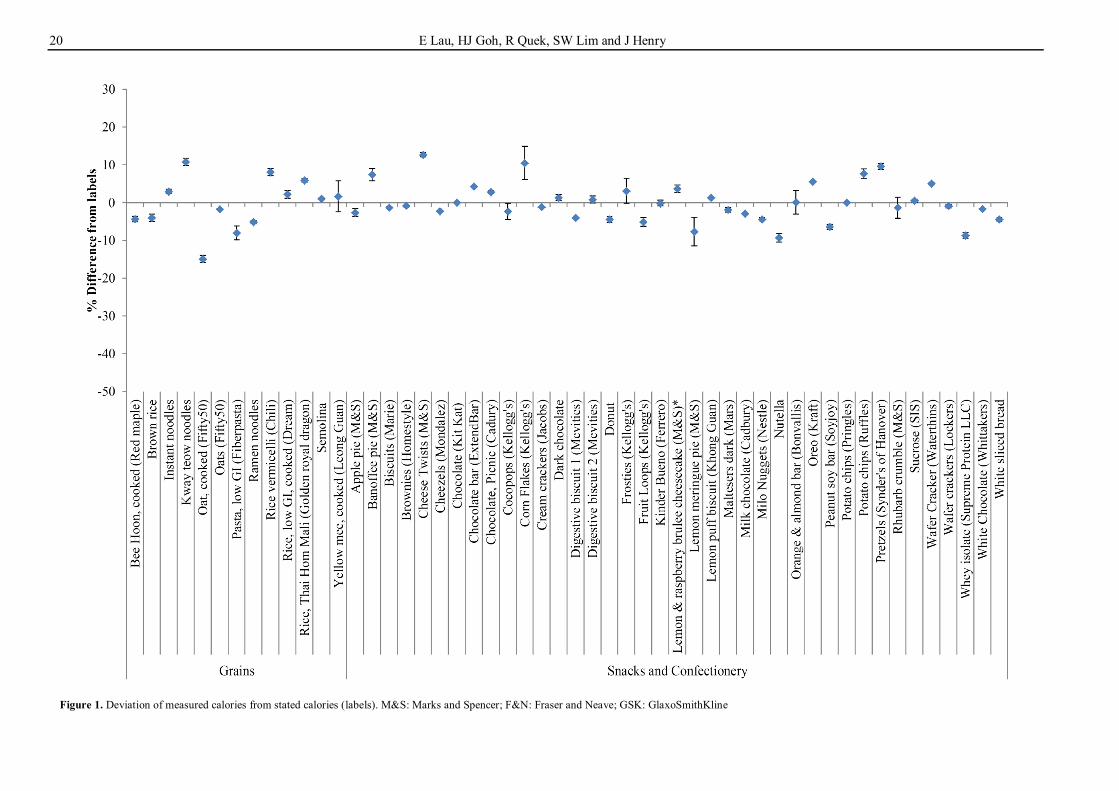
The percentage difference between stated and meas-ured calorie contents for various categories of food are shown in Figure 1. The average percentage difference between stated and measured calories was used to assess the accuracy of the instrument (Table 1). The measured calorie content was found to be 4.0% deviant from the stated values when all foods were considered. When indi-vidual categories of food were looked at, there were no significant differences for grains (p=0.916), snacks and confectionery (p=0.666), and liquids (p=0.071). Prepared food was found to have slightly higher measured calorie contents of 8.05% as compared to stated values from the nutritional labels (p<0.001).
Table 1. Estimation of metabolizable energy of foods by Calorie Answer™
Category n Range Average % difference (Stated-Measured)
%RSD (for triplicate
measurements) p-value Pearson
correlation
Grains 13 107-417 -0.43 1.02 0.916 0.99** Snacks and confectionery 39 198-593 0.07 0.97 0.666 0.97** Liquids 12 22-330 -7.02 1.63 0.071 0.98** Prepared foods 41 88-619 -8.05 2.53 <0.001* 0.97** All food 105 22-619 -3.97 1.66 <0.001* 0.99**
Measured and stated calorie contents were compared using Wilcoxon signed rank test for individual food categories, and paired sample t-test for all foods (*p<0.001). All Pearson correlations were found to be significant (**p<0.001).
20 E Lau, HJ Goh, R Quek, SW Lim and J Henry
Figure 1. Deviation of measured calories from stated calories (labels). M&S: Marks and Spencer; F&N: Fraser and Neave; GSK: GlaxoSmithKline

Rapid estimation of food energy using Calorie Answer™ 21
Figure 1. Deviation of measured calories from stated calories (labels). M&S: Marks and Spencer; F&N: Fraser and Neave; GSK: GlaxoSmithKline (cont.)

22 E Lau, HJ Goh, R Quek, SW Lim and J Henry
The Pearson correlation coefficient (r) was used to de-scribe the relationship between stated and measured calo-rie contents (Table 1). Statistically significant strong cor-relations were found for all categories (p<0.001). The highest correlation was seen for grains (r=0.99), liquids (r=0.98), followed by snacks and confectionery (r=0.97), and prepared foods (r=0.97). On the whole, a statistically significant relationship was observed between stated and measured calorie contents for all foods that were analyzed (R2=0.98, p< 0.001).
A Bland-Altman analysis was also carried out to evalu-ate the validity of comparing calorie content results be-tween stated and measured values (Figure 2). It was found that 91.4% of the data was within±2×SD. of mean difference between stated and measured calorie content, indicating that they were fairly comparable. DISCUSSION The main objective of this study was to measure the calo-rie content of food products using the Calorie Answer™ and to assess the accuracy by comparing the measured values with the stated values on nutrition labels. Food products from renowned multi-national companies were purchased for this study in order to provide a basis for comparison. The stated calorie contents on nutritional labels of these products were taken to be reference values for our comparison. This was in order to validate the reli-ability of the Calorie Answer™. The precision of Calorie Answer™ was found to be excellent. Only 5 out of the 105 foods analyzed had % relative standard deviation values of more than 5%. These food items were blueberry jam, strawberry jam (Mackays), chili sauce, peanut butter and baked beans. This was largely due to the lack of ho-mogeneity of the mixtures after blending. Snacks and confectionery, as well as grains and liquids, were easily homogenized, and thus had very low %RSD values. The measured calorie contents were marginally higher than
stated values, ranging from 0.07-8.05 % for various cate-gories of food.
The correlation between measured and stated calorie content of all foods measured was found to be in strong agreement, with r=0.99 for all foods. The results from Bland-Altman analysis showed that 91.4% of the data were in agreement within ±2×SD. from mean difference. This study has shown that it is both feasible and accepta-ble to measure the calorie content of food, with minimal sample preparation steps using the Calorie Answer™. It also showed that the instrument is capable of measuring a diverse range of foods with savings in time and effort, thus making it an attractive alternative to conventional methods of analysis.
Most of the nutritional information for the consumer is currently available in processed and packaged foods. There is a paucity of information on the calorie content from food and beverage purchased from cafes, restaurants and street food vendors. Recently, the U.S. Food and Drug Administration (FDA) had mandated the display of calorie information of foods on menus and menu boards served in chain restaurants (20 outlets or more), similar retail food establishments and vending machines.15 It is likely that this trend will emerge in Asia and many other countries of the world. In many regions of Asia, Africa and Latin America, where food preparation and dishes are composed of a multitude of food ingredients, it has al-ways been a challenge to estimate the energy content of such foods using the bomb calorimeter. The Calorie An-swer™ machine provides rapid, reproducible and cost-effective analysis and appears to be an ideal instrument for generating the energy content of foods from various regions. According to international legislation, the stated energy values on labels must not be more than 20% in excess of the actual food energy.16,17 This could be achieved by using the Calorie Answer™ as it is a cost-effective and economical way to analyse foods within
Figure 2. Bland-Altman Plot to assess agreement between estimation of calorie content by standard methods (nutritional labels) and Calorie Answer™

Rapid estimation of food energy using Calorie Answer™ 23
acceptable accuracy range, notably for small food busi-nesses. Conclusion The calorie content of 105 food items were analyzed us-ing NIR spectroscopy with the Calorie Answer™. Meas-ured values were found to be strongly correlated with stated values on nutrition labels. The Calorie Answer™ required minimal sample preparation, was simple to use and provided rapid analysis on the metabolizable energy content of food. It could potentially be used in place of expensive and time-consuming bomb calorimeter or chemical analysis. Furthermore, its application in many developed and developing countries will generate much needed information on the calorie content of foods from these regions. As information on the calorie content of food is important in treating under-nutrition and over-nutrition, this instrument may become an important tool in providing the calorie content of the composite foods we consume. ACKNOWLEDGEMENTS We wish to thank Teraoka M, Ong CB and Nelson Wang of NK Automation Pte. Ltd. for their support and interest in our work. AUTHOR DISCLOSURES All authors declare no conflict of interest. REFERENCES 1. Elia M, Cummings JH. Physiological aspects of energy me-
tabolism and gastrointestinal effects of carbohydrates. Eur J Clin Nutr. 2007;61(Suppl 1):40-74S. doi: 10.1038/sj.ejcn.16 02938.
2. Blanco M, Villarroya I. NIR spectroscopy: a rapid-response analytical tool. Trends Anal Chem. 2002;21:240-50. doi: 10. 1016/S0165-9936(02)00404-1.
3. Kim Y, Singh M, Kays SE. Near-infrared spectroscopy for measurement of total dietary fiber in homogenized meals. J Agric Food Chem. 2006;54:292-8. doi: 10.1021/jf051975b.
4. Archibald DD, Kays SE. Determination of Total Dietary Fiber of Intact Cereal Food Products by Near-Infrared Re-flectance. J Agric Food Chem. 2000;48:4477-86. doi: 10. 1021/jf000206j.
5. Kays SE, Barton FE. Near-infrared analysis of soluble and insoluble dietary fiber fractions of cereal food products. J Agric Food Chem. 2002;50:3024-9. doi: 10.1021/jf0116552.
6. Almendingen K, Meltzer HM, Pedersen JI, Nilsen BN, Ellekjær M. Near infrared spectroscopy - a potentially useful
method for rapid determination of fat and protein content in homogenized diets. Eur J Clin Nutr. 2000;54:20-3. doi: 10. 1038/sj.ejcn.1600886.
7. Chen JY, Miao Y, Sato S, Zhang H. Near infrared spectros-copy for determination of the protein composition of rice flour. Food Sci Technol Res. 2008;14:132-8. doi: 10.3136/ fstr.14.132.
8. Kays SE, Archibald DD, Sohn M. Prediction of fat in intact cereal food products using near-infrared reflectance spec-troscopy. J Sci Food Agric. 2005;85:1596-602. doi: 10.1002/ jsfa.2157.
9. Kays SE, Barton FE. Energy from fat determined by near-infrared reflectance spectroscopy. J Agric Food Chem. 2004; 52:1669-74. doi:10.1021/jf030646l.
10. Vines LL, Kays SE, Koehler PE. Near-infrared reflectance model for the rapid prediction of total fat in cereal foods. J Agric Food Chem. 2005;53:1550-5. doi:10.1021/jf040391r.
11. Windham WR, Lawrence KC, Feldner PW. Prediction of fat content in poultry meat by near-infrared transmission analy-sis. J Appl Poult Res. 2003;12:69-73. doi: 10.1093/japr/12. 1.69.
12. Kays SE, Barton FE. Rapid prediction of gross energy and utilizable energy in cereal food products using near-infrared reflectance spectroscopy. J Agric Food Chem. 2002;50: 1284-9. doi: 10.1021/jf011385n.
13. Kays SE, Windham WR, Barton Ii FE. Prediction of total dietary fiber by near-infrared reflectance spectroscopy in high-fat- and high-sugar-containing cereal products. J Agric Food Chem. 1998;46:854-61. doi: 10.1021/jf9706484.
14. Kim Y, Singh M, Kays SE. Near-infrared spectroscopic analysis of macronutrients and energy in homogenized meals. Food Chem. 2007;105:1248-55. doi: 10.1016/j. food-chem.2007.03.011.
15. Food and Drug Administration USA. FDA issues final menu and vending machine labeling requirements. 2014/12/02 [cited 2014/12/10]; Available from: http://www.fda.gov/ Food/IngredientsPackagingLabeling/LabelingNutrition/ucm217762.htm.
16. Health Promotion Board. A handbook on nutrition labelling (Singapore) 2002 [cited 2014/12/02]; Available from: http:// www.hpb.gov.sg/HOPPortal/content/conn/HOPUCM/path/Contribution%20Folders/uploadedFiles/HPB_Online/Educati onal_Materials/NutriLabellingHdBk%28E%2903.pdf.
17. Food and Drug Administration USA. Guidance for industry: nutrition labeling manual - a guide for developing and using data bases. 2015/01/02 [cited 2015/01/05]; Available from: http://www.fda.gov/Food/GuidanceRegulation/GuidanceDo cumentsRegulatoryInformation/LabelingNutrition/ucm0631 13.htm.

24 E Lau, HJ Goh, R Quek, SW Lim and J Henry
18. Supplementary Table 1. List of measurement settings for Calorie Answer™
Calorie range (kcal) Reflectance mode
Cereals (under 200 kcal) 35-199 Cereals SCREENING (also powdered rice) 200-580 Cheeses 127-544 Confectioneries, Japanese buns 250-520 Milk powder, grated cheeses 47-544 Powdered cereals, dried noodles 349-434 Prepared foods 120-360 Snacks 370-550 Yogurts 28-74
Transmittance mode Coffee drinks 4-95 Condensed milks, ice creams 28-328 Fresh creams 76-435 Lactobacillus drinks 28-192 Milks 37-230 Milks (sweetened) 4-95 Soft drinks 4-60 Yogurt drinks 28-74
Rapid estimation of food energy using Calorie Answer™ 25
Short Communication Rapid estimation of the energy content of composite foods: the application of the Calorie Answer™ Evelyn Lau BSc1, Hui Jen Goh BSc1, Rina Quek BSc1, Siang Wee Lim BSc1, Jeyakumar Henry PhD1,2 1Clinical Nutrition Research Centre, Singapore Institute for Clinical Sciences, Singapore 2Department of Biochemistry, National University of Singapore, Singapore
快速估计复合食品的能量含量:卡路里答案的应用™ 食物中热量的估计是维持体重和能量调节的核心。传统的实验室分析使用炸弹
量热法确定卡路里含量,费用昂贵且耗时。需要探索热量估计的替代技术,这
种技术需要较少的处理和资源。该研究评价了近红外光谱技术的卡路里答案™在热量测量中的潜力。对 105 种不同食物的热量含量进行了测定,并与营养标
签的值进行了比较。所有食品按一式三份测量,得到的平均相对标准差为
1.7%。所有食物标签所述热量和测量热量之间的百分比差异适中,为 4%,且
两者卡路里含量高度相关(R2=0.98,p<0.001)。使用近红外光谱分析技术的
卡路里回答™,是一种快速、重现性好、性价比高的测量不同食物热量含量的
方法。将这种技术应用在亚太和其他新兴国家的许多地区,对居住在这些地区
居民消费的复合食品热量含量的估计将会得出许多需要的信息。 关键词:热量、食物成分、营养标签、近红外光谱、非破坏性食品分析