rapid inspection of pavement markings using … · rapid inspection of pavement markings using...
TRANSCRIPT

RAPID INSPECTION OF PAVEMENT MARKINGS USING
MOBILE LIDAR POINT CLOUDS
Haocheng Zhanga, Jonathan Li a, b*, Ming Chengb, Cheng Wangb
a Mobile Mapping Lab, Department of Geography and Environmental Management, University of Waterloo, 200 University Avenue
West, Waterloo, ON N2L 3G1, Canada – (h232zhan, junli)@uwaterloo.ca b Fujian Key Laboratory of Sensing and Computing for Smart Cities, School of Information Science and Engineering,
Xiamen University, 422 Siming Road South, Xiamen, FJ 361005, China – (junli, chm99, cwang)@xmu.edu.cn
Commission I, ICWG I/Va
KEY WORDS: Mobile LiDAR, Point Cloud, Pavement Marking, Urban Road, Automated Detection
ABSTRACT:
This study aims at building a robust semi-automated pavement marking extraction workflow based on the use of mobile LiDAR
point clouds. The proposed workflow consists of three components: preprocessing, extraction, and classification. In preprocessing,
the mobile LiDAR point clouds are converted into the radiometrically corrected intensity imagery of the road surface. Then the
pavement markings are automatically extracted with the intensity using a set of algorithms, including Otsu’s thresholding, neighbor-
counting filtering, and region growing. Finally, the extracted pavement markings are classified with the geometric parameters using a
manually defined decision tree. Case studies are conducted using the mobile LiDAR dataset acquired in Xiamen (Fujian, China) with
different road environments by the RIEGL VMX-450 system. The results demonstrated that the proposed workflow and our software
tool can achieve 93% in completeness, 95% in correctness, and 94% in F-score when using Xiamen dataset.
* Corresponding author
1. INTRODUCTION
Intelligent transportation systems (ITS) have been introduced
for many years. The current development of ITS focuses on the
driverless car, which is the most viable form of ITS. As a
robotic vehicle that is capable of traveling between destinations
without a human operator, the driverless car is driven not by
human but the data. There are two principal data sources for the
navigation of the driverless cars. The first one is the sensory
input in terms of the surroundings of the driverless car. It can be
acquired and collected by the radar, LiDAR sensor and video
cameras. The second one is a prior highly detailed 3D map.
Different from the traditional road map, this detailed 3D map is
developed for the machine. The highly precise map is
indispensable not only to allow a car to locate itself on the
traffic lane but also enable a vehicle to take corresponding
actions correctly (Guizzo, 2011).
To capture the world in 3D for autonomous vehicles, mobile
laser scanning (MLS) technology is applied before the
driverless cars hit the road. It is an effective and efficient
method for acquiring highly accurate, precise, and dense geo-
referencing 3D topographic data (Puente et al., 2013). MLS
systems are the mobile mapping systems based on the LiDAR,
which capture 3D point clouds from the surrounding
environment using profiling scanners. The detailed 3D point
cloud data normally involves the important information of
traffic lane such as lanes’ geometry and boundary, lanes’ types,
speed limit and lane traversal information. The indispensable
data helps the driverless car make solid decisions (Kent, 2015).
It is noted that majority of the information of lanes is
represented by the road markings, thus, a variety of study has
been carried out on the detection of road markings from point
clouds. In general, the road markings have much higher
reflectance than the unpainted road surface. Therefore, their
relatively high intensity can be used for detecting the road
markings. Smadja et al. (2010) implemented a simple threshold
on intensity for detecting the road markings. Toth et al. (2008)
selected an intensity value based on the intensity distribution in
a search window as a global threshold for the extraction. Yang
et al. (2012) extracted continuous edge lines and broken lane
line markings successfully. Studies were also undertaken aiming
at solving the problem caused by inconstant intensity. Chen et
al. (2009) selected the intensity peaks along the scan line as lane
marking points by using adaptive thresholding. Vosselman
(2009) proposed a distance-dependent thresholding method to
detect the road markings, and a connected components analysis
to extract road markings. In other studies, the distance-
dependence of intensity was used in different ways. Guan et al.
(2014) implemented multi-thresholding segmentation to extract
road markings. The distribution of point density along the cross
section was fitted to a Gaussian normal distribution function.
The road surface points were segmented into some bins
according to the estimated mean and standard deviation. Yu et
al. (2015) applied a distance-dependent multi-thresholding
segmentation in which the road surface points were segmented
into the blocks along the road.
This study focuses on the extraction and recognition of road
markings from MLS data for building the prior map of
driverless car. The detailed research objectives include: (1)
Completely extract the road markings from MLS data
automatically with high accuracy in different environments, and
(2) classify the road markings into thorough and detailed
categories.
The International Archives of the Photogrammetry, Remote Sensing and Spatial Information Sciences, Volume XLI-B1, 2016 XXIII ISPRS Congress, 12–19 July 2016, Prague, Czech Republic
This contribution has been peer-reviewed. doi:10.5194/isprsarchives-XLI-B1-717-2016
717

2. STUDY AREA AND DATASET
The study area is located in the City of Xiamen. Xiamen is a
port city on the southeast coast of mainland China. A complete
survey of mobile laser scanning was carried out back and forth
on Xiamen Island Ring Road on 23 April 2012 by a RIEGL
VMX-450 system. The total length for one direction survey was
around 10 km. This primary road in Xiamen is characterized by
numerous vehicles, trees, shafts (e.g., light poles and traffic
poles). The majority of the road surface and road markings are
in good condition. Seven samples of the survey data (i.e. the
straight, curve roads and different types of road markings) were
selected as the test dataset for evaluating the proposed method.
The average point density of the dataset is 7,000 points/m2. The
dataset was then converted into the format of LAS that is a
standard in the laser scanning industry.
Figure 1. Study area (Island Ring Road, Xiamen, Fujian, China)
3. METHODS
The proposed method within this study consists of three phases,
including preprocessing, road marking extraction, and road
marking classification.
3.1 Preprocessing
The raw point clouds are preprocessed in two steps to reduce
the volume of the data and overcome the problem resulting from
the uneven distribution of intensity data.
The first step is road surface detection. The non-ground removal
is implemented to extract ground points from the MLS data.
The ground surface points are rasterized into a digital terrain
model (DTM) by inverse distance weighted (IDW) interpolation.
A voxel-based upward growing method (Yu, 2015) is employed
to segment the raw MLS data into ground points and non-
ground points. This method partitions point cloud data into an
octree structure with a voxel size. For each voxel, it expands to
its 9-neighbour upward voxels, and then the growing scheme
expends until it reaches the top boundary. If the elevation of the
top voxel is smaller than the predefined threshold, the cluster of
these voxels is referred to the ground. The point clouds in these
voxels are labelled as ground points. Otherwise, the point
clouds will be categorized as non-ground points. In the removal
process, all the non-ground points are removed from raw point
clouds. The volume of the ground points concentrates 60% of
the raw MLS data. To further reduce the data volume and
improve the computational efficiency, the ground points will be
rasterized into the DTM by IDW interpolation. With the IDW
interpolation, the grey value of a grid is interpolated with its
neighbours:
2
1 1k
1)( kk
n
k
n
kkk d/w,w/zwxz
(1)
where wk is the weight of the k-th point within the grid, as the
function of distance dk; zk is the k-th point grey value; n is the
number of points in a grid.
The main features of the road surface are characterised by its
smoothness and connectedness. In general, the surface of the
grass is rougher than the road surface. Additionally, it is clear
that the existence of a curb would result in a sudden change in
the height on the road boundary. Therefore, a high-pass filter is
applied to the DTM, and the absolute values of the road surface
will be much lower than the values of the other surfaces.
Figure 2. Cosine of the scan angle rank vs. intensity
The second step is the intensity correction and enhancement.
The intensity value of the ground surface points are corrected
by the scan angle rank, following by the IDW interpolation. The
intensity values of the point clouds have a positive correlation
with cosines of incidence angles, as shown in Figure 2. Thus,
the linear regression model generated from the intensity image
can be used to correct the intensity value of MLS data. The
formula of the linear regression model is presented as below:
2479415115 xy (2)
3.2 Road Marking Extraction
The Otsu’s thresholding method is applied to extract road
markings. It segments the image automatically with the
optimum threshold that helps minimize the within-class
variance. It is assumed that the image is bimodal and the
illumination is uniform, therefore the bimodal brightness can be
determined based on the differences of the materials’ properties.
The road surface area is preserved in the intensity images in the
format of either asphalt pavements or the road markings. With
the assistance of the intensity correction, the illumination in the
image is uniform. Thus, the corrected intensity image is able to
meet the requirements of the Otsu’s thresholding method, and
the global thresholding process can be employed.
The International Archives of the Photogrammetry, Remote Sensing and Spatial Information Sciences, Volume XLI-B1, 2016 XXIII ISPRS Congress, 12–19 July 2016, Prague, Czech Republic
This contribution has been peer-reviewed. doi:10.5194/isprsarchives-XLI-B1-717-2016
718

3.3 Road Marking Classification
3.3.1 Road Marking Segmentation: The first step of road
marking classification is dividing the extracted road marking
into segments, where a 4-neighbor region growing segmentation
is employed. Figure 3 shows an extracted road marking and the
segmentation result, in which the noise and little clusters are
removed in the procedure of region growing.
Figure 3. Region growing segmentation
The large road marking in Figure 3 should be segmented into a
few road markings to guarantee the subsequent recognition.
Taking the width and junction into consideration, the large road
marking can be classified into two types: the thin road marking
and the wide road marking. The segmentation method consists
of two steps: distinguishing thin and wide road markings, and
splitting road markings at junctions. The neighbour-counting
filtering is applied to detect the thin, wide road markings and
their junctions.
(a) (b)
(c) (d)
Figure 4. Large road marking segmentation: (a) Neighbour-
counting image, (b) wide and thin road marking, (c) neighbour-
counting image of wide road marking, and (d) segmentation
result of large road marking.
3.3.2 Feature Extraction: After the road marking is
partitioned into segments, geometric parameters of marking
segments will be calculated. Four parameters were employed
including area, perimeter, estimated width, and orientation. The
estimated width is the function of area and perimeter:
perimeter/areawidth 2 (3)
Although this estimated value is not the true width of the
segment, it can indicate the thinness of road marking. Based on
area and width, rectangular markings can be detected and
recognized, but irregular markings having similar area and
width may be misclassified. In this case, a minimum bounding
rectangular (MBR) is derived to present the extent of each road
marking. According to the width of MBRs, road markings can
be classified into thin MBRs (e.g., zebra strip and broken line)
and wide MBRs (arrow, diamond, character, and number).
Based on the MBRs, the main angle of a road marking can be
calculated.
3.3.3 Decision-Tree Based Classification: A decision tree is
designed and developed for the classification. The hierarchical
tree of road marking categories that developed in this study is
illustrated in Figure 5. According to the People's Republic of
China National Standards: Road Traffic Marking (2009), the
road markings in Xiamen dataset can be classified into two
categories: longitudinal and transverse marking. The orientation
of road marking segments can be measured by the main angle of
MBRs. Transverse and longitudinal markings have a high and
low variance of the main angle in a section of the road
respectively. The difference of orientation variance is adopted
as the rule for the first level of the decision tree. At the second
level, longitudinal marking segments are separated into two
groups based on the MBR width. In the third level, if the width
of the segment exceeds 45 cm, it is refer to a wide MBR (i.e.
road arrow or non-road arrow); otherwise, it is referred to a thin
MBR (i.e. strip of zebra crossing, broken line or continuous
line). In the fourth level, zebra crossings, broken lines,
continuous lines, road arrows and non-road arrows are further
classified into specific subclasses based on their area and
estimated width.
4. RESULTS AND DISCUSSION
4.1 Preprocessing
Preprocessing aims to compress the large-sized data and
balance the uneven distribution of intensity data prior to the
extraction of the road markings. The ground removal result is
shown in Figure 6.
Figure 6. MLS data and ground surface points
The International Archives of the Photogrammetry, Remote Sensing and Spatial Information Sciences, Volume XLI-B1, 2016 XXIII ISPRS Congress, 12–19 July 2016, Prague, Czech Republic
This contribution has been peer-reviewed. doi:10.5194/isprsarchives-XLI-B1-717-2016
719
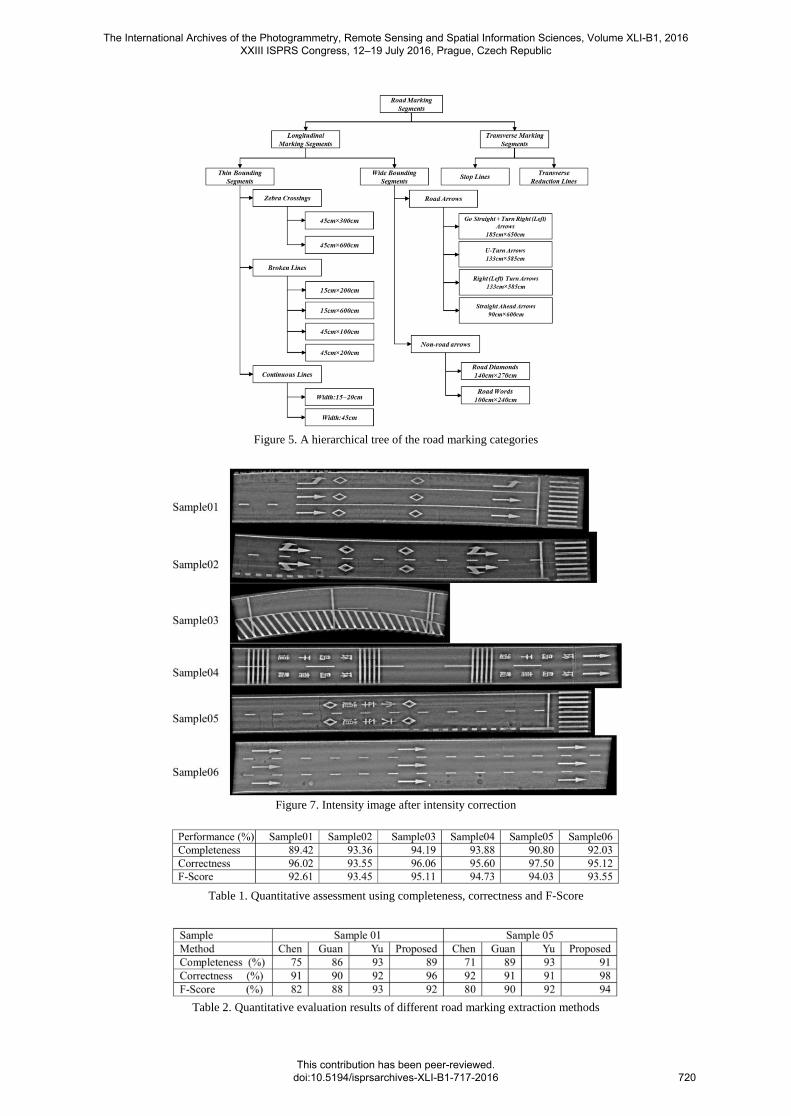
Figure 5. A hierarchical tree of the road marking categories
Figure 7. Intensity image after intensity correction
Table 1. Quantitative assessment using completeness, correctness and F-Score
Table 2. Quantitative evaluation results of different road marking extraction methods
The International Archives of the Photogrammetry, Remote Sensing and Spatial Information Sciences, Volume XLI-B1, 2016 XXIII ISPRS Congress, 12–19 July 2016, Prague, Czech Republic
This contribution has been peer-reviewed. doi:10.5194/isprsarchives-XLI-B1-717-2016
720

Figure 8. Results of road marking extraction based on Otsu thresholding
Figure 9. Extracted road markings from Sample 01 dataset: (a) road surface points, (b) Chen’s method result, (c) Guan’s method
result, (d) Yu’s method result, (e) proposed method result, and (f) manually labelled reference data (Adapted from: Yu, 2015).
The International Archives of the Photogrammetry, Remote Sensing and Spatial Information Sciences, Volume XLI-B1, 2016 XXIII ISPRS Congress, 12–19 July 2016, Prague, Czech Republic
This contribution has been peer-reviewed. doi:10.5194/isprsarchives-XLI-B1-717-2016
721

Figure 10. Results of road marking classification
In order to extract the road marking, a scan-angle-rank-based
intensity correction was used to correct various intensity values
caused by different incidence angles. The corrected intensity
images are presented in Figure 7. It is evident that the contrast
between road markings and the pavements was enhanced;
therefore the road markings became more detectable.
4.2 Road Marking Extraction
Based on the corrected intensity image, the Otsu’s thresholding
was used to extract the road marking, and the results are shown
in Figure 8. It is identified that majority of the road markings
were extracted but with three errors. Errors 1 and 3 are caused
by lacking of sufficient laser points, and error 2 is the false
negative located in the inner of the road arrows.
As shown in the quantitative assessment (see Table 1), the
proposed road marking extraction is capable to achieve 93%
complete-ness, 95% correctness and 93% F-Score. The rate of
completeness is smaller than the correctness’s in each sample,
indicating that some marking pixels were misclassified into the
pavements. Due to the decay of the road markings, the sizes of
manually labelled references are bigger than the damaged road
markings’. Therefore, the performance of proposed method was
underestimated in the result.
A comparative study was carried out between the proposed
method and Chen’s (Chen et al., 2009), Guan’s (Guan et al.,
2014) and Yu’s methods (Yu et al., 2015), and the results are
shown in Figure 9. The performance of these four methods is
evaluated in a quantitative way, using three variables, i.e.
completeness, correctness and F-score (see Table 2). It is
identified that the proposed method outmatches Chen’s and
Guan’s methods while it is inferior to Yu’s method in terms of
the completeness.
4.3 Road Marking Classification
The marking segments were classified into categories based on
the decision tree. All kinds of the road markings in the samples
The International Archives of the Photogrammetry, Remote Sensing and Spatial Information Sciences, Volume XLI-B1, 2016 XXIII ISPRS Congress, 12–19 July 2016, Prague, Czech Republic
This contribution has been peer-reviewed. doi:10.5194/isprsarchives-XLI-B1-717-2016
722

are illustrated in Figure 10. It is identified that majority of the
segments were classified into correct categories. Nevertheless,
three problems arose in the classification.
Aiming at these unclassifiable segments, caused by marking
decay, a rectification method can correct these misclassifi-
cations. The basic idea is that these unclassified segments
should be reclassified according to the confessedly recognized
road marking segments. Based on these correctly classified
road-marking segments, the near unclassified segment can be
set into the closest road marking. Although the damaged road
marking cannot be classified correctly by its geometric features,
it still has a strong spatial relationship with its congeneric
markings.
In order to identify Chinese characters, successfully separating
the strokes becomes the crucial point. One solution is to expand
the segments of strokes to generate them to become one
connected region, and then detected as one character correctly.
The dilation, as one of the basic operators in the area of
mathematical morphology, was tested to connect separate
strokes. After region expanding, the strokes in one connect area
can be classified as one character.
5. CONCLUSION
Majority of the existing MLS point clouds-based road marking
extraction methods are based on the application of global
intensity filtering and multi-thresholding segmentation.
However, these methods could be greatly influenced by the
unevenly distributed intensity. This study has highlighted that
the application of the scan-angle-rank-based intensity correction
and the large-size high-pass filtering have the potential to
significantly reduce the in-class variance of road markings and
pavements. In addition, based on the comprehensive prior
knowledge, a shape-based hierarchical tree developed in this
study is capable to undertake the classification in an efficient
and systematic manner. Based on the case study results, the
developed workflow is capable of rapid extraction and
classification of the road markings in the MLS point clouds.
ACKNOWLEDGEMENTS
This work was supported in part by the National Natural
Science Foundation of China under Grant 41471379 and in part
by Fujian Collaborative Innovation Centre for Big Data
Applications in Governments.
REFERENCES
Chen, X., Stroila, M., and Wang, R., 2009. Next generation
map marking: geo-referenced ground-level LiDAR point clouds
for automatic retro-reflective roadfeature extraction. In: 17th
ACM SIGSPATIAL International Conference on Advances in
Geographic Information System, Seattle, WA, USA, pp.4-6.
Guan, H., Li, J., Yu, Y., Wang, C., Chapman, M., Yang, B.,
2014. Using mobile laser scanning data for automated
extraction of road markings. ISPRS Journal of Photogrammetry
and Remote Sensing, 87, pp.93–107.
Guizzo, E., 2011. How Google’s self-driving car works. http://
spectrum.ieee.org/automaton/robotics/artificial-intelligence/
how-google-self-driving-car-works/
L. Kent, 2015. Autonomous cars can only understand the real
world through a map. http://360.here.com/2015/04/16/
autonomous-cars-can-understand-real-world-map/
Puente, I., González-Jorge, H., Martínez-Sánchez, J., and Arias,
P, 2013. Review of mobile mapping and surveying technologies.
Measurement, 47, pp.2127-2145.
Smadja, L., Ninot, J., and Gavrilovic, T., 2010. Road extraction
and environment interpretation from LiDAR sensors. ISPRS
Archives, 38, pp.281-286.
Toth, C., Paska, E., and Brzezinska, D., 2008. Using road
pavement markings as good control for LiDAR data. ISPRS
Archives, 37 (B1), pp.189-196.
Vosselman, G., 2009. Advanced point cloud processing, In:
Photogrammetric Week’09, Stuttgart, Germany, pp.137-146.
Yang, B., Fang, L., Li, Q., and Li, J., 2012. Automated
extraction of road markings from mobile LiDAR point clouds,
Photogrammetric Engineering & Remote Sensing, 78(4),
pp.331-338.
Yu, Y., Li, J., Guan, H., Jia, F. and Wang, C., 2015. Learning
hierarchical features for automated extraction of road markings
from 3-D mobile LiDAR point clouds. IEEE Journal of
Selected Topics in Applied Earth Observations and Remote
Sensing, 8(2), pp.709-726.
The International Archives of the Photogrammetry, Remote Sensing and Spatial Information Sciences, Volume XLI-B1, 2016 XXIII ISPRS Congress, 12–19 July 2016, Prague, Czech Republic
This contribution has been peer-reviewed. doi:10.5194/isprsarchives-XLI-B1-717-2016
723