rapid reports - aei.pitt.eduaei.pitt.edu/86164/1/1991.12.rr.pdf · 6esante industrie ohhe...
TRANSCRIPT

RAPID REPORTS eurostat Energy and industry
1991 D 12 ISSN 1016-0191
Production NACE 1-4
Change of trend in March 1991 in comparison to March 1990
-2%
-3%
EUR12 OK D E F IRL NL UIC USA JAP
Stagnation of European industrial production
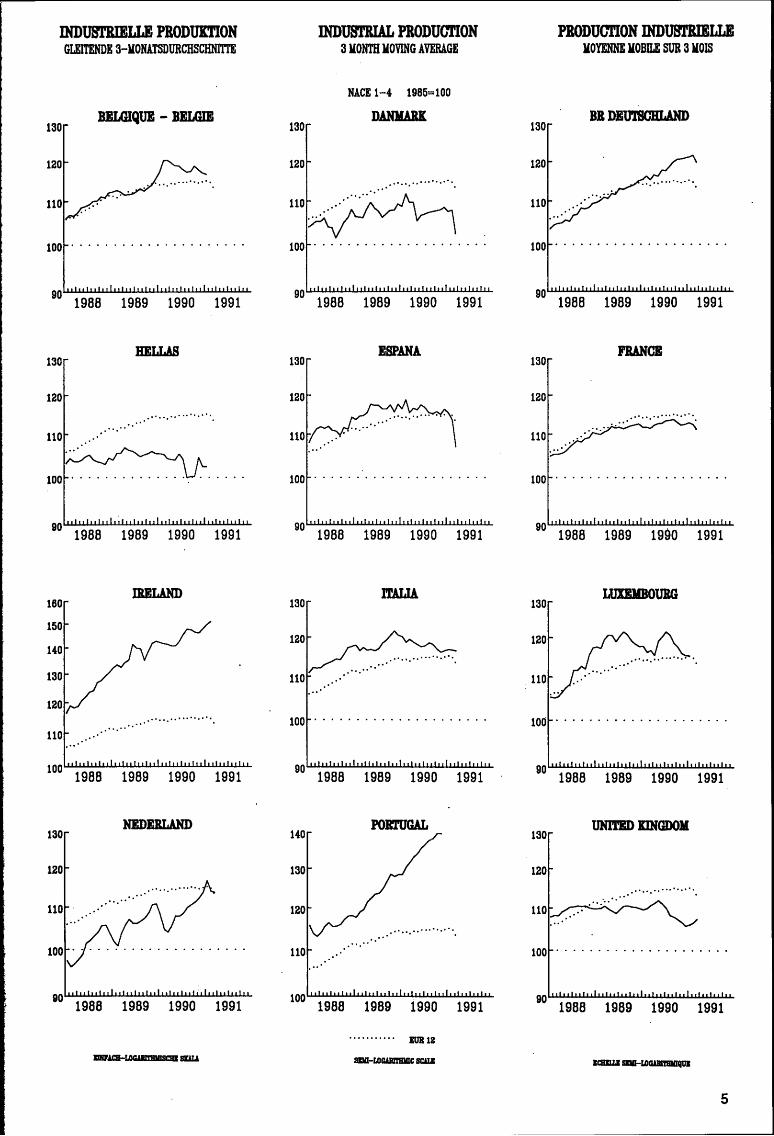
In March 1991 there was still no st,n of an uptwu in industrtal production in the European Community (EUR12). On the contrary, all indicators point to continuing stagnation. The EUR12 production index adjusted for the number of working days is currently estimated at 120.0 (1985=100) for March 1991, which is -2.0 % down on March 1990. After seasonal adjustment the estimated March index is 112.9 for the European Community. compared With 115.3 in February of this year, i.e. down -2.1 % in one month. If the seasonally adjusted production index for the first three months of 1991 is compared with the last three months of 1990, it appears that the production level bu hardly moved (0.2%).
In the USA the downward trend in industrial production ls much more marked, wtth a year-on-year decrease of 3.4 % in March 1991, while in Japan firm growth continues, With a year-on-year increase in the production index of 3.9 % in the same month.
Compared with the autumn months. there was still some growth in sectors such as energy and water (+3.3 %) and the food industry (+0.9 %). There was zero growth in the electrical industry (+0.4 %). the metal products industry (-0. l %). and the chemical industry (-0.5 %), while the trend in production was downward in engineering (-1.9 %). the automobile industry (-1.8 %), the textile industry (-1.5 %) and in the clothing industry (-2.2 %).
There were noticeable cllfferences in industrial growth between the Member States: compared with autumn 1990, the seasonally adjusted production index for industry as a whole (NACE 1-4) increased only in Greece (+2.3 %), Ireland (+2.9 %), the Netherlands (+1.4 %) and Gennany (+0.8 %). There was stagnation in Italy (+0.5 %), France (+0.2 %). Denmark (-0.1 %) and Belgium (-0.3 %). The figures for the United Kingdom (-0. 7 %), Spain (-1,2) and Luxembourg (-2. 7 %) reflect recession.
Manuscript completed on = 10-06-1991
For further information please contact: M. B. FELDMANN Eurostat, L-2920 Luxembourg, tel. 4301-4401 Fax: 4301 4771
Price (exd. VAT) in Luxembourg: Subscription ECU 160 Catalogue number: CA-NL-91-012-EN-C

INDUsrRIELLE PRODUKTION INDUSTRIAL PRODUCTION PRODUCTION INDUSTRIELLE
2
GLEITENDE 3-MONATSDURCHSCHNI'ITE
USA
130
125
120 ---- _, /
,,,- ../
/ 115 / -/
110
105
100
3 MONTH MOVING AVERAGE
---
NACE 1-4 1986 • 100
EUR 12
/ /,,
-../ ------,,
/
95 1988 1989 1990
EUR l2 1986 • 100
INDUSTRIE NACE 1-• INDUSI'RY NACE 1-• • • • • • • INT ROHSTOM UND HALBIAREN INTERllKDIATE GOODS
INV INVESTITIONSGUETER CAPITAL GOODS 11111111111 CON VKRBRAUCHSGUETER CONSUMER GOODS
130
125
120
115
110
105
:UOYENNE MOBILE SUR 3 MOIS
JAPAN
130 ,..----- --125
120
115
110
105
100
1991 95
INDUSTRIE NACE 1-•
BIENS INTERMEDWRES
BIENS D'INVESTISSEMENT
BIINS DE CONSOWU.TION
130
125
120
115
110
105
100 ........ __.__..._...__':"":":~--'--.i-.....L---L..---'--_.__L-L-L-...L--L....1.-.L.-1--.L.....J--1..-L..J...__JL.l._l_...L_L....1-1..-1-.L..J~-L.l._L.l._l_..1._Ll-1..-L.J 100
1988 1989 1990 1991
SElU-LOGARITHKIC sew: ICHIU.I Sllill-LOGWTBMIQUI

BASISINDIKATOREN BASIC INDICATORS
INDICATEURS DE BASE 1985 = 100
L1tzt1 Zahl / Latest figure / Dernhr chtffre Veranderung / Change / Vartat:fon
Zettrau• Pro Arbeftsta!J Safsonherefntgt Pro Arbettstag Safsonberefntgt Pertod Per wrkfng day Seasanal 1!1 adjusted Per working da!J Seasonally adjusted
P6rtode Par Jour owrable D6sa t sonna 11 sis Par Jour owrable D6satsoMa1ts6s 7.8 (1) i'..A 12l
PROOUKTIOHSIHDEZES INDICES OF PROOUCTIOH INDICES OE PRODUCTION
NACE 1-4 GESAHTE IHDUSTRIE OHHE BAUIHOUSTRIE TOTAL INDUSTRY EXCLUDING COHSTRIJCTIOH EHSEl'!SLE DE L'IHDUSTRIE SAl'lS BATIMENT
EUR12 03 91 120.0 112.9 0.5 0.2
B 01 91 116.8 115.3 1.0 -0.1 DK 03 91 106.9 104.0 -2.8 -0.1 D 03 91 127.9 121.1 4.8 0.8 GR 01 91 94.6 101.1 -2.2 2.3 E OJ 91 112.8 106.6 -J.7 -1.2 F 03 91 115.3 109.6 0.6 0.2 IRL 02 91 149.1 151.0 S.4 2.2 I 03 91 124.7 116.S -1.3 0.5 L 01 91 112.2 113.3 -1.6 .;2.1 NL 03 91 113.0 107.8 7.2 1.4 p 12 90 138.8 138.5 8.7 1.4 UK 03 91 114.4 107.1 -3.3 -0.8
USA 03 91 111.1 111.5 -2.4 -2.4 J 03 91 137.3 127.3 5.9 -0.1
INT GRUNOSTOFFE U. PROD. &UETER INTERl1EDIATE GOODS BIEHS INTERMEDIAIRES
EUR12 03 91 116.6 109.3 0.4 0.6
B 01 91 116.3 116.6 1.7 0.3 DK 03 91 109.2 106.6 -3.9 0.4 D 03 91 122.0 114.9 1.9 0.1 GR 01 91 101.9 101.0 -4.0 -1.5 E 03 91 106.6 103.4 -2.2 0.3 F 03 91 115.6 108.5 3.0 1.2 IRL 02 91 144.1 145.9 4.8 2.7 I 03 91 122.4 115.2 -2.0 0.8 L 01 91 112.3 111.9 -2.2 -2.1 NL 03 91 109.0 98.3 10.1 2.4 p 12 90 126.1 124.7 4.8 2.6 UK 03 91 109.1 102.0 -1.8 0.7
USA 03 91 111.8 114.7 -5.5 -3.6 J 03 91 134.3 128.6 6.5 0.1
INV IHVESTITIOHSGUETER CAPITAL &ODDS INDUSTRIES BIENS D 'INVESTISSEt1ENT
EUR12 03 91 124.7 116.4 -2.7 -0.1
B 01 91 117.l 113.5 -1.3 -3.8 DK 03 91 111.0 102.9 -4.2 0.2 D 03 91 132.0 12.5. 7 4.1 1.1 GR 01 91 91.0 104.6 -3.0 0.3 E 03 91 118.5 115.7 -14.2 -8.8 F 03 91 108.3 106.3 -6.l -2..0 IRL 02 91 218.0 208.S S.7 3.4 I 03 91 129.l 121.s -4.1 0.7 L 01 91 92.4 108.3 -3.1 -7.9 HL 03 91 116.7 116.5 2.1 1.4 p 12 90 122.3 116.8 2.4 0.5 UK 03 91 131.0 116.5 -s.s . -2..2
USA 03 91 118,3 118.9 -0.4 -2.2 J 03 91 163.0 135.7 5.7 -o.6
CON VERBRAUCHSGUETER CONSU!1ER GOODS BIEHS DE COHS0t1l1ATI0H
EUR12 03 91 121.8 116.l 1.7 -0.4
B 01 91 116.8 116.2 2.0 0.9 DK 03 91 107.9 103.9 o.o 0.4 D 03 91 132.2 12.5.1 9.8 1.4 GR 01 91 &4.7 101.2 1.2 9.6 E 03 91 117.1 109.l -2.8 -0.6 F 03 91 119.0 114.5 -0.2 -o.6 IRL 02 91 117.0 126,5 4.9 0.8 I 03 91 126.8 116.2 1.9 -0.2 L 01 91 127.6 127.6 3.0 -0.5 NL 03 91 119.0 121.7 4.S -0.1 p 12 90 126.5 133.3 5.2 -o.5 UK 03 91 113,2 111.4 -4.7 -2.5
USA 03 91 110.5 112.0 -1.9 -1.8 J. 03 91 128.6 120.2 6.2 -1.0
Ut1SATZ TURNOVER CHIFFRE D'AFFAIRES
NACE 1-4 GESAHTE INDUSTRIE OHHE BAUIHDUSTRIE TOTAL INDUSTRY EXCLUDING CONSTRUCTION EHSEl1BLE OE L'IHOUSTRIE SANS BATil1EHT
EUR12 10 90 140.8 132.8 7.2. 1.0
A&HAEHGIGE BESHCAEFTIGTE HUHBER OF EMPLOYEES NOl1BRE DE SALARI'5
NACE 1•4 6ESANTE INDUSTRIE OHHE BAUINDUSTRIE TOTAL INDUSTRY EXCLUDING CONSTRUCTION EHSEHBLE DE L'IHDUSTRIE SANS BATil1ENT
EURll III 90 97.9 97.5 0.5 o.o
7. 811) - Letzte 3 11onate gegenUber dam entsprechenden Vor Jahresze l traum
7. A( 2) • Letzte 3 11onate gegenUb1r den vorhergehendan 3 11onaten
- Last 3 months compared wfth correspondtng 110nths of previous year
- Les 3 dern I ers •o Is par rapport aux 110 f s COf'.'_respondants de 1 'anneh prididente
- Last 3 months compared wfth previous 3 months
• Les 3 dernters mots par rapport aux 3 mots priclidents
3

4
1988
NACE l-4
PRODUKTIONSINDIZES - SAISONBEREINIGT INDICES OF PRODUCTION - SEASONALLY ADJUSTED
INDICES DE PRODUCTION - DESAISONNALISES 1985 = 100
1990 1991 1989 1990
I I I l I 09 10 11 12 01 02 I 03
GESAMTE IHDUSTRIE OHHE BAUINDUSTRIE TOTAL INDUSTRY EXCLUDING CONSTRUCTION ENSEMBLE OE L'INOUSTRIE SANS BATIHENT
EUR12 108.9 113.0 114.9 114.9 115 . 0 114.4 114.l 115.8 115.3 112.9 EUR12
B 108.9 112. 7 118.4 120.2 117.5 119.2 116.9 115.3 B
DK 104.8 107.2 107.8 102.7 109.5 110.9 103.3 111.5 107.8 104.0 DK
D 106.5 112.l 117.9 119.3 121.8 120.6 119.8 122.7 121.l 121. l D
GR 103.7 105.3 103.3 90.7 107.3 102.7 103.S 101.l GR
E 111.l 116.l 116.l 114.5 114. 7 117.6 112.3 118.7 115.l 106.6 E
F 107.5 111.9 113.4 112.8 113.6 112.l 111.0 114.2 113.2 109.8 F
IRL 123.l 137.4 143.8 150.4 143.6 145.4 149.2 149. 0 151. 0 IRL
I 114.2 118.6 117. 7 119.6 115.9 114.9 117.0 117 ~ 2 115.9 116.5 I
L 110.0 118.6 118.0 121.9 114~8 115.8 116.8 113.3 L
NL 101.3 106.4 109.2 113.6 109.4 110. 7 116.4 113. 7 119.9 107.8 NL
p 116.2 124.l 135.4 138. 7 140.3 140. 2 138.5 p
UK 109.6 109.9 109.l 107.7 107.8 106.0 105.7 105.2 106.9 107.l UK
USA 111. 7 114.5 115. 7 117.2 116.4 114.7 113.6 112.9 112. 0 111.5 USA
J 112.8 119. 7 125.4 126.4 130.0 128.7 127.8 129.5 129.2 127.3 J
INT GRUNDSTOFFE U. PROD. GUETER INTERMEDIATE GOODS BIENS INTERHEOIAIRES
EUR12 108.l 111.0 111.6 I 111.4 111.0 110.6 109.9 111. 7 112.4 109.3 I EUR12
INV INVESTITIONSGUETER CAPITAL GOODS INDUSTRIES BIENS D'INVESTISSEMENT
EUR12 I 111.6 118.9 121. 7 I 120.2 119.2 117.9 119.3 120.0 117.S 116.4 I EUR12
CON VERBRAUCHSGUETER CONSUMER GOODS BIENS DE CONSOHMATION
EUR12 I 109.l 113.0 116.l I 117.2 119.0 118.2 117.4 119.8 117.2 116.l I EUR12
INDUSTBIELLE PBODUDION GIIITENDE 3-llONATSDURCHSCHNm'E
130 BELGIQUE - BELGII
120
100 · · · · · · · · · · · · · · · · · · · · ·
90 1988 1989 1990 1991
BELLAS 130
120 ..................
..... 110
100~·-···
90 1988 1989 1990 1991
160
150
140
130
120
····· .................
110
100 1988 1989 1990 1991
NEDEBLAND 130
120 , .......
..... 110
100
90 1988 1989 1990 1991
130
120
110
INDUSTRIAL PRODUCTION 3 llONTH llOVING AVERAGE
NACE 1-4 1985=100
DANlWUC
......... ........
90 1988 1989 1990 1991
ESPANA 130
100 · · · · · · · · · · · · · · · · · · · · ·
90 1988 1989 1990 1991
130
120~ 110 ....... ·············· ········.
100 · · · · · · · · · · · · · · · · · · · · ·
DO 1988 1989 1990 1991
140 PORTUGAL
130
120
················. 110
100 1988 1989 i990 1991
Btll 12
130
120
110
100
PRODUCTION INDUSTBIELLE KOYENNE MOBILE SUR 3 llOIS
BI DEtJ'MCIILAND
90 1988 1989 1990 1991
FRANCE 130
120
················· 110
.
100 · · · · · · · · · · · · · · · · · · · · ·
90 1988 1989 1990 1991
130 LUIEMBOUBG
1988 1989 1990 1991
130 UN1TID IIHGDOII
120
················· 110~
100 · · · · · · · · · · . · · ....... .
90 1988 1989 1990 1991
5

6
PRODUKTIONSINDIZES - PRO ARBEITST AG INDICES OF PRODUCTION - PER WORKING DAY
INDICES DE PRODUCTION - PAR JOUR OUVRABLE 1985 = 100
1989 1990 1990 1991 1988 1989 1990
I I I I 12 01 02 12 01 02
NACE 1-4 GESAHTE IHDUSTRIE OHNE BAUINDUSTRIE TOTAL INDUSTRY EXCLUDING CONSTRUCTION ENSEMBLE DE L' UIDUSTRIE SANS BATIMENT
EUR12 108.9 113.0 114.7 113.S 114.0 117.2 112.7 115.2 118.7 EUR12
B 108.9 112. 7 117.3 107.6 119.4 122.7 B
DK 104.8 107.2 101.e 104.9 103.9 103.9 101.9 106.9 102.9 DK
D 106.5 112.l 117.9 113.9 111.l 111.9 118.9 118.0 117.9 D
GR 103.7 105.3 102.9 103.4 96.2 105.4 GR
E 111.1 116.l 116.0 108.0 122.4 115.2 107.l 121.8 E
F 107.5 111.9 113.4 112.0 118.3 116.6 111.2 119.7 119.4 F
IRL 123.l 137.4 143.8 144.5 133.2 139.8 148.4 142.5 IRL
I 114.2 118.6 117. 7 119.9 115.3 128.0 113.8 116.S 124.S I
L 110.0 118 . 6 118.0 114.4 115.2 120.S 114.S L
NL 101.3 106.4 109.2 125.0 121. 0 114.0 130.0 125.0 133.0 NL
p 114.9 120.9 126.3 124.4 126.5 128.9 p
UK 109.6 110.0 109.2 108.7 107.0 116.6 104.0 102.7 113.4 UK
USA 111. 7 114.S 115.7 113.1 112.3 115.5 111.5 111.1 112.4 USA
J 112.8 119. 7 125 .4 125.0 111.0 117.4 132.3 119.0 126,0 J
IHT GRutmSTOFFE U. PROD. GUETER INTERMEDIATE GOODS BIEHS INTERMEOIAIRES
EUR12 I 108.1 111. 0 111.5 I 109.0 115.8 115.9 I 107.2. 115.8 118.1 I EUR12
INV INVESTITIOHSGUETER CAPITAL GOODS IH'lUSTRIES BIEHS D'IHVESTISSEMENT
EUR12 I 111.6 118.9 121.7 I 128.8 111.3 121.5 I 126.3 110.4 117.S I EUR12
CON VERBRAUCHSGUETER CONSUMER GOODS BIENS DE CONSOMMATIOH
EUR12 I 109.l 113.0 116.0 I 109.4 112.2 116.4 I 110.S 116.3 118.0 I EUR12

INDUSTRIELLE PRODUKTION Veriinderung gegenilber dem
Vorjahresquartal
INDUSTRIAL PRODUCTION Change from the corresponding quaner
of the previous year
PRODUCTION INDUSTRIELLE Variation par rapport au trimestre
de l'annoo prec61ente
EUR-12
81ft
6'1t
'"
O'lt
-2'1t
-4'1tL-------------------~
90/I 90/II
Iii
41ft
01.
90/I 90/IJ
... 6'11
01ft
t:2) Grundstoffe und Produktionsguter li1 lnvestitionsguter ~ Verbrauchsguter
90/III 90/IV 91/J
USA
90/III 90/IV 91/I
JAPAN
Intermediate goods Biens intermediaires Capital goods Biens d'investissement Consumption goods . Biens de consommation
7

ERZEUGERPREISINDEX PRODUCER PRICE INDEX INDICE .DES PRIX A LA PRODUCTION
8
125
120
115
105
100
95
IN LANDESWAEHRUNG - Industrie NACE 1-4 -- Rohstoff e und Halbwaren - - - - - Investitionsgueter · · · · · · · · · Verbrauchsgueter IN ECU • • • • • lndustrie NACE 1-4
EUR 12 - 1986 = 100
IN NATIONAL CURRENCY Industry NACE 1-4 Intermediate Goods Capital Goods Consumer Goods
IN ECU Industry NACE 1-4
/--------
EN MONNAIE NATIONALE lndustrie NACE 1-4 Biens Inlermediaires Biens d'Investissement Biens de Consommation
ENECU lndustrie NACE 1-4
------····· ____ _,, ··················· ·· · ___ ..-- ....
.,- -- I It I I tl
,_- __.,- t I It t It t t t
/ ..... .. . __ _,
----- , ,•'
_-........... -,-,..-.-. . . . . . . . . . . . . . . . . . . . . . . . . . . . . . . . . . . . . .
125
120
115
110
105
100
95
90 ....__..~......__......_.__.._......__......_.___.__._...__.___._....lo---J ............ __.__......__,..._.___,__..,___.~__,__.1.-.,1,__,_-L-.L......L--L-.....L-.L......L~..J.......JL.......L.-L-.J......J--L..-L-.J.....J_J 90 1988 1989 1990 1991
EINF !CH-LOGARITmllSCHE SKALA
VERA.ENDERUNG $ Ttr-12
- IN LANDESWAEHRUNG
• • • • • IN ECU
SIMI-LOGARlTBlOC SC!IJ!:
VARIATION $ T/T-12
IN NATIONAL CURRENCY
IN ECU
---9' ,' , . .,,. ~ .__
!CHEU.I SEMI-LOGARITHMIQUE
VARIATION $ Ttr-12
EN MONNAIE NATIONALE
ENECU
7
6
5
• 3
2
1 0 . . . . . . . . . . . . . . . . . . . . . . . .. . . . . . . . . . . . . . . . . . . . . . . . . . . . . . . . . . . . . . . . . . . 0
-1 -1
-2 -2
-3 -3
-• -• -5 -5
- 6 .....__._--L-~~19='=a-=-a_..._~_...........L..-..JL........L......__L........L.l....L98 __ 9L......1...----'--.L...I......I..-..L......l._L_..L-1.1_9L90...L....l--1......L.JLL....l_LL....1_Ll 9.L9...ll-L....LJ--L.J - 6

1989
IN LANDESWAEHRUHG
EUR12 106.S
B 93.0
DK 107.0
D 99.3
GR 163.3
E 109.2
F Ul 105.8
IRL 112.7
I 113.l
L 100.8
NL 86.0
p
UK 111.6
IH ECU
EUR12 103.6
B 96.3
DK 106.6
D 106.8
GR 95.6
E 108.0
F Cll 102.4
IRL 103.8
1 108.3
L 104.4
NL 92.5
p
UK 97.7
GESAMTE INDUSTRIE OHNE BAillNDUSTRIE TOTAL INDUSTRY EXCLUDING CONSTRUCTION
ENSEMBLE DE L'INDUSTRIE SANS BATIMENT NACE 1-4
PREISINDIZES • PRICE INDICES • INDICES DK PRIX 1985 = 100
Letzte Zahl 1990 1991 Latest ft gure
Dernier- ch1ffr-e 1990
1. r. 09 10 11 12 01 02 03
rn~u Tn-1
IN NATIONAL CURRENCY EXPRIMES EN MOHNAIE HATIONALE
109.9 110.9 111.s 111.5 111.s 112.2 112.2 110.7 1.8 -1.3 EUR12
93.6 95.5 95.3 94.2 93.4 92.9 91.8 91.4 -2.1 -o.5 B
108.8 110.0 109.0 109.0 109.0 109.0 109.0 109.0 0.9 DK
101.0 101.7 102.1 101.8 101.5 102.4 102.3 102.0 1.8 -0.3 D
189.0 197.7 201.0 203.8 204.6 208.5 208.7 18.6 0.1 GR
111.5 112.1· 112.9 112.7 112.8 ·113.S 113.2 112.7 1.6 -o.s E
108.0 108.6 108.9 109.2 109.4 109.l 108.8 108.5 1.2 -0.3 F Cl)
113.0 113.l 113.l 113.2 113.2 113.1 113.5 113.9 0.9 0.4 IRL
117.8 118.8 119.6 119.7 119.9 121.3 121.S 121.6 4.2 0.1 I
98.8 98.0 97.4 96.6 96.4 96.4 96.0 -3.9 -0.5 L
87.3 87.8 88.2 87.7 87.2 89.2 89.2 89.1 2.2 -0.1 NL
p
117.6 119.2 120.3 120.6 120.6 121.4 122.0 121.6 5.4 1.1 UK
IN ECU EXPRil1ES EN ECU
106.0 107.1 107.7 107.5 107.3 108.2 108.2 108.3 3.4 0.1 EUR12
99.l 101.2 100.8 99.9 99.2 98.9 97.8 97.1 -1.9 -0.7 B
111.1 112.1 111.1 111.l 111.0 110.8 110.9 110.9 0.1 0.0 DK
109.6 109.9 110.3 110.4 110.6 111.3 111.2 110.7 1.3 -o.s D
98.2 102.2 101.8 101.S 100.8 100.7 99.6 4.0 -1.1 GR
111.2 111.9 112.6 111.9 111.5 113.3 114.0 113.9 4.3 -0.1 E
106.l 106.9 107.2 107.3 107.2 106.5 106.l 105.6 -0.2 -0.5 F (1)
105.3 105.3 105.2 105.6 105.6 105.3 105.4 105.8 0.4 0.4 IRL
112.0 111.6 112.0 112.2 112.6 113.9 114~2 114.9 2.4 0.5 I
104.6 103.8 103.l 102.s 102.s 102.6 102.2 -2.8 -0.4 L
94.9 94.9 95.3 95.1 95.0 97.0 97.0 96.7 1.5 -0.3 NL
p
97.1 100.5 101.9 101.0 100.2 101.8 102.0 102.3 12.7 2.2 UK
llJ Schaetzung - Esttmat1on Eurostat
9

GESAMTE INDUSTRIE OHNE BAUINDUSTRIE NACE 1-4
TOTAL INDUSTRY EXCLUDING CONSTRUCTION ENSEMBLE DE L'INDUSTRIE SANS BATIMENT 1985 = 100
! EUR12 B DK ! DC WEST) GR E F IRL I HL p UK
PRODUKTIONSIHDIZES INDICES OF PRODUCTION INDICES DE PRODUCTION
l 985 100.0 100.0 100.0 100.0 100.0 100.0 100.0 100.0 100.0 100.0 100.0 100.0 100.0 1986 102.4 100.8 106.5 102.4 99.8 103.1 100.9 102.2 104.l 102.1 100.2 107.3 102.4 1987 104.4 10 3. 0 102.8 102.7 98.1 107.8 102.8 111.2 106.8 101. 2 101. l 112. 0 105.8 1988 108.9 108.9 104.8 106.5 103.7 111. l 107.5 123.l 114.2 110. 0 101.3 116.2 109.6 198 9 113.0 112. 7 107.2 112. l 105.3 116. l 111. 9 137.4 118 .6 118.6 106.4 124.l 109.9 1990 114. 9 118.4 107.8 117. 9 103.3 116 .1 113.4 143.8 117. 7 118. 0 109.2 135.4 109.l
UMSATZ TURNOVER CHIFFRE D'AFFAIRES
Saisonbareinigt Seasonally adjusted Desai sonnal i sh
1990 01 126.4 125.0 118. 7 121. 9 126.4 138. 6 116. 0 127.5 02 123.8 119. 3 117. 9 117. 6 120.8 136 .8 111. 9 127.9 03 128.4 119. 9 121. 6 122.3 125.3 139. 0 113. 3 131. 6 04 122.3 115 .1 113.5 114 .2 119 .8 134. 4 111.5 129.1 05 129.7 127.3 117 .8 126.4 125.9 141.8 115. 7 130.7 06 124.7 118 .5 107. 0 117 .8 120.6 135.8 111.5 130.4 07 128.0 118.6 121. 3 124.9 136. 7 112.5 129.3 08 126.3 120.6 125.1 122.0 136 .2 112. 9 130.2 09 126.9 110. 5 120.4 122.4 134.8 108.6 131. 5 10 132.8 121. 2 127.9 129.3 143.6 112.8 133. 3 11 121. 5 128.3 137. 7 110.8 132.5 12 114. 0 120.9 140.4 103.8 132.5
1991 01 121.1 131. 9 144.6 107.3 130.6 02 117. 7 127.6 130. 3 03 116 .4 124.5 129.2
AUSFUHR EXPORTS EXPORTATIONS
Mangan, Saisonbereinigt Volumes, seasonally adjusted En vol uma, dlisaisonnalisas
1989 10 98.2 113 .3 109.1 185.0 133.0 124.6 129. 7 107.6 125.7 161.2 115. 6 11 l O 1. 5 112 .2 112.2 132.8 129.1 125.6 136.2 104.6 129.2 174.6 124.8 12 94.9 114. 0 104.4 165.0 116 .5 120.1 134.3 101. 0 121.2 167.4 118.8
1990 01 103.7 114. 3 119. 7 160.8 116 .1 125.9 138.2 110. 5 126.8 167.4 120.2 02 97.8 113.8 108.8 166.7 102.6 117. 0 127.7 103.3 120.4 170.l 112.6 03 99.5 117 .1 114. 0 131. l 119.2 125.4 149.0 98.9 128.7 184.5 116. 7 04 93.7 111. 3 105.8 149.9 109.6 116.4 141.6 101. 9 120 .8 165.0 116. 4 05 98.2 112. 3 111. 9 130.2 122.0 120.3 134.3 102.l 125 .6 177.7 122.8 06 94.1 116.5 97.9 126.9 119.8 117. 7 · 137.7 110 .6 124.l 175.7 113. 3 07 93.6 110. 9 106.3 116. 7 114. 7 122.5 129.4 101. 3 123.0 170.5 110 .8 08 95.l 114. 6 109.4 142.0 115. 9 119.8 124.8 95.4 122.7 162.4 117 .4 09 88.4 108.3 100.0 91.6 118. 9 117 .1 134.4 99.7 115.4 163.5 109.2 10 96.2 115.6 111.0 152.9 114. 6 134.1 143.2 101.5 126.9 173.8 119. 5 11 93.4 120.5 109.4 129.3 131.8 129.7 132.4 99.0 121.2 189.l 121. 3 12 84.6 117. 9 95.4 101.4 118 .1 113. 3 137.2 105.1 111.6 170.6 109.0
EIHFUHR IMPORTS IMPORTATIONS
Mangen, Saisonbereinigt Volumes, seasonally adjusted En volume, dasaisonnal is6s
1989 10 142.2 105.0 134.0 123.3 207.7 149.8 128.7 122.3 128.2 277 .1 125.3 11 143.2 110. 3 136.4 147.4 225.8 149.4 129.7 122.5 130.0 282.8 130 .4 12 131. 0 95.7 130.3 124.9 205.l 135.9 116. 7 112.8 119.8 267.3 118.8
1990 01 144.6 116.9 137. 9 153.3 213.1 150.5 134.2 129.5 129.0 245.5 129.2 02 134 .4 100.9 129.6 120.3 205.4 138.7 122.9 119. 5 120.4 217.4 117 .8 03 139. 3 104.7 132.8 134.3 210.5 144.3 129.7 122.0 126.7 267.2 126.5 04 136.6 101.5 132.5 151.4 206.0 138.0 134.3 119 .1 120.2 252.4 120.9 05 145.8 112. 7 134.4 142.7 218.6 146.8 135.4 129.8 135.5 263.0 124.0 06 138.0 107.4 127.6 137.4 224.2 136. 3 125.2 118. 7 124.9 240.6 117. 9 07 141.6 106.9 137.5 132.5 212.2 148.2 127.l 121.5 123.7 257.7 120.2 08 144.9 113. 7 143.3 129.0 193.4 142.2 130.0 118.0 128.3 236.3 118. 6 09 134. 3 101. 0 135.8 121.8 203.0 142.0 128.6 118. 0 122.8 240.1 117.0 10 146.4 112.4 145.5 108.8 208.5 155.4 134.9 122.1 132.8 262.7 12l. 3 11 147.0 118. 0 160.6 105.2 225.2 148.2 127.2 127.2 131.2 263.0 117. 9 12 133.1 99.6 143.7 82.8 197.1 138.3 119.1 lll. l 117. 6 242.9 112. 6
ERZEUGERPREISIHDIZES PRODUCER PRICE IHDICES INDICE DE PRIX A LA PRODUCTION
1990 01 108.5 93.0 108.0 100.1 174.3 110. 9 107.0 113.9 116. 4 lOl. 2 87.0 115. l 02 108.7 93.l 108.0 100.l 175.9 111.1 107.2 113.4 116.6 99.9 87.5 115 .1 03 108.8 93.4 108.0 100.2 178.5 110. 9 107.3 112.9 116.7 100.3 87 .2 115. 7 04 109.2 93.2 108. 0 100.7 179.6 110.9 107.4 112. 7 116.8 99.6 87.2 116. 6 05 109.3 92.8 109.0 100.8 185.3 lll. l 107.5 112. 7 116.8 99.3 87.2 116. 6 06 109.3 92.4 109.0 100.8 186.5 110. 9 107.5 112.8 116. 9 99 .3 . 87.1 116 .6 07 109.4 92.4 109.0 100.7 188.4 110. 7 107.9 112.9 117 .1 98.7 86.8 116. 9 08 110. 2 94.4 110. 0 101. 3 192.8 lll.2 108.3 112. 7 118.2 98.5 87.3 118 .1 09 110. 9 95.5 110. 0 101. 7 197. 7 112.1 108.6 113 .1 118.8 98.0 87.8 119. 2 10 lll. 5 95.3 109.0 102.1 20l. 0 112. 9 108.9 113.1 119. 6 97.4 88.2 120.3 11 lll.5 94.2 109.0 101.8 203.8 112. 7 109.2 113.2 119. 7 96.6 87.7 120.6 12 lll.5 93.4 109.0 101.5 204.6 112.8 109.4 113.2 119. 9 96.4 87.2 120.6
1991 01 112. 2 92. 9 109.0 102.4 208.5 113.5 109.1 113.1 121. 3 96.4 89.2 121.4 02 112. 2 91.8 109.0 102.3 208.7 113.2 108.8 113.5 121. 5 96.0 89.2 122.0 03 110. 7 91.4 109.0 102.0 112. 7 108.5 113. 9 121. 6 89.1 12l. 6 04 122.9
ABHAENGIG BESCHAEFTIGTE HUMBER OF EMPLOYEES HOMBRE DE SALARIES Saisonberctinigt S11asonall'y adjusted Dha i sonnal i sas
1988 III 96.4 93.4 98.5 101. 3 100.l 93.4 94.3 96.0 90.3 96.4 100.7 96.3 IV 96.3 93.9 98.7 101.4 93.5 94.2 96.3 89.9 96.3 100.6 96.5
1989 I 96.8 94.8 98.0 101. 7 94.6 96.l 89 .5 97.1 10 0 .8 96.7 II 96.8 95.l 98.l 102.2 94.8 96.4 89.4 97.2 101.1 96. 3
III 97.0 95.8 98.8 102.9 94.9 97.8 89.3 96.8 101. 4 96.1 IV 97.3 96.2 99.5 103.5 95.3 98.6 88.9 96.4 101. 7 95.9
1990 I 97.4 96.6 99.3 104.7 95.6 98.8 88.4 96.2 95.7 II 97.4 96.9 99.5 105.3 95.6 99.5 87.9 95.9 95.3
III 97.5 99.4 106.0 95.7 99.2 87.5 95.2 95.3 IV 99.1 95.6 94.8 94.3
10

PRODUKTIONSINDIZES • INDICES OF PRODUCTION • INDICES DE PRODUCTION BAUGEWERBE
BUILDING AND CIVIL ENGINEERING BATIMENT ET GENIE CIVIL
NACES EUR12 I DK D GR E I F IRL I L Hl p UK
1980 185.6 122.8 119.4 134.6 88.7 1981 152.9 9S.S 112.4 118.2 131.6 81.8 1982 145.8 85.2 107 .6 111.5 127.l 88.3 1983 118.3 83.6 108.9 106.4 124.4 95.1 1984 105.4 94.5 110. 6 100.8 110.2 99.6 1985 100.0 100.0 100.0 100.0 lOD.D 100.0 1986 101.l 114.3 105.9 105.l 108.9 104.7 1987 99.0 11S.8 105.5 110 .6 118.2 110.7 1988 110. 0 llt8.8 110.4 118.9 12S.4 120.7 1989 115.9 97.9 118. 0 124.3 135.3 125.7 1990 144.6 91.2 125.D 127.2 140.8 127.0
Arbeitstaglich Per working da!I Par jour ouvrabl•
1988 01 95.3 108.9 78.0 114.7 95.l 117.5 02 91.4 101.8 73.4 113.8 107.8 117.5 03 98.8 103.0 87.1 116.6 122.2 117.5 04 127.2 105.3 116.8 126.3 147.3 119.l 05 123.2 110 .l 123.0 129.6 152.2 119.l 06 134.l 112.4 125.6 129.1 152.7 119.l 07 46.7 110.l 123.5 120.3 152.2 122.l D8 123.4 110.1 122.4 77.9 63.7 122.1 09 135. 0 112.4 133.l 126.0 149.6 122.1 10 129.l 111.2 136.6 129.1 144.8 122.4 11 131. l 111.2 116.8 134.9 .133.3 122.4 12 84.9 108.9 88.0 108.2 84.0 122.4
1989 01 87.7 97.0 92.3 115.0 104.0 122.9 02 115.4 91.1 91.l 124.4 129.4 122.9 03 118.7 92.3 112.6 126.6 139.5 122.9 04 127.1 95.9 121.3 127.5 147.8 125.6 05 125.9 99.4 120.3 140.8 154.5 125.6 06 137.4 lD0.6 130.0 133.4 158.2 125.6 07 53.2 99.4 126.0 126.8 159.0 126.8 08 123.7 100.6 124.7 80.2 61.3 126.8 09 146.8 100.6 13't.2 131.2 155.1 126.8 10 135.4 100.6 143.l 134.7 154.7 125.5 11 131.7 100.6 127.l 136.0 149.6 125.5 12 87.l 97.0 92.8 114.8 110.6 125.5
1990 01 115.7 91.l 93.2 119.4 84.1 125.5 D2 138.3 85.2 96.5 125.4 132.2 125.5 D3 161.2 85.2 127.0 131.l 148.2 125.5 04 156.0 88.8 128.6 136.1 159.5 126.9 D5 163.1 93.5 136.l 141.5 170 .o 126.9 06 171.3 94.7 132.0 141.6 181.1 126.9 07 64.6 94.7 137.7 125.4 173.2 130.0 08 153.0 94.7 128.8 83.0 61. 7 130.0 09 170.0 94.7 141.7 136 .9 167.7 130.0 10 163.2 95.9 153.4 136.l 162.2 123. 7 11 171.6 92.3 131.3 138.4 158.5 123.7 12 106.9 84.0 93.6 111.3 91.3 123.7
1991 01 108.3 76.9 98.1 123.7 97.7 02 72.2 69.5 113.7 03 131.3 131.5
Saisonbarainigt: Seasonally adjusted D6sa fsonnal fsh
1988 01 130.4 115.9 126.0 128.4 150.0 121.7 02 124.9 117.7 123.4 120.3 138.l 121.7 03 104.l 116.8 107.3 112.9 119.6 121.7 04 109.9 115.5 108.7 117 .9 128.4 119.8 05 104.9 112.2 110.S 114.8 129.0 119.8 06 106.7 109.8 110.l 117.4 123.7 119.8 07 97.l 106.l 104.3 118.6 125.3 119.3 08 108.8 105.l 111.6 118.l 123.4 119.3 09 1D7.2 104.1 107.7 119. D 127.1 • 1 119.3 10 106.3 101.6 106.2 119.3 123.3 122.2 11 117.8 100.5 106.5 122.3 119.3 122.2 12 107.3 101.6 107.9 119.l 109.2 122.2
1989 01 119.3 102.6 134.l 127.l 150.9 127.2 02 141.2 104.4 135.5 129.4 153.0 127.2 03 125.l 104.1 132.6 123.5 137.8 127.2 Git 111.6 104.1 114.5 120.0 128.5 126.3 05 110.4 100.5 110.4 125.l 130.4 126.3 06 112.1 98.0 115.ift 122.2 128.9 126.3 07 105.6 96.l 109.4 124.7 131.4 123.8 08 111.1 96.1 114.4 121.6 122.8 123.8 09 119.2 93.3 110.5 124.2 131.8 123.8 10 114.2 91.9 114.1 124.9 133.2 125.4 11 117.5 90.9 116.7 123.5 134.6 . 125.4 12 111.2 90.l 113.6 125.7 138.4 125.4
1990 01 139.3 95.3 129.5 130.0 130.6 130.1 02 152.l 96.2 134.2 128.6 149.l 130.1 03 161.3 95.l 142.9 128.4 146.2 130.l 04 140.4 95.6 123.0 128.7 140.4 127.8 05 148.0 94.6 127.4 126.2 145.5 127.8 06 147 .6 92.8 120.1 130.2 149.4 127.8 07 126.6 92.S 124.5 124.4 146.8 126.4 08 144.1 91.7 121.0 126.0 130.D 126.4 09 145.7 89.9 121.3 129.8 145.6 126.4 10 146.2 90.0 126.5 127.0 141.S 123.8 11 158.2 86.1 123.3 126.6 143.3 123.8 12 143.0 80.2 ,_ 118.9 124.0 124.7 123.8
1991 01 131,8 82.7 128.4 129.3 137.3 02 82.8 106.8 117.6 03 139.3 127.9
11

INDEX DER BESCHAEfflGUNG NACE 1-4
INDEX OF EMPLOYMENT NACE 1-4
INDICE DE L'EMPLOI NACE 1-4
105 · · · · · · · · · · · · · · · · · · · · · · · · ,; · · · · · /
/
I I
I 103 · · · · · · · · · · · · · · · · · · · i · · · · · · · · · ·
101
99 J
I I
/ I
1 ... . . ..... . ......... .
1986 1987 1988 1989 1990 1991
j -EUR12 --us! -----Japan
104 · · · · · · · · · · · · · · · · · · · · · · · · · · · · · ·
92 1986 1987 1988 1989 1990 1991
- Nederland • • • • • BeJ.aique
-- Luxembourg - - - - - Ireland
1985=100
115 · · · · · · · · · · · · · · · · · · · · · · · · · · · · · ·
110 · · · · · · .. ... . . ..... .. . . . ... . . . .
105 · · · · · · · · · · · · · · · · · · · · · · · · · · · · ·
100 · · · · · · · · · · · · · · · · · · · · · · · · · · ....
90 · · · · · · · · · · · · ·
85 1986 1987 1988 1989 1990 1991
- Deutschland • • • • • France
- -nalia - - - - - United Kingdom
104 · · · · · · · · · · · · · · · · · · · · · · · · · · · · · ·
102
100
98
--, . ' . 96 . . . I . . .. \ .... ... . .. .. . .... .. .. .
\ 'v'"' I \
94 · · · ·1 ·/ .... '- \ · · ; • \ · · · · · · · • · · • · • · • · · _,, \ I • •
\ I 92 · · · · · · · · · ./ . . · · · · · · · · · · · · · · · · · · · ·
1986 1987 1988 1989 1990 1991
-nanmark •••••Espana
--Greece - - - - - Porl111al