raport na cd - wroclaw.pios.gov.pl · air diagram 2.3. dust and gas pollution (excl. carbon...
TRANSCRIPT

AIR
2. AIR
Air is one of the most susceptible-to-pollutionenvironmental components which substantially affectsconditions of human, animal and plant life.
Combustion of fuels in powerhouses, heat andpower stations, individual house furnaces and meansof transport is the basic process in which the emissionof pollutants to the air occurs. Also industry andagriculture cause pollution.
Air quality in the province of Lower Silesia is formedmainly by:
municipal-household sources, accountablemainly for higher pollution concentration, especiallysuspended dust, benzo(a)pyrene and sulphur dioxidein the winter time. Making use of low-efficientdevices and boiler installations in local boiler housesand house heating stoves, their poor conditions,inappropriate operation and burning off-quality fuels(sulphating, ash-contented, low-calorie coal,carbonic calm and all kinds of household waste) arethe major cause of so-called low emission. A hugeamount of sources introducing pollution from shortchimneys makes the phenomenon very onerousbecause pollution focuses around the places whereit is produced and these are very often the areas ofcongested residential housing. „Low” emission isparticularly onerous in the mountainous areaswhere there are unfavourable conditions forspreading pollution.
road transport which affects all-year high levelsof nitric oxide, elevated levels of suspended dustPM10 and benzene in the air. Large aircontamination occurs at the crossroads of mainstreets and roads, close to communication routeswith heavy traffic going through congestedresidential areas. Poor vehicle conditions, theirimproper operation, traffic stoppages caused bybad traffic organisation and too low road capacityare the main reasons of excessive pollutionemission generated by means of transport.
industrial sources having the largest share in thepollution emission at the area of the province.Power plants, heat and power plants, industrialboiler houses and manufacturing processes belongto this group of emitters. In terms of emission of air pollution from industrial
emitters Lower Silesia ranks one of the higher positionsin Poland. According to Central Statistical Office data,the province ranks 5th place in terms of total pollutionemission and exhaust gases emission (just behind the
following provinces: Œl¹skie, £ódzkie, Mazowieckie andWielkopolskie) from particularly onerous works andestablishments (data for 2008). Emission of pollutionfrom the province of Lower Silesia comprises 7.8% ofgas emission (without carbon dioxide) and 8,3 % of thetotal dust emission in the country.
The largest share in the emission of dust pollution in2008 (77.7% of the whole province emission) have thefollowing districts: Zgorzelecki, Lubiñski, Polkowicki,Wo³owski, the city of Wroc³aw and in the emission ofgas pollution (91.9% of the whole province emission) –Zgorzelecki, G³ogowski, Wroc³awski districts and cities:Wroc³aw and Legnica).
PRESSURES
Diagram 2.1. Dust and gas emission (without carbondioxide) from particularly onerous establishmentslocated in the province of Lower Silesia in 2008against other provinces (source: CSO)
Gas emission7,8%
6,1%
8,4%
12,9%
16,8%19,7%
28,2%
dolnośląskie
małopolskie
wielkopolskie
mazowieckie
łódzkie
śląskie
others
Dust emission8,3%
7,4%
8,6%
8,7%
8,9%
18,4%
39,7%

AIRFigure 2.1. Emission of gas pollution in particular districts in the province of Lower Silesia in 2008 (Source: CSO)
Nitric oxides
< 2,0
Emission in kMg / year:
2,0÷10,010,1÷50,050,1÷100,0100,1÷200,0200,1÷1000,01000,1÷5000,0> 5000,0
Gas pollution, total
< 20,0
Emission in Mg / year
20,1÷50,050,1÷100,0100,1÷250,0250,1÷500,0500,1÷1000,01000,1÷5000,0>5000
Sulphur dioxide
< 10,0
Emission in Mg / year:
10,1÷50,050,1÷100,0100,1÷250,0250,1÷500,0500,1÷1000,01000,1÷5000,0> 5000,0

AIRFigure 2.2. Emission of dust pollution in particular districts in the province of Lower Silesia in 2008 (Source: CSO)
< 20
Emission in Mg / year:
20÷60
61÷100
101÷200201÷500
501÷1000
1000>
Dust pollution
The total emission from the province of LowerSilesia from works and establishments covered by thestatistics in 2008 amounts to:
dust – 6.4 kMg (reduction by 4,4% compared to2007),
sulphur dioxide – 54.1 kMg (reduction by 11.2%), nitric oxides – 18.98 kMg (reduction by 9.5%),carbon monoxide – 9.3 kMg (reduction by 17.6%), carbon dioxide – 16870.7 kMg (increase by 1.8%).
PGE “Turów” JSC Power Plant in Bogatynia, thesecond professional power plant in Poland in terms ofinstalled power driven by lignite has got the vital share inthe total air pollution emission in the province of LowerSilesia. It is also the second largest emitter of pollutionin Poland. In June 2009 the power plant activatedinstallation of biomass burning. Thanks to theinvestment the power plant will increase production ofelectric energy reducing CO2 emission at the same time.
Table 2.1. Emission of air pollution from PGE “Turów” JSC Power Plant in Bogatynia compared to the emission fromthe province of Lower Silesia and Zgorzelecki district (source: CSO, monitoring activities by the PIEP)
Emission in 2008 DustGases (excl.
CO2)SO2 NO2 CO2
the province of Lower Silesia kMg (CSO) 6,400 87,942 54,052 18,978 16870,678kMg (PIEP) 2,782 50,965 38,172 11,913 12879,526% of the provincial emission 43,4% 57,9% 70,6% 62,7% 76,3%PGE „Turów” JSC Power Plant% of Zgorzelecki district emission 95,3% 99,5% 99,9% 99,6% 99,8%

AIR
Diagram 2.3. Dust and gas pollution (excl. carbondioxide) emission in the province of Lower Silesiain 1991–2008 (source: CSO)
Dust
25,5%
2,6%
2,6%
0,7%
13,0%
1,9%
53,8%
Sulphur dioxide
7,4%
3,6%
7,7%
71,6%
1,1%
8,7%
Nitrogen dioxide
13,6%
1,2%1,5%
64,7%
10,3%
4,3%
4,3%
PGE “Turów” JSC Power Plant in Bogatynia
“Wrocław” Electro-heating Plant in Wrocław
“Czechnica" Electro-heating Plant in Siechnice
“Energetyka-Rokita” Ltd. Energy Services in Brzeg Dolny
“Wałbrzych” JSC Coke Works in Wałbrzych
KGHM “Polska Miedź” – “Głogów I” Copper Works Unit in Głogów
others
Diagram 2.2. The share of the largest establishments of the province of Lower Silesia in the pollution of air with dust,sulphur dioxide and nitrogen dioxide in comparison to the total emission from selected establishmentscontrolled by PIEP in 2008 (source: PIEP)
Besides the mentioned power plant, other relevantpoint sources of emission of air pollution include:“Kogeneracja” JSC Heat and Power Plants, KGHM“Polska MiedŸ” – “G³ogów I” Copper Works Unit,“Energetyka-Rokita” Ltd. Energy Services in BrzegDolny, “Victoria” Coke Works in Walbrzych, EnergetykaLtd. in Lubin, WPEC JSC in Legnica and Fortum Powerand Heat Polska Ltd. DZT Unit in Œwiebodzice.
After the significant drop of emission at thebeginning of the 1990s, in 2000-2008 further drop ofdust pollution was observed, especially from processesof fuel burning. Whereas gas pollution emission fromparticularly onerous works and establishments duringthe analysed period remained stable, fluctuating a littlewithin several years, depending on heatingrequirements.
0
50
100
150
200
250
300
350
400
1991
1992
1993
1994
1995
1996
1997
1998
1999
2000
2001
2002
2003
2004
2005
2006
2007
2008
dusts in total gasses excl.carbon dioxide
Emis
sion
[kM
g / y
ear]

AIRDiagram 2.4. Dust and gas pollution from particularly
onerous establishments in 2000–2008 in theprovince of Lower Silesia (source: CSO)
Diagram 2.5. Emission of gas pollution from particularlyonerous establishments in 2000–2008 in theprovince of Lower Silesia (source: CSO)
0
5
10
15
20
25
2000 2001 2002 2003 2004 2005 2006 2007 2008
dust in total including from fuel burning
Emis
sion
[kM
g / y
ear]
0
10
20
30
40
50
60
70
80
2000 2001 2002 2003 2004 2005 2006 2007 2008
sulphur dioxide incl. sulphur dioxide from fuel burningnitric oxides incl. nitric oxide from fuel burningcarbon monoxide
Emis
sion
[kM
g / y
ear]
CURRENT SITUATION
Air quality of the province of Lower Silesia iscontrolled by the State Environmental Monitoringsystem through measurements of basic air pollutionfor which acceptable or target concentration levels arespecified.
Monitoring stations are located mainly in urbanareas and at impact areas of the largest Lower Silesianestablishments – PGE “Turów” Power Plant and KGHM“Polska MiedŸ”. The results from these stations areapplied to the set criteria taking into consideration theprotection of human health.
In rural areas, far from the sources of pollutionemission, ecosystem monitoring stations are located.They assess air pollution levels in relation with thenorms established for the protection of plants.
Measuring data coming from the Lower Silesian AirMonitoring System is gathered in the provincialdatabase on air quality located in the ProvincialInspectorate for Environmental Protection in Wroc³aw.The level of air pollution concentrations recorded byautomatic stations owned by PIEP in Wroc³aw ispresented constantly at the following page: air.wroc-law.pios.gov.pl.
Photo 2.1. Air quality monitoring station in O³awa(photo by Agnieszka Miko³ajczyk)
Photo 2.3. Air quality monitoring station at the Œnie¿neKot³y (photo by Marek Bieniek)
Photo 2.2. High-flow sampler of suspended dust PM10(photo from the PIEP Archives)

Figure 2.3. Air quality monitoring stations in the province of Lower Silesia in 2008 (source: PIEP)
Wrocław
Oleśnica
Milicz
Trzebnica
Oława
Strzelin
Ząbkowice Śl.
Kłodzko
Dzierżoniów
Świdnica
Wałbrzych
Środa Śl.
Legnica
Jawor
Kamienna Góra
Lubin
ZłotoryjaLwówek Śl.
Bolesławiec
Lubań
Zgorzelec
Polkowice
Wołów
GłogówGóra
Jelenia Góra
manual stations (including sampler of dust PM10)
4
16
34
2021
11
8
38
41
56
4546
47
4849
50
575859
6061
62
63
64
65
66
6768
6970
71
72
73
74
7576
7778
79
8081 82
83
84
85
86 87
88
89
5152
53
54
55
56
passive stations17
30
31
35
36
automatic stations (protection of plants)
automatic stations (protection of health)
1
2223
24
25
26
27
32
33
28
29
9
12
3940
42
14
15
18
19
13
10
7
23
44
1.Wrocław, Wiśniowa St.(PIEP)2.Wrocław, Bartnicza St. (PIEP)3.Wrocław, J.Conrada-Korzeniowskiego Emb.(PIEP)4.Wrocław, J.Conrada-Korzeniowskiego Emb.(PSES)5.Wrocław, Wierzbowa St.(PIEP)6.Wrocław, Orzechowa St.(PSES)7.Jelenia Góra, Cieplice (PIEP)8.Jelenia Góra, Grottgera St.(PSES)9. Legnica, Rzeczypospolitej Ave.(PIEP)10. Legnica, Złotoryjska St.(„Legnica” Copper Works)11.Głogów, Norwida St. (PSES)12.Głogów, Sikorskiego St. („Głogów” Copper Works)13.Kromolin („Głogów” Copper Works)14.Sobczyce („Głogów” Copper Works)15.Nowa Ruda, Srebrna St. (PIEP)16.Nowa Ruda, Srebrna St. (PSES)17.Czarna Góra (PIEP)18.Oława, Żołnierzy AK St.(PIEP)19.Wałbrzych, Wysockiego St.(PIEP)20.Wałbrzych, Wysockiego St.(PSES)21.Szczawno-Zdrój, Kopernika St.(PIEP)22.Zgorzelec, Bohaterów Getta St.(PIEP)23.Zgorzelec, Orzeszkowej St.(Turów Power Plant)24.Bogatynia, Chopina St. (Turów Power Plant)25.Jasna Góra, Sportowa St.(Turów Power Plant)26.Wyszków (Turów Power Plant)27.Witka (Turów Power Plant)28.Radomierzyce (Turów Power Plant)29.Działoszyn (PIEP)30.Jeleniów (PIEP)31.Czerniawa (PIEP)32.Wleń (PIEP)33.Dzierżoniów, Piłsudskiego St.(PIEP)34.Świdnica, MArket Square (PSES)35.Śnieżne Kotły (PIEP)36.Śnieżka (IMGW)37.Kamienna Góra, Szpitalna St.(PIEP)38.Lubin, 1-go Maja St. (PSES)39.Rudna (Hydrotechnical Works)40.Kalinówka (Hydrotechnical Works)41.Polkowice, Kasztanowa St.(PIEP)42.Tarnówek (Hydrotechnical Works)43.Trzebnica, Żołnierzy Września St.(PIEP)44.Ząbkowice Śląskie, Powst. Warszawy St.(PIEP)
45. Kłodzko, Franciszkański Sq.46. Kłodzko, Spółdzielcza St.47. Bystrzyca Kłodzka48. Duszniki Zdrój49. Kudowa Zdrój50. Lądek Zdrój51. Nowa Ruda - Słupiec52. Nowa Ruda53. Międzylesie54. Stronie Śląskie55. Polanica Zdrój56. Radków57. Oława, Chrobrego St.58. Oława, Iwaszkiewicza St.59. Domaniów60. Jelcz-Laskowice, Chabrowa St.61. Jelcz-Laskowice, Stawowa St.62. Stanowice63. Lubań64. Leśna65. Świeradów Zdrój66. Lwówek Śląski67. Gryfów68. Lubomierz69. Mirsk70. Wleń71. Jawor72. Bolków73. Męcinka74. Paszowice75. Wądroże Wielkie76. Złotoryja77. Świerzawa78. Wojcieszów79. Zagrodno80. Trzebnica81. Oborniki Śląskie82. Zawonia83. Wisznia Mała84. Prusice85. Żmigród86. Ząbkowice Śląskie87. Ziębice88. Złoty Stok89. Bardo
Types of air monitoring stations:
List of air monitoring stations:
37
43
mobile stations

AIRAt the predominant area of the province of Lower
Silesia the air pollution level registered in 2008 waslower than normative levels and in case of suchpollutants as: sulphur dioxide, carbon monoxide andsome heavy metals (lead, nickel) concentration valueswere considerably lower than permissible levels.
Over-normative air pollution levels in the provinceof Lower Silesia occurred mostly in urban areas andwere connected with concentration of numerouspollution sources at the relatively small area and theirunfavourable distribution.
Air monitoring indicated the impact of industrialplants onto air quality which could be seen, among
others, through: the highest level of 1-hour maximumconcentration of sulphur dioxide registered byestablishment stations of PGE “Turów” Power Plant inZgorzelecki district and KGHM “Polska MiedŸ” inLegnica, exceedance of annual average permissiblevalues of arsenic in Legnica or higher than in other citiesannual average concentration of benzene in Wa³brzych.
However, taking into consideration the reasons ofexceedance of normative values and analysing the areasof occurrence of these higher levels of concentration ofsubstances in the air, it is noticeable that “low” emissionfrom municipal and household sector and car trafficplay a special role in polluting the region.
Table 2.2. The measuring scope of air quality monitoring stations including specification of points with exceedance ofcritical levels in the province of Lower Silesia in 2008
SubstancesNo. Area Station name
SO2 NO2 PM10 PM2.5 CO C6H6 O3 Pb Cd Ni As BaP1. Wrocław, Wiśniowa Ave.2. Wrocław, Bartnicza St.3. Wrocław, J.Conrada-Korzeniowskiego St. (PIEP)4. Wrocław, Wierzbowa St.5.
WrocławAgglomeration
Wrocław, Orzechowa St.6. Jelenia Góra, Cieplice7.
Jelenia GóraJelenia Góra, GrottgeraSt.
8. Legnica, Rzeczypospolitej Ave. (PIEP)9.
LegnicaLegnica, Złotoryjska St.
10. Głogów, Norwida St.11. Głogów, Sikorskiego St.12. Kromolin13.
Głogowski district
Sobczyce14. Nowa Ruda, Srebrna St. (PIEP)15. Nowa Ruda, Srebrna St. (PSES)16.
Kłodzki districtCzarna Góra
17. Oławski district Oława, Żołnierzy AK St.18. Wałbrzych, Wysockiego St. (PIEP)19. Wałbrzych, Wysockiego St. (PSES)20.
Wałbrzyski districtSzczawno-Zdrój, Kopernika St.
21. Zgorzelec, Bohaterów Getta St.22. Zgorzelec, Orzeszkowej St.23. Bogatynia, Chopina St.24. Jasna Góra, Sportowa St.25. Wyszków26. Witka27. Radomierzyce28.
Zgorzelecki district
Działoszyn29. Jeleniów30. Czerniawa31.
Bolesławiecko-Lwówecka area
Wleń32. Dzierżoniów, Piłsudskiego St.33.
Dzierżoniowsko-Świdnicka area Świdnica, Town Square
34. Śnieżne Kotły35. Śnieżka36.
Jeleniogórsko-Kamiennogórskaarea Kamienna Góra, Szpitalna St.
37. Lubin, 1-go Maja St.38. Rudna39. Kalinówka40. Polkowice, Kasztanowa St.41.
Lubińsko-Polkowicka area
Tarnówek
42. Oleśnicko-Trzebnicka area
Trzebnica, Żołnierzy Września St.
43. Strzelińsko-Ząbkowicka area
Ząbkowice Śląskie, Powstańców Warszawy St.
rural station (criterion: plant protection) no measurements
no exceedance critical level exceedance

AIRUsing end-of-use heating systems equipped with
low emitters is the most important factor affecting theincrease of concentration of most air pollutionindications during heating seasons and it is the mainreason of exceedance of normative values ofsuspended dust PM10 and benzo(a)propylene. Onaverage in the whole province during heating periodsthe concentration of SO2 was approx. 4 times higherand the concentration of benzo(a)pyrene approx. 5times higher than in summer period. Negative impactof “low” emission could be seen mostly in placeslocated in mountain valleys: Nowa Ruda, Jelenia Góra-Cieplice, Szczawno Zdrój and in densely urban build-upareas, among others in Wroc³aw and Legnica.
Huge concentration of roads with considerabletraffic in towns and cities result in year-long highconcentration of sulphur dioxide in the air. Dataobtained from the communication station in Wroc³awshows that the exceedance of normative values ofnitrogen dioxide and increased levels of suspended
dust PM10 and carbon monoxide occur nearby largecrossroads and communication routes. Values ofnitrogen dioxide and carbon monoxide concentrationrecorded in the communication station from 2005 wereoften over twice higher than concentration valuesrecorded in other monitoring points in the province.
Apart from high levels of pollution derived from thesources of emission discussed earlier and occurringmainly during heating periods, the high level of ozonein summer has been currently one of the largestproblems of air protection. In the province of LowerSilesia both exceedance of target values in terms ofhuman health protection and of AOT40 factor estimatedin regard to plant protection were registered. Hightemperature and intense sun radiation favour ozoneformation in low layers of the atmosphere. The highestozone concentration registered in Jelenia Góra andWroc³aw in July 2008 exceeded threshold values ofinforming the public opinion about the risk of harmfullevel occurrence.
Diagram 2.6. Concentration of sulphur dioxide registered in the province of Lower Silesia in 2008
Legnica, Rzeczypospolitej Ave.Legnica, Złotoryjska St.Głogów, Sikorskiego St.
KromolinSobczyce
Czarna GóraNowa Ruda, Srebrna St.Oława, Żołnierzy AK St.
Wałbrzych, ysockiegoW St.Bogatynia, Chopina St.
DziałoszynRadomierzyce
WitkaWyszków
Zgorzelec, Bohaterów Getta St.Zgorzelec, Orzeszkowej St.
Czerniawa (areas of health resort )protect.Jeleniów
WleńDzierżoniów, Piłsudskiego St.
Śnieżne KotłyŚnieżka
Trzebnica, Żołnierzy Września St.Ząbkowice, Powstańców Warszawy St.
percentile 99,7 from 1 hour concentrations (the area of the country) / max. 1 hour concentration (areas of health resort protect.)percentile 99,2 from 24 hour concentrations (the area of the country) / max. 24 hour concentration (areas of health resort protect.)annual average
0 20 40 60 80 100 120 140 160 180 200 220 240 260
Wrocław, J.Conrada-Korzeniowskiego Emb.Wrocław, Wiśniowa Ave.
Jelenia Góra-Cieplice (health resort area)protect.
Concentration of sulphur dioxide [ g/mμ ]3

AIR
Wrocław, Bartnicza St.Wrocław, J.C-Korzeniowskiego Emb.
Wrocław, Wiśniowa Ave.Jelenia Góra - Cieplice (health resort area)protect.
Legnica, Rzeczypospolitej Ave.Legnica, Złotoryjska St.Głogów, Sikorskiego St.
KromolinSobczyce
Czarna GóraNowa Ruda, Srebrna St.Oława, Żołnierzy AK St.
Wałbrzych, Wysockiego St.Bogatynia, Chopina St.
DziałoszynJasna Góra, Sportowa St.
RadomierzyceWitka
WyszkówZgorzelec Bohaterów Getta, St.
Zgorzelec, Orzeszkowej St.Czerniawa (health resort area)protect.
JeleniówWleń
Dzierżoniów, Piłsudskiego St.Śnieżne Kotły
ŚnieżkaTrzebnica, Żołnierzy Września St.
Ząbkowice, Pow.Warszawy St.
Concentration of nitrogen dioxid [ g/me μ ]3
0 20 40 60 80 100 120 140 160 180 200
percentile 99,8 from 1 hour concentrations (the area of the country) / max. 1 hour concentration (areas of health resort protect.)annual average
0 10 20 30 40 50 60 70 80 90 100 110 120 130 140
Wrocław, Wierzbowa St.Wrocław, Wiśniowa Ave.
Jelenia Góra, CiepliceLegnica, Rzeczypospolitej Ave.
Legnica, Złotoryjska St.Głogów, Sikorskiego St.
KromolinSobczyce
Nowa Ruda, Srebrna St.Szczawno-Zdrój, Kopernika St.
Wałbrzych, Wysockiego St.Działoszyn
Zgorzelec, Bohaterów Getta St.Bogatynia, Chopina St.
Jasna Góra, Sportowa St.Radomierzyce
WitkaWyszków
Zgorzelec, Orzeszkowej St.Czerniawa
JeleniówWleń
Świdnica, Square MarketDzierżoniów, Piłsudskiego St.
Lubin, 1-go Maja St.Polkowice, Kasztanowa St.
KalinówkaRudna
Tarnówek
Concentration of suspended dust PM10 [ g/mμ ]3
percentile 90,1 from 24 hour concentrations (35 days with overruns acceptable within one year)annual average
Diagram 2.7. Concentrations of nitrogendioxide registered in the provinceof Lower Silesia in 2008
Diagram 2.8. Concentrations of suspendeddust PM10 registered in the provinceof Lower Silesia in 2008

AIRDiagram 2.9. Concentrations of carbon monoxide registered in the province of Lower Silesia in 2008
Diagram 2.11. Concentrations of benzene recorded in the province of Lower Silesia in 2008
Diagram 2.12. Concentrations of lead recorded in the province of Lower Silesia in 2008
Diagram 2.10. Average number of days with the exceedance of the target level of ozone in the province of LowerSilesia in 2006-2008
0 500 1000 1500 2000 2500 3000 3500 4000 4500 5000
Wrocław, J.Conrada-Korzeniowskiego Emb.Wrocław, Wiśniowa Ave.
Legnica, Rzeczypospolitej Ave.Legnica, Złotoryjska St.Głogów, Sikorskiego St.
SobczyceWałbrzych, Wysockiego St.
Zgorzelec, Bohaterów Getta St.
Maximum 8 hour concentration of carbon monoxide [μg/m ]3
Jelenia Góra, Cieplice (health resort area)protect.
0 10 20 30 40 50 60 70
Wrocław, Bartnicza St.Wrocław, .Conrada-KorzeniowskiegoJ Emb.
Jelenia Góra, CiepliceWałbrzych, Wysockiego St.
Czarna GóraCzerniawa
JeleniówŚnieżne Kotły
Śnieżka
Average number of days with the exceedance of the target level of ozone in 2006–2008
0,0 0,5 1,0 1,5 2,0 2,5 3,0 3,5
Wrocław, J.Conrada-Korzeniowskiego Emb.Wrocław, Wierzbowa *St.
Jelenia Góra, Cieplice (health resort area)protect.Legnica, Rzeczypospolite *j Ave.
Wałbrzych, Wysockiego St.
Annual average of benzene concentration [μg/m ]3
* indicator calculated on the ground of the measurement series with 14-50% completeness
0,00 0,05 0,10 0,15 0,20 0,25 0,30 0,35 0,40 0,45 0,50Wrocław, J.Conrada-Korzeniowskiego *Emb.
Wrocław, Wiśniowa *Ave.Wrocław, Orzechowa St.Wrocław, Wierzbowa St.
Jelenia Góra, Grottgera *St.Legnica, Rzeczypospolitej Ave.
Legnica, Złotoryjska St.Głogów, Norwida St.
Głogów, Sikorskiego St.Kromolin
SobczyceNowa Ruda, Srebrna St.
Szczawno-Zdrój, Kopernika St.Wałbrzych, Wysockiego St.
DziałoszynZgorzelec, Bohaterów Getta St.
CzerniawaJeleniów
Świdnica, Square MarketLubin, 1-go Maja St.
Polkowice, Kasztanowa St.
Annual average of lead concentration [μg/m ]3
* indicator calculated on the ground ofthe measurement series with 14-50% completeness

AIRDiagram 2.13. Concentrations of arsenic recorded in the province of Lower Silesia in 2008
Diagram 2.14. Concentrations of cadmium recorded in the province of Lower Silesia in 2008
Diagram 2.15. Concentration of nickel recorded in the province of Lower Silesia in 2008
Diagram 2.16. Concentration of benzo(a)pyrene recorded in the province of Lower Silesia in 2008
0 1 2 3 4 5 6 7 8
Wrocław, Wiśniowa *Ave.Wrocław, Wierzbowa St.
Legnica, Rzeczypospolitej Ave.Szczawno-Zdrój, Kopernika St.
DziałoszynZgorzelec, Bohaterów Getta St.
CzerniawaJeleniów
Polkowice, Kasztanowa St.
Annual average of arsenic concentration [μg/m ]3
* indicator calculated on the ground of the measurement series with 14–50% completeness
0 1 2 3 4 5
Wrocław, J.Conrada-Korzeniowskiego *Emb.Wrocław, Wiśniowa *Ave.Wrocław, Orzechowa St.Wrocław, Wierzbowa St.
Legnica, Rzeczypospolitej Ave.Głogów, Norwida St.
Nowa Ruda, Srebrna St.Szczawno-Zdrój, Kopernika St.
Wałbrzych, Wysockiego St.Działoszyn
Zgorzelec, Bohaterów Getta St.Czerniawa
JeleniówŚwidnica, Market Square
Lubin, 1-go Maja *St.Polkowice, Kasztanowa St.
Annual average of cadmium concentration [μg/m ]3
* indicator calculated on the ground of the measurement series with 14–50% completeness
0 2 4 6 8 10 12 14 16 18 20
Wrocław, J.Conrada-Korzeniowskiego *Emb.Wrocław, Wiśniowa *Ave.Wrocław, Orzechowa St.Wrocław, Wierzbowa St.
Jelenia Góra, Grottger *a St.Legnica, Rzeczypospolitej Ave.
Głogów, Norwida *St.Szczawno-Zdrój, Kopernika St.
Wałbrzych, Wysockiego St.Działoszyn
Zgorzelec, Bohaterów Getta St.Czerniawa
JeleniówŚwidnica, Square Market
Lubin, 1-go Maja St.Polkowice, Kasztanowa St.
Annual average of nickel concentration [μg/m ]3
* indicator calculated on the ground of the measurement series with 14–50% completeness
0 1 2 3 4 5 6 7 8 9 10
Wrocław, Wierzbowa St.Legnica, Rzeczypospolitej Ave.Szczawno-Zdrój, Kopernika St.
DziałoszynZgorzelec, Bohaterów Getta St.
CzerniawaJeleniów
Polkowice, asztanowaK St.
Annual average of benzo a pyrene concentration [μg/m ]( ) 3

AIR
The principle objective of the assessment of levelsof substances in the air in line with article 89 of the Acton environmental protection (Journal of Laws2008.25.150) is aimed at classification of areas thatprovides foundations for planning activities forimproving air quality in regions where critical values forhealth, plants and animals protection are exceeded.
High level of pollution of air with suspended dustPM10 was the main reason to classify regions toprepare recovery programs. Since 2005 tolerancemargin for suspended dust PM10 has amounted to 0;therefore any exceedance of that level in annual averageor day average results in classification of these regionsfor preparation of air protection programs (class C).
In 2008 exceedance of acceptable annual averagelevel of suspended dust PM10 was observed in NowaRuda at Srebrna St.: annual concentration at the level of60.2 µg/m3 – 151% of standard. Over-normativeexceedance of daily average values in 2008 wereregistered:
in Zgorzelec, at Bohaterów Getta St.: 42 days, in Wroc³aw, at Wierzbowa St.: 55 days, in Legnica, at Rzeczypospolitej Ave.: 59 days,in Szczawno Zdrój, at Kopernika St.: 65 days, in Jelenia Góra, Cieplice: 73 days, in Nowa Ruda, Srebrna St.: 125 days.
In other monitoring points over-normative dailyconcentrations were also observed but the frequencywas smaller than acceptable 35 days per year.
The whole province of Lower Silesia was graded toprepare air protection plans due to the exceedance oftarget levels of ozone specified individually forprotection of human health and for protection of plants.Over-normative number of days with exceedance ofmaximum 8-hour average specified for protection ofhuman health was observed in most of the urban andrural stations. Then exceedance of the target value ofAOT40 indicator – parameter that characterises thelevel of air pollution by ozone in plant protection terms– was observed in all the rural stations. Both targetlevels should be achieved by 2010.
In reference to target levels specified for arsenic,cadmium, nickel and benzo(a)pyrene that should beachieved by 2013, exceedance was observed in thefollowing:
benzo(a)pyrene:– in Polkowice, at Kasztanowa St.: 3,0 ng/m3,– in Wroclaw, at Wierzbowa St.: 3,1 ng/m3,
– in Zgorzelec, at Bohaterów Getta St.: 3,5 ng/m3,– in Legnica, at Rzeczypospolitej Ave.: 5,0 ng/m3,– in Szczawno Zdrój, at Kopernika St.: 9,8 ng/m3;arsenu: – in Legnica, at Rzeczypospolitej Ave.: 7,7 ng/m3.
On the basis of the classification of the areas withinthe province of Lower Silesia for 2008, air protectionprograms in human health terms are required to becreated for the following areas within the province:
1. Wroc³aw agglomeration (PM10, benzo(a)pyrene,ozone),2. Jelenia Góra (PM10),3. Legnica (PM10, arsenic, benzo(a)pyrene),4. K³odzki district (PM10),5. Wa³brzyski district (PM10, benzo(a)pyrene),6. Zgorzelecki district (PM10, benzo(a)pyrene),7. Lubiñsko-Polkowicka area (benzo(a)pyrene),8. Dolnoœl¹ska area (ozone)On the basis of the classification of the areas within
the province of Lower Silesia in plant protection termsit is recommended to prepare the air protectionprogram in the Dolnoœl¹ska area due to over-normativeconcentration of ozone (AOT40 indicator).
O Arealeśnicko-trzebnicka
OławskiDistrict
Strzelińsko--ząbkowicka
Area
Średzko-wrocławskaArea
Kłodzki District
Dzierżoniowsko--świdnicka
AreaWałbrzyskiDistrict
J aArea
aworsko-złotoryjsk
Jeleniogórsko--kamiennogórska
Area
LArea
ubińsko-polkowicka
Jelen
ia Góra
Legnica
Wroc awAgg meration
łlo
gorz
elec
kiD
Zis
tric
t
Bolesławiecko--lwówecka
Area
G skiistrict
łogowD
Class A
Class C
Figure 2.4. Classification of areas of Lower Silesia forsulphur dioxide, nitrogen dioxide, benzene, carbonmonoxide, lead, cadmium, nickel (healthprotection criterion) in 2008
Figure 2.5. Classification of areas of Lower Silesia for2008 for suspended dust PM10 (health protectioncriterion) in 2008

AIR
In the figures 2.4-2.10 the results of the classifi-cation of the areas within the province of Lower Silesiafor 2008 were presented with the application of thefollowing symbols:
class A: concentration level which does not exceedacceptable level or target level,
class C: concentration level above acceptable level,acceptable level extended by tolerance margin ortarget level; air protection program required,
class D1: concentration level which does notexceed long-term objectives,
class D2: concentration level above long-termobjectives; air protection program required.
O Arealeśnicko-trzebnicka
powiatoławski
Strzelińsko--ząbkowicka
Area
Średzko-wrocławskaArea
Kłodzki District
Dzierżoniowsko--świdnicka
AreaWałbrzyskiDistrict
J aArea
aworsko-złotoryjsk
Jeleniogórsko--kamiennogórska
Area
LArea
ubińsko-polkowicka
Jelen
ia Góra
Legnica
Wroc awAgglomeration
ł
Zis
tric
t
gorz
elec
kiD Bolesławiecko-
-lwóweckaArea
G skiistrict
łogowD
Class A
Class C
Wroc awAgglomeration
łLower Silesian Area
Class A / Class D1
Class C / Class D2
unclassified areain plant protection terms
O Arealeśnicko-trzebnicka
OławskiDistrict
Strzelińsko--ząbkowicka
Area
Średzko-wrocławskaArea
Kłodzki District
Dzierżoniowsko--świdnicka
AreaWałbrzyskiDistrict
J aArea
aworsko-złotoryjsk
Jeleniogórsko--kamiennogórska
Area
LArea
ubińsko-polkowicka
Jelen
ia Góra
Legnica
Wroc awAgglomeration
ł
Zis
tric
t
gorz
elec
kiD
Bolesławiecko--lwówecka
Area
G skiistrict
łogowD
Class A
Class C
strefa dolnośląska
Class A / Class D1
Class C / Class D2
Wroc awAgglomeration
ł
O Arealeśnicko-trzebnicka
OławskiDistrict
Strzelińsko--ząbkowicka
Area
Średzko-wrocławskaArea
Kłodzki District
Dzierżoniowsko--świdnicka
AreaWałbrzyskiDistrict
J aArea
aworsko-złotoryjsk
Jeleniogórsko--kamiennogórska
Area
LArea
ubińsko-polkowicka
Jelen
ia Góra
Legnica
Wroc awAgglomeration
ł
Zis
tric
t
gorz
elec
kiD
Bolesławiecko--lwówecka
Area
G skiistrict
łogowD
Class A
Class C
unclassified areain plant protection terms
Figure 2.6. Classification of areas of the province ofLower Silesia for 2008 for arsenic (criteria ofhuman health protection)
Figure 2.8. Classification of areas of the province ofLower Silesia for 2008 for ozone (criteria ofhuman health protection)
Figure 2.9. Classification of areas of the province ofLower Silesia for 2008 for ozone (criteria of plantprotection)
Figure 2.10. Classification of areas of the province ofLower Silesia for 2008 for sulphur dioxide andnitrogen dioxide (criteria of plant protection)
Figure 2.7. Classification of areas of the province ofLower Silesia for 2008 for benzo(a)pyrene (criteriaof human health protection)

AIRAnalysing long-term changes in air quality in the
province of Lower Silesia it can be noticed that after adrop of air pollution during the past 10 years of the 20th
century, from 2000 annual average concentration ofpollution has remained at the similar level. Variances inthe average annual concentrations, in the number ofdays with daily average concentration exceedancerecorded in individual years were dependent mainly onweather conditions (air temperature affecting intensityof heating processes, favourable conditions forcreating inverse layer and spreading pollution), to alesser extent on local actions aimed at improvement ofair quality.
Positive changes can be noticed in Wroc³aw whereannual average values of suspended dust PM10concentration since 2007 has been below acceptablevalues, in Wa³brzych – decrease of annual average ofbenzene concentration from over-normative values toapproximately 70–80% of standard or in Legnica wheredecrease of carbon monoxide level can be observed inthe air. In 2008 in comparison with the previous years,most of the monitoring stations measuring suspendeddust PM10 observed that the number of exceedance ofaverage daily acceptable levels decreased.
Diagram 2.18. Changes in annual average concentrations of sulphur dioxide in automatic stations used by the PIEPin Wroclaw in 2005–2008
0
2
4
6
8
10
12
14
16
18
20
Nowa Ruda Zgorzelec Legnica Dzierżoniów Wleń Wałbrzych Wrocław(communication station)
Jelenia Góra Wrocław(urban background station)
Działoszyn
2005
2006
2007
2008
Con
cent
ratio
n of
sul
phur
dio
xide
[μg/
m]3
Diagram 2.17. Changes in annual average concentrations of sulphur dioxide in main cities and towns of the provinceof Lower Silesia in 1993–2008
0
5
10
15
20
25
30
35
40
45
50
1993 1994 1995 1996 1997 1998 1999 2000 2001 2002 2003 2004 2005 2006 2007 2008
WrocławJelenia GóraLegnicaWałbrzych
Con
cent
ratio
n of
sul
phur
dio
xide
[μg/
m]3
Photo 2.4. Rainbow above Wroc³aw (photo byAgnieszka Miko³ajczyk)

AIR
Diagram 2.20. Changes in annual average concentrations of nitrogen dioxide in automatic stations used by PIEP inWroclaw between 2005–2008
0
10
20
30
40
50
60
70
80
Wrocław(com. st.)
Wrocław(urban st.)
Legnica Zgorzelec JeleniaGóra
NowaRuda
Wałbrzych Wrocław(suburban st.)
Dzierżoniów Działoszyn Wleń
2005200620072008
Con
cent
ratio
n of
nitr
ogen
dio
xide
[μ
g/m
]3
Diagram 2.22. Changes in annual average concentrations of suspended dust PM10 in selected stations in 2005–2008
0
10
20
30
40
50
60
70
80
90
100
Nowa Ruda Wrocław(urban st.)
Wrocław(com. st.)
Lubin Legnica Świdnica Głogów Polkowice Działoszyn Wałbrzych
2005200620072008
Con
cent
ratio
n of
PM
10 [
μg/
m]3
Diagram 2.19. Changes in annual average concentrations of nitrogen dioxide in main cities and towns of the provinceof Lower Silesia in 1994–2008
0
10
20
30
40
50
60
1994 1995 1996 1997 1998 1999 2000 2001 2002 2003 2004 2005 2006 2007 2008
WrocławJelenia GóraLegnicaWałbrzych
Con
cent
ratio
n of
nitr
ogen
dio
xide
[μ
g/m
]3
Diagram 2.21. Changes in annual average concentrations of suspended dust PM10 in Wroc³aw between 1994–2008
20
30
40
50
60
70
80
1994 1995 1996 1997 1998 1999 2000 2001 2002 2003 2004 2005 2006 2007 2008
Wrocław, Wierzbowa St.
Con
cent
ratio
n of
PM
10 [
μg/
m]3

AIR
Chemical mechanism of precipitationsPrecipitation is one of the meteorological components
that transfers natural and anthropological pollutantsaccumulated in the atmosphere to the ground.Chemical composition of precipitations in the provinceof Lower Silesia has been monitored since 1994 by theInstitute of Meteorology and Water Management inWroc³aw within the Regional Monitoring of the RiverBasin of Middle Odra.
The province of Lower Silesia in 2008 wascharacterised by predominant inflow of arctic maritimeair mass from west wind sector.
Precipitation occurred in the predominant part ofthe province and was below long-term standard withthe deficit of 5%, the largest – 21% in Rudna and over11% in the ¯migrodzka and Milicka valleys, the area ofWroc³aw, in the K³odzka valley and at the Œnie¿kamount. More than average precipitation was observedin the south-west of the province up to 112% ofstandard in Bogatynia and Zgorzelec.
In particular monitoring stations precipitation levelsfluctuated between: monthly – from 10.1 mm in May inRudna to 172.4 mm in July in Bogatynia and annually – from 425.1 mm in Brzezie to 1282.2 mm in
Diagram 2.23. Changes in maximum 8-hour concentrations of ozone in Wroc³aw at Bartnicza St. in 2006–2008
0
20
40
60
80
100
120
140
160
180
200HEATINGPERIOD
NON-HEATINGPERIOD
HEATINGPERIOD
NON-HEATINGPERIOD
HEATINGPERIOD
NON-HEATINGPERIOD
HEATINGPERIOD
41 days > 120 μg/m3 29 days > 120 μg/m3 21 days > 120 μg/m3
Max
. 8-h
our c
once
ntr.
of o
zone
[μg/
m]3
Jan 0
6
Feb 0
6
Mar
06
Apr0
6
May 0
6
Jun 0
6
Jul 06
Aug 0
6
Sep 0
6
Oct 06
Nov 0
6
Dec 0
6
Jan 0
7
Feb 0
7
Mar
07
Apr0
7
May 0
7
Jun 0
7
Jul 07
Aug 0
7
Sep 0
7
Oct 07
Nov 0
7
Dec 0
7
Jan 0
8
Feb 0
8
Mar
08
Apr0
8
May 0
8
Jun 0
8
Jul 08
Aug 0
8
Sep 0
8
Oct 08
Nov 0
8
Dec 0
8
Diagram 2.24. Changes in annual average concentrations of benzo(a)pyrene in Wroc³aw at Wierzbowa St.in 2006–2008
HEATINGPERIOD
NON-HEATINGPERIOD
HEATINGPERIOD
NON-HEATINGPERIOD
HEATINGPERIOD
NON-HEATINGPERIOD
HEATINGPERIOD
0
10
20
30
40
50
60
Average concentration in 2006: 4,3 ng/m3 Average concentration in 2007: 3,0 ng/m3 Average concentration in 2008: 3,1 ng/m3
Con
cent
ratio
n of
ben
zo(a
)pyr
ene
[ng/
m]3
Ja
n 0
6
Fe
b 0
6
Ma
r 0
6
Ap
r06
Ma
y 0
6
Ju
n 0
6
Ju
l 0
6
Au
g 0
6
Se
p 0
6
Oct 0
6
No
v 0
6
De
c 0
6
Ja
n 0
7
Fe
b 0
7
Ma
r 0
7
Ap
r07
Ma
y 0
7
Ju
n 0
7
Ju
l 0
7
Au
g 0
7
Se
p 0
7
Oct 0
7
No
v 0
7
De
c 0
7
Ja
n 0
8
Fe
b 0
8
Ma
r 0
8
Ap
r08
Ma
y 0
8
Ju
n 0
8
Ju
l 0
8
Au
g 0
8
Se
p 0
8
Oct 0
8
No
v 0
8
De
c 0
8
Diagram 2.25. Changes in concentration of ozone (AOT40 indicator) at the Œnie¿ka mount in 2004–2008
target level (to be accomplished by the year 2010)
21 531 μg/m ·h – average AOT40 indicator in 2004–20083
long-term target level (to be accomplished by the year 2020)
27 36010 493 11 329 26 786 31 686
20082004 2005 2006 2007
33 00030 00027 00024 00021 00018 00015 00012 0009 0006 0003 000
0
Ozo
ne–
AOT
40 [μ
g/m
·h]
3
AIRJakuszyce. Generally for the province, the lowest
amount of precipitation – 34.2 mm – occurred inFebruary and the highest – 93.0 mm – in August. Theannual average of precipitation for the province is equalto 657.2 mm.
The chemical composition of precipitations wascharacterised with considerable time and spacevariances.
Precipitations in Bogatynia were characterised bythe highest concentration of chlorides, nitrites andnitrates, total nitrogen and sodium whereasprecipitations in Rudna had the highest concentrationof potassium, calcium, magnesium and dryresidues.The highest values of concentrations ofcopper, nickel and lead in precipitations occured inLegnica, in Jawor – sulphates and total phosphorusconcentration was the highest, in Karpacz it was zinc,in Ruszów hydrogen ions and in Boles³awów thehighest concentration in precipitations had cadmium.
Precipitations in Jakuszyce were the least polluted – the lowest concentration of chlorides, nitrites andnitrates, sodium, potassium, calcium, magnesium,copper and dry residues was observed there. In
Przesieka there was the lowest concentration ofchloride and cadmium in precipitations, at the Œnie¿kamount – the lowest concentration of nitrogen andphosphorus, in Ruszów – zinc and nickel, in K³odzko – lead and in Rudna concentration of hydrogen ionswas the lowest.
Seasonally in cold periods (I–III, X–XII)precipitations in all the 26 stations were characterisedby higher concentration of chloride and sodium and inmost of the stations – of sulphates, copper, zinc, leadand cadmium and they had more acidic reaction (pH).In turn, in warm periods (IV–IX) in most of the stationsconcentration of nitrites and nitrates, total nitrogen,total phosphorus, potassium, calcium, magnesium,nickel and dry residue was higher.
The surface load introduced by the analysedpollution fluctuates from 134.4 kg/ha in SzczawnoZdrój to 313.2 kg/ha in Gryfów Œl¹ski, 219.9 kg/ha onaverage.
The size of introduced pollution has beendecreasing according to the formula:
SO4–2>Ntotal>Cl–>Ca>N (NO2
–+NO3–)>Na>K>Mg>Zn>
>Ptotal>Cu>Pb>H+>Ni>Cd
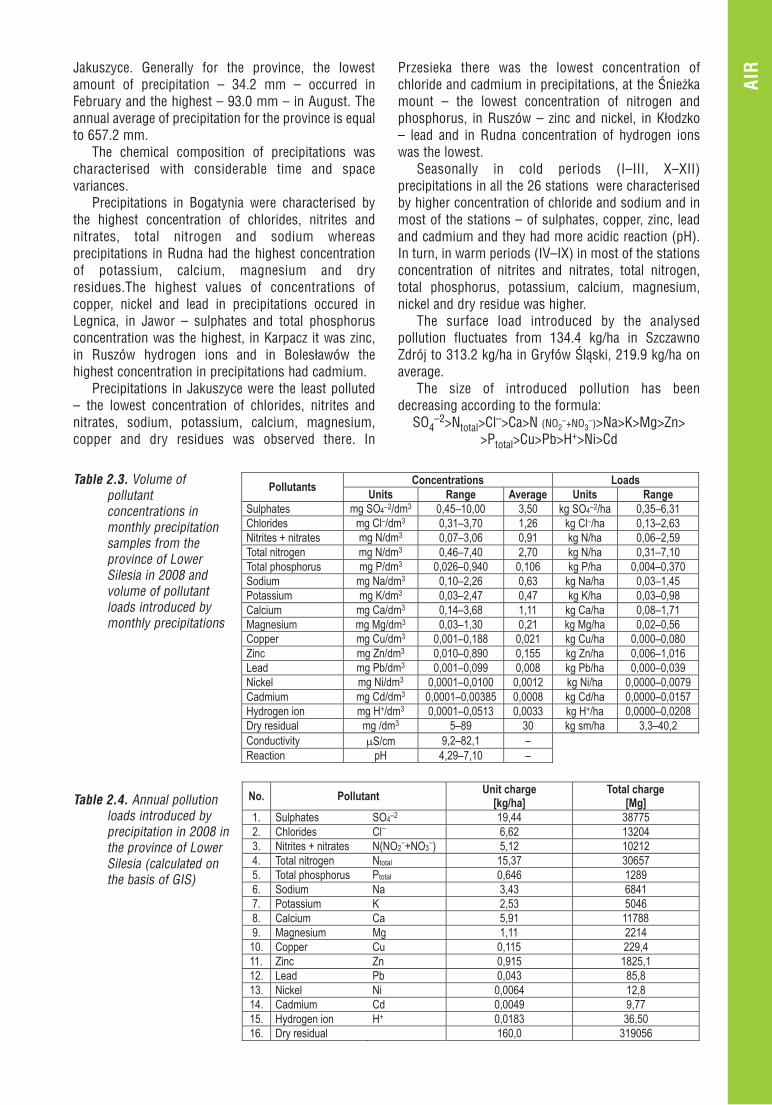
Table 2.3. Volume ofpollutantconcentrations inmonthly precipitationsamples from theprovince of LowerSilesia in 2008 andvolume of pollutantloads introduced bymonthly precipitations
Concentrations LoadsPollutants
Units Range Average Units RangeSulphates mg SO4–2/dm3 0,45–10,00 3,50 kg SO4–2/ha 0,35–6,31Chlorides mg Cl–/dm3 0,31–3,70 1,26 kg Cl–/ha 0,13–2,63Nitrites + nitrates mg N/dm3 0,07–3,06 0,91 kg N/ha 0,06–2,59Total nitrogen mg N/dm3 0,46–7,40 2,70 kg N/ha 0,31–7,10Total phosphorus mg P/dm3 0,026–0,940 0,106 kg P/ha 0,004–0,370Sodium mg Na/dm3 0,10–2,26 0,63 kg Na/ha 0,03–1,45Potassium mg K/dm3 0,03–2,47 0,47 kg K/ha 0,03–0,98Calcium mg Ca/dm3 0,14–3,68 1,11 kg Ca/ha 0,08–1,71Magnesium mg Mg/dm3 0,03–1,30 0,21 kg Mg/ha 0,02–0,56Copper mg Cu/dm3 0,001–0,188 0,021 kg Cu/ha 0,000–0,080Zinc mg Zn/dm3 0,010–0,890 0,155 kg Zn/ha 0,006–1,016Lead mg Pb/dm3 0,001–0,099 0,008 kg Pb/ha 0,000–0,039Nickel mg Ni/dm3 0,0001–0,0100 0,0012 kg Ni/ha 0,0000–0,0079Cadmium mg Cd/dm3 0,0001–0,00385 0,0008 kg Cd/ha 0,0000–0,0157Hydrogen ion mg H+/dm3 0,0001–0,0513 0,0033 kg H+/ha 0,0000–0,0208Dry residual mg /dm3 5–89 30 kg sm/ha 3,3–40,2Conductivity �S/cm 9,2–82,1 –Reaction pH 4,29–7,10 –
Table 2.4. Annual pollutionloads introduced byprecipitation in 2008 inthe province of LowerSilesia (calculated onthe basis of GIS)
No. PollutantUnit charge
[kg/ha]Total charge
[Mg]1. Sulphates SO4–2 19,44 387752. Chlorides Cl– 6,62 132043. Nitrites + nitrates N(NO2
–+NO3–) 5,12 10212
4. Total nitrogen Ntotal 15,37 306575. Total phosphorus Ptotal 0,646 12896. Sodium Na 3,43 68417. Potassium K 2,53 50468. Calcium Ca 5,91 117889. Magnesium Mg 1,11 221410. Copper Cu 0,115 229,411. Zinc Zn 0,915 1825,112. Lead Pb 0,043 85,813. Nickel Ni 0,0064 12,814. Cadmium Cd 0,0049 9,7715. Hydrogen ion H+ 0,0183 36,5016. Dry residual 160,0 319056

AIRThe largest ion sedimentation affecting acidification of
precipitations occurred for sulphates, then chlorides,nitrites and nitrates. In the basic cation group (calcium,magnesium, sodium and potassium) leading to theneutralisation of precipitations the largest average loadwas observed for calcium and the lowest – magnesium.Sedimentation of biogenic compounds (nitrogen andphosphorus) contributing to the changes of trophicconditions and stimulating the process ofeutrophication of surface waters was at the averagelevel of 15.37 kg N/ha per year for total nitrogen and0.646 kg P/ha per year for total phosphorus.Precipitations lodge – on average – the largest amountof zinc and the smallest of cadmium among theanalysed heavy metals.
The surface load of the whole province for most ofthe monitored pollutants introduced from the
atmosphere by precipitations in 2008 was smaller incomparison to 2007 (with smaller average volume ofprecipitations per year) including: annual unit charge ofsulphates decreased by 12.7 %, charge of chlorides –by 6.5%, total nitrogen by 10.8 %, total phosphorus by10.5%, sodium – by 6.0%, potassium – by 15.1%,magnesium – by 5.9%, nickel – 19.0%, hydrogen ions– by 42.6% and cadmium – by 9.3%. The load of leadwas higher by 13.2% , copper – by 26.3% , zinc – by31.8% and nitrites and nitrates and dry residues loadremained at the similar level.
In 2008 in comparison to the average values from1997–2007 sedimentation of the eleven monitoredpollutants was smaller and the land load of the provincewas decreased by 24.8%.The largest downwardtendencies were observed for loads of hydrogen ions,sulphates, dry residue and nickel.
Figure 2.11. Variability of surface load by pollutant load introduced by precipitations in the province of Lower Silesia(left side) and in the area of individual districts (right side) in 2008 (unit charge kg/ha·year, average from themonitored period)
20,43–33,60
Sulphates[kg SO /ha·year]4–2
19,05–20,4318,33–19,0517,17–18,3313,46–17,17
22,81–26,45
Sulphates[kg SO /ha·year]4–2
19,47–22,8118,03–19,4717,81–18,0316,30–17,81
6,52–11,97
Nitrites and nitrates[kg N/ha·year]
5,52–6,525,02–5,524,68–5,023,53–4,68
6,25–8,46
Nitrites and nitrates[kg N/ha·year]
5,02–6,254,53–5,024,42–4,534,03–4,42

AIR
Numerous, implemented in the previous years,investments and measures contributed to the reductionof pollution emission to the air in the province of LowerSilesia. A significant part of them are to limit pollutionfrom municipal-household sources. They consist in,among others, shut-down and modernisation of
inefficient boiler houses (for example modernisations ofboiler houses and local heating plant in Dzier¿oniów,heating plant C3 in Wa³brzych), combining new premiseswith the existing heating network, building new heatingpower premises and activating new heating networks,changing segments of heating network with pre-isolated
REACTIONS
16,57–31,77
Total nitrogen[kg N/ha·year]
15,19–16,5714,41–15,1913,59–14,4110,32–13,59
18,73–24,32
Total nitrogen[kg N/ha·year]
15,01–18,7313,96–15,0113,40–13,9612,68–13,40
0,0298–0,0737
Hydrogen ion[kg H /ha·year]+
0,0221–0,02980,0185–0,02210,0151–0,01850,0017–0,0151
0,0266–0,0322
Hydrogen ion[kg H /ha·year]+
0,0187–0,02660,0153–0,01870,0145–0,01530,0009–0,0145
0,682–1,097
Total phosphorus[kg P/ha·year]
0,626–0,6820,591–0,6260,535–0,5910,333–0,535
0,777–0,859
Total phosphorus[kg P/ha·year]
0,673–0,7770,583–0,6730,551–0,5830,537–0,551

AIRpipes, etc. Moreover, significant effects are brought by
changing the technology of heating from coal to gas, oilfuel or bio-fuel which is common for public utilitypremises and health resorts (in the K³odzka valley allboiler houses in health resort were modernised).
In the capital city of Lower Silesia in 1998-2005 MPECWroc³aw JSC (now “Fortum Wroc³aw” JSC) conductedinvestments aimed at the improvement of air quality byshutting down “low” emission sources and optimisingheating system – 63 local boiler houses mostly usingsolid fuels (coke, coal, braise) were shut down.
Investments that are relevant for the improvementof environmental conditions in the province in 2008obtained support from the Provincial Fund ofEnvironmental Protection and Water Management inWroc³aw. Data received from the Provincial Fund ofEnvironmental Protection and Water Management inWroc³aw allows to present the scope of the undertakenactions and volume of the invested financial means.
Among the investments undertaken in 2008, thefollowing deserve special attention:
building a new heating system making use ofbiomass and thermo-modernisation of premises inŒwierzawa;
modernisation of heating system in Zgorzelec,including de-dusting installations in the heatingplant at Groszowa St. – Stage 1;
building heating system with connections toresidential houses at several streets in Bogatynia.In order to reduce the amount of municipal and
housing pollution, the following investments andmeasures were implemented in 2008:
17 gas-heated boiler houses were built andmodernised with their total power of 2678 kW and 2oil-heated boiler houses with their power of 125 kW;
2 coal-heated boiler houses were modernisedwith their power of 914 kW to be less onerous forthe environment than traditional solid fuel-heatedboiler houses;
1 biomass-heated (straw) boiler house was builtwith its power of 1000 kW;
3151.4 metres of heating network were built;3 thermal spots were installed;
additional heating system making use of solarpanels in 3 premises with their area of 111 m2 wasinstalled;
thermo-modernisation of 27 public utilitypremises was completed.Premises and installations which were
commissioned for operation in 2008 will allow toreduce the annual emission by:
dust – 61.96 Mg/year; SO2 – 48.65 Mg/year; NOx – 11.02 Mg/year; CO – 100.98 Mg/year; CO2 – 60760.14 Mg/year.
Numerous works aimed at curbing emission ofpollution from communication sources to the air wereand have been still conducted. The works consist in,among others, rebuilding and renovation of segments ofroads, rebuilding places which are particularlydangerous for traffic, rebuilding bridges and buildingbypasses which allow to divert traffic from central partsof cities and towns (among others bypasses in Oleœnica,Bielawa, Kamienna Góra, Boles³awiec, Nowa Ruda,Legnica – the western segment). Significant ecologicaleffects of these investments will occur in theforthcoming years when other segments of roads will becommissioned for use.
In 2001-2008 investments undertaken to curb airpollution from industrial sources were also completed.The investments which were implemented in the largestestablishments of Lower Silesia deserve specialattention:
PGE “Turów” Power Plant in Bogatynia(commission of other fluidised bed boilers for use,each one with its circulation bed, equipping boilerswith additional high-duty electro-filters, reductionof unorganized dust emission through terminationof external tipping in “Turów” Lignite Mine JSC),
in departments of KGHM “Polska MiedŸ” JSC:G³ogów I and G³ogów II Copper Works (modernisationof old furnaces and building new ones, equipping themwith new gas cleaning installations), “Legnica”Copper Works (commission of the recovered part ofthe “Solinox” gas de-sulphurisation installation foruse, modernisation of Copper Electrorafination Unitand Anode Furnaces Branch),
“Victoria” Coke Works in Wa³brzych JSC -commission of coke gas sulphur-recovery plant foruse, building boiler house heated by refined cokegas. Some of the investments which shouldcontribute greatly to the reduction of pollutionemission from industrial plants have been inprogress at present. The PGE “Turów” Power Plantin Bogatynia which in 2008 continued buildingbiomass burning installation could be a goodexample. Thanks to the investment the power plantwill maximise electric energy production and limitCO2 emission.
Diagram 2.26. Financial support of PFEPWM in Wroc³awfor the tasks in the field of air and climatecommissioned for implementation in 2008 (source:PFEPWM in Wroc³aw)
57 669,1
3 739,8
29 761,5
0
10 000
20 000
30 000
40 000
50 000
60 000
70 000
Value of the tasks Total amount of PFEPWMfinancial support
subsidy
loan
k PL
N