rapport m26 melkbewerking 2007.03 · biocrystallisations milk treatments. february 2007 machteld...
TRANSCRIPT

Biocrystallisations Milk treatments.
February 2007
Machteld Huber, Paul Doesburg and Lucy van de Vijver
Louis Bolk Instituut, Driebergen, The Netherlands
Rapport M26
LBI20070328
Louis Bolk Instituut Milk Treatment Experimental Results Page 2 of 16
Contents Summary ................................................................................................................................................................................... 3
Introduction ........................................................................................................................................................................ 3 Objective .............................................................................................................................................................................. 3 Results .................................................................................................................................................................................. 3 Conclusions ......................................................................................................................................................................... 4
Biocrystallisation, milk treatments .................................................................................................................................... 5 experimental results............................................................................................................................................................... 5
Introduction ........................................................................................................................................................................ 5 Materials and methods.................................................................................................................................................... 5
Samples ........................................................................................................................................................................... 5 Milk procedures............................................................................................................................................................. 6 General crystallisation data....................................................................................................................................... 6
Grouping of the crystallisations .................................................................................................................................... 6 Results Visual evaluation: .......................................................................................................................................... 7 Results Texture analysis: ............................................................................................................................................. 8
Scoring and ordering the 5 groups according to the picture forming qualities........................................... 10 Visual evaluation: ...................................................................................................................................................... 10 Decoding the treatments ........................................................................................................................................ 11
Discussion......................................................................................................................................................................... 14 Conclusions ...................................................................................................................................................................... 15
Literature................................................................................................................................................................................ 16
Appendix 1. Report E2006/331 NIZO Appendix 2. Materials and Methods
LBI20070328
Louis Bolk Instituut Milk Treatment Experimental Results Page 3 of 16
Summary
Introduction
Following two milk studies performed by the Louis Bolk Instituut, the hypothesis that processing of milk has an important effect on biocrystallisation pictures was investigated. Two raw whole milk tank samples, coded A and B, and 5 treatments performed on these samples (in total A/B 1-6) were offered for analysis. The treatments performed were: homogenisation at 50Bar; homogenisation at 200Bar; homogenisation at 200Bar and subsequently pasteurisation at 760C; homogenisation at 200Bar and subsequently pasteurisation at 900C and ultra high temperature sterilisation (UHT) without homogenisation at 1400C.
Evaluation was performed Visually and by means of computerized Texture analysis.
Objective
The objective of this study was, whether treatment of milk has an effect on biocrystallisations. Further, can a differentiation and quality interpretation of the above mentioned samples and treatments be made.
Results
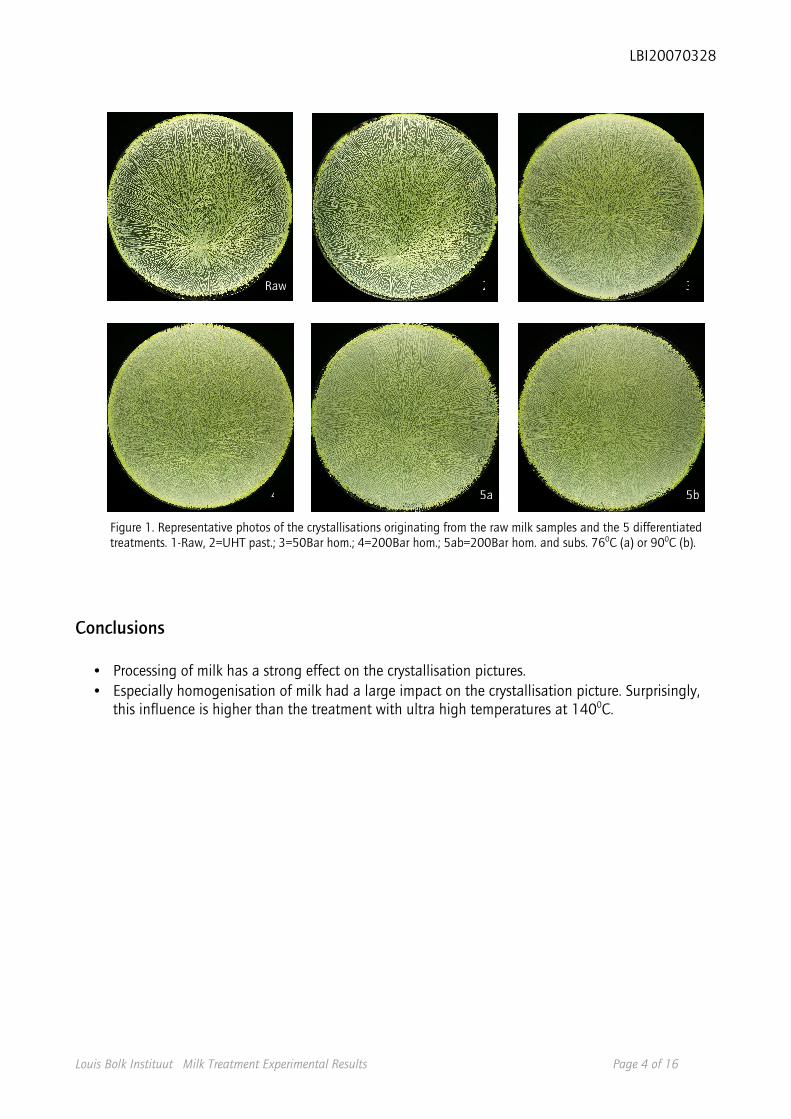
• By means of Visual evaluation, 5 groups of treatment could be differentiated out of the 6 (raw and 5 treatment) groups (figure 1). This was found for both samples on both crystallisation days.
• No clear distinction was possible between the homogenised samples (200 bars) with subsequent heating at 760C or 900C. (figure 1). This was true for both the Visual evaluation and the computerized Texture analysis.
• Computerised Texture analysis could significantly differentiate the crystallisations originating from the 200Bar homogenised, the UHT sterilised and the two combined homogenisation and pasteurisation treatments (760C and 900C) from all other treatments.
• The crystallisations from the raw milk samples of day one could correctly be linked to the crystallisations of day two as belonging to the same sample A or B.. The crystallisations obtained from the 50 and 200Bar homogenised and the ultra high temperature pasteurised milk samples could correctly be differentiated as belonging to sample A or B for one of the two days only.
• The crystallisations originating from sample A were judged as having a better quality
• Based on a quality interpretation of the Visual evaluation, the presumed order (form good to weak) of the crystallisations of the raw milk samples and the 4 differentiated treatments is: Raw milk � UHT sterilised milk � 50 Bar homogenised milk � 200 Bar homogenised and subsequently pasteurised at 760C and 900C milk � 200 Bar homogenised milk.
• UHT sterilisation of the raw milk samples revealed in the crystallisations a change of gesture from more closed towards more open. This type of gesture-metamorphosis is frequently found in plant crystallisations in relation to ripening.
LBI20070328
Louis Bolk Instituut Milk Treatment Experimental Results Page 4 of 16
Conclusions
• Processing of milk has a strong effect on the crystallisation pictures.
• Especially homogenisation of milk had a large impact on the crystallisation picture. Surprisingly, this influence is higher than the treatment with ultra high temperatures at 1400C.
Raw
Figure 1. Representative photos of the crystallisations originating from the raw milk samples and the 5 differentiated treatments. 1-Raw, 2=UHT past.; 3=50Bar hom.; 4=200Bar hom.; 5ab=200Bar hom. and subs. 760C (a) or 900C (b).
32
5b 4 5a

LBI20070328
Louis Bolk Instituut Milk Treatment Experimental Results Page 5 of 16
Biocrystallisation, milk treatments experimental results
Introduction
From a pilot study in 5 organic and 5 conventional raw tank milk samples, biocrystallisation showed to be able to reveal differences between the raw milk samples from the different origins (Adriaansen et al. 2005). In 2006 in each season six samples organic and six samples regular milk and cheese were investigated on several parameters including biocrystallisation. In this study the crystallisation degree was significantly different for milk, however, no differences between the cheese samples were found (Slaghuis and de Wit, 2007). This might indicate that processing of milk may have a large effect on crystallisations. This study was performed to investigate the effect of processing on biocrystallisations,
Materials and methods
Samples
In November 2006, two raw tank milk samples, 120 litre each, were collected at two farms A and B (Vels, Hummelo and Beunk, Westendorp), directly after the milking of the cows. Samples were cooled and transported to NIZO (Netherlands Institute of Dairy Science). Each sample was divided in 6 sub samples each undergoing a specific treatment (table 1). A specialized test plant, suitable for small amounts of milk (circa 20 litre) was used (see attachment 1 for details). The samples were coded A and B, with sub sample codes 1 – 6.
After the treatments a small amount of 2 x 1 litre was collected for all sub samples A/B 1-6 and transported to the Louis Bolk Instituut in an insulated box containing cooling elements. Upon arrival samples were immediately stored in a refrigerator (approx. 40C).
Preheating homogenisation Heating Cooling
Raw raw - - - -
Treatment 1 homogenisation at 50Bar 45 0C 50 Bar - <5 0C Treatment 2 homogenisation at
200Bar 45 0C 200 Bar - <5 0C
Treatment 3 homogenisation at 200Bar and subsequently pasteurisation at 760C
45 0C 200 Bar 76 0C -15 sec <5 0C
Treatment 4 homogenisation at 200Bar and subsequently pasteurisation at 900C
45 0C 200 Bar 90 0C – 15 sec <5 0C
Treatment 5 ultra high temperature sterilisation without homogenisation at 1400C.
80 0C - 140 0C – 5sec <5 0C
Table 1. Specifications of the 6 milk treatments

LBI20070328
Louis Bolk Instituut Milk Treatment Experimental Results Page 6 of 16
Milk procedures
The bottles containing the milk samples were manually swirled gently in vertical position for 2-3 times to collect the cream debris onto the bottle rim. To homogenise the samples, the bottles were swirled vigorously by hand for approximately 10 seconds, after which they were shaken by turning upside-down, whilst turning the bottle, 10 times. This procedure was carried out twice after which a 50ml sample was poured into a 100ml glass beaker and placed into a 20 degrees waterbath for 30 minutes. The milk sample was added to CuCl2 solutions and shaken 120 rpm for 30 min before pipetting in 3-4 fold replicate in the crystallisation chamber. The applied concentration milk-CuCl2 was 200-150 (200mg milk and 150mg CuCl2 per plate). Sample preparation was performed once.
Crystallisation was performed according to the standard procedures (see appendix 2 for more detailed information)
General crystallisation data
During 3 days, milk samples were crystallized. On the first two days (coded DM and DN) both the A and B series were crystallized. On the third day (DO), only the A series was crystallized in order to obtain more repetitions of the same sample for texture analysis. In table 2, the series and the median evaporation time are presented.
LabDoc series
Crystallisation date
Sample Sample preps./sample
Median evaporation
time
StDev evaporation
time
DM 01.12.2006 Milk A andB 1 13:00 0:57 DN 04.12.2006 Milk A andB 1 13:03 1:26 DO 05.12.2006 Milk A 1 14:11 1:21
Table 2. crystallisation overview, including the LabDoc series (days), crystallisation dates, samples crystallised, number of sample preparations per sample and evaporation times.
Grouping of the crystallisations
After crystallisation, the crystallisations were photographed (appendix 1). For the visual evaluation, the samples A1-6 and B 1-6 were randomly coded 1-12. All replicate crystallisations of the same sample received the same code, so that 12 groups (containing 2-4 pictures) were presented to two researchers for grouping. The researchers gave their separate and afterwards combined opinion with respect to the grouping. The separate groupings did not totally match. This turned out to be due to different pre-assumptions made by the researchers (i.e. treatment is the most powerful discriminator vs. the origin of the sample from farm A or B is most powerful, irrespective of treatment). Finally a combined grouping could be made after indicating which samples were the raw milk samples.
Grouping was performed
1. of the biocrystallisation photographs according to the treatments, indifferent of the samples (thus forming the 6 groups 1-6).
2. dividing the above formed groups according to the samples (forming the groups A1-6 and B1- 6).

LBI20070328
Louis Bolk Instituut Milk Treatment Experimental Results Page 7 of 16
Results Visual evaluation: The 12 samples could Visually be divided into 5 distinct groups. This differentiation was possible for both analysed series (series DM and DN). Although the gestures of the different groups showed little variation between the two crystallisation dates, the morphological features were clearly altered. This reflected a decrease in quality of the crystallisations of series DN.
Description of the groups: Group1 (Decoded raw milk samples).
Expressive crystallisations with a strong perradiation, slightly squeezed stems, big lemniscates and a clear background. The gesture is more closed.
Group2
Resembling group 1, however, less powerful, increased ramification and angle of ramification, clear background and less prominent lemniscates. The side-needles are finer and the gesture is more opened.
Group3
Less powerful than group 2, increased ramification and angle of ramification slightly blurred background, organic curvature, slight loss of integration and no significant lemniscates.
Raw
Figure 1. Representative photos of the crystallisations of the samples A1-6 and B1-6 and the 5 distinct groups.
32
5b 4 5a

LBI20070328
Louis Bolk Instituut Milk Treatment Experimental Results Page 8 of 16
Group4 Degradation phenomena with precipitations and large interwoven sections and increased background blurring.
Group5 a,b
A-typical milk crystallisations, powerless with peripheral radiations and increased background blurring.
Discriminating the samples A and B in the different treatments. A further division of the above formed groups into two samples A and B was performed. Differentiation was based on a quality interpretation of the Visual evaluation. The crystallisations from the raw milk samples of day one could correctly be linked to the crystallisations of day two as belonging to the same sample A or B. The crystallisations obtained from groups 2, 3 and 4 could correctly be differentiated as belonging to sample A or B for one of the two days only. Group 5 could not be linked as belonging to one of the two samples. Overall, sample A was judged as having the best quality.
Results Texture analysis: Next to the visual evaluation, computerized texture analysis was performed for the grouping. For the texture analysis of the milk crystallisations the variable ‘sum variance’ at ROI80 was used (see appendix 1). For Texture analysis crystallisations of all three days were analysed (DM, DN, DO). Texture analysis performed on all 12 groups of crystallisations (i.e. A1-6 and B1-6) could not significantly differentiate the groups (p>0.05).
When the crystallisations of the two milk samples were pooled according to the treatments (i.e. A1+B1; A2+B2; etc.) for the three days, the crystallisations of group 2 and group 4 could significantly be differentiated from all other individual treatments (F=15-70; p=0.01-0.001; see figure 2). However, no significant differences were found between the crystallisations of these two groups.
Figure 2. The relation between ROI (x-axis) and the Log(p-value) (y-axis) for the different variables, for the analysis of variance between the crystallisations of the pooled raw milk samples (group 1) and respectively group 4 (left) or group 2 (right).

LBI20070328
Louis Bolk Instituut Milk Treatment Experimental Results Page 9 of 16
After decoding the treatments, we repeated the analysis with treatments pooled. On the basis of comparability of the treatments, two combinations of treatments were pooled and compared to the other treatments; the two homogenisation and pasteurisation treatments and the two homogenisation treatments without further heating. The pooled crystallisations of the 200Bar homogenised and subsequently heated (760C or 900C) samples showed a significant differentiation (p=0.05-0.0001) with all other individual treatments. The differentiation significance was highest with the crystallisations of the 200Bar homogenisation treatment (F=80; p<0.0001; see figure 3). Secondly, two homogenisation treatments without a pasteurisation step were pooled. No significant differences were found between the pooled crystallisations of the two homogenisation treatments (50 and 200 Bar homogenisation) and the other individual treatments.
Overview of results Texture analysis
Groups differentiated 12 groups No differentiation between groups
6 groups of treatments Group 2 (UHT) Group 4 (200bar homogenisation)
Pooled homogenisation and pasteurization treatments
Significantly different from all other treatments, largest difference with 200 bar homogenisation without heating
Pooled homogenisation treatments
No difference with individual treatments
Figure 3. Relation between ROI (x-axis) and the Log(p-value) (y-axis) for the different variables, for the analysis of variance between the pooled crystallisations of the 200Bar homogenised and subsequently 760C or 900C pasteurised milk samples and the homogenised 200Bar samples.
LBI20070328
Louis Bolk Instituut Milk Treatment Experimental Results Page 10 of 16
Scoring and ordering the 5 groups according to the picture forming qualities.
Visual evaluation: scoring
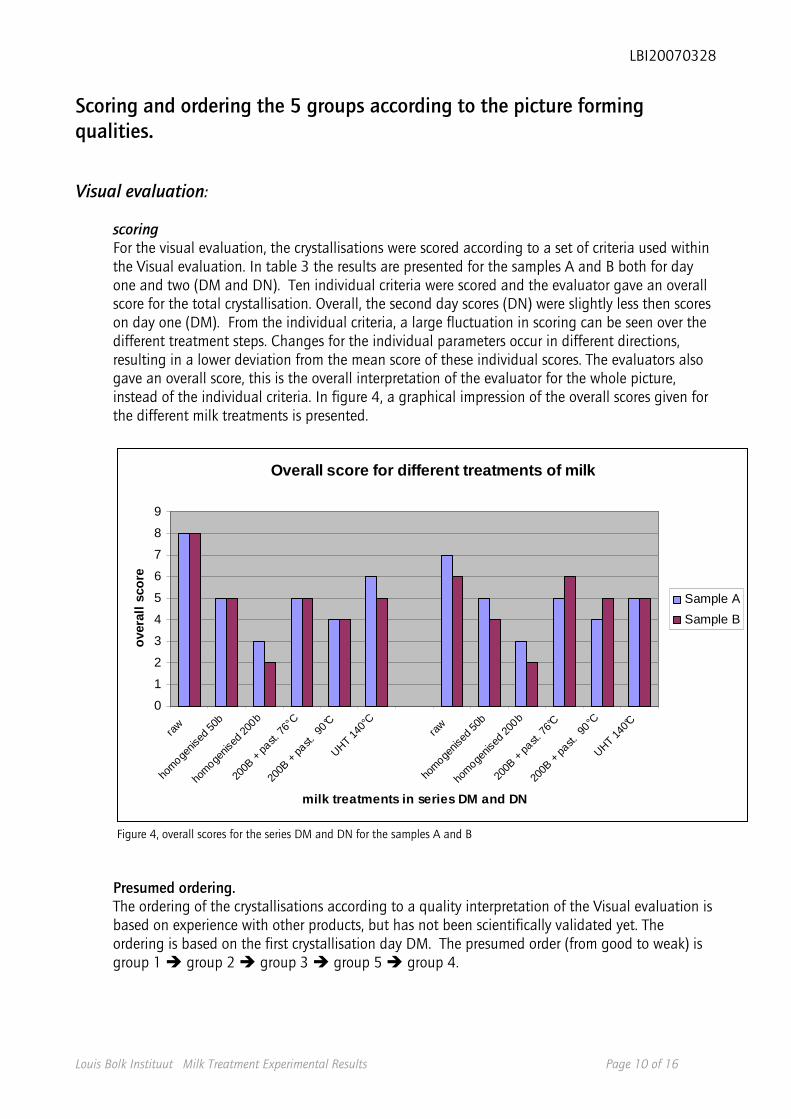
For the visual evaluation, the crystallisations were scored according to a set of criteria used within the Visual evaluation. In table 3 the results are presented for the samples A and B both for day one and two (DM and DN). Ten individual criteria were scored and the evaluator gave an overall score for the total crystallisation. Overall, the second day scores (DN) were slightly less then scores on day one (DM). From the individual criteria, a large fluctuation in scoring can be seen over the different treatment steps. Changes for the individual parameters occur in different directions, resulting in a lower deviation from the mean score of these individual scores. The evaluators also gave an overall score, this is the overall interpretation of the evaluator for the whole picture, instead of the individual criteria. In figure 4, a graphical impression of the overall scores given for the different milk treatments is presented.
Overall score for different treatments of milk
0
1
2
3
4
5
6
7
8
9
raw
homoge
nised
50b
homoge
nised
200b
200B
+ pa
st. 76
°C
200B
+ pa
st. 9
0°C
UHT 140°
Cra
w
homoge
nised
50b
homoge
nised
200b
200B
+ pa
st. 76
°C
200B
+ pa
st. 9
0°C
UHT 140°C
milk treatments in series DM and DN
ove
rall
sco
re
Sample A
Sample B
Figure 4, overall scores for the series DM and DN for the samples A and B
Presumed ordering.
The ordering of the crystallisations according to a quality interpretation of the Visual evaluation is based on experience with other products, but has not been scientifically validated yet. The ordering is based on the first crystallisation day DM. The presumed order (from good to weak) is group 1 � group 2 � group 3 � group 5 � group 4.

LBI20070328
Louis Bolk Instituut Milk Treatment Experimental Results Page 11 of 16
Decoding the treatments Decoding revealed the following for the results of the visual evaluation: Group 1 was decoded prior to the visual evaluation as the raw milk crystallisations.
Group 2 contained the crystallisations of 3 out of the 4 1400C ultra high temperature sterilised milk samples.
Group 3 contained the crystallisations of 3 out of the 4 50Bar homogenised milk samples. Group 4 contained the crystallisations of all the 200Bar homogenised milk samples Group 5 contained the crystallisations of all the combined 200Bar homogenised and subsequently 760C or 900C pasteurised milk samples.
.

LBI20070328
Louis Bolk Instituut Milk Treatment Experimental Results Page 12 of 16
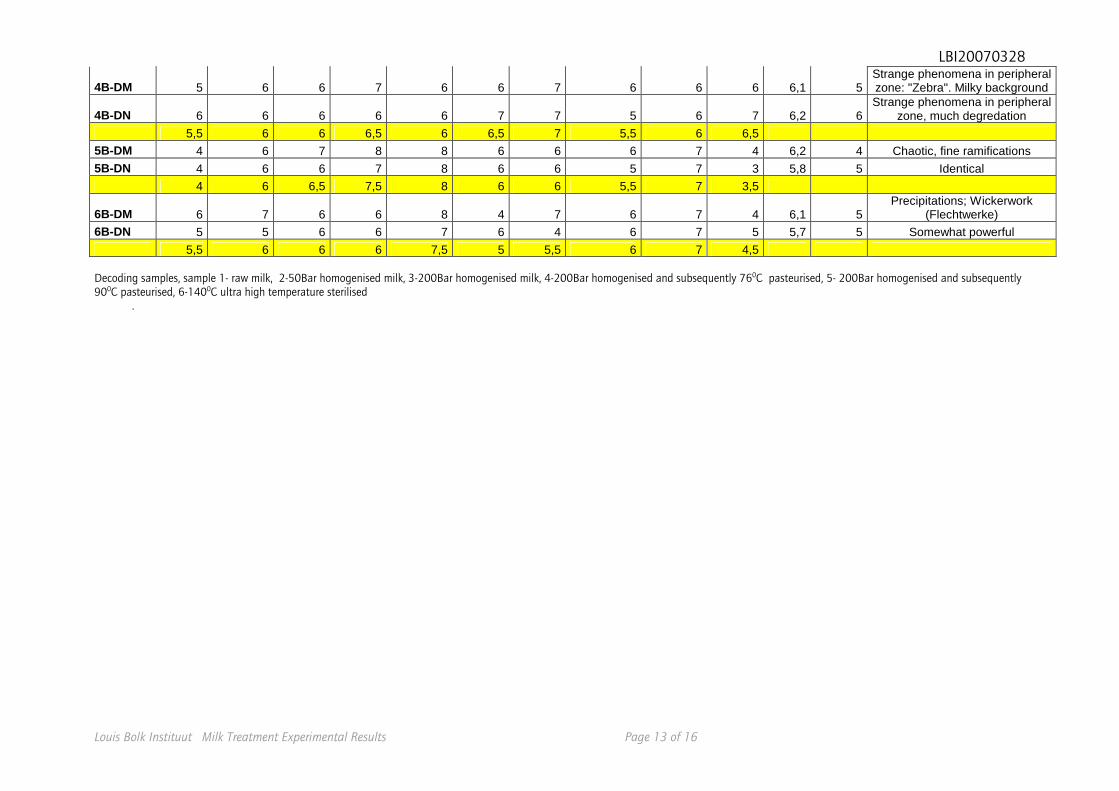
Table 3. Scores for the different criteria for samples A and B in the series DM and DN
Samples DM and DN
Integration
Coordinat.
Durchstralung
Beweglichkeit
Fullness with sideneedles
Length of sideneedles
Absence Lemniscae
Absence Quarnadeln.
Absence of thinning out
Absence of Flecht werke
Mean score
Overall score Observations
1A-DM 8 7 7 7 6 8 6 7 6 7 6,9 8 Powerful impression, big
gestures
1A-DN 7 8 7 6 6 7 5 7 6 7 6,6 7 Somewhat degrading already
7,5 7,5 7 6,5 6 7,5 5,5 7 6 7 2A-DM 4 4 6 8 8 5 7 4 7 4 5,7 5 Unrecognizable, crumbled
2A-DN 4 5 6 8 8 4 5 4 7 4 5,5 5 Crumbled picture
4 4,5 6 8 8 4,5 6 4 7 4
3A-DM 3 5 4 9 6 4 9 4 8 3 5,5 3 Even more unrecognizable,
precipitations, strongly ramified
3A-DN 3 4 4 9 7 4 9 5 9 3 5,7 3 Weakly structured, strongly
ramified
3 4,5 4 9 6,5 4 9 4,5 8,5 3
4A-DM 4 5 6 7 6 7 5 5 5 5 5,5 5 Strange phenomena in peripheral zone: "Zebra". Milky background
4A-DN 5 6 7 7 7 7 6 5 6 5 6,1 5 Identical features
4,5 5,5 6,5 7 6,5 7 5,5 5 5,5 5 5A-DM 4 5 7 8 8 7 6 6 7 4 6,2 4 Chaotic, fine ramifications 5A-DN 4 5 6 8 8 5 8 5 7 4 6 4 Identical features
4 5 6,5 8 8 6 7 5,5 7 4
6A-DM 7 8 7 6 7 7 5 7 6 6 6,6 6 Looks like 1, but finer
needlestructure, more ramified
6A-DN 6 7 8 6 7 7 4 6 6 4 6,1 5 Somewhat rigid
6,5 7,5 7,5 6 7 7 4,5 6,5 6 5
1B-DM 7 8 8 6 7 8 4 8 8 8 7,2 8 Powerful impression 1B-DN 5 6 7 6 8 6 4 6 7 5 6 6 Some degredation signs
6 7 7,5 6 7,5 7 4 7 7,5 6,5
2B-DM 5 6 6 7 8 5 7 5 6 4 5,9 5 Unrecognizably changed 2B-DN 3 3 5 6 9 3 8 6 6 2 5,1 4 Strongly feltlike, degraded
4 4,5 5,5 6,5 8,5 4 7,5 5,5 6 3 3B-DM 3 4 4 9 7 4 9 4 8 2 5,4 2
3B-DN 2 2 3 8 9 2 9 4 9 1 4,9 2 Very strongly feltlike
2,5 3 3,5 8,5 8 3 9 4 8,5 1,5
LBI20070328
Louis Bolk Instituut Milk Treatment Experimental Results Page 13 of 16
4B-DM 5 6 6 7 6 6 7 6 6 6 6,1 5 Strange phenomena in peripheral zone: "Zebra". Milky background
4B-DN 6 6 6 6 6 7 7 5 6 7 6,2 6 Strange phenomena in peripheral
zone, much degredation
5,5 6 6 6,5 6 6,5 7 5,5 6 6,5 5B-DM 4 6 7 8 8 6 6 6 7 4 6,2 4 Chaotic, fine ramifications
5B-DN 4 6 6 7 8 6 6 5 7 3 5,8 5 Identical
4 6 6,5 7,5 8 6 6 5,5 7 3,5
6B-DM 6 7 6 6 8 4 7 6 7 4 6,1 5 Precipitations; Wickerwork
(Flechtwerke) 6B-DN 5 5 6 6 7 6 4 6 7 5 5,7 5 Somewhat powerful
5,5 6 6 6 7,5 5 5,5 6 7 4,5 Decoding samples, sample 1- raw milk, 2-50Bar homogenised milk, 3-200Bar homogenised milk, 4-200Bar homogenised and subsequently 760C pasteurised, 5- 200Bar homogenised and subsequently 900C pasteurised, 6-1400C ultra high temperature sterilised .

Discussion
In this study, both Visual evaluation and computerized Texture analysis was used to investigate differences between treatments of milk.
By means of Visual evaluation, 5 groups of treatment could be differentiated out of the 6 (raw and 5 treatment) groups. This was found for both samples on both crystallisation days. Both by Visual evaluation and Texture analysis no clear distinction was possible between the homogenised samples (200 bars) with subsequent heating at 760C or 900C. From this it can be concluded that the difference in crystallisations of the two treatments were only small, and not sufficiently visible for the VE or detectable for the TA.
Computerised Texture analysis could significantly differentiate the crystallisations originating from the 200Bar homogenised, the UHT sterilised and the two combined homogenisation and pasteurisation treatments (760C and 900C) from all other treatments. To avoid the chance of finding statistical significant results because of multi comparisons, we performed the comparison of pooled treatments to the other treatments only for two logical combinations of treatments (2 homogenisation treatments without pasteurization and 2 homogenisation treatments with pasteurization). For Texture analysis a sufficient amount of replicate samples is needed to be able to find statistical differences. In this study it showed that performing the texture analysis on the 12 samples (A/B 1-6) no differentiation was possible. After grouping the samples according to treatment in 6 groups, thus doubling the amount of crystallisation pictures per group, a differentiation was possible.
The crystallisations from the raw milk samples of day one could correctly be linked to the crystallisations of day two as belonging to the same sample A or B. The crystallisations obtained from the 50 and 200Bar homogenised and the ultra high temperature pasteurised milk samples could correctly be differentiated as belonging to sample A or B for one of the two days only. Overall, sample A was judged as having the best quality.
Based on a quality interpretation of the Visual evaluation, the presumed order (form good to weak) of the crystallisations of the raw milk samples and the 4 differentiated treatments is: Raw milk � UHT sterilised milk � 50 Bar homogenised milk � 200 Bar homogenised and subsequently pasteurised at 760C and 900C milk. � 200 Bar homogenised milk. The differences between the crystallisations can be reflected in separate morphological criteria. The calculated mean of these morphological criteria do not necessarily coincide with the ordering of the total picture. This ordering of the total picture is reflected in the overall score for the crystallisations.
UHT sterilisation of the raw milk samples revealed in the crystallisations a change of gesture from more closed towards more open. This type of gesture-metamorphosis is frequently found in plant crystallisations in relation to ripening.
LBI20070328
Louis Bolk Instituut Milk Treatment Experimental Results Page 15 of 16
Conclusions
• Processing of milk has a strong effect on the crystallisation pictures. This is reflected by the significant differentiation between the crystallisations of the raw milk and 3 of the 5 treatments by means of Texture analysis and 4 of the 5 treatments with the Visual evaluation.
• The treatments have a big effect on the morphological criteria characterising the crystallisations. This is reflected by the decreased differentiation capacity of the crystallisations, as belonging to sample A or B, after processing.
• The 200 Bar homogenisation and subsequently pasteurisation of the milk samples has a bigger effect on the morphological criteria characterising the crystallisations, than the origin of the sample A or B.
• Based on a quality interpretation of the Visual evaluation, sample A was judged as having a better quality.
• The presumed order (form good to weak) of the crystallisations of the raw milk samples and the 4 differentiated treatments was interpreted Visually as:
Raw milk � UHT sterilised milk � 50 Bar homogenised milk � 200 Bar homogenised and subsequently pasteurised at 760C and 900C milk. � 200 Bar homogenised milk. The most frequently consumed milk in the Netherlands is homogenised (200-300 Bar) and subsequently pasteurised at 760C.
• Surprisingly, the crystallisations originating from the UHT milk are interpreted as the best of the treated samples. Homogenisation at 50 Bar has a stronger degrading effect on the picture forming properties than UHT at 1400C.
• Heating of milk samples is reflected in the crystallisations in a similar way as ripening of plants. Methodological issues
• Overall, Visual evaluation is a better tool for differentiation of the treatments than Texture analysis. The choice for Texture analysis is a choice for an objective analysis. However, large numbers of crystallisations are needed to enable the differentiation of crystallisations with only small differences. To increase the objectivity of the visual evaluation, samples are coded and presented “blind” to the evaluators.
• For grouping of samples, it is important to clearly state the research question. In this study we had 12 groups (A and B, 1-6), and presented these randomly to the evaluators. However, if you are only interested in a treatment effect, crystallisations can better be presented in two separate groups of 6 (A and B group).

LBI20070328
Louis Bolk Instituut Milk Treatment Experimental Results Page 16 of 16
Literature
Adriaansen-Tennekes, R., (2005). Organic products and health. Results of Milk research 2005. Dutch publication "Biologische producten en gezondheid. Resultaten melkonderzoek 2005".
Slaghuis B, de Wit J.(2007): Productkwaliteit zuivel: verschil tussen biologisch en gangbaar. Rapport 23, Animal Sciences Group-WUR, Januari 2007.