rarc-wp-15-006 will the check be in the mail? an examination of
TRANSCRIPT
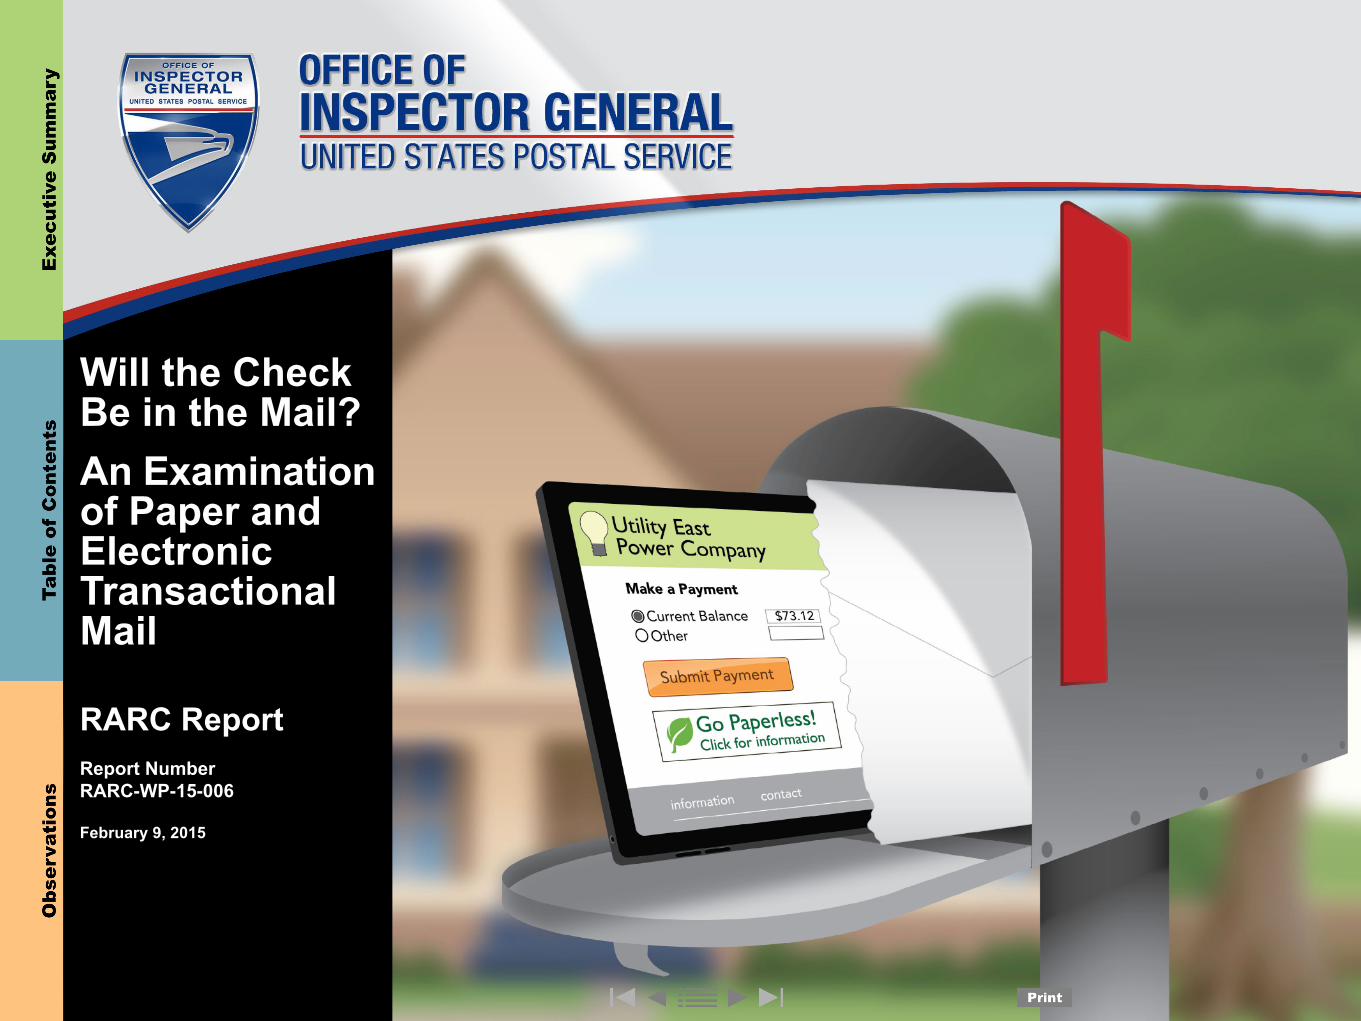
RARC ReportReport Number RARC-WP-15-006
Will the Check Be in the Mail?An Examination of Paper and Electronic Transactional Mail
February 9, 2015
Cover
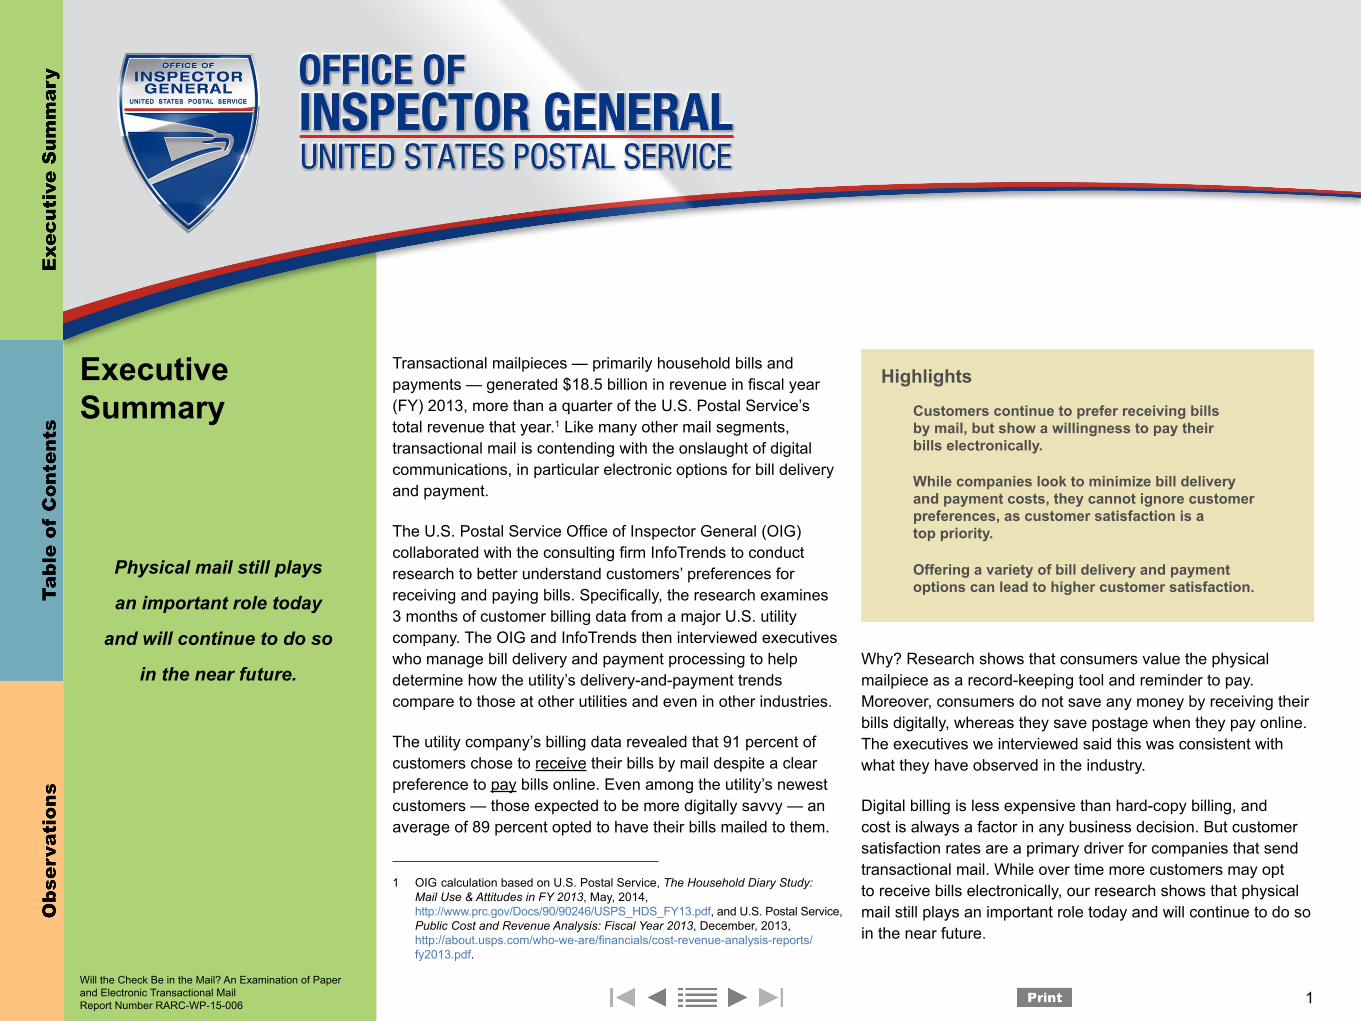
Transactional mailpieces — primarily household bills and payments — generated $18.5 billion in revenue in fiscal year (FY) 2013, more than a quarter of the U.S. Postal Service’s total revenue that year.1 Like many other mail segments, transactional mail is contending with the onslaught of digital communications, in particular electronic options for bill delivery and payment.
The U.S. Postal Service Office of Inspector General (OIG) collaborated with the consulting firm InfoTrends to conduct research to better understand customers’ preferences for receiving and paying bills. Specifically, the research examines 3 months of customer billing data from a major U.S. utility company. The OIG and InfoTrends then interviewed executives who manage bill delivery and payment processing to help determine how the utility’s delivery-and-payment trends compare to those at other utilities and even in other industries.
The utility company’s billing data revealed that 91 percent of customers chose to receive their bills by mail despite a clear preference to pay bills online. Even among the utility’s newest customers — those expected to be more digitally savvy — an average of 89 percent opted to have their bills mailed to them.
1 OIG calculation based on U.S. Postal Service, The Household Diary Study: Mail Use & Attitudes in FY 2013, May, 2014, http://www.prc.gov/Docs/90/90246/USPS_HDS_FY13.pdf, and U.S. Postal Service, Public Cost and Revenue Analysis: Fiscal Year 2013, December, 2013, http://about.usps.com/who-we-are/financials/cost-revenue-analysis-reports/fy2013.pdf.
Why? Research shows that consumers value the physical mailpiece as a record-keeping tool and reminder to pay. Moreover, consumers do not save any money by receiving their bills digitally, whereas they save postage when they pay online. The executives we interviewed said this was consistent with what they have observed in the industry.
Digital billing is less expensive than hard-copy billing, and cost is always a factor in any business decision. But customer satisfaction rates are a primary driver for companies that send transactional mail. While over time more customers may opt to receive bills electronically, our research shows that physical mail still plays an important role today and will continue to do so in the near future.
Executive Summary
Physical mail still plays
an important role today
and will continue to do so
in the near future.
Highlights
Customers continue to prefer receiving bills by mail, but show a willingness to pay their bills electronically.
While companies look to minimize bill delivery and payment costs, they cannot ignore customer preferences, as customer satisfaction is a top priority.
Offering a variety of bill delivery and payment options can lead to higher customer satisfaction.
1Will the Check Be in the Mail? An Examination of Paper and Electronic Transactional Mail Report Number RARC-WP-15-006
Table of Contents CoverExecutive Summary......................................................................................1Table of Contents..........................................................................................2Observations ................................................................................................3
Table of Contents ....................................................................................4Introduction ..............................................................................................6
An Overview of the Transactional Mail Market ...................................6The Importance of Customer Satisfaction ..........................................7
Research Background .............................................................................9Objective ............................................................................................9About Utility East ................................................................................9Methodology .....................................................................................12
Key Findings ..........................................................................................13Foreword ..........................................................................................13Electronic Bill Delivery and Payment Was the Least Expensive for the Utility ..........................................................13Customer Service Calls Contributed Greatly to Average Monthly Cost per Customer ...............................................14Most Customers Chose to Receive Paper Bills by Mail ...................17Newer Customers Were More Likely to Pay Bills Electronically Than by Mail .....................................................................................17Adoption Rates for Electronic Bill Delivery Were Far Lower than Rates for Electronic Bill Payment .............................................21
Conclusions ...........................................................................................24Contact Information ....................................................................................26
Will the Check Be in the Mail? An Examination of Paper and Electronic Transactional Mail Report Number RARC-WP-15-006 2
Observations
Analysis
February 2015
Will the Check Be in the Mail?
An Examination of Paper and Electronic Transactional Mail
Will the Check Be in the Mail? An Examination of Paper and Electronic Transactional Mail Report Number RARC-WP-15-006 3
Will the Check be in the Mail? An Examination of Paper and Electronic Transactional Mail
© InfoTrends 2015
Table of Contents Introduction .................................................................................................... 6
An Overview of the Transactional Mail Market ......................................... 6
The Importance of Customer Satisfaction .................................................. 7
Research Background ..................................................................................... 9
Objective...................................................................................................... 9
About Utility East ........................................................................................ 9
Methodology ............................................................................................... 12
Key Findings .................................................................................................... 13
Foreword ..................................................................................................... 13
Electronic Bill Delivery and Payment Was the Least Expensive for the Utility ........................................................................................ 13
Customer Service Calls Contributed Greatly to Average Monthly Cost per Customer ................................................... 14
Most Customers Chose to Receive Paper Bills by Mail .............................. 17
Newer Customers Were More Likely to Pay Bills Electronically Than by Mail ........................................................................................ 17
Adoption Rates for Electronic Bill Delivery Were Far Lower than Rates for Electronic Bill Payment ........................................................ 21
Conclusions ..................................................................................................... 24
List of Tables Table 1: Adoption Rate of Physical Bill Delivery and Payment by Households ................................................................................. 10
Table 2: Distribution of Bill Delivery and Payment Scenarios ....................... 10
Table 3: Bill Delivery and Payment Options for Utility East Customers ....... 11
Table 4: Utility East’s Average Monthly Bill Delivery and Payment Workflow Costs per Customer ......................................................... 13
Table 5: Bill Delivery and Payment Habit Shifts for New Customers ............ 17
InfoTrends Table of Contents
4Will the Check Be in the Mail? An Examination of Paper and Electronic Transactional Mail Report Number RARC-WP-15-006
Will the Check be in the Mail? An Examination of Paper and Electronic Transactional Mail
© InfoTrends 2015
List of Figures Figure 1: Total Call Center Volume Tracking for Primary Customer Sample .............................................................................. 15
Figure 2: Total Average Bill Delivery and Payment Workflow Cost per Customer ........................................................................................... 16
Figure 3: Electronic Delivery Adoption by Date of Service Initiation ........... 18
Figure 4: Electronic Delivery Adoption Rates for New and Existing Customers ......................................................................................... 19
Figure 5: Primary Reason Why Customers Reverted to Physical Bill Delivery ...................................................................................... 20
Figure 6: Electronic Payment Adoption by Date of Service Initiation ........... 22
Figure 7: Electronic Payment and Delivery Adoption Rates for New Customers ............................................................................................... 23
5Will the Check Be in the Mail? An Examination of Paper and Electronic Transactional Mail Report Number RARC-WP-15-006
Will the Check be in the Mail? An Examination of Paper and Electronic Transactional Mail
© InfoTrends 2015
Introduction Consumers and businesses are conducting more communication and
commerce online today than ever before. Consequently, businesses are
adjusting how they manage and plan for communications with existing
customers. Bill-sending organizations—such as financial institutions and
utility companies—look to cut costs, often encouraging electronic-only
delivery of those communications to avoid postage costs. The money those
companies spend in postage to send bills and the money consumers spend
in postage to pay them is a big business for the Postal Service. Case in
point, in FY 2013 the transactional mail segment accounted for $18.5 billion
of revenue (27.5%) for the Postal Service.1
To better understand these market dynamics, the U.S. Postal Service
Office of Inspector General (OIG) collaborated with InfoTrends to help
further explore how consumers’ preferences for receiving and paying bills
are evolving. The primary research effort consisted of an analysis of three
months of customer billing and payment data from a large utility,
supplemented by interviews with key stakeholders in the customer
communications market. The stakeholder interviews revealed several key
insights into the reality of today’s transactional mail market, as well as the
role of customer satisfaction.
An Overview of the Transactional Mail Market American consumers received 24 billion household bills and statements in
2013.2 Despite strong business desire to drive these communications to
electronic-only delivery, consumers continue to prefer receiving paper bills
in the mail. In fact, the Postal Service delivered nearly 80% of those bills
1 U.S. Postal Service Office of Inspector General (OIG) calculation based on U.S. Postal Service,
The Household Diary Study: Mail Use & Attitudes in FY 2013, May, 2014, http://www.prc.gov/Docs/90/90246/USPS_HDS_FY13.pdf, and U.S. Postal Service, Public Cost and Revenue Analysis: Fiscal Year 2013, December, 2013, http://about.usps.com/who-we-are/financials/cost-revenue-analysis-reports/fy2013.pdf.
2 Matt Swain, “Fast-Evolving Tactics for Customer Communications, Outsourcing, and Bill Payment Adoption,” Document Strategy, December 16, 2014, http://www.documentmedia.com/Main/articles/1537.aspx.
Introduction An Overview of the Transactional Mail market
Consumers continue
to prefer receiving
paper bills in the mail.
6Will the Check Be in the Mail? An Examination of Paper and Electronic Transactional Mail Report Number RARC-WP-15-006

Will the Check be in the Mail? An Examination of Paper and Electronic Transactional Mail
© InfoTrends 2015
and statements.3 However, there has been a more rapid transition away
from physical mail in household bill payments, with the majority of
consumers preferring to pay bills online. In fact, just 37% of consumer bills
were paid by mail in fiscal year (FY) 2013, a 45% decline since FY 1998.4
Our 2014 research supported this perspective, with the majority of
customers preferring to receive paper bills through the mail, but paying
their bills electronically. The actual percentages of customers that choose
to either receive or pay their bills digitally vary widely across industries,
with utility companies having far lower adoption rates than most other
industries. Even among utilities, the percentage of their customers that
choose to receive and pay their bills electronically depends on the type and
size of the company, as well as the level of regulation the utility faces.5
The cost of sending physical bills through the mail also varies, but is
consistently more expensive than sending bills electronically. These costs
primarily include bill creation, delivery, and payment processing. Often
absent from these calculations are other associated costs, such as the
money the company forgoes while it waits to receive a customer's
payment, late payment penalties, and default rates—making it more
difficult to compare the true cost of sending bills and receiving payments
through the mail versus electronically. One executive that we interviewed
called companies’ attempts to calculate these true costs the “wild west.”
The Importance of Customer Satisfaction Instead of focusing exclusively on costs, representatives of the companies
we interviewed highlighted the importance of customer satisfaction as a
key metric for success. In fact, most utilities are primarily driven by
customer satisfaction, even more so than by the true costs associated with
physical or digital billing and payment processing. A high rating by
consumer satisfaction researcher, J.D. Power and Associates is considered
3 Customer Communications Delivery Market Sizing & Forecast: 2013-2018, InfoTrends, 2014. 4 The Household Diary Study: Mail Use & Attitudes in FY2013, U.S. Postal Service, May 2014. 5 Some states and localities require utilities and other regulated industries to mail certain types of
communications to consumers physically.
The Importance of Customer Satisfaction
Many companies do not
include associated costs
when evaluating mail and
digital channels, making it
more difficult to compare
the true costs of bill delivery
and processing payments.
Most utilities are
primarily driven by customer
satisfaction, even more so
than by the costs associated
with physical or digital billing
and payment processing.
7Will the Check Be in the Mail? An Examination of Paper and Electronic Transactional Mail Report Number RARC-WP-15-006

Will the Check be in the Mail? An Examination of Paper and Electronic Transactional Mail
© InfoTrends 2015
“a badge of honor” in this industry. In fact, some executives’ incentive
packages are dependent on strong customer satisfaction ratings.
In an effort to put customers first, many transactional mailers do not try to
pressure customers into moving to all digital communication, even though
it could save the company money. Most companies we interviewed agreed
that incentives were ineffective as long-term solutions to get customers to
switch to electronic billing and payment.
Rather than relying on incentives, billers try to encourage customers to go
all-digital by creating a better online or mobile experience. While cost
reduction is important, good customer experience usually trumps the use
of negative incentives like charging customers for paper versions of their
bills. One approach to drive customers to electronic billing is to set the
default for new customers to paperless delivery, while others automatically
register customers who pay online to also receive their bills electronically.
However, these tactics still carry a risk of customer backlash and could
have a negative impact on the company’s relationship with the customer.
In general, customers value having options for bill delivery and payment.
Financial services technology company Fiserv calls these customers
“Bill Pay Omnivores” because they are likely to choose a variety of
channels to receive and pay bills.6 Separately, a 2014 Fiserv survey found
that 43% of customers had a higher level of satisfaction with billers that
offered multiple delivery and payment options.7 Using a data-driven
approach to more closely examine these delivery and payment preferences
related to household transactional mail, InfoTrends, in collaboration with
the OIG, developed and completed a case study evaluating the costs of
paper and electronic bill delivery and payment for residential consumers
of a domestic utility company.
6 Eric Leiserson, Boosting Satisfaction and Loyalty with Billing and Payments, Fiserv, p. 3, 2014. 7 Ibid.
8Will the Check Be in the Mail? An Examination of Paper and Electronic Transactional Mail Report Number RARC-WP-15-006

Will the Check be in the Mail? An Examination of Paper and Electronic Transactional Mail
© InfoTrends 2015
Research Background Objective The primary objective of this project was to quantify the costs associated
with each of three primary billing scenarios, including all expenses related
to bill production and delivery through bill payment for residential
customers of a large utility. A secondary goal was to explore the costs,
benefits, and deterrents for the residential bill payer for each of these bill
delivery and payment options and track customers’ overall bill delivery
and payment behavior relative to physical and electronic channels.
About Utility East Without a utility company willing to share its data, this project would
not be possible. A utility company that serves a major metropolitan area
in the Eastern United States —which will be referred to in this paper as
“Utility East”— generously provided access to three months of billing data
for a subset of its customers. All personally-identifiable information of the
customers was removed before the data was received.
Utility East is a Fortune 500 company providing electric and gas services
to more than 3 million customers. Like any major metropolitan area, its
residential customer base is highly diverse in terms of customer
demographics. More than 85% of Utility East’s customer base is
residential customers, with upwards of 15% turnover each year. Customers
of Utility East can receive their bills by mail or electronically and also have
a variety of payment options. Table 1 shows the percentages of Utility East
customers that continued to pay and receive bills through the mail,
compared to the national average of all transactional mailing companies.
Research Background Objective About Utility East
9Will the Check Be in the Mail? An Examination of Paper and Electronic Transactional Mail Report Number RARC-WP-15-006

Will the Check be in the Mail? An Examination of Paper and Electronic Transactional Mail
© InfoTrends 2015
Table 1: Adoption Rate of Physical Bill Delivery and Payment by Households
Means Utility East8 National Average9
Bill Delivery Mail 91% 79%
Electronically 9% 21%
Bill Payment
Mail 25% 37%
Electronically 71% 59%
Other Means10 3% 4%
Table 2 provides a breakdown of delivery and payment approaches for the
2 million residential Utility East customers whose data we were granted
access to in May of 2014. As might be expected, customers who sign up for
electronic bill delivery choose to pay electronically as well.
Table 2: Distribution of Bill Delivery and Payment Scenarios
Bill Delivery and Payment Scenarios Residential Customers
Receive by mail 91%11
Pay by mail 25%
Pay electronically 62%
Pay by other means12 3%
Receive electronically 9%
Pay by mail 0%
Pay electronically 9%
Pay by other means 0%
According to company estimates, Utility East sends about 30 million
residential bills each year. It also sends over 550,000 termination-of-service
notifications to residential addresses annually, which are sent if a 8 Related percentages in this category total 99% due to rounding. 9 National figures for bill delivery across all industries from Customer Communications Delivery
Market Sizing & Forecast: 2013-2018, InfoTrends, 2014; national figures for bill payment from The Household Diary Study: Mail Use & Attitudes in FY2013, U.S. Postal Service, 2014.
10 This includes payment through a visit to a walk-in center and field collection. 11 Related percentages in this category total 90% due to rounding. 12 This includes payment at a walk-in center and field collection. Payment by phone is considered
electronic payment.
Table 1 Table 2
10Will the Check Be in the Mail? An Examination of Paper and Electronic Transactional Mail Report Number RARC-WP-15-006
Will the Check be in the Mail? An Examination of Paper and Electronic Transactional Mail
© InfoTrends 2015
customer is carrying an unpaid balance for an extended time period
(generally 3 months or more). Utility East receives approximately 7 million
inbound paper check and money order payments by mail each year. While
it outsources its printing needs to an external provider, Utility East
processes checks through its subsidiary.
Billing and payment workflows can vary significantly from one company to
another. These workflows can depend on the company’s size, industry,
software, partnerships, incentives offered for certain delivery channels,
breadth of payment channels, and methods enabled, as well as company
policy on frequency and channel of reminder communications associated
with a billing lifecycle. Each of these workflow variations yields different
average costs. Utility East is similar to other utilities we interviewed in that
it does not offer any personal incentives for customers choosing one
delivery or payment channel over another. The executives we interviewed
also said it is standard for a utility to not send bill pay reminders until the
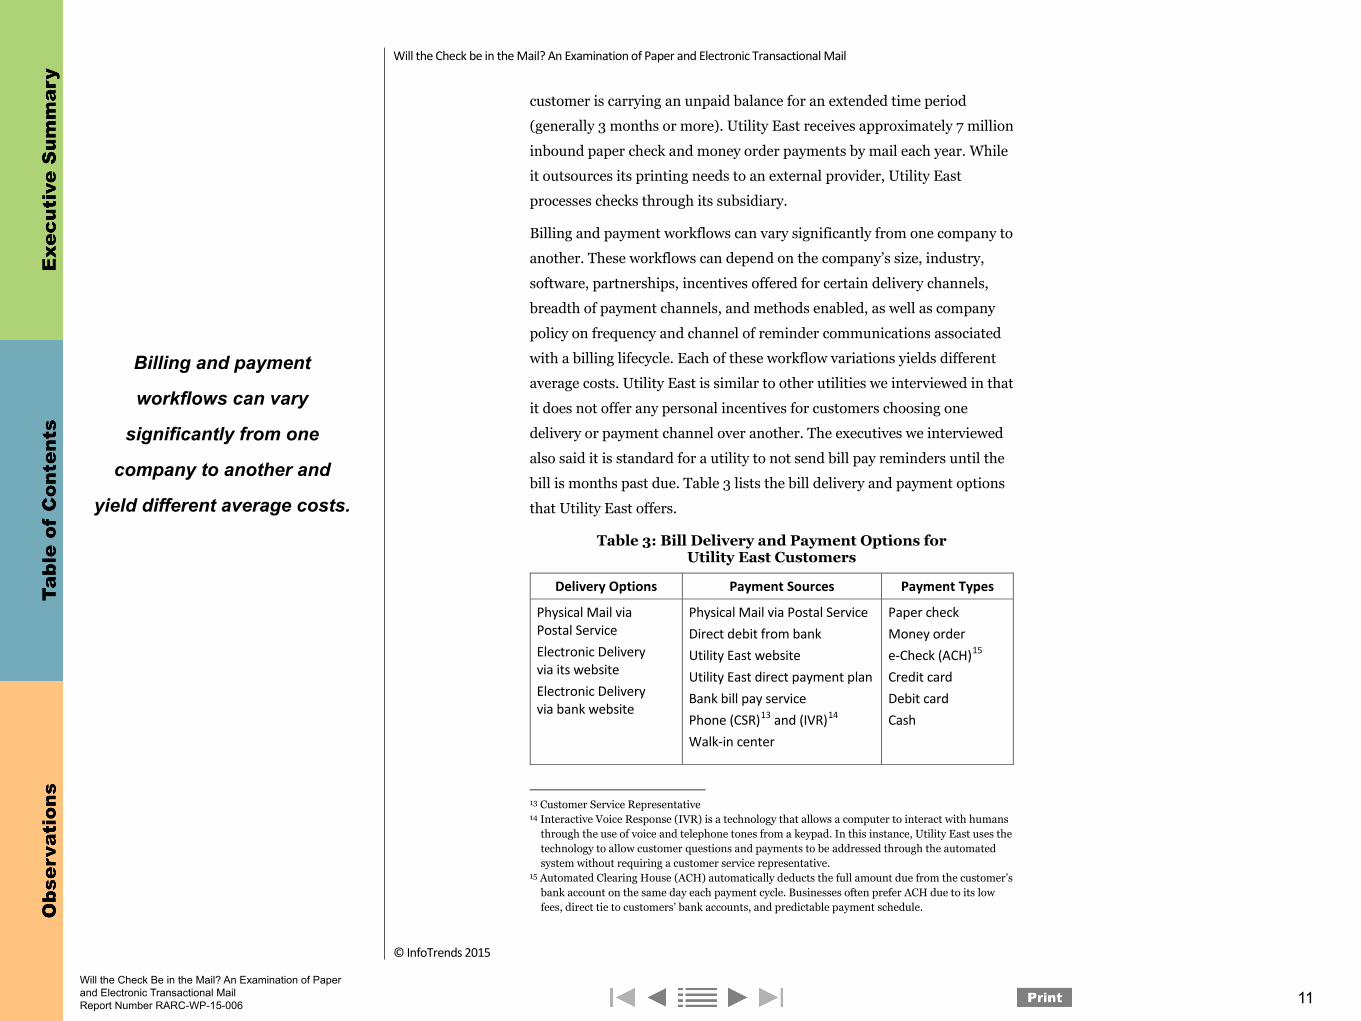
bill is months past due. Table 3 lists the bill delivery and payment options
that Utility East offers.
Table 3: Bill Delivery and Payment Options for Utility East Customers
Delivery Options Payment Sources Payment Types
Physical Mail via Postal Service Electronic Delivery via its website Electronic Delivery via bank website
Physical Mail via Postal Service Direct debit from bank Utility East website Utility East direct payment plan Bank bill pay service Phone (CSR)13 and (IVR)14 Walk-in center
Paper check Money order e-Check (ACH)15 Credit card Debit card Cash
13 Customer Service Representative 14 Interactive Voice Response (IVR) is a technology that allows a computer to interact with humans
through the use of voice and telephone tones from a keypad. In this instance, Utility East uses the technology to allow customer questions and payments to be addressed through the automated system without requiring a customer service representative.
15 Automated Clearing House (ACH) automatically deducts the full amount due from the customer’s bank account on the same day each payment cycle. Businesses often prefer ACH due to its low fees, direct tie to customers’ bank accounts, and predictable payment schedule.
Table 3
Billing and payment
workflows can vary
significantly from one
company to another and
yield different average costs.
11Will the Check Be in the Mail? An Examination of Paper and Electronic Transactional Mail Report Number RARC-WP-15-006
Will the Check be in the Mail? An Examination of Paper and Electronic Transactional Mail
© InfoTrends 2015
Methodology Utility East provided InfoTrends with 2 million residential customer
records for the billing months of May, June, and July of 2014. With the
support of the OIG, InfoTrends analyzed a subset of these records with
a focus on how customers received and paid their bills, as well as factors
that influenced the cost of each method, including fluctuations in call
center volume.
InfoTrends broke residential customers into four main groups. InfoTrends
opted to randomly select a subset of the 2 million records it received to
make the volume of data more manageable.16 The first three groups each
consisted of 5,000 customers randomly selected within each of the
following cohorts:
• Bills delivered by mail and paid by mail
• Bills delivered by mail and paid electronically
• Bills delivered and paid electronically
Customers who are billed electronically and pay by mail represented an
insignificant portion of the Utility East customer base, so were not
analyzed in this study. This was also the case for customers who paid by
other means, such as in person at walk-in centers.
The data that Utility East collected and provided for analysis lacked
sufficient information about payment cycle lengths for each of the cohorts
tracked. Because of this, InfoTrends was not able to determine how
quickly each cohort paid after receiving a bill. Other potential data points,
including defaults, follow-up mailings, and collections calls, proved to
either have an insignificant financial impact or were irrelevant to the
operations of Utility East.
16 To perform the full range of analytics needed for the project, the customer billing data had to
be cleaned of irregularities in data entries and reconcile nuances within the data files. It would not be feasible to do this for the entire customer database of 2 million records within the scope of the project.
Methodology
12Will the Check Be in the Mail? An Examination of Paper and Electronic Transactional Mail Report Number RARC-WP-15-006

Will the Check be in the Mail? An Examination of Paper and Electronic Transactional Mail
© InfoTrends 2015
InfoTrends also monitored the 5,000 newest residential Utility East
customers in the dataset as of the May billing cycle and tracked changes in
their behavior over the first three months. From the insights gained in this
exercise, InfoTrends decided to dig deeper into specific data related to
when a resident became a customer of Utility East. This included a review
and mapping of more than 1 million customer records, dating back to
customers joining Utility East in January of 2007.
Key Findings Foreword The following findings are specific to Utility East for a timeframe of
three months. While the paper includes generalizations about how
these insights could be applied to the broader market, it is important
to recognize the data limitations and should by no means be used as a
measure of the market standard.
At times, the paper includes supplementary information from InfoTrends’
ongoing tracking of the customer communications market and the surveys
it conducts.
Electronic Bill Delivery and Payment Was the Least Expensive for the Utility It may not be surprising that serving a customer who receives a bill
electronically and pays it electronically costs Utility East less than a
customer who receives a bill by mail and pays by mail or electronically.
Table 4 reviews the costs that contributed to the total cost for bill delivery
and payment, both physically and digitally.
Table 4: Utility East’s Average Monthly Bill Delivery and Payment Workflow Costs per Customer
Delivery Payment Processing Subtotal
Call Center Total
Type Cost Type Cost Cost
Electronic $0.05 Electronic $0.01 $0.06 $0.26 $0.32
Mail $0.49 Electronic $0.01 $0.50 $0.30 $0.80
Mail $0.49 Mail $0.04 $0.53 $0.23 $0.76
Key Findings Foreword Electronic Bill Delivery and Payment Was the Least Expensive for the Utility Table 4
While costs to send and
process bills electronically is
less expensive for Utility East,
these calculations did not
include other considerations
such as late payment
penalties, customer defaults,
technology investments and
costs associated with the
payment cycles.
13Will the Check Be in the Mail? An Examination of Paper and Electronic Transactional Mail Report Number RARC-WP-15-006
Will the Check be in the Mail? An Examination of Paper and Electronic Transactional Mail
© InfoTrends 2015
When factoring in costs associated with bill delivery, call center calls, and
payment processing, the average monthly cost to serve a Utility East
customer who received and paid a bill electronically was $0.32. This is
primarily driven by the low cost of electronic bill delivery, which averages
$0.05 per piece compared to $0.49 for printing, processing, and mailing a
hardcopy bill. When comparing Utility East’s delivery costs to other
estimates for utilities, the costs of physical delivery by Utility East fell
within the industry range. The cost of electronic delivery for Utility East
was far less than some industry estimates.17
When call center data is factored into these averages, the cost for each
cohort increases by between $0.23 and $0.30—showing that call center
costs contribute greatly to the average monthly cost per customer. Some
costs—such as those related to composing the documents to be delivered,
termination notices, and field collections—have been excluded from this
analysis as these costs did not contribute significantly to the per-customer
cost of Utility East. As noted earlier in the paper, many of these financial
costs are not tracked when determining the total cost to send bills and
process payments physically or digitally.
Customer Service Calls Contributed Greatly to Average Monthly Cost per Customer The customer call center volume contributed a sizeable per customer cost,
which is an often-overlooked component of a billing and payment
workflow. Because these calls require one-on-one human interaction, each
costs the utility company $6.44, which is over 13 times the cost of
delivering a bill via the Postal Service. InfoTrends research shows that
4 out of 5 Americans will call their providers when they have a question
about a bill,18 and these costs add significantly to the amount of money it
takes to receive and process a payment. While Utility East did not provide
detailed data that would indicate the reasons why each customer contacted
the call center, discussions with their team led InfoTrends to conservatively 17 The physical delivery was estimated fall between $0.50 and $1 per communication while e-mail
was up to half of that cost. 18 Annual State of the Customer Communications Market Survey, InfoTrends, 2014.
Customer Service Calls Contributed Greatly to Average Monthly Cost per Customer
The customer call center
volume contributed a
sizeable per customer cost,
which is an often overlooked
component of a billing and
payment workflow.
14Will the Check Be in the Mail? An Examination of Paper and Electronic Transactional Mail Report Number RARC-WP-15-006

Will the Check be in the Mail? An Examination of Paper and Electronic Transactional Mail
© InfoTrends 2015
estimate that about 30% of the calls were billing-related. Figure 1 shows
total in-bound call center volume over the three month timeframe for
each cohort.
Figure 1: Total Call Center Volume Tracking for Primary Customer Sample
Without specific data on the reason for each call, it is unclear why there
was a jump in call center volume from May to June across all cohorts;
however it is possible that volume spiked when customers saw higher bill
amounts due to increases in electricity usage (often due to increased use of
air conditioners during that timeframe).
Using the direction from Utility East that 30% of call center traffic is
billing-related, Figure 2 shows how the cost of the billing and payment
lifecycle changes when this customer service factor is accounted for.
469
564
436
671
947
782
564
840763
Mail/Mail Mail/Elec Elec/Elec
MayJuneJuly
Deliver by Mail,Pay by Mail
Deliver by Mail,Pay Electronically
Deliver Electronically,Pay Electronically
Figure 1
15Will the Check Be in the Mail? An Examination of Paper and Electronic Transactional Mail Report Number RARC-WP-15-006
Will the Check be in the Mail? An Examination of Paper and Electronic Transactional Mail
© InfoTrends 2015
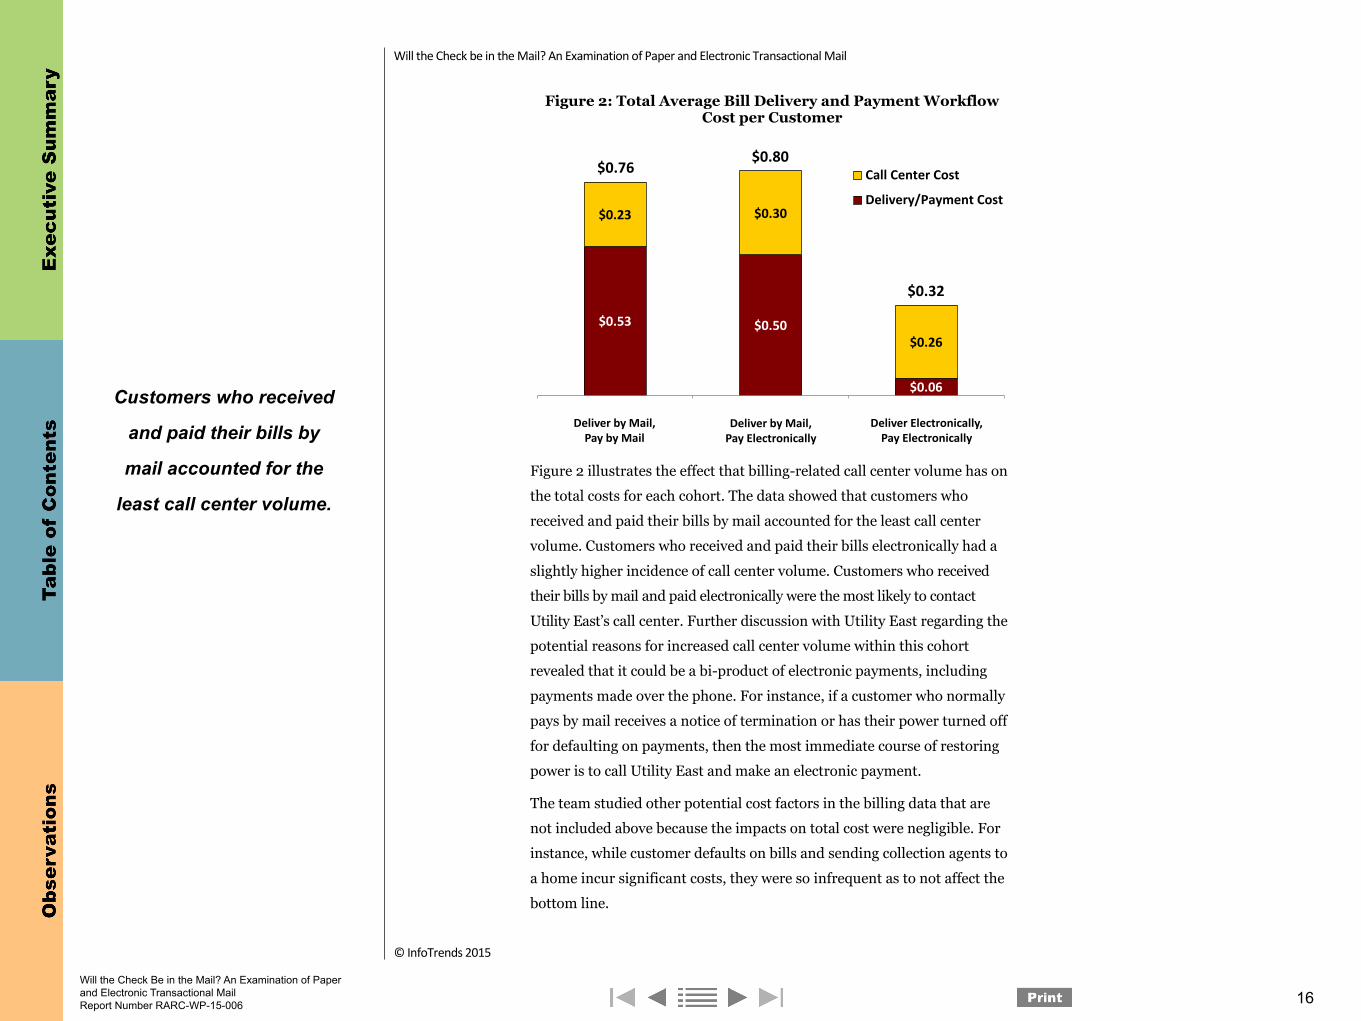
Figure 2: Total Average Bill Delivery and Payment Workflow Cost per Customer
Figure 2 illustrates the effect that billing-related call center volume has on
the total costs for each cohort. The data showed that customers who
received and paid their bills by mail accounted for the least call center
volume. Customers who received and paid their bills electronically had a
slightly higher incidence of call center volume. Customers who received
their bills by mail and paid electronically were the most likely to contact
Utility East’s call center. Further discussion with Utility East regarding the
potential reasons for increased call center volume within this cohort
revealed that it could be a bi-product of electronic payments, including
payments made over the phone. For instance, if a customer who normally
pays by mail receives a notice of termination or has their power turned off
for defaulting on payments, then the most immediate course of restoring
power is to call Utility East and make an electronic payment.
The team studied other potential cost factors in the billing data that are
not included above because the impacts on total cost were negligible. For
instance, while customer defaults on bills and sending collection agents to
a home incur significant costs, they were so infrequent as to not affect the
bottom line.
$0.53 $0.50
$0.06
$0.23 $0.30
$0.26
Mail/Mail Mail/Electronic Electronic/Electronic
Call Center Cost
Delivery/Payment Cost
Deliver by Mail,Pay by Mail
Deliver by Mail,Pay Electronically
Deliver Electronically,Pay Electronically
$0.76$0.80
$0.32
Figure 2
Customers who received
and paid their bills by
mail accounted for the
least call center volume.
16Will the Check Be in the Mail? An Examination of Paper and Electronic Transactional Mail Report Number RARC-WP-15-006
Will the Check be in the Mail? An Examination of Paper and Electronic Transactional Mail
© InfoTrends 2015
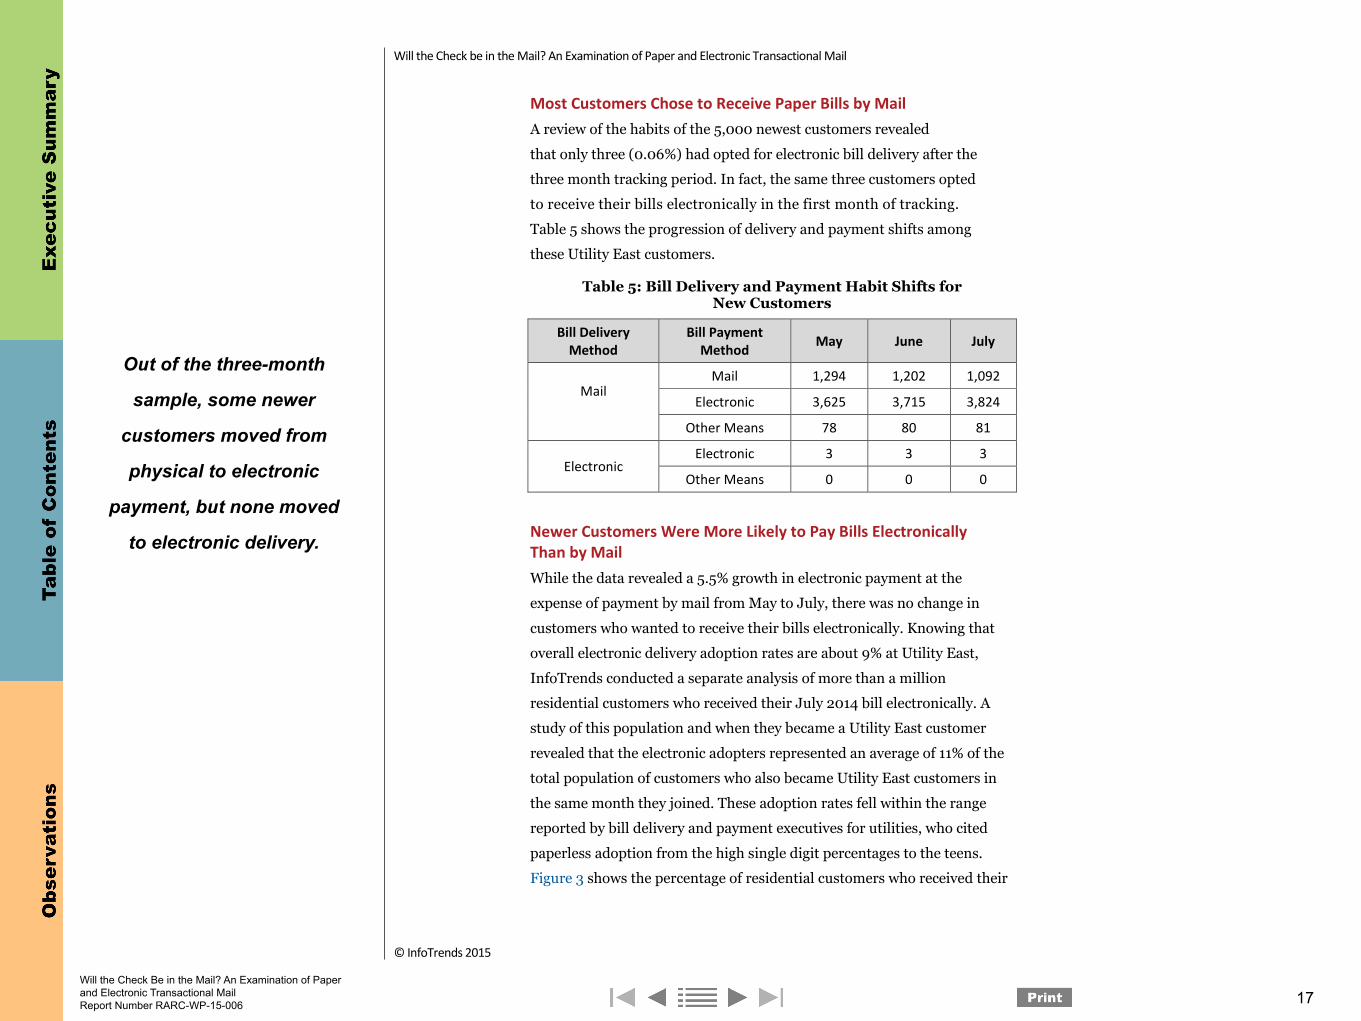
Most Customers Chose to Receive Paper Bills by Mail A review of the habits of the 5,000 newest customers revealed
that only three (0.06%) had opted for electronic bill delivery after the
three month tracking period. In fact, the same three customers opted
to receive their bills electronically in the first month of tracking.
Table 5 shows the progression of delivery and payment shifts among
these Utility East customers.
Table 5: Bill Delivery and Payment Habit Shifts for New Customers
Bill Delivery Method
Bill Payment Method May June July
Mail 1,294 1,202 1,092
Electronic 3,625 3,715 3,824
Other Means 78 80 81
Electronic Electronic 3 3 3
Other Means 0 0 0
Newer Customers Were More Likely to Pay Bills Electronically Than by Mail While the data revealed a 5.5% growth in electronic payment at the
expense of payment by mail from May to July, there was no change in
customers who wanted to receive their bills electronically. Knowing that
overall electronic delivery adoption rates are about 9% at Utility East,
InfoTrends conducted a separate analysis of more than a million
residential customers who received their July 2014 bill electronically. A
study of this population and when they became a Utility East customer
revealed that the electronic adopters represented an average of 11% of the
total population of customers who also became Utility East customers in
the same month they joined. These adoption rates fell within the range
reported by bill delivery and payment executives for utilities, who cited
paperless adoption from the high single digit percentages to the teens.
Figure 3 shows the percentage of residential customers who received their
Newer Customers Were More Likely to Pay Bills Electronically Than by MailTable 5Most Customers Chose to Receive Paper Bills by Mail
Out of the three-month
sample, some newer
customers moved from
physical to electronic
payment, but none moved
to electronic delivery.
17Will the Check Be in the Mail? An Examination of Paper and Electronic Transactional Mail Report Number RARC-WP-15-006

Will the Check be in the Mail? An Examination of Paper and Electronic Transactional Mail
© InfoTrends 2015
July 2014 bill electronically, based on the month and year in which they
became a customer of Utility East.
Figure 3: Electronic Delivery Adoption by Date of Service Initiation
Figure 3 shows a clear recurring pattern, with customers who established
new accounts during the months of June through September being the
most likely to choose electronic delivery. This could speak to the
demographics of people who move during these time periods, rather than
a statement about those specific months. For instance, college students,
recent graduates starting new jobs, and families working around a
school-year schedule tend to move during these months.
Utility East does not actively promote electronic delivery over hardcopy
delivery; rather, it provides passive encouragement on its website and an
expressive environmental message on the envelope. Thus, this data may
represent a more accurate reflection of customer preferences, as there are
no additional incentives for the customer to change their billing approach.
Absent any additional enticement, most customers retained paper delivery
and delayed their decision to switch away from it. Most customers that
chose electronic payment continued to receive paper bills, even after
visiting Utility East’s website. These customers had already taken the time
to establish a digital identity with the company in order to pay online, but
0%
2%
4%
6%
8%
10%
12%
14%
16%
May'14
Jan'14
Sep'13
May'13
Jan'13
Sep'12
May'12
Jan'12
Sep'11
May'11
Jan'11
Sep'10
May'10
Jan'10
Sep'09
May'09
Jan'09
Sep'08
May'08
Jan'08
Sep'07
May'07
Jan'07
Established CustomersNew Customers
Figure 3
Most customers retained
paper delivery and
delayed their decision to
switch away from it.
18Will the Check Be in the Mail? An Examination of Paper and Electronic Transactional Mail Report Number RARC-WP-15-006
Will the Check be in the Mail? An Examination of Paper and Electronic Transactional Mail
© InfoTrends 2015
chose not to move to electronic bill delivery. Each time these users log on,
they are given the option to switch to electronic billing.
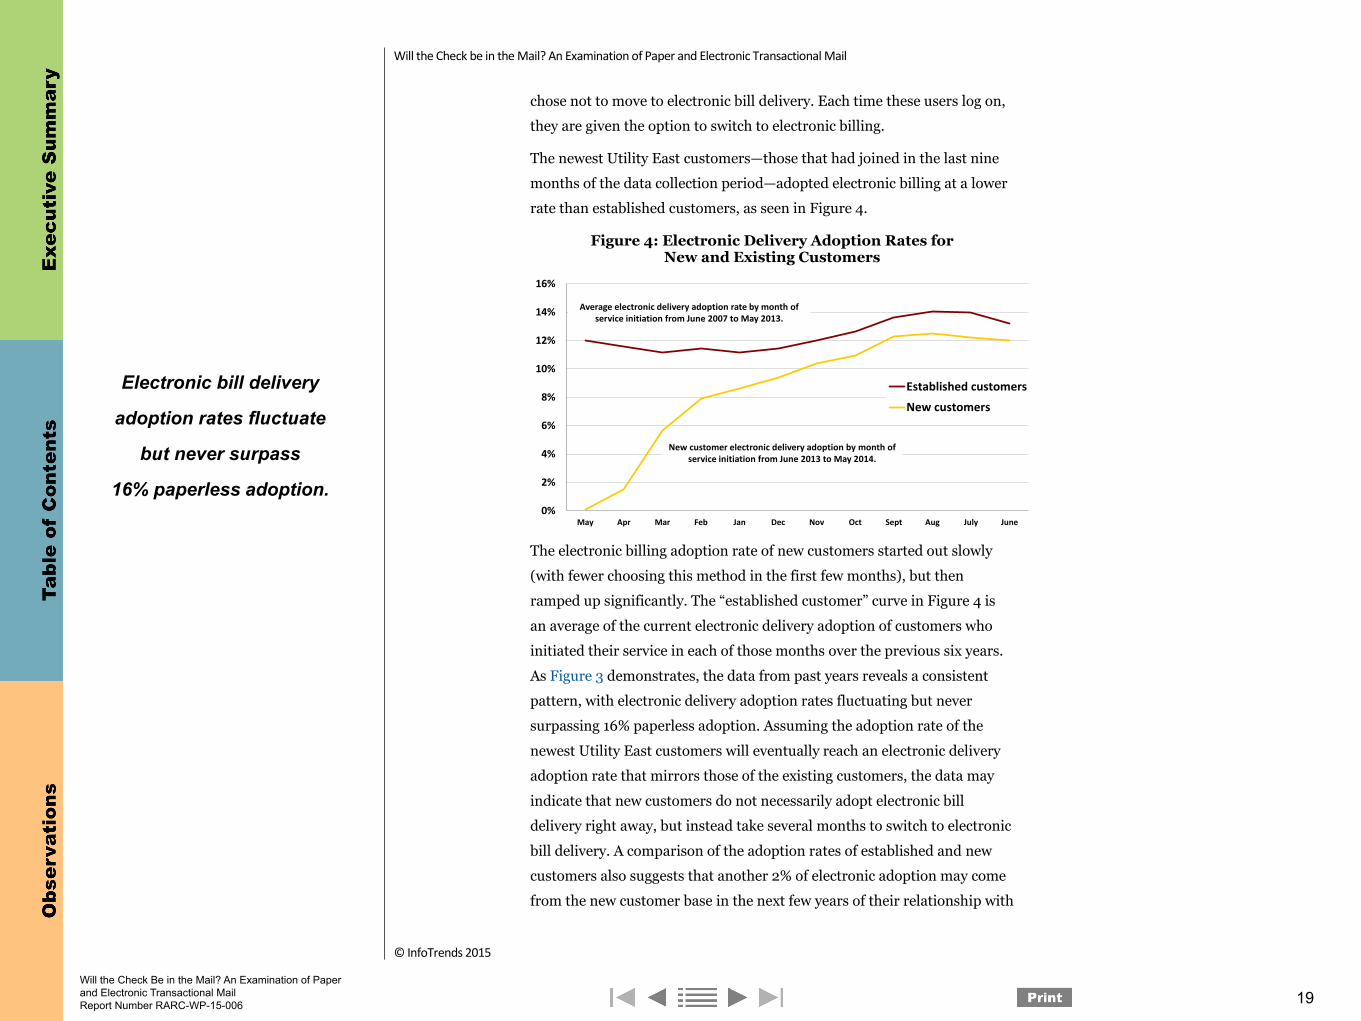
The newest Utility East customers—those that had joined in the last nine
months of the data collection period—adopted electronic billing at a lower
rate than established customers, as seen in Figure 4.
Figure 4: Electronic Delivery Adoption Rates for New and Existing Customers
The electronic billing adoption rate of new customers started out slowly
(with fewer choosing this method in the first few months), but then
ramped up significantly. The “established customer” curve in Figure 4 is
an average of the current electronic delivery adoption of customers who
initiated their service in each of those months over the previous six years.
As Figure 3 demonstrates, the data from past years reveals a consistent
pattern, with electronic delivery adoption rates fluctuating but never
surpassing 16% paperless adoption. Assuming the adoption rate of the
newest Utility East customers will eventually reach an electronic delivery
adoption rate that mirrors those of the existing customers, the data may
indicate that new customers do not necessarily adopt electronic bill
delivery right away, but instead take several months to switch to electronic
bill delivery. A comparison of the adoption rates of established and new
customers also suggests that another 2% of electronic adoption may come
from the new customer base in the next few years of their relationship with
0%
2%
4%
6%
8%
10%
12%
14%
16%
May Apr Mar Feb Jan Dec Nov Oct Sept Aug July June
Established customers
New customers
Average electronic delivery adoption rate by month of service initiation from June 2007 to May 2013.
New customer electronic delivery adoption by month of service initiation from June 2013 to May 2014.
Figure 4
Electronic bill delivery
adoption rates fluctuate
but never surpass
16% paperless adoption.
19Will the Check Be in the Mail? An Examination of Paper and Electronic Transactional Mail Report Number RARC-WP-15-006
Will the Check be in the Mail? An Examination of Paper and Electronic Transactional Mail
© InfoTrends 2015
Utility East. Interestingly, Fiserv research found that 45% of consumers
surveyed preferred to activate electronic billing when opening an
account.19 As noted earlier, the rate of electronic adoption for new
Utility East customers was much lower.
Separate from this analysis, InfoTrends tracks and researches the billing
and payments markets closely. While InfoTrends shows overall electronic
delivery of bills and statements as growing, it has also found that
sometimes customers revert to paper delivery after sampling an
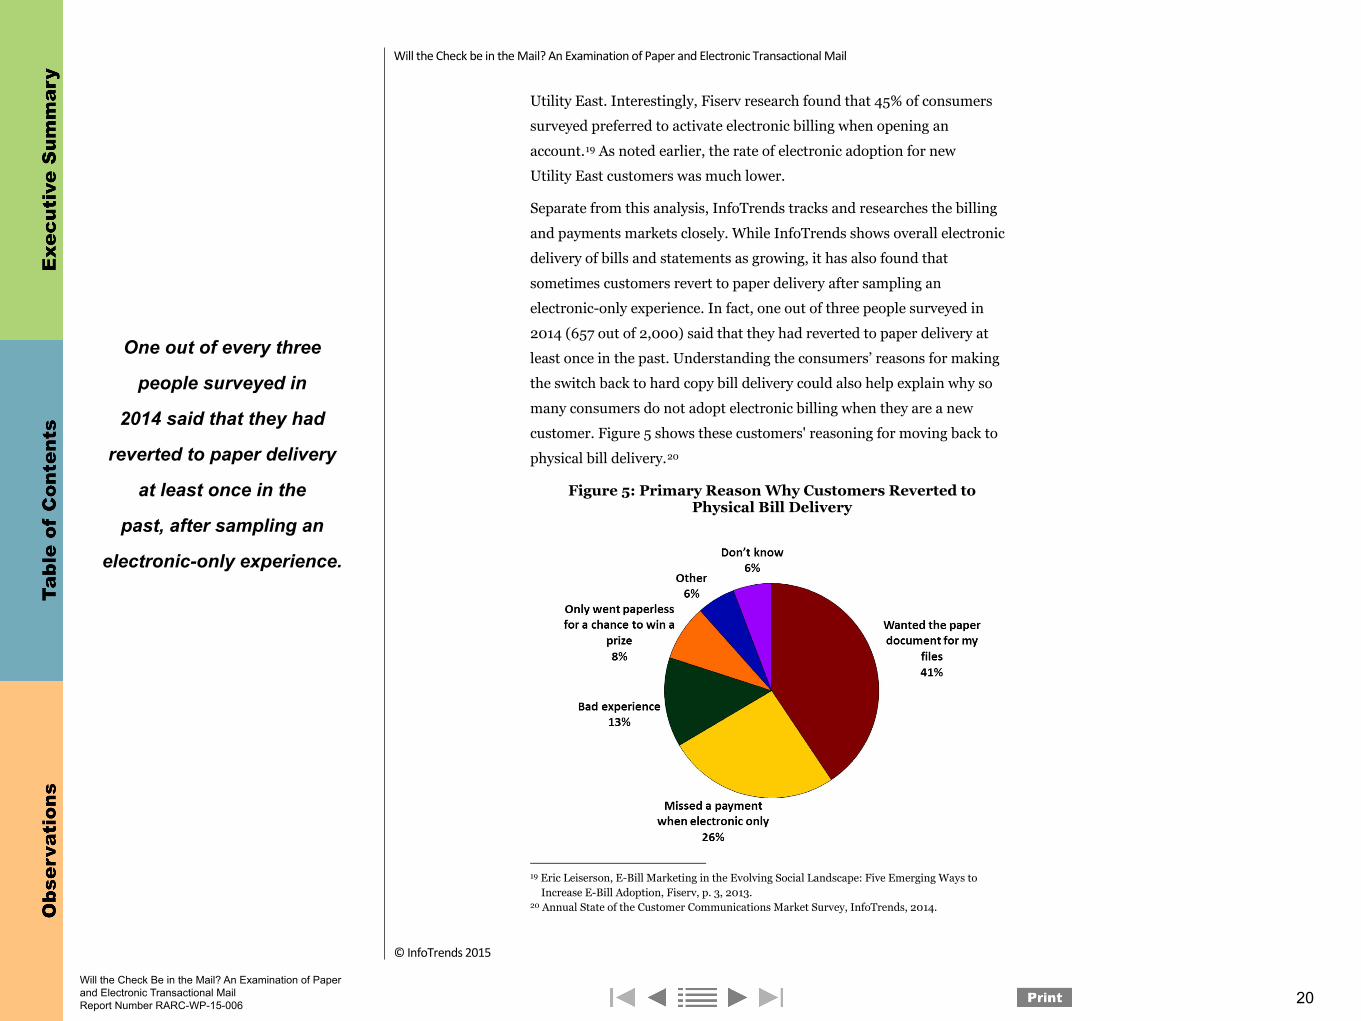
electronic-only experience. In fact, one out of three people surveyed in
2014 (657 out of 2,000) said that they had reverted to paper delivery at
least once in the past. Understanding the consumers’ reasons for making
the switch back to hard copy bill delivery could also help explain why so
many consumers do not adopt electronic billing when they are a new
customer. Figure 5 shows these customers' reasoning for moving back to
physical bill delivery.20
Figure 5: Primary Reason Why Customers Reverted to Physical Bill Delivery
19 Eric Leiserson, E-Bill Marketing in the Evolving Social Landscape: Five Emerging Ways to
Increase E-Bill Adoption, Fiserv, p. 3, 2013. 20 Annual State of the Customer Communications Market Survey, InfoTrends, 2014.
Figure 5
One out of every three
people surveyed in
2014 said that they had
reverted to paper delivery
at least once in the
past, after sampling an
electronic-only experience.
20Will the Check Be in the Mail? An Examination of Paper and Electronic Transactional Mail Report Number RARC-WP-15-006
Will the Check be in the Mail? An Examination of Paper and Electronic Transactional Mail
© InfoTrends 2015
With InfoTrends' research also showing that customers value having a
hardcopy for their records and the physical bill as a reminder to pay, this
data appears to support why the majority of customers receive their bills
by mail, but then pay electronically. The Postal Service promoted the
security of physical bill delivery in a recent advertising campaign, which
was directed at customers like those from the InfoTrends research, who
may not be willing to move their record keeping online.21
This movement from one billing method to another is not unique to
Utility East. Fiserv research revealed that customers often change their
billing methods month to month. The study reported that over 15 million
U.S. households switch their bill payment methods each month, and that
the majority of U.S. households now use multiple methods to pay their
bills.22 Allowing customers to choose from multiple billing and payment
options had a positive impact on customer satisfaction with the biller.23
Adoption Rates for Electronic Bill Delivery Were Far Lower than Rates for Electronic Bill Payment InfoTrends analyzed how the same one million-plus customers that
received electronic bills as of July 2014 paid their most recent bill. That
analysis revealed a very high preference for electronic payment, as seen in
Figure 6. The Figure also includes electronic delivery rates overlaid to
show the disparity.
21 “Hacked,” U.S. Postal Service, 2011, https://www.youtube.com/watch?v=oysFmSVzCnM.
See also “Postal Service Launches New TV Ad Campaign,” Ed O’Keefe, Sept. 30, 2011, http://www.washingtonpost.com/blogs/federal-eye/post/postal-service-launches-new-tv-ad-campaign/2011/09/29/gIQABMTS8K_blog.html.
22 Eric Leiserson, Boosting Satisfaction and Loyalty with Billing and Payments, Fiserv, p. 3, 2014. 23 Ibid.
Adoption Rates for Electronic Bill Delivery Were Far Lower than Rates for Electronic Bill Payment
The majority of U.S.
households now use multiple
methods to pay their bills.
21Will the Check Be in the Mail? An Examination of Paper and Electronic Transactional Mail Report Number RARC-WP-15-006

Will the Check be in the Mail? An Examination of Paper and Electronic Transactional Mail
© InfoTrends 2015
Figure 6: Electronic Payment Adoption by Date of Service Initiation
Electronic payment adoption for these Utility East customers averages
nearly 78%, with new customers on their third billing cycle (March 2014)
exceeding that average. Utility East offers a direct payment plan for
customers, which automatically debits the customer’s account after ten
business days. With an average payment cycle of 27 days across all
customers, the direct payment plan allows Utility East to receive payments
significantly faster than other options.
Reviewing this extended data set reveals a similar trend of peaks and
troughs depending on the month when the resident became a Utility East
customer, but also shows a trend toward increased electronic payment for
newer customers. Residents who became customers in 2007 averaged
electronic payment rates of 74%, compared to almost 80% for those who
became customers in 2013. This could be a result of the demographics of
this particular group of new customers (which Utility East does not
collect), or it might point to something more behavioral. For instance, it is
possible that when someone moves and becomes a new customer they
revisit their approach to billing and payments.
0%
10%
20%
30%
40%
50%
60%
70%
80%
90%
100%
May'14
Jan'14
Sep'13
May'13
Jan'13
Sep'12
May'12
Jan'12
Sep'11
May'11
Jan'11
Sep'10
May'10
Jan'10
Sep'09
May'09
Jan'09
Sep'08
May'08
Jan'08
Sep'07
May'07
Jan'07
Electronic Delivery
Electronic Payment
Established CustomersNew Customers
Figure 6
22Will the Check Be in the Mail? An Examination of Paper and Electronic Transactional Mail Report Number RARC-WP-15-006

Will the Check be in the Mail? An Examination of Paper and Electronic Transactional Mail
© InfoTrends 2015
Consumers may see value in paying bills electronically, as it helps them
avoid associated costs, such as paper checks and stamps. Using estimates of a
single check costing $0.1524 and a stamp at $0.49, the monthly cost to the
consumer is about $0.64 per bill paid by mail. With electronic bill
payment often being free to the consumer, the cost to send a payment by
mail might be a disincentive.
New customers to Utility East that adopted an electronic payment
approach immediately appeared to keep the same approach as they
became longer-standing customers. Comparing electronic bill delivery and
electronic payment adoption shows that it takes more time to ramp up, as
shown in Figure 7.
Figure 7: Electronic Payment and Delivery Adoption Rates for New Customers
This difference in behavior may be the result of the fact that—like many
billing relationships—Utility East customers receive paper bills by default,
but there is no default type of payment. Customers must take action to
establish a payment approach, whereas the delivery approach has already
been dictated to the customer, and they must take action to say that they
would prefer electronic delivery. Even so, InfoTrends market research
shows that consumers see value in receiving their bills by mail, specifically
24 Checks Unlimited, 2014.
0%
10%
20%
30%
40%
50%
60%
70%
80%
90%
100%
May '14 Apr '14 Mar '14 Feb '14 Jan '14 Dec '13
Electronic Payment Adoption
Electronic Delivery Adoption
Most customers adopted electronic payment immediately after initiating their service.
While some customers opted for electronic delivery after initiating their service, it took several months for them to do so.
Figure 7
Consumers see value in
receiving their bills by mail,
specifically to have the
hardcopy for filing purposes
and to have it serve as a
reminder to pay.
23Will the Check Be in the Mail? An Examination of Paper and Electronic Transactional Mail Report Number RARC-WP-15-006
Will the Check be in the Mail? An Examination of Paper and Electronic Transactional Mail
© InfoTrends 2015
to have the hardcopy for filing purposes and to have it serve as a reminder
to pay. For consumers who prefer electronic delivery, they most often cite
convenience and environmental reasons.25 Some consumers also lack the
means to receive and pay bills electronically, while others may distrust the
technologies involved with electronic bill delivery and payment. Ultimately,
when Utility East’s customers chose a payment approach, the vast majority
of them opted for electronic payment.
Executives from the companies we interviewed noted a similar gap
between the percentages of people who chose to receive bills electronically
and those who chose to pay bills electronically. A 2014 Fiserv report also
recognized this difference, dubbing it the “eGap.”26
Conclusions The Postal Service continues to play an important role in Utility East’s
billing and payment workflow, with most customers continuing to receive
their bills by mail. The data did not indicate a dramatic shift in electronic
delivery adoption at the hands of new customers. The Postal Service's role
in delivering inbound payments to Utility East is less significant. Most
customers chose to pay their bills via alternative means, possibly because
of an economic incentive for Utility East customers to pay bills
electronically, by saving money on the cost of the stamp. In the case of bill
delivery, there is less incentive for Utility East customers to receive their
bills electronically, since they are not paying to receive the bill by physical
mail. Of course, the incentive is much greater for Utility East, since the
cost of bill production and delivery falls on the company. While the access
to Utility East's data was invaluable to this project, the data must be
treated as a single reference point and readers must understand that there
are many billing and payment workflows across the United States that
could show variable results. That said, many of the findings in this case
study were corroborated by interviews with executives who managed
billing and payment channels for other companies.
25 Annual State of the Customer Communications Market Survey, InfoTrends, 2014. 26 Eric Leiserson, State of E-Bill Adoption, Fiserv, p. 2, 2014.
Conclusions
24Will the Check Be in the Mail? An Examination of Paper and Electronic Transactional Mail Report Number RARC-WP-15-006
Will the Check be in the Mail? An Examination of Paper and Electronic Transactional Mail
© InfoTrends 2015
Further research on this topic—whether with another utility company
or in a separate industry—would be highly valuable to understanding the
overall billing and payment workflow costs to a company. A study that
incorporates additional data could reveal the true costs to a company of
sending bills and processing payments either through the mail or
electronically. Additional data could include the amount of time it takes
customers to pay, the cost to a company when a customer defaults on a
payment, and the relative costs of how companies handle customers that
default on payments. Some companies handle defaults by sending
additional mailings, while others use automated phone messaging, and
some have call center personnel reach out to the customer for payment.
Ultimately, the Postal Service should not expect consumer preferences to
remain static. As mobile broadband becomes increasingly available across
the United States, more people will likely become comfortable with a
digital lifestyle, including electronic billing. The Postal Service must plan
for the future by examining and being prepared to serve the digital bill
delivery and payment needs of the American public.
Further research could
reveal the true costs
of sending bills and
processing payments.
25Will the Check Be in the Mail? An Examination of Paper and Electronic Transactional Mail Report Number RARC-WP-15-006
U.S. Postal Service Office of Inspector General 1735 N. Lynn Street Arlington, VA 22209
Telephone: 703-248-2100 www.uspsoig.gov
For media inquiries, contact Agapi Doulaveris Telephone: 703-248-2286 [email protected]
Contact Information
26Will the Check Be in the Mail? An Examination of Paper and Electronic Transactional Mail Report Number RARC-WP-15-006