rare disease knowledge and perceptions
TRANSCRIPT

© 2021 Morning Consult, All Rights Reserved.
RARE DISEASE KNOWLEDGE AND PERCEPTIONS
S EP T EM BER 2021

2
To help better understand the perceptions of registered voters in
the US, Morning Consult and Takeda partnered on a large-scale
survey in September 2021. The survey was designed to understand
voters’ knowledge, personal connection, and preferences around
the diagnosis, treatment, and investment in rare diseases. Our
sample included 2200 nationally-representative registered US
voters, balanced across age, gender, income, and regionality.
The results from the present report summarize key findings that
should help Takeda both understand and message the perceptions
of registered voters with internal stakeholders, policy experts, and
government employees.
INTRODUCTION

3
This survey was conducted from September 15th-
19th 2021 among a sample of 2200 nationally-
representative US adults. All respondents are
currently registered to vote in the US. The
interviews were conducted online. Results from
the full survey have a margin of error of plus or
minus 2 percentage points.
METHODOLOGY

4
1. Important for all: While only 10% of voters sampled are personally managing a rare disease (Slide 7), over two-thirds say it is an important topic to them personally (Slide 6). Importance is particularly high among younger adults, parents, and voters who prioritize healthcare as a primary policy issue (Slide 6). Key facts about these conditions, such as ‘50% of rare diseases impact children’ and ‘rare diseases affect 1 in 10 Americans’ are especially likely to increase perceived importance among voters.
2. Big knowledge gap: While importance of rare diseases is quite high, knowledge of rare diseases is fairly low, with a little over one-third of voters stating they are knowledgeable about rare diseases, genetic counseling, and/or genetic screenings (Slide 8). Among those who are personally managing a rare disease, only ~70% feel knowledgeable about the topic; this number drops to ~50% for those who know someone with a rare disease (Slide 9). Most voters think it should take weeks or months to diagnose these diseases.
3. Support for screening: Over two-thirds of voters are supportive of genetic screenings before birth, and this rises to over three-quarters at later life stages (i.e., as part of annual physicals for children and adults; Slide 12). Over 85% think screenings should be offered more comprehensively in the US healthcare system (Slide 14), and over 80% are open to receiving one (Slide 11). Voters would likely be open to sharing this information with their healthcare provider.
4. Open to counsel: Genetic counseling services are extremely appealing for most voters (80% are interested; Slide 16), and about 85% think these services should be covered by health insurance. Over 90% of rare disease holders would be open to genetic counseling services, implying that (1) they would value consultative support on their current diagnosis, and (2) they would have liked to have had this service available previously.
KEY FINDINGS

OVER AL L R AR E D ISEASE PER C EPT ION S
GEN ER AL D IAGN OSIS AN D SC R EEN IN G
GEN ET IC SC R EEN IN G/C OU NSELIN G D ETAIL
SAMPL E D ETAIL
O V ERV I EW

6
About two-thirds of voters say that rare diseases are an important topic to them personally. This number is at/above 70% for individuals that are younger, non-white, parents, and whose top voting issue is healthcare.
O V ERAL L RARE DI S EAS E P ERCEP T I O NS
Overall, how important is the topic of rare diseases to you personally?
27%
29%
35%
29%
19%
27%
26%
24%
38%
29%
39%
40%
40%
39%
42%
41%
38%
43%
43%
31%
42%
37%
17%
19%
11%
16%
22%
19%
16%
18%
15%
15%
11%
8%
9%
8%
6%
9%
10%
7%
8%
8%
8%
8%
7%
4%
7%
7%
8%
6%
8%
7%
7%
6%
5%
All Adults
Gen Z
Millennial
Gen X
Boomer
Male
Female
White
Non-White
Top Issue: Healthcare
Have Children
And how important is the topic of rare diseases to your friends and family?
22%
22%
33%
21%
14%
23%
21%
20%
28%
25%
34%
35%
35%
31%
36%
38%
33%
37%
37%
28%
37%
35%
17%
18%
13%
17%
20%
18%
17%
18%
14%
15%
11%
9%
7%
8%
9%
10%
11%
8%
9%
10%
8%
10%
17%
17%
15%
17%
18%
15%
18%
16%
20%
15%
11%
Top 267%
69%
74%
71%
60%
65%
69%
67%
69%
71%
76%
Top 257%
57%
64%
57%
52%
56%
58%
57%
56%
62%
69%
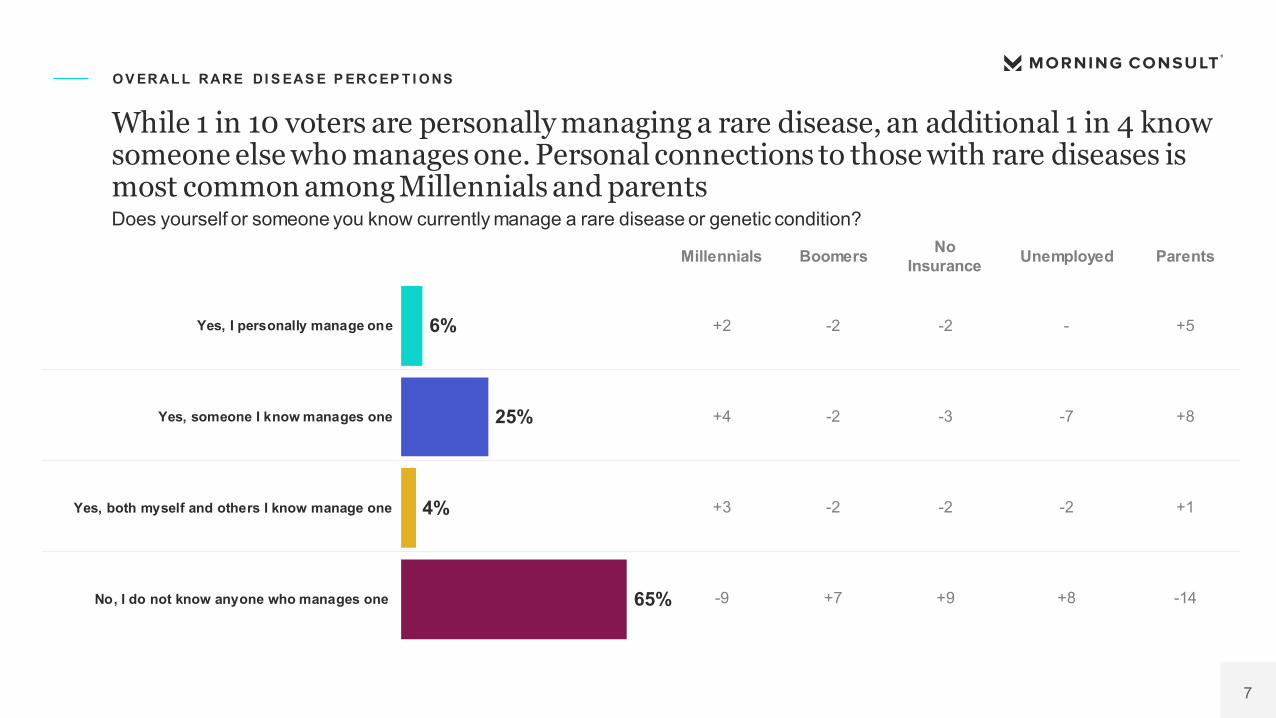
7
Millennials Boomers No Insurance Unemployed Parents
+2 -2 -2 - +5
+4 -2 -3 -7 +8
+3 -2 -2 -2 +1
-9 +7 +9 +8 -14
While 1 in 10 voters are personally managing a rare disease, an additional 1 in 4 know someone else who manages one. Personal connections to those with rare diseases is most common among Millennials and parents
O V ERAL L RARE DI S EAS E P ERCEP T I O NS
Does yourself or someone you know currently manage a rare disease or genetic condition?
6%
25%
4%
65%
Yes, I personally manage one
Yes, someone I know manages one
Yes, both myself and others I know manage one
No, I do not know anyone who manages one

8
Compared to personal health and health of their family, voters feel much less knowledgeable about specific topics like rare diseases and genetic screening procedures. People are least knowledgeable about genetic counseling for patients.
O V ERAL L RARE DI S EAS E P ERCEP T I O NS
93%
85%
70%
42%
36%
32%
My current physical health
My family’s current physical health
US healthcare system
Genetic screening procedures to help withdisease diagnosis and treatment
Rare diseases
Genetic counseling services for patients
How knowledgeable do you feel about each of the following topics?

9
Topical knowledge in this space is much higher among those who are personally affected or close to someone with a rare disease, along with Millennials and parents. Knowledge is much lower among Boomers and non-disease holders.
O V ERAL L RARE DI S EAS E P ERCEP T I O NS
How knowledgeable do you feel about each of the following topics?
Rare Diseases
36%
49%
24%
42%
43%
55%
72%
51%
64%
All Voters
Millennials
Boomers
Top Issue: Healthcare
Employed
Parents
Have Rare Disease
Know Someone with Disease
Have One and Know Someone
42%
52%
35%
40%
48%
57%
66%
54%
63%
Genetic Screening Procedures to Help with Disease Diagnosis and Treatment
32%
42%
25%
34%
40%
47%
53%
42%
59%
Genetic Counseling Services for Patients

OVER AL L R AR E D ISEASE PER C EPT ION S
GEN ER AL D IAGN OSIS AN D SC R EEN IN G
GEN ET IC SC R EEN IN G/C OU NSELIN G D ETAIL
SAMPL E D ETAIL
O V ERV I EW

11
Most voters are highly open to receiving a genetic screening for rare diseases and are just as likely to have their loved ones receive a screening.
G ENERAL DI AG NO S I S AND S CREENI NG
To what extent would you be open to you personally receiving a genetic screening that
tests for certain types of rare diseases?
81%
85%
76%
76%
89%
85%
88%
89%
77%
All Voters
Millennials
Boomers
No Insurance
Income 75-100k
Top Issue: Healthcare
Parents
Have or Know SomeoneWith Rare Disease
Don't Know Anyone WithRare Disease
77%
82%
72%
70%
83%
81%
85%
87%
71%
Difference (You vs. Loved One)
+4
+3
+4
+6
+6
+4
+3
+2
+6
For both questions: “Assume these tests would be administered by your (left) / their (right) general physician, and that they would not require any added costs.”
To what extent would you be open to your loved one(s) receiving a genetic screening that tests for certain types of rare diseases?
% somewhat or very open

12
Support for genetic screening is most notable among Millennials and parents, particularly later in life for children and adults. While weaker overall, support is still very strong for screening during pregnancy and shortly after birth.
G ENERAL DI AG NO S I S AND S CREENI NG
How supportive are you of requiring genetic screening at the following life stages?
% supportive 68% 74% 78% 79%
35% 39% 40% 42%
33%35% 38% 37%
12%10% 9% 7%8% 5% 4% 4%
13% 11% 9% 10%
During pregnancy, prior tobirth
Immediately after birth Every few years as part ofregular physical exams for
children
Every few years as part ofregular physical exams for
adults
Very supportive
Somewhat supportive
Not very supportive
Not at all supportive
Don't know / No opinion
Most support among:
MillennialsParents
Top Issue: Healthcare
MillennialsParents
Has Rare Disease
MillennialsParents
Knows Someone With Rare Disease
MillennialsParents
Has Rare Disease

OVER AL L R AR E D ISEASE PER C EPT ION S
GEN ER AL D IAGN OSIS AN D SC R EEN IN G
GEN ET IC SC R EEN IN G/C OU NSELIN G D ETAIL
SAMPL E D ETAIL
O V ERV I EW

14
Most voters think that genetic testing should be offered more comprehensively in the United States, assuming it can reduce time to diagnose rare diseases.
G ENET I C S CREENI NG / CO UNS EL I NG DET AI L
If genetic screening could help reduce time to diagnosis for various rare diseases, do you think it should be offered more comprehensively across the US healthcare system?
55%
31%
3%1%
9%
Very much so
Somewhat
Not very much
Not at all
Don't know / No opinion
N o Insur ance : 5%B oome r s: 4%N ot O pe n to D ise ase Scr e e ning: 10%
M ale : 34%Income $75-100k: 39%
Top Issue : H e al thcar e: 64%Par e nts: 60%
Pe r sonal D ise ase H olde r : 67%
N o Insur ance : 18%N ot O pe n to D ise ase Scr e e ning: 18%

15
Four in five voters support genetic screening for children, even if it were to identify diseases that there is currently no treatment for.
G ENET I C S CREENI NG / CO UNS EL I NG DET AI L
If genetic screening were available to your children or children you’re close to, to what extent would you want
them to go through this screening? Assume there is not an added cost for this service.
45%
38%
52%
47%
59%
53%
35%
31%
33%
37%
27%
35%
6%
5%
6%
6%
8%
4%
3%
4%
2%
3%
1%
2%
12%
23%
7%
6%
6%
6%
All Voters
No Insurance
Top Issue:Healthcare
Parents
Have RareDisease
Open to DiseaseScreening
If genetic screening was capable of identifying conditions in children that there is currently no treatment for, would you still want the child to go
through this genetic screening process?
44%
36%8%
2%
10%
If ‘very much so’ or ‘somewhat’ to
question on left

16
Genetic counseling services see strong interest overall, with 79% stating they would be interested in talking with a counselor about genetic testing results. Interest is strongest among current rare disease holders and high-income individuals.
G ENET I C S CREENI NG / CO UNS EL I NG DET AI L
42%
45%
48%
45%
61%
36%
37%
43%
36%
39%
30%
38%
7%
6%
7%
6%
2%
7%
4%
1%
2%
3%
4%
5%
10%
6%
6%
8%
4%
14%
All Voters
Income: $75k-100k
Top Issue: Healthcare
Parents
Have Rare Disease
Don't Have Rare Disease
Very interested Somewhat interested Not very interested Not at all interested Don't know / No opinion
79%
88%
84%
84%
91%
74%
Interested (Top Two)
If genetic counseling was offered to help interpret your genetic screening results, how interested would you be in talking with a genetic counselor about your results? Assume there is not an added cost for this service.

OVER AL L R AR E D ISEASE PER C EPT ION S
GEN ER AL D IAGN OSIS AN D SC R EEN IN G
GEN ET IC SC R EEN IN G/C OU NSELIN G D ETAIL
SAMPL E D ETAIL
O V ERV I EW

18
S AM P L E DEM O G RAP HI CS
Generation:
8%
32%
21%
35%
Gen Z
Millennial
Gen X
Boomer
Income:
56%
18%
10%
15%
Under $50k
$50k-$75k
$75k-$100k
Over $100k
Gender:
49%
51%
Male
Female
Race / Ethnicity:
78%
12%
5%
4%
White
Black
Asian
Other
Employment:
46%
12%
25%
7%
3%
6%
Employed
Unemployed
Retired
Homemaker
Student
Other
US Region:
18%
21%
37%
24%
Northeast
Midwest
South
West

19
S AM P L E DEM O G RAP HI CS
Marital Status:
34%
41%
2%
12%
4%
8%
Single, never married
Married
Separated
Divorced
Widowed
Living with a partner
Parent/Guardian of Children:
23%
77%
Yes
No
Education:
40%
20%
8%
20%
2%
9%
HS or less
Some college
Two-year collegedegree
Four-year collegedegree
Somegraduate/professional
school
Graduate/professionaldegree
Health Insurance:
32%
13%
46%
10%
Covered viaemployer
Covered via privateinsurance
Covered via publichealth program
Not covered
Home Region:
28%
47%
25%
Urban
Suburban
Rural

© 2021 Morning Consult, All Rights Reserved.
MORNINGCONSULT.COM