ras design innovations and opportunities for new … · ras design innovations and opportunities...
TRANSCRIPT

WATER TECHNOLOGY
RAS Design Innovations and Opportunities for New Technologies
Frederic GaumetMarius Hægh
1. Salmon industry drives RAS innovations2. Kaldnes® RAS concept3. From concept to reality4. Understand to improve5. A few innovations6. A new way to farm fish?
RAS Design Innovations and Opportunities for New Technologies
2

IntroductionA necessary evolution / revolution for the salmon
industry

4
Production of Atlantic salmon and trout
19990,5 millMT
20303,0 millMT
20101,0 millMT
20505,0 millMT
100% 200% 70%
Source: Almås et al. 2013.: «Verdiskaping basert på produktive hav i 2050»
What are the implications of given future prognoses?
If we assume 4,0 kg harvest per smolt this means:
‐ 750 million smolts in 2028 (15 years from now)‐ 1250 million smolts in 2048 (35 years from now)
What are the implications of the future prognosis
The future of smolt production
5
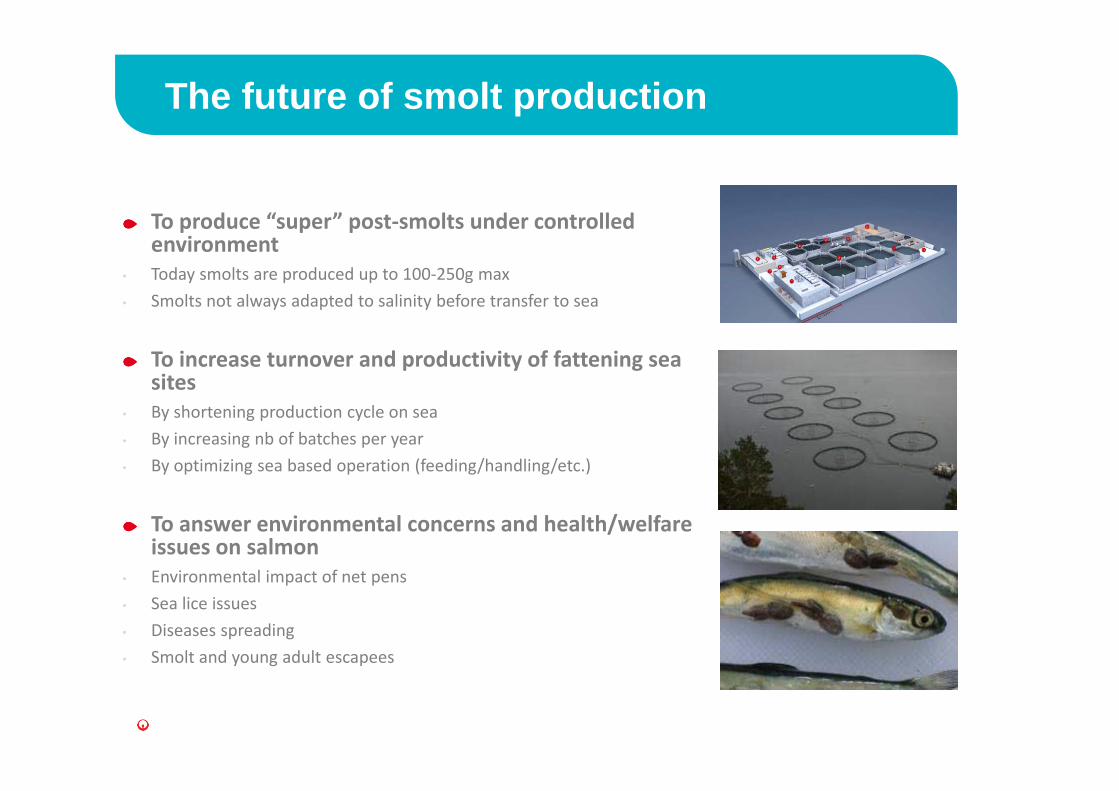
To produce “super” post‐smolts under controlled environment
• Today smolts are produced up to 100‐250g max• Smolts not always adapted to salinity before transfer to sea
To increase turnover and productivity of fattening sea sites
• By shortening production cycle on sea• By increasing nb of batches per year• By optimizing sea based operation (feeding/handling/etc.)
To answer environmental concerns and health/welfare issues on salmon
• Environmental impact of net pens• Sea lice issues• Diseases spreading• Smolt and young adult escapees

The most important message is HERE:
6
VF3 akk
00,5
11,5
22,5
3
Lok 1
Lok 1
Lok 2
Lok 2
Lok 2
Lok 2
Lok 3
Lok 3
Lok 3
Resirk
Resirk
Resirk
Resirk
Resirk
Lok 4
Lok 5
Lok 5
Lok 6
Lok 6
Lok 7
Lok 7
Lok 7
VF3 akk
00,5
11,5
22,5
3
Lok 1
Lok 1
Lok 2
Lok 2
Lok 2
Lok 2
Lok 3
Lok 3
Lok 3
Resirk
Resirk
Resirk
Resirk
Resirk
Resirk
Resirk
Resirk
Resirk
Resirk
Lok 4
Lok 5
Lok 5
Lok 6
Lok 6
Lok 7
Lok 7
Lok 7
Lok 5
Lok 5
Lok 6
Lok 6
Lok 7
Lok 7
Lok 7
% døde.
0,002,004,006,008,00
10,0012,0014,0016,00
Lok 1
Lok 1
Lok 2
Lok 2
Lok 2
Lok 2
Lok 3
Lok 3
Lok 3
Resirk
Resirk
Resirk
Resirk
Resirk
Lok 4
Lok 5
Lok 5
Lok 6
Lok 6
Lok 7
Lok 7
Lok 7
% døde.
0,002,004,006,008,00
10,0012,0014,0016,00
Lok 1
Lok 1
Lok 2
Lok 2
Lok 2
Lok 2
Lok 3
Lok 3
Lok 3
Resirk
Resirk
Resirk
Resirk
Resirk
Resirk
Resirk
Resirk
Resirk
Resirk
Lok 4
Lok 5
Lok 5
Lok 6
Lok 6
Lok 7
Lok 7
Lok 7
Lok 4
Lok 5
Lok 5
Lok 6
Lok 6
Lok 7
Lok 7
Lok 7
Smolt produced in RAS show very good performances when placed in growout sea pen farms. Superior growth and lower mortality.
Post‐smolts performances after transfer to sea (the first 3 months in net pens)
SGR (%/day)
Mortality (% over a 3 months period)

Moving forward to more sustainability
Industry Challenge
7
Land and water availability
Animal welfare and performance
Operational conditions and technical risk
Environmental impact, sustainability and regulatory and
consumer risks
Profitability
RAS’s response
Significantly reduced water consumptionLess land due to reduced footprint
Healthier and more disease resistant fishBetter animal welfare due to better overall conditions
Reduced vulnerability towards external factorsImproved control over biological performanceReduced technical risk
Reduced costs of installation and operationLower energy costsReduced technical, political and consumer risks
Reduced impact and load on the natural environmentSludge and effluent recoveryReduced physical and carbon footprintsReduced regulatory and consumer risks
Compact and energy efficient designKaldnes® RAS

9
Kaldnes ® RAS – Compact and energy efficient design
Krüger Kaldnes
1122
33
44
55
6677
88
9910
13
11
12
1. Inspection and access opening2. Bioreactor 23. Bioreactor 14. Air blowers in sound silencer chamber5. Drum filter 60 micron6. Drum filter 20 micron7. Drum filter 60 micron8. Pumps9. Bypass and return water10. CO2 and N2 stripper11. Collection pipe inlet water12. Collection pipe outlet water13. Deepshaft oxygen cone

10
Kaldnes® RAS – Video
Krüger Kaldnes
Design innovationKaldnes® RAS in Practice

12
Design innovation - Kaldnes® RAS in Practice
Krüger Kaldnes
Largest aquaculture recycling center in EuropeCutting edges technologyBoth fresh‐ and seawater
Nofima Research station – Sunndalsøra (NO)

13
Design innovation - Kaldnes® RAS in Practice
Krüger Kaldnes
Capacity over 5 Million smolts/yearTotal rearing volume 4250 m3Complete process design and delivery by Krüger Kaldnes
MARINE HARVEST, DALSFJORD – Grow out

14
Design innovation - Kaldnes® RAS in Practice
Krüger Kaldnes
Capacity 3 Millions smolts/yearTotal rearing volume 3000 m3Complete process design and delivery by KrügerKaldnes
Sundsfjord Smolt AS

15
Design innovation - Kaldnes® RAS in Practice
Krüger Kaldnes
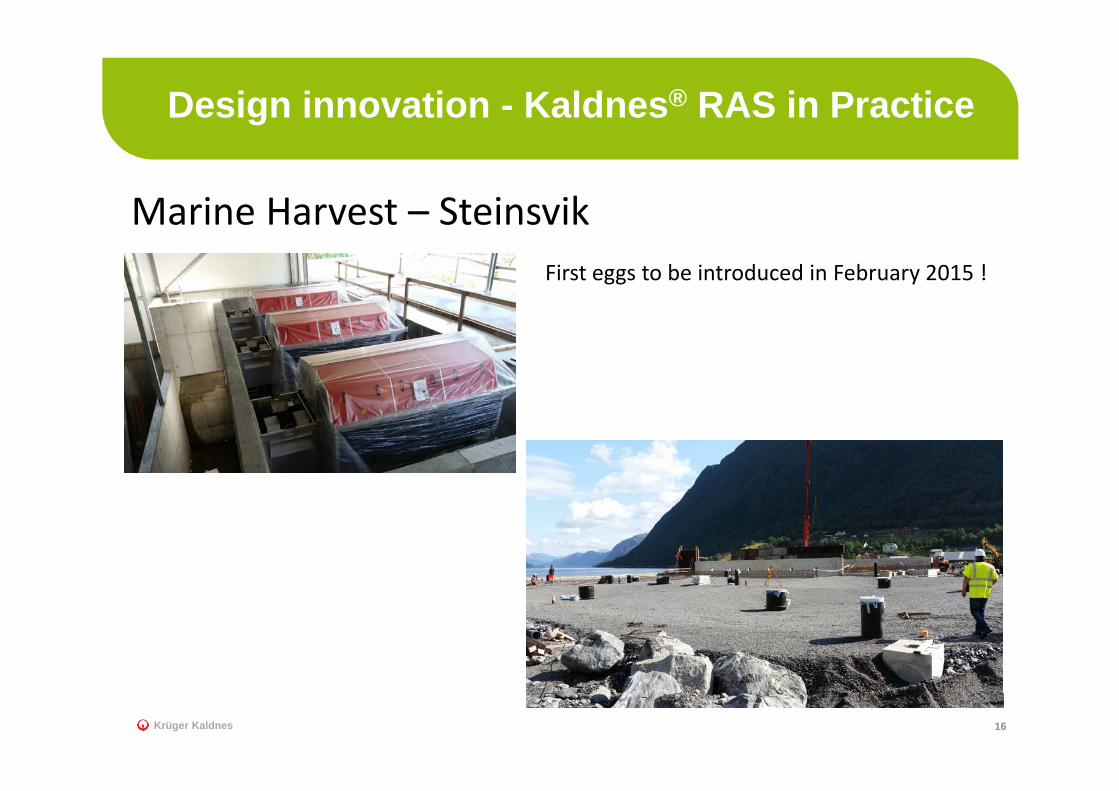
Marine Harvest – Steinsviko Capacity of 5,3 mill smolt up to 250g/year
o 3 department
o 9600 m3 total rearing volume
o 10MT total daily feeding
16
Design innovation - Kaldnes® RAS in Practice
Krüger Kaldnes
Marine Harvest – SteinsvikFirst eggs to be introduced in February 2015 !
Understand to improveRecirculating Aquaculture System (RAS)

Our Development Strategy
Strong focus on understanding water quality and technologicalperformance to develop the best solutions available
18Krüger Kaldnes
o Development and documentation of:o Energy efficient production
o Biosecurity and plant management
o Fine particle control and water quality polishing
o Optimization of biological water treatment
o Low energy/low head gas control in RAS treatment loop
o Efficient and sustainable solutions for sludge treatment and
handling
0%10%20%30%40%50%60%70%80%90%100%
5,0
6,4
8,0
10,1
12,7
16,0
20,2
25,4
32,0
40,3
50,8
64,0
80,7
101,7
128,1
161,4
203,4
256,3
Cumulative volume pe
rcen
tage
Particle size (µm)After DF
Before DF
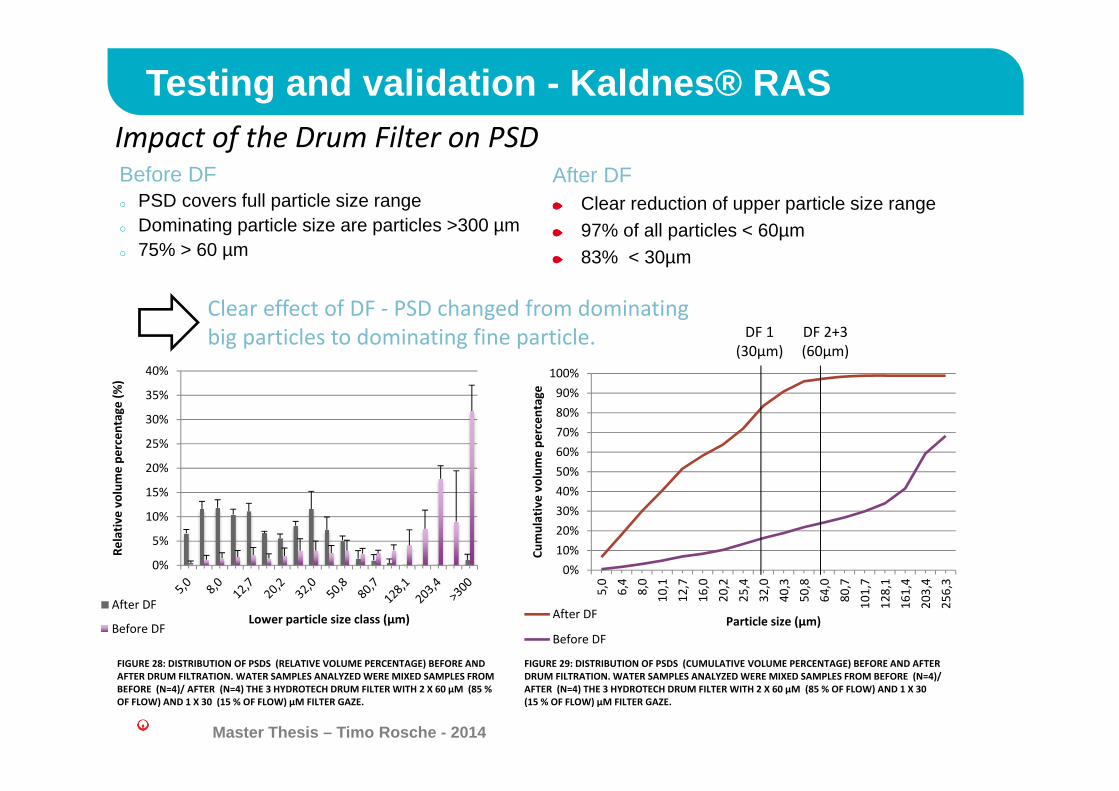
Before DFo PSD covers full particle size rangeo Dominating particle size are particles >300 µmo 75% > 60 µm
Master Thesis – Timo Rosche - 201419
Impact of the Drum Filter on PSD
FIGURE 28: DISTRIBUTION OF PSDS (RELATIVE VOLUME PERCENTAGE) BEFORE AND AFTER DRUM FILTRATION. WATER SAMPLES ANALYZEDWERE MIXED SAMPLES FROM BEFORE (N=4)/ AFTER (N=4) THE 3 HYDROTECH DRUM FILTER WITH 2 X 60 µM (85 % OF FLOW) AND 1 X 30 (15 % OF FLOW) µM FILTER GAZE.
FIGURE 29: DISTRIBUTION OF PSDS (CUMULATIVE VOLUME PERCENTAGE) BEFORE AND AFTER DRUM FILTRATION. WATER SAMPLES ANALYZEDWERE MIXED SAMPLES FROM BEFORE (N=4)/ AFTER (N=4) THE 3 HYDROTECH DRUM FILTER WITH 2 X 60 µM (85 % OF FLOW) AND 1 X 30 (15 % OF FLOW) µM FILTER GAZE.
0%
5%
10%
15%
20%
25%
30%
35%
40%
Relativ
e volume pe
rcen
tage
(%)
Lower particle size class (µm)After DF
Before DF
DF 1 (30µm)
DF 2+3 (60µm)
After DFClear reduction of upper particle size range97% of all particles < 60µm83% < 30µm
Clear effect of DF ‐ PSD changed from dominatingbig particles to dominating fine particle.
Testing and validation - Kaldnes® RAS

Testing and validation - Kaldnes® RAS
20Krüger Kaldnes
Total ammonia nitrogen (TAN) was in the range 0,4 – 0,6 mg/L in both test periods.
This shows that the nitrification is stable and efficient at thetested feed loads (900 – 1100 kg/d).
Note that the CO2 stripper also contribute considerably to total nitrification capacity inthe system.

CO2 og N2- removal
21Krüger Kaldnes
G:L ratio 5:1Neg. pressure 0,3 mVs increase capacity
N2 saturation
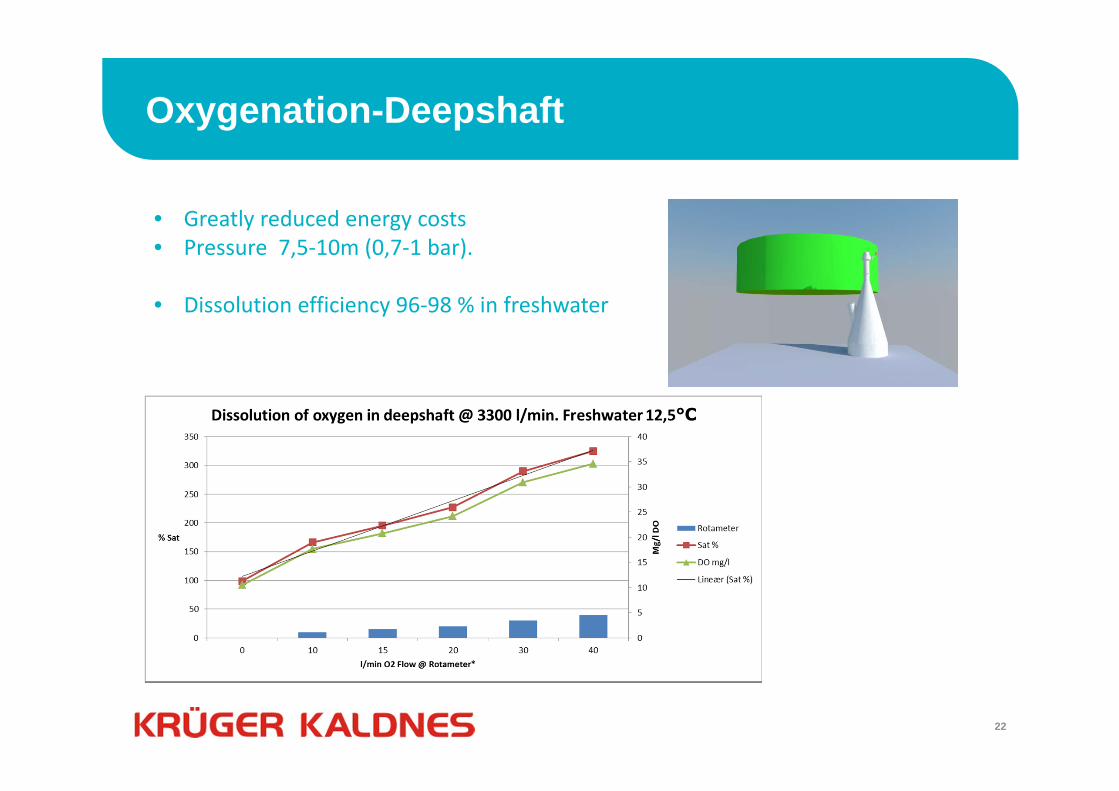
Oxygenation-Deepshaft
22Krüger Kaldnes
• Greatly reduced energy costs• Pressure 7,5‐10m (0,7‐1 bar).
• Dissolution efficiency 96‐98 % in freshwater

Advanced Oxydation Technology (AOT)New Technologies
24
New Technologies – AOT
Krüger Kaldnes
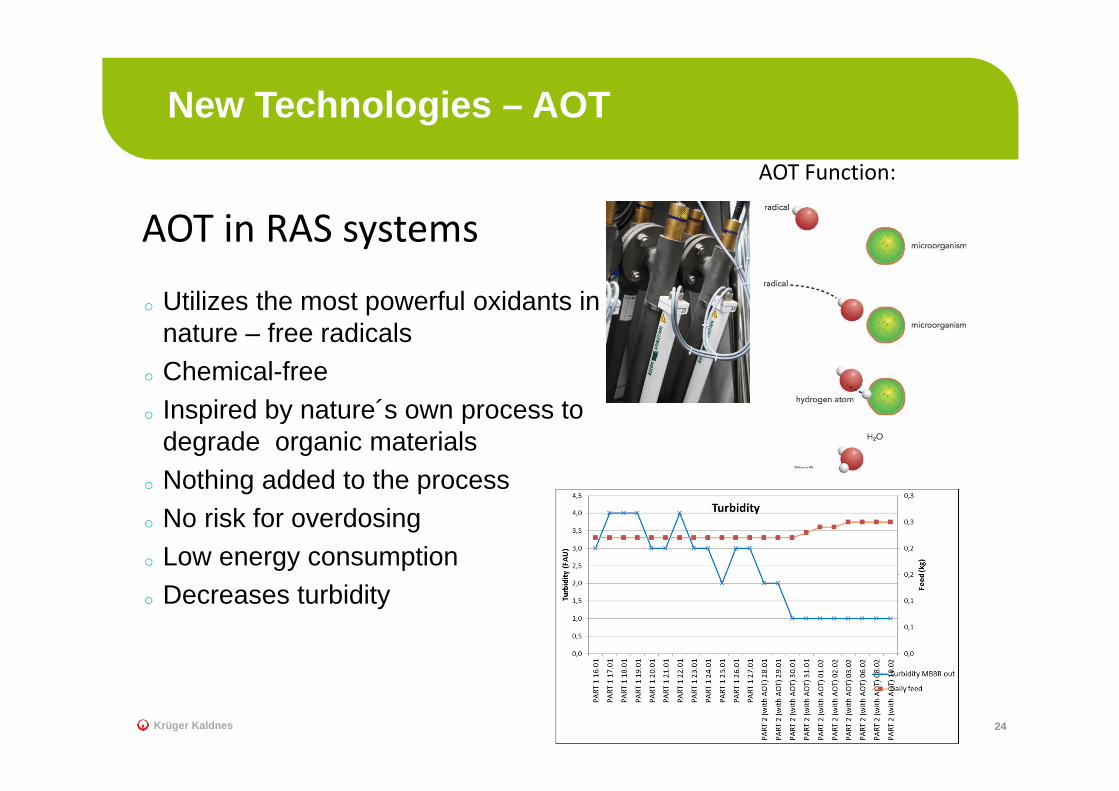
o Utilizes the most powerful oxidants in nature – free radicals
o Chemical-freeo Inspired by nature´s own process to
degrade organic materialso Nothing added to the processo No risk for overdosingo Low energy consumptiono Decreases turbidity
AOT in RAS systemsAOT Function:

Kaldnes® RAS - TerflexNew Technologies

26
New Technologies - Kaldnes® RAS - Terflex
Krüger Kaldnes
Side stream Ultrafiltration System at 0,02 micronLarge scale trial at NofimaSignificant impact on water qualityHigh membrane efficiencies
Fine solids and colloidal particle removal

Anita™ MoxNew Technologies

28
New Technologies - Anita™ Mox
Krüger Kaldnes
The key conversion in the ANITA™ Mox is nitrogen removal through anaerobic ammonium oxidation
Anaerobic ammonium oxidation (Anammox)
NH4+ + NO2
‐ ‐> N2 + 2H20
Features:• Less O2 (≈ 60%)• No carbon needed• Less CO2 production• Less sludge production• Less alkalinity consumption (≈ 50%)
Disadvantages:• Slow growth rate, doubling time 11‐13
days ‐ long start‐up periods• Necessary to have a long SRT (Biofilm)• Nitrite accumulation if process is
inhibited
Nitryfying biofilm vs. Anammox biofilm

New MBBR Media ?New Technologies
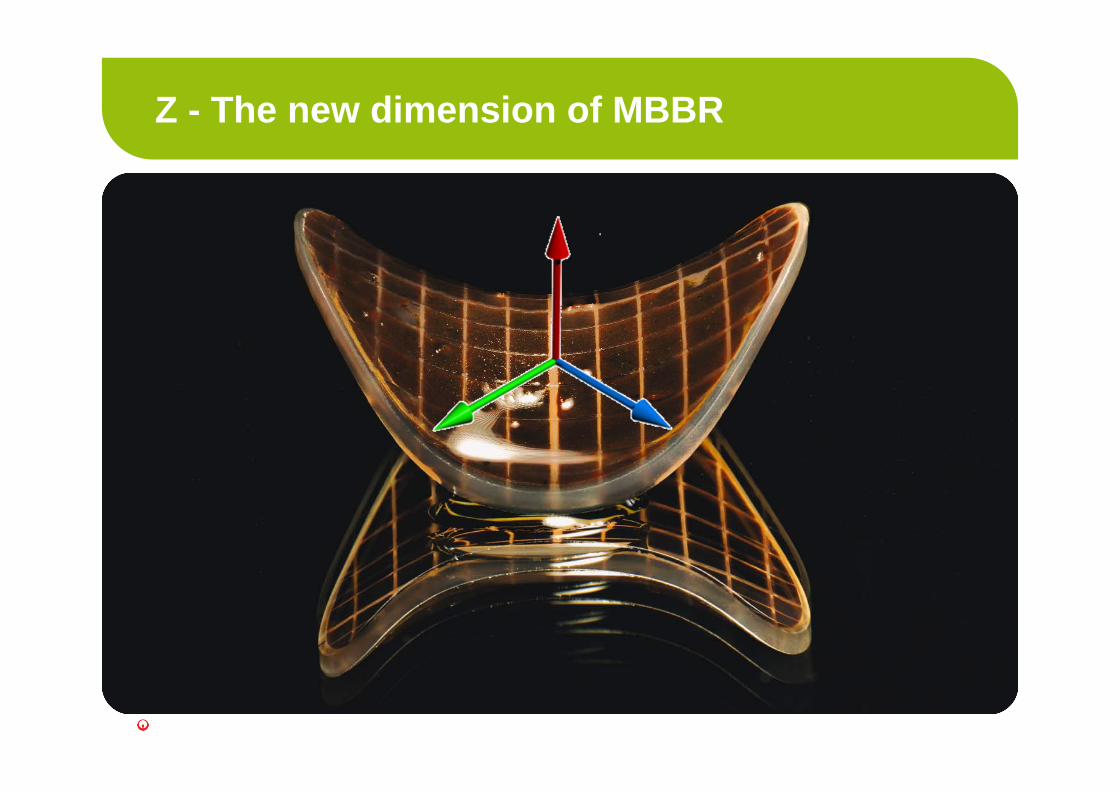
Z - The new dimension of MBBR

Biofilm surface area at different biofilm thickness
Protected surface area vs biofilm surface area
31

When oxygen and other reactants are consumed, a redox gradient is formed in the biofilm
The importance of the redox gradient
32
Carrier
Bulk Liquid
Oxygen
BoundaryLayer
Anaerobic Anoxic Aerobic

The principle of biofilm control
33
1
2
3
4
o Carrier design for self-control of biofilm thickness

Possibilities with biofilm control
Eliminating variations due to changes in biofilm thicknessEliminating limitations due to clogging biofilmFacilitates engineered and controlled redox gradients allowingtailor-made design for specific reactions
Thin, completely aerobic Aerobic and anoxic Thick aerobic, anoxic, anaerobic
Selenium removalExamples:Nitrification with organicload
ANITA Mox

The optimized carrier
Combines a controlled biofilm and design for maximum mass transferIs different for different applications
A New Way to Produce FishRAS 2020 Technology

RAS2020 : Or how to combine RW fish handling efficiency and circular tanks hydrodynamics
37Krüger Kaldnes
A capacity of 1200MT salmon 4‐5 kg/yearwithin a 2700 m2 building

Compact – no piping – built in 6 months
38Krüger Kaldnes
1. Fish tanks with movable compartments2. Transport Channel outlet3. Inlet weir for Drumfilters4. UV-treatment of partial stream5. MBBR reactor6. CO2 and N2 stripper7. Propeller pumps into level weir8. Inlet channel & circulation propellers9. Purging tank10. AOT treatment for purging11. Denitrification Reactor
FootprintMBBR 160m2
Tank 580m2
Rearing Vol 2680m3

Assumptions and specs.
39Krüger Kaldnes

WATER TECHNOLOGY
Thank you