rate advisory committee generation planning …
TRANSCRIPT

PRESENTED BY :
John KosubSr. Director, Energy Portfolio Analytics
September 9, 2021
In fo rmat iona l Update
RATE ADVISORY COMMITTEE
GENERATION PLANNING DISCUSSION
2
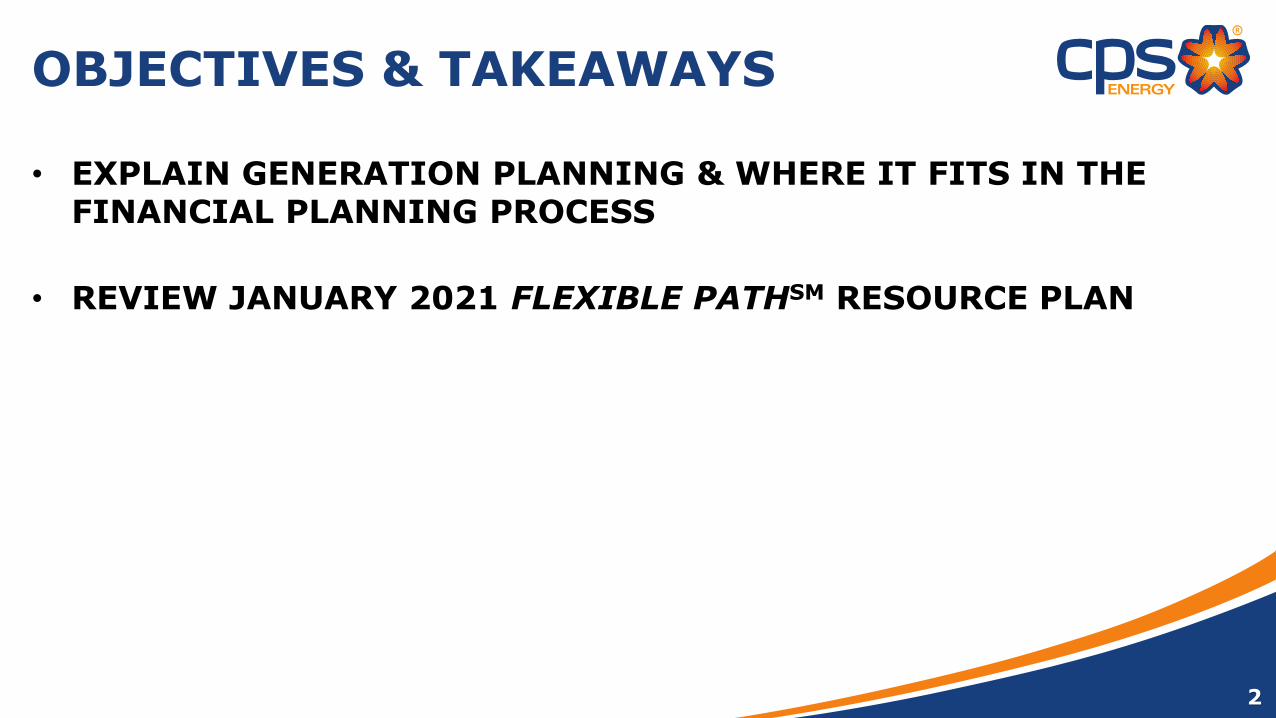
OBJECTIVES & TAKEAWAYS
• EXPLAIN GENERATION PLANNING & WHERE IT FITS IN THE FINANCIAL PLANNING PROCESS
• REVIEW JANUARY 2021 FLEXIBLE PATHSM RESOURCE PLAN

3
AGENDA
• OUR GUIDING VALUE PILLARS
• OUR FLEXIBLE PATH JOURNEY
• GENERATION PLANNING & RELATIONSHIP TO FINANCIAL PLANNING PROCESS
• FLEXIBLE PATH RESOURCE PLAN: FY2022 BUDGET CASE (BASELINE)
• FLEXIBLE PATH RESOURCE PLAN: FY2022 SPRUCE ALTERNATIVES
• KEY TAKEAWAYS

OUR GUIDING PILLARS & FOUNDATION
All business decisions are based on our commitment to being one of the best-managed & most
Financially Responsible utilities in the nation!
4

THE MAJOR PARTS OF ELECTRICITY SYSTEMS THAT GIVE RISE TO COSTS
5
Source: Brattle
1. Generation(50 - 60% of costs)
Step-up
Transformer
Industrial customers
Commercial customers
Residential customers
Transmission lines
(above 50kV)
2. Transmission(5 – 15% of costs)
3. Distribution(20 – 40% of costs)
Secondary distribution
Secondary distribution
Unless otherwise indicated, all CPSE
values are for FY2017
Focus Area for Generation Planning
6
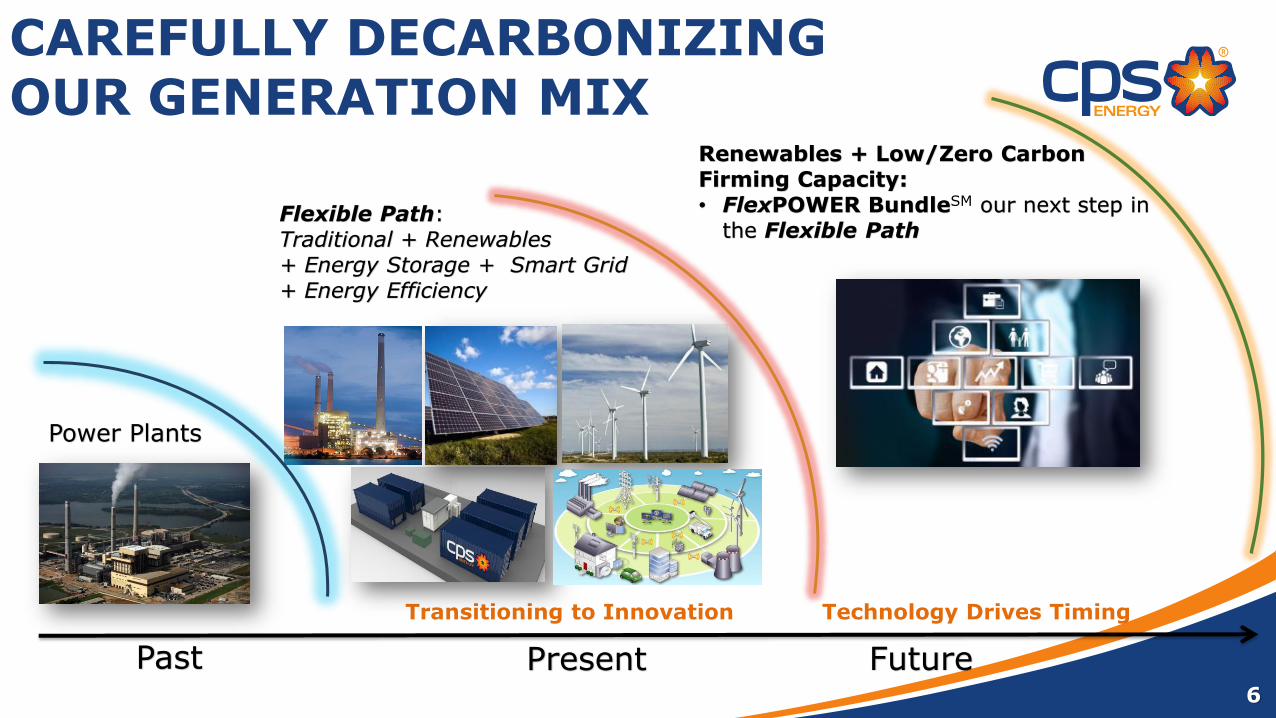
CAREFULLY DECARBONIZING OUR GENERATION MIX
Past Present Future
Power Plants
Flexible Path:Traditional + Renewables + Energy Storage + Smart Grid + Energy Efficiency
Technology Drives Timing Transitioning to Innovation
Renewables + Low/Zero Carbon Firming Capacity:• FlexPOWER BundleSM our next step in
the Flexible Path

7
ALIGNMENT WITH THE CAAP CLIMATE ACTION & ADAPTATION PLAN
Our Flexible Path charts a journey to reduce emissions & ultimately reach
carbon neutrality by 2050.
August 2019 Board of Trustees’ Resolution of Support for Climate Action
& Adaptation Plan (CAAP)
8
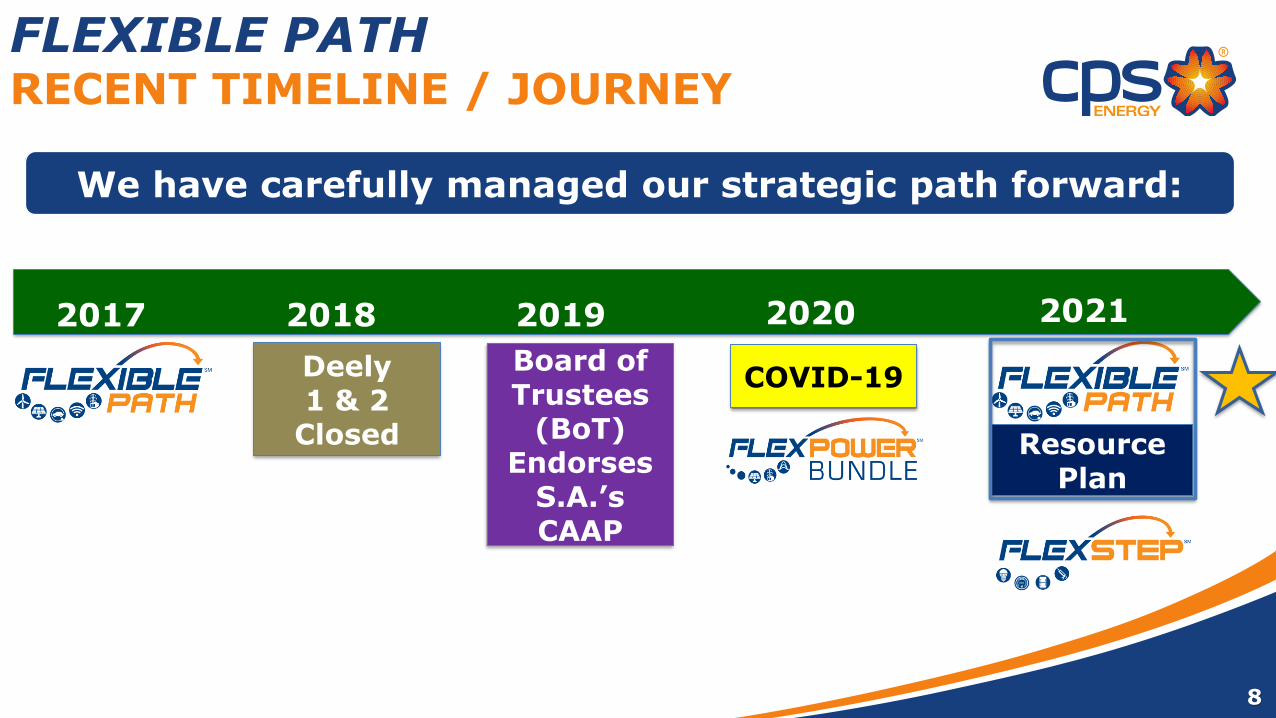
FLEXIBLE PATHRECENT TIMELINE / JOURNEY
2017 2018 2019 2020 2021
Deely 1 & 2
Closed
Board of Trustees
(BoT) Endorses
S.A.’s CAAP
COVID-19
Resource Plan
We have carefully managed our strategic path forward:

ENVIRONMENTAL RESPONSIBILITYOUR SOLID PROGRESS TO DATE – 1 OF 2
KEY SUCCESSFUL ENVIRONMENTAL COMMITMENTS TO DATE!
• 2000 ➔ We started investing in wind.
• 2012 ➔ We started investing in solar.
• 2017 ➔ CEO created the Flexible Path.
• 2018 ➔ We closed OLDER Coal units.
• 2019 ➔ Via our Flexible Path, we are
focused on 80% reductions in carbon emissions by 2040.
• 2019 ➔ The Board of Trustees endorsed the Climate Action & Adaptation Plan (CAAP) & we are now working towards full carbon neutrality by 2050.
• 2019 ➔ STEP successfully completed. 9

10
ENVIRONMENTAL RESPONSIBILITYOUR SOLID PROGRESS TO DATE – 2 OF 2
Our carbon intensity has been on a beneficial downward trend since 1980, even though S.A.’s energy needs have increased.

11
FLEXIBLE PATHITS BALANCED DESIGN DRIVES REAL PROGRESS

25-Year:
Strategic Planning
Economic and population trends
Planning for new resources and retirements
“Flex Path”
5-Year:
Detailed capital and O&M plans
Financial goals
1-Year:
Operational Planning
Sales and purchases of power
Seasonal Weekly Daily Hourly
Focus Area for Generation Planning
RESOURCE PLANNING HORIZONS
12
Analyze
ExecuteMeasure
Plan
Resource planning is managed comprehensively across multiple time horizons, and with many iterations throughout the year.
25-Year:
Strategic Planning
Economic and population trends
Planning for new resources and retirements
“Flex Path”
5-Year:
Detailed capital and O&M plans
Financial goals
1-Year:
Operational Planning
Sales and purchases of power
Seasonal Weekly Daily Hourly

PLANNING TERMINOLOGY
13
The goal of our planning process is to ensure adequate supply is available to meet the needs of our customers.
Demand“Usage”“Load”
Supply“Resources”“Capacity”

14
OVERVIEW OF THE LONG-TERM PLANNING PROCESS
Resource and Capital Plan
FinancialForecast
25 Year Usage Forecast
Production Cost Modeling

15
FINANCIAL PLANNING INPUTS
Electric Production CostsA - Usage Forecast
B - Production Cost Modeling
C - Revenue Forecast
D - CashFlow Analysis
EconomicsHistorical UsageEnergy Efficiency
Generation CostGeneration PerformanceMarket PricingRegulatory Inputs
Operating CostsCapital CostsFinancing CostsFinancial Targets
E - Budget Plan/Rate Plan
Fuel Costs
Focus Area
Detailed, industry-standard computer models are used for Usage and Production Cost Modeling forecasts.

FORECASTING OVERVIEW
Generation Resource = Load (Demand) + Reserve Margin
• Customer Growth (Electric & Gas Sales)• Regulatory Costs (TCOS, ERCOT)• Fuel Cost (gas, coal, nuclear, renewables)• Generation Resource Assumptions
• Market Power Prices• Wholesale price, revenue & margin• Interest Rates
FORECAST INPUTS
WE DEPLOY AN ANNUAL
UPDATE PROCESS
5-year detailed planning by business unit
Historical & current year performance
25-Year Long Range Plan
1 2 – 5 6 – 25
Year 1 will be presented to Board for approval (outer years are refreshed in subsequent planning cycles, so they are considered preliminary & subject to change)
A robust long range planning process is essential for long-term resource planning & yields budget targets, financial metric performance, & revenue support
requirements.
16

IMPACT OF STRATEGIC DECISIONS
$9
Strategic decisions are viewed through the bill impact lens.
OUR RATE MODELING PROCESS IS ALSO USED TO EVALUATE ALTERNATIVE STRATEGIES
Integrated Forecast Model
Process OutputRevenue
Requirement, Rates & Bill
Impact
Customer Count, Usage
& Load
ERCOT Market Conditions
Wholesale Revenue
Generation Unit & Renewable Availability
Metrics & Rating Agency
Perspectives
Economic Dispatch
Financial Markets
Budgeting
Fuel Costs
Sample Decision
Retire Coal Plants?
Focus Area for Generation Planning
17

JANUARY 2021
FLEXIBLE PATH RESOURCE PLAN
BUDGET CASE (BASELINE)
VINTAGE: FY2022 BUDGET
18

19
DISCLAIMER
We continue to work through the unprecedented global, national, state, and local implications of COVID-19. Additionally, energy generation technologies and electric market policies continue to evolve, and the economic implications of these changes remain uncertain. Our current projections were prepared in-light of these factors for preliminary informational discussion purposes only. Due to the changing COVID-19 pandemic, technology, and policy environments, these projections are preliminary and subject to change at any time in the future. Please be assured that we worked hard to thoughtfully think through our analyses. This said, since there is tremendous uncertainty across the current economic, financial, regulatory, and legislative landscapes, the actual results over the long term could vary significantly from what we are projecting at this time.
We will continue to perform economic analyses of various generation portfolio compositions. These current analyses are preliminary and based on internal, as well as external data, and will continue to evolve as more information becomes available.
Please also note that much of the data is subject to change, thereby impacting projected outcomes. This document has therefore been prepared for informational discussion purposes only and data presented is as of the date of this document. The CPS Energy management team looks forward to community conversations that will focus on this information. CPS Energy’s contributions to those discussions will l be constructive, respectful, open, and helpful.

• Budget Case (Baseline):
o Assumptions for the 25-year budget
o Updated at least once per year
o Alternatives are assessed by comparing to the Budget Case (Baseline)
o FY2022 Budget Case is the assumption set for the January 2021 Flexible Path Resource Plan
20
BUDGET CASE (BASELINE)
21
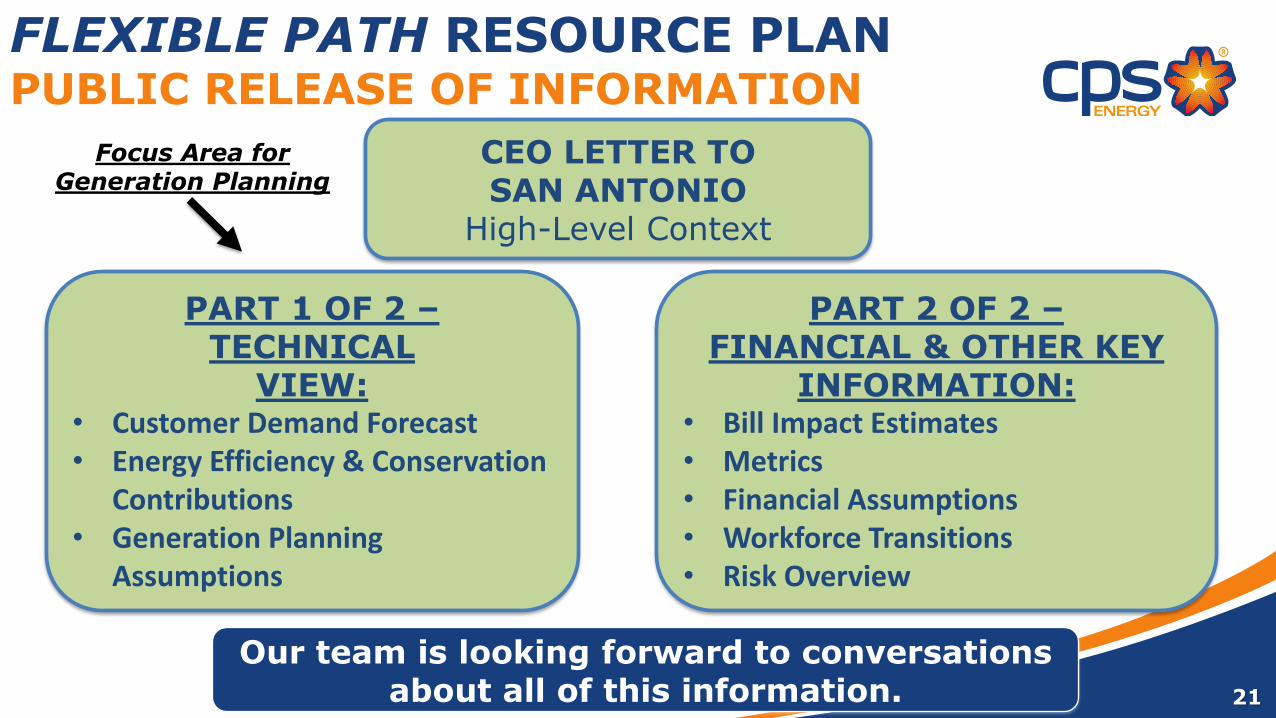
FLEXIBLE PATH RESOURCE PLANPUBLIC RELEASE OF INFORMATION
CEO LETTER TO SAN ANTONIO
High-Level Context
PART 1 OF 2 –TECHNICAL
VIEW:• Customer Demand Forecast• Energy Efficiency & Conservation
Contributions• Generation Planning
Assumptions
PART 2 OF 2 –FINANCIAL & OTHER KEY
INFORMATION:• Bill Impact Estimates• Metrics• Financial Assumptions• Workforce Transitions• Risk Overview
Our team is looking forward to conversations about all of this information.
Focus Area for Generation Planning

-
500,000
1,000,000
1,500,000
2,000,000
2,500,000
3,000,000
3,500,000
4,000,000
2010 2015 2020 2025 2030 2035 2040 2045
Popula
tion o
f San
Anto
nio
-M
etr
opolita
n
Sta
tistical Are
a
Calendar Year
PROJECTED POPULATION GROWTH
22
In spite of the pandemic, projections have the area gaining approximately 1 million residents over the next 20 to 30 years.
Notes: Data source is IHS Markit. San Antonio Metropolitan Statistical Area is made up of 8 counties: Atascosa, Bandera, Bexar, Comal, Guadalupe, Kendall, Medina, & Wilson

Customer usage growth:
• Driven by population growth
• Offset by energy efficiency & conservation (FlexSTEPSM)
• Results in annual growth projection of approximately 1.5% in peak usage needs over the next 5 years
23
PROJECTED CUSTOMER GROWTHKEY DRIVERS – FY2022 BUDGET

• FlexSTEPSM
• Placeholder Assumption similar to current STEP Bridge levels
• Placeholder Usage reductions included in usage forecast
• Customer solar adoption is projected to continue
• Energy Information Administration (EIA) information • Captures projected household lighting and appliance energy levels
24
ENERGY EFFICIENCY & CONSERVATION
Customer usage growth offset by energy efficiency & conservation (FlexSTEPSM).

25
STEP/FLEXSTEP FORECASTFY2022 BUDGET
*
-
200
400
600
800
1,000
1,200
1,400
1,600
1,800
2,000
(100)
-
100
200
300
400
500
FY22 FY24 FY26 FY28 FY30 FY32 FY34 FY36 FY38 FY40 FY42 FY44 FY46 FY48 FY50
Cu
mu
lati
ve S
TEP
MW
An
nu
al S
TEP
MW
Annual MW Savings(Left Axis)
Annual MW Decay(Left Axis)
Cumulative STEP MW(Right Axis)
Forecast assumes STEP expenditures of $70M per year over the forecast horizon.Decay represents MWs discounted due to previously adopted savings measures reaching the end of their useful life.
26
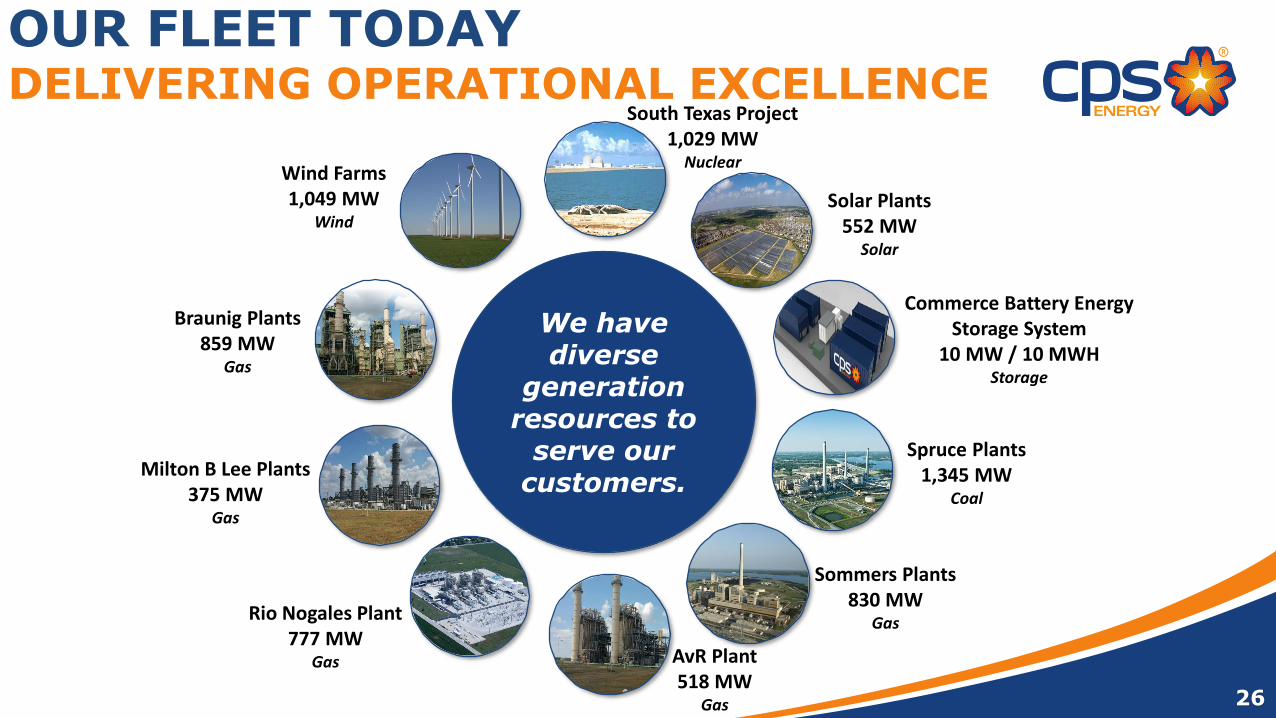
OUR FLEET TODAYDELIVERING OPERATIONAL EXCELLENCE
AvR Plant518 MW
Gas
Spruce Plants1,345 MW
Coal
Sommers Plants830 MW
Gas
Braunig Plants859 MW
Gas
Milton B Lee Plants375 MW
Gas
Rio Nogales Plant777 MW
Gas
We have diverse
generation resources to
serve our customers.
South Texas Project1,029 MW
NuclearWind Farms 1,049 MW
WindSolar Plants
552 MWSolar
Commerce Battery Energy Storage System
10 MW / 10 MWHStorage

27
OUR RENEWABLE PORTFOLIOOver 20% of our capacity is from renewable resources
Diversifying with renewables is beneficial, but comes with the challenges of:
• Intermittency• Congestion• Forecasting
28
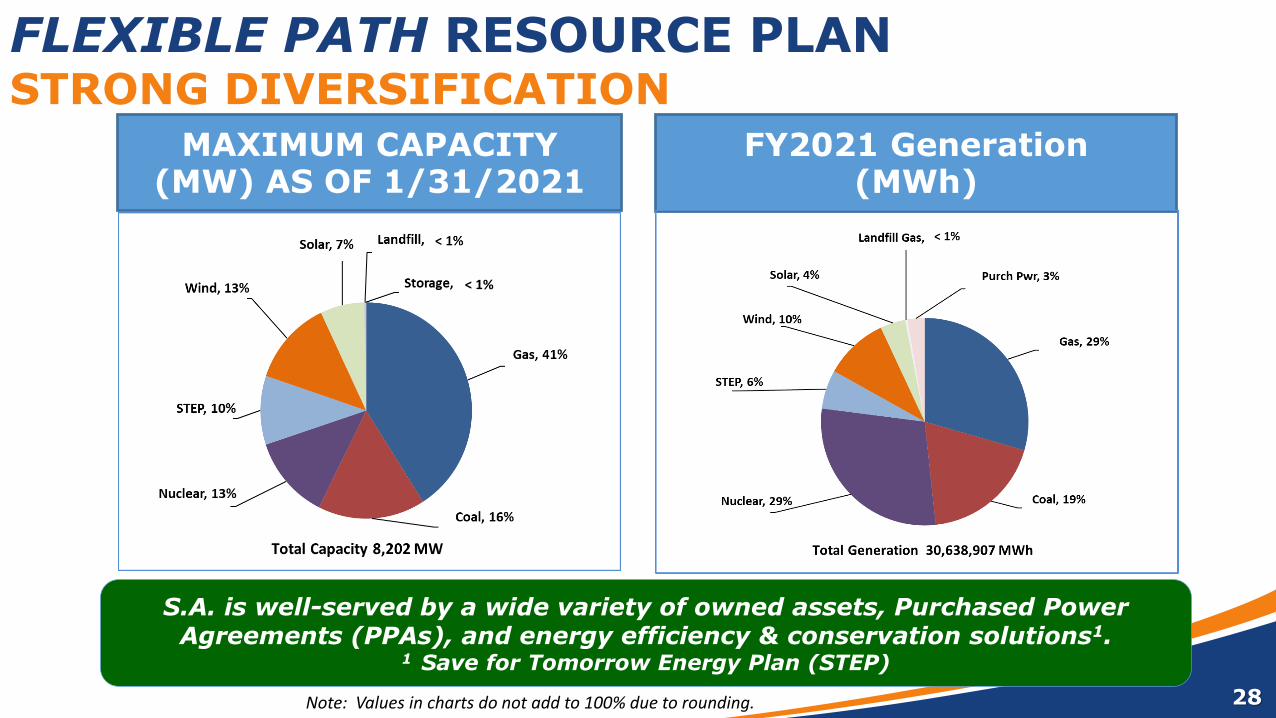
FLEXIBLE PATH RESOURCE PLANSTRONG DIVERSIFICATION
S.A. is well-served by a wide variety of owned assets, Purchased Power Agreements (PPAs), and energy efficiency & conservation solutions1.
1 Save for Tomorrow Energy Plan (STEP)
FY2021 Generation(MWh)
Note: Values in charts do not add to 100% due to rounding.
MAXIMUM CAPACITY (MW) AS OF 1/31/2021
< 1%

GENERATION RESOURCES
29
Start of Day End of Day
Total Resources
In general, four different types of resources are utilized:
• Peaking Generation: To minimize capacity shortages and costs over short periods of time
• Intermediate Generation: To balance the resource needs of the system between peak and baseload on a daily basis.
• Renewable Generation: To minimize emissions & energy costs over long periods of time
• Baseload Generation: To minimize fuel & energy costs over long periods of time
Baseload Generation
Intermediate Generation
PeakingGeneration
Solar Generation
Wind Generation
Expected Load

30
RESERVE MARGIN - BACKGROUND
• Reserve margin is the extra capacity needed to meet customer demand if power plants generate less than expected, or customer demand increases more than expected
• Reserve margin is a metric used in long-range planning to quantify a reliable system
• Reserve margin methodology is being reviewed due to:
o Loss of conventional coal & gas resources
o Substantial renewable additions (i.e. output is not “controllable”)
o Potential for failures, such as a system-wide lack of natural gas
o Extreme weather risk
• As a member of an industry coalition, we will study & implement capacity planning improvements to make electric service more resilient
Maintaining Resiliency, Reliability, & Customer Affordability is essential as we update our peak planning process.

31
RESERVE MARGIN – FY2022 BUDGET
Retail Demand:• Retail demand is “after
demand response”• +5.5% Retail T&D losses• Summer Avg. Peak• Temperature is ~102 deg. F
Reserve Margin (RM):• Minimum 13.75% adder to retail
demand• 13.75% is same as ERCOT target• RM risk factors: Forced outages,
weather, and wind generation
RM Target= (Demand + RM)
Resources
Long Term Generation Planning Resources:• Summer net capacity
for conventional gen.: ▪ Nuclear, Coal, Gas,
& Storage: 100%• Renewables at Summer
Peak Hour Ending 1900:▪ Coastal Wind: 63%▪ West Wind: 16%▪ Solar: 50%
* * Potential wholesaleopportunity
RetailDemand
RM

32
TENTATIVE PLANT RETIREMENT TIMELINE
Braunig1-3
2020 2025 2030 2040 2050
Sommers1
Sommers2
Spruce1
Lee1 - 4
Lee5 - 8
& Von Rosenberg
Rio Nogales
STP1 & 2
Spruce 2 (Illustrative)
- Retirement Timing is Driven by End of Design Life
FY2022 BUDGET

TECHNOLOGY RESEARCHCompressed AirEnergy Storage
GeothermalAdvanced
Combined Cycle
SolarBatteryStorageWind
Liquid AirEnergy Storage Hydrogen
UndergroundPumped Hydro
H2O
Reciprocating Internal Combustion Engine
Flow Battery
Small Modular Reactor
©NuScale Power, LLC
We monitor the technology landscape assessing cost, performance, & commercial availability. 33
EPRI/gti Low-CarbonResources Initiative

34
STORAGE TECHNOLOGY READINESSMEETING THE CHALLENGE OF LONG DURATION STORAGE
Source: Black & Veatch & CPS Energy analysis of industry & RFI information
Widely
Commercially
Available
Limited
Commercial
Operation
Early Stage
Power Quality Grid SupportBulk Power
Management
1 Hour 4 Hour 10 Hour Days
Tech
no
log
y R
ead
iness
Storage Duration
Lithium ionBattery
(Typically upto 50 MW)
Flow Battery(Small to
Utility Scale)Underground
Pumped Hydro(1 MW to Utility Scale)
Liquid Air(Utility Scale)
Compressed Air(Utility Scale)
Hydrogen (Utility Scale) H2H2
Current position from
a Technology
Readiness &
Storage Duration
perspective
Natural Gas
Air
H2O

35
NEW RESOURCE OPTIONSFY2022 BUDGET
Intermediate – 1 x 1 Combined Cycle• H Class CT, 1 X 1• 616 MW net (including duct firing)• 100% natural gas• DLN Combustor, SCR• Inlet evaporative cooler
Peaking:• Reciprocating internal combustion
engine• 18.3 MW per unit• 202 MW plant (11 x 18.3 MW)• 100% natural gas• 5 minutes to full load• SCR
STP1• STP1 HP Turbine Uprate• On line April 2020• 5.3 MW winter capacity improvement
(40% share)
Advanced Gas Path (AGP) Upgrade:• Replacement of each hot gas path
section of each CT at AVR & RNG• Approximately 24 MW improvement
in capacity to AVR• Approximately 1.5% heat rate
improvement to AVR• Approximately 71 MW improvement
in capacity to RNG• Approximately 2% heat rate
improvement to RNG
NGCC Extension:• 11 years added to AVR and Rio
Nogales combined cycle plants• All performance characteristics are
unchanged
Renewables – Contribution to Peak• Coastal Wind – 53%• Other Wind – 16%• Solar – 50%
NGCC Extension:• 11 years added to AVR and Rio
Nogales combined cycle plants• All performance characteristics are
unchanged
Battery Energy Storage System:
• 100 MW, 4-hour duration• 400 MWh energy• Lithium-ion technology
FlexPOWER BundleSM
• 900 MW Solar PV• 50 MW, 4-hour duration BESS• 500 MW Firming
New technologies & innovative approaches proposed to replace units & meet customer usage growth.

36
The FlexPOWER Bundle is the next step in our Flexible Path strategy to replace our aging Braunig gas plants.
FLEXPOWER BUNDLESM
SUPPLEMENTING AGING GAS PLANTS
Braunig 1, 2 & 3 Gas Power Plants Built in 1966, 1968, 1970
859MW
An integrated FlexPOWER Bundle aimed at transitioning to a cleaner generation mix

37
PRICE FORECASTSGAS, COAL, & CO2
0.0
1.0
2.0
3.0
4.0
5.0
6.0
Gas
Pri
ce (
$/m
mB
TU)
CY
Gas Price Forecast (nominal $/mmBTU)
Main Fleet Dispatch Price ($/mmBtu)
0.0
1.0
2.0
3.0
4.0
5.0
6.0
Co
al P
rice
($
/mm
BTU
)
CY
Coal Price Forecast (nominal $/mmBTU)
Coal PRB Price ($/mmBtu)
0
10
20
30
40
50
CO
2 P
rice
($
/Sh
ort
to
n)
CY
CO2 Price Forecast (nominal$/short ton)
CO2 (nominal 2020$ per short ton)

38
ENERGY STORAGE CAPITAL COSTFORECAST
39
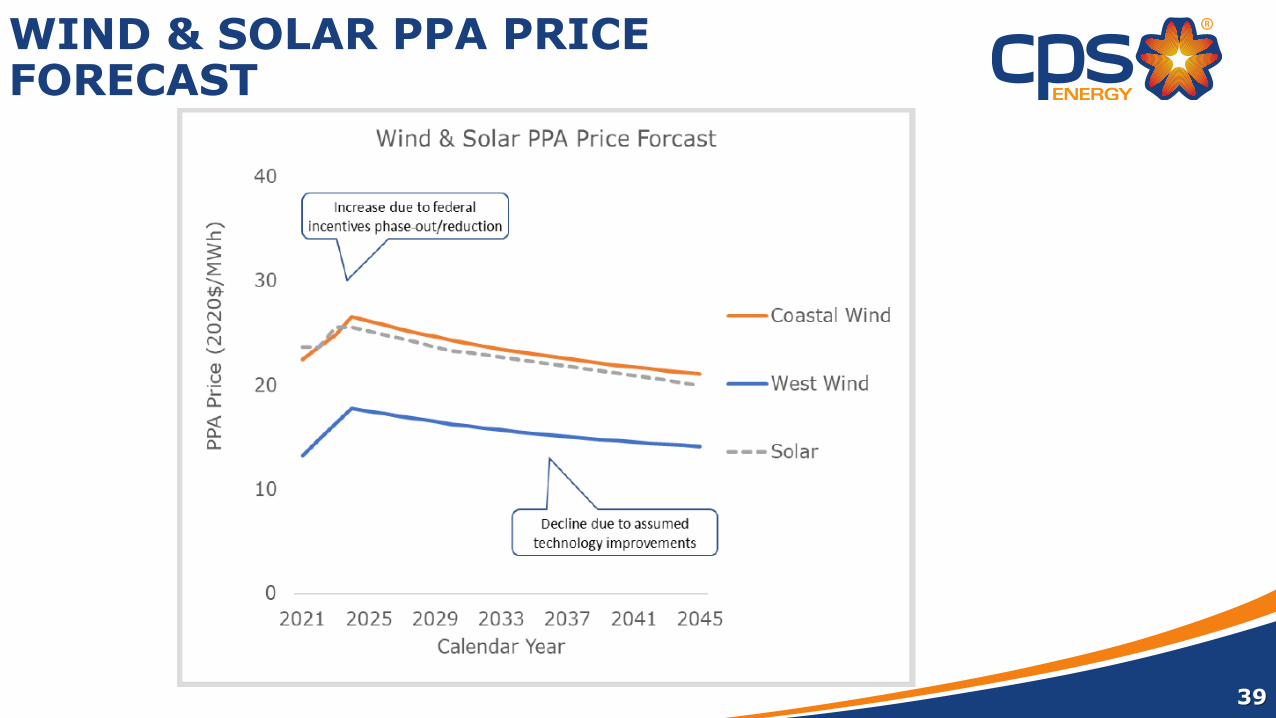
WIND & SOLAR PPA PRICEFORECAST

ENERGY CAPACITYWE MUST CAREFULLY COVER S.A.’S NEEDS
Our approach is to add new
innovative technologies
to replace older units,
while reliablymeeting our customers’
energy needs.
40

41
JANUARY 2021
FLEXIBLE PATH RESOURCE PLAN
SPRUCE ALTERNATIVES
VINTAGE: FY2022 BUDGET

42
FLEXIBLE PATH RESOURCE PLANSPRUCE ALTERNATIVES
Note: The Board has taken no official action at this time to close the coal units. Scenarios involving the Spruce units have been developed for community discussion purposes.
• Spruce Alternatives Cases:
o Applicable assumptions are developed for 25-years
o Spruce Alternative Cases are assessed by comparing to the FY2022 Budget Case (Baseline)
o FY2022 Budget Case (Baseline) is the assumptions set for January 2021 Flexible Path Resource Plan

43
The Braunig & Sommers units are reaching their end of design life.We must thoughtfully sequence the order of plant changes to
maintain Reliability & Customer Affordability.
FOCUS ON AGING GAS & COAL PLANTSOVER 3,000 MW OF GENERATION CAPACITY
Braunig 1, 2 & 3 Gas Plant Built in 1966, 1968, 1970
859 MW
Spruce 1 & 2 Coal Plant Built in 1992 & 2010
1345 MW
Sommers 1 & 2 Gas Plant Built in 1972 & 1974
830 MW

• Both Spruce units are Reliable resources
• 19% of our total generation in FY2021
The community has made a significant investment in constructing the Spruce plant, including extensive environmental controls.
Unit Capacity Year On Line Age Environmental Controls
Spruce 1 560 MW 1992 28 Scrubber, Baghouse, Mercury Control, Ash Recycled
Spruce 2 785 MW 2010 10 Scrubber, Baghouse, Mercury Control, SCR*, Ash Recycled
Est. Net Book Value @1/31/21 $1.255B
Designed/Original Service Life:Possible Accelerated Service Life:
55 years40 years
Remaining Debt Service:
Principal $1.148B
Interest .638B
$1.786B
* SCR is a Selective Catalytic Reduction system that reduces nitrogen oxides
The Spruce Investment represents ~11% of San Antonio’s assets.
POTENTIAL STRANDED COST OUR COMMUNITY’S INVESTMENT IN SPRUCE
44

2022 2023 2024 2025 2026 2027 2028
45
COAL ENVIRONMENTAL COMPLIANCESIGNIFICANT INVESTMENTS EXPECTED
Assumed implementation date for CO2 Tax
Investments beyond the on-going annual capital / O&M spend are expected for continued environmentally compliant coal operations.
Calendar Year
• Provide EPA Notice of Intent to discontinue coal operations (12/31/2028 shut down)
• Required to continue coal operation beyond 12/31/2025 without SO2 Scrubber Water Project
Coal Ash Regulation
$32 million dollar investment to preserve unit operations. Cash
flow started in 2018.
Spruce 1 NOxRegulation
$150 million dollar investment
$58 million dollar investment.
SO2 Scrubber Water Regulation

Spruce 1 (560 MW)
Spruce 2
(785 MW)
2010 2020 2030 2040
Braunig 2 (230 MW)
Braunig 1 (217 MW)
Sommers 2 (410 MW)
Sommers 1 (420 MW)
Braunig 3 (412 MW)
1960 1970 1980 1990 2000
Today
Coal
Gas
Flexible Life
Span
GasConver-tion
46
New technologies & lower emission resources are being considered in potential transition of aging gas units & coal.
POTENTIAL APPROACHTIMING TO REPLACE AGING GAS UNITS& MOVE BEYOND COAL

47
FLEXIBLE PATH RESOURCE PLANSPRUCE ALTERNATIVES KEY OBSERVATIONS
BASELINE CASE:• Spruce 1 – Replace with an
Additional FlexPOWER
BundleSM offering in 2029
• Spruce 2 – Continue to
Operate as a Coal Plant
REPLACE SPRUCE 1 & 2 COAL UNITS:• With Renewables &
Batteries
REPLACE & CONVERT:• Spruce 1 – Replace with an
Additional FlexPOWER
BundleSM
• Spruce 2 – Convert to
Natural Gas
• Complies with $58M coal effluent limitation guideline (ELG) upgrade
• Avoids ELG $58M investment• Avoids $35M for Spruce 2 gas
conversion
• Avoids ELG $58M investment• $35M for Spruce 2 gas conversion
• Low number of exposure hours to ERCOT market interactions (i.e. high prices)
• Increased exposure hours to ERCOT market interactions (i.e. high prices)
• Low number of exposure hours to ERCOT market interactions (i.e. high prices)
• Baseline emissions results• Emissions reduced as compared
to Baseline Case• Emissions reduced as compared
to Baseline Case
• Baseline bill impact results
• Accelerated depreciation (stranded costs for early retirement of the coal assets) of $1.26B is included in the bill impact results.
• Accelerated depreciation (stranded costs for early retirement of the coal assets) of $450M (out of $1.26B) is included in the bill impact results.

48
FUTURE COMMUNITY DECISIONS: These are rough estimates that give good context &
will help constructive community discussions.
AFFORDABILITY - BILLSTHERE IS A COST TO EVERY PROGRAM
Does not include any amount for maintaining operations or growth in S.A. & our region.
$2.00
$5.00
$7.00
$12.00
$0.00
$2.00
$4.00
$6.00
$8.00
$10.00
$12.00
$14.00
FlexiblePath - Low
FlexiblePath - High
IncrementalSTEP
CloseSpruce 1 & 2
PRELIMINARY ESTIMATED
BILL IMPACTS

• We must meet our community’s projected increase in peak usage
• We must prioritize plants that are approaching the end of their design life
• Community discussions are continuing about potential options for our two coal units
• Sequencing is critical
• Velocity matters
49
GENERATION PLANNINGKEY TAKEAWAYS
Maintaining Reliability & Customer Affordability is essential as we transition our generation fleet.

Thank You