rates of acetic acid formation from …digitool.library.mcgill.ca/thesisfile111537.pdfrates of...
TRANSCRIPT
RATES OF ACETIC ACID FORMATION FROM ETHANOL BY
ACETOBACTER SUBOXYDANS
A THESIS
BY
LACEY WALIŒ
Submitted to the Faeulty of Graduate Studies and
Researeh, MeGill University, in partial fulfillment
of the requirements for the degree of:
MASTER OF SCIENCE
IN
AGRICULTURAL BACTERIOLOGY
Department of Agricultural Baeteriology Macdonald College of MeGill University, Canada.
August, 1958.

i
ACKNOWLEDGEMENTS
The autbor wishes to make the following acknowledgements:
To bis Director of Researcb, Dr. A. c. Blackwood, Professer ot Bacteriology and Chairman of the Department ot Bacteriology, Macdonald Collage, for advice given during the course of this investigation and for guidance in the preparation of the manuscript.
To Dr. w. F. Oliver, Associate Professer of Agricultural Physics, Macdonald College, for assistance in building the d.c. rectifier used with the constant-volume dispensing apparatus.
To the National Research Council, Ottawa, for the award of a National Research Scholarship whicb defrayed the expenses involved in this investigation.
I
II
III
TABLE OF CONTENTS
ACKNOWLEDGEMENTS • • • • • • • • • • • • • • • • • • • • • • • • • • • • • •
INTRODUCTION ••••••••••••••••••••••••••••••••••
LITERATURE REVIEW •••••••••••••••••••••••••••••
Vinegar Production •••••••••••••••••••••••••• Mechanism of Acetic Acid Formation •••••••••• Methods of Production •••••••••••••••••••••••
The Orleans or French Method •••••••••••••• The Quick Vinegar Process ••••••.•••••••••• The Frings Generator and Similar Methods •• Submerged Fermentation ••••••••••••••••••••
Sorne Factors Affecting Vinegar Production ••• Basal Medium ••.•......•..•••..•.•••••••••• Ethanol Concentration ••••••••••••••••••••• I>l1 •••••••••••••••••••••••••••••••••••••••• Temperature •••••••••••••••••••••••••••••••
The Genus Acetobacter ••••••••••••••••••••••• Classification •••••••••••••••••••••••••••• The Organism- Acetobacter suboxydans •••••
Carbohydrate and Nitrogen Nutrition ••••• Growth Factors •••••••••••••••••••••••••• Mineral Nutrition •••••••••••••••••••••••
MATERIALS AND METHODS •••••••••••••••••••••••••
ii
1
1
3
~ ~ 9
10 11 12 12 13 14 15 16 16 20 21 22 23 24
Organism • • . • . • • . • • . . • • • • • • . • . • . • . • • • . • • . • . • • 24 Inocultl.Dl • • • • • • • • • . • • • • • • • • . • • • • • • • • • . • . . • . • • 24
Batch Fermentation •••••••••••••••••••••••• 24 Continuous Fermentation................... 24
Media • • • • • • • • • • • • • • • • • • • • • • • • • • • • • • • • • • • • • • • 25 Batch Fermentation •••••••••••••••••••••••• 25 Continuous Fermentation ••••••••••••••••••• 26
Growth Conditions ••••••••••••••••••••••••••• 27 Batch Fermentation........................ 27 Continuous Bubmerged Fermentation......... 28
iii
~alytical Techniques •••••••.••••••••••••••• 32 Determination of Acetate •••••••••••••••••• 32
1
Determination of Ethanol •••••••••••••••••• 33 Determination of pH....................... 3
365
Determination of Turbidity ••••••••••••••••
IV RESULTS • • • • • • • • • • • • • • • • • • • • • • • • • • • • • • • • • • • • • • • 37
Batch Fermentation •••••••••••••••••••••••••• 37 Effect of Ethanol Concentration ••••••••••• 37 Effect of Tryptone Concentration •••••••••• 41
Continuous Fermentation..................... 44 Effect of pH.............................. 44 Effect of Initial Ethanol Concentration ••• 51 Effect of the Concentration of Corn Steep
Liquor ••••• 54 Effect of Addition of Large Volumes of
Fresh Medium •• 57
v DISCUSSION • • • • • • • • • • • • • • • • • • • • • • • • • • • • • • • • • • • • 61
VI SU'J14I'w1ARY • • • • • • • • • • • • • • • • • • • • • • • • • • • • • • • • • • • • • • • 68
VII REFERENCES • • • • • • • • • • • • • • • • • • • • • • • • • • • • • . • . • • • • 69
VIII APPENDIX TABLES ••••••••••••••••••••••••••••••• 74

I
INTRODUCTION
Vinegar is the condiment made from sugary or enzyma
tically hydrolysed starchy materials by an alcoholic fermen
tation followed by oxidation to acetic acid. It is used in
the home as a condiment and in the commercial manufacture or
mayonnaise, french dressing, pickles, relishes, catsup,
prepared mustards and horse radish; it is also used as a
fungistatic and antiseptic agent and in the photographie and
the plastic industries.
The Acetobacter ~· commonly referred to as the
acetic acid bacteria, have been used, knowingly or not, from
ancient times, to produce vinegar. During that period, vine
gar production was mostly an art, but the studies of Kutzing
and Pasteur on the fermentation created an upsurge of
scientific thought with the result that the art of vinegar
production gradually became scientific in nature.
Classification or the group of organisms producing
acetic acid into genus and species, though far from settled,
allowed rapid progress to be made, until today, there are a
few species which are well known for their ability to oxidize
ethanol to acetic acid. Among this group of organisms is
Acetobacter suboxYdans, the organism used in this study.
Bacteriologists who first worked with the genus
2
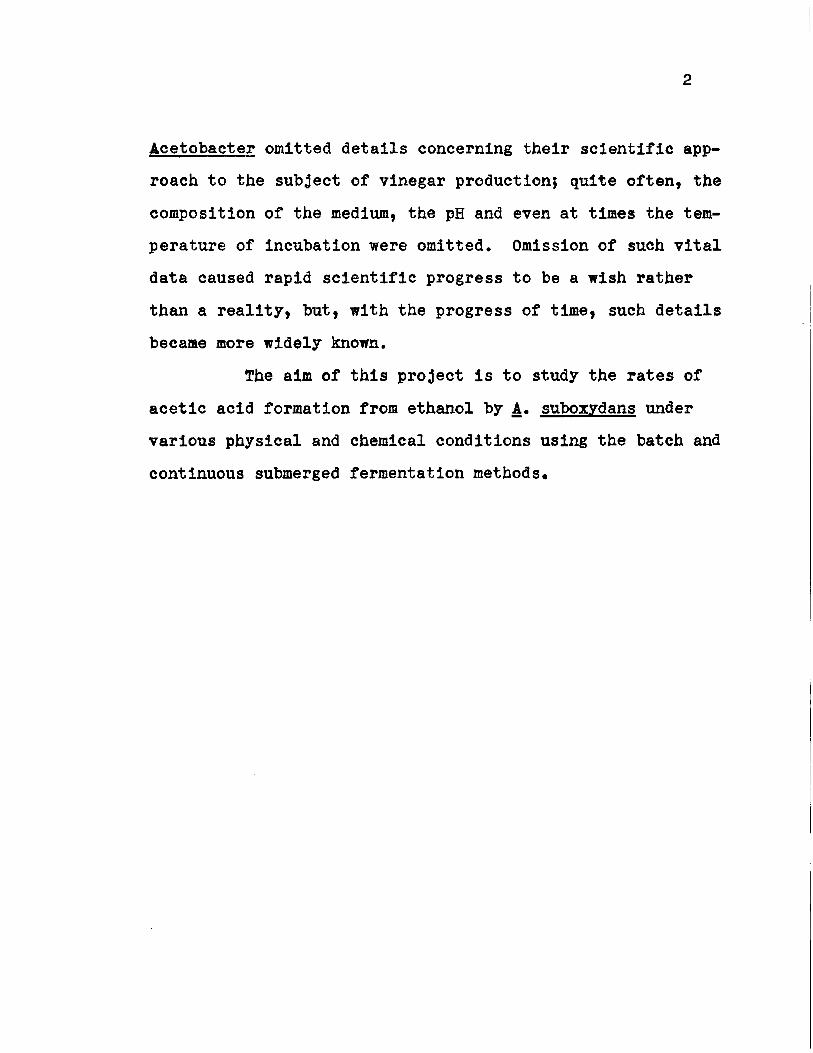
Acetobacter omitted details concerning their scientific app
roaeh to the subject of vinegar production; quite often, the
composition of the medium, the pH and even at times the tem
perature of incubation were omitted. Omission of such vital
data caused rapid scientific progress to be a wish rather
than a reality, but, with the progress of time, such details
became more widely known.
Tbe aim of this project is to study the rates of
acetic acid formation from ethanol by A· suboxydans under
varions physical and chemical conditions using the bateh and
continuons submerged fermentation methods.
3
II
LITERATURE REVIEW
Vinegar Production
Ordinary vinegar is dilute acetic acid obtained from
the oxidation of alcoholic liquids, and it was probably in this
form that it was known from the earliest times. Vinegar was
mentioned in three books of the Old Testament and Hippocrates
is reported to have prescribed it as a medicine for his pa
tients. Livy, the Latin prose writer, reported in his book
No. ~ that Hannibal overcame the difficulty offered to the
passage of his army in crossing the rocks or the Alps by dis
solving the rocks with vinegar so that a pathway could be made.
Thus, vinegar was known for a long time. In ancient literature,
however, there seemed to be a lack of knowledge concerning
vinegar production and, as a consequence, we are indebted to
the much abused alchemists of more recent times for the first
knowledge concerning the purification and concentration of the
acid by distillation.
Gerber, Stahl, Loewitz, Durande, Vanquelin and
Thenard (Brannt 1900) provided information concerning the
purification and concentration of vinegar. In 1814, Berzelius
(Brannt 1900) determined the exact chemical composition of
acetic acid while Dobereiner (Brannt 1900) studied the nature
4
,of the acid and proved that alcohol was oxidized at the
expense of atmospheric oxygen to acetic acid and water.
Dobereiner (Brannt 1900) also proved that no carbonic acid
was formed as a result of the oxidation. Schutzenbach in 1823
(Brannt 1900), approximately one year after Dobereiner's dis
covery, introduced a quick vinegar process.
Although sorne chemical knowledge was known about the
production of vinegar up to that time, nothing was known about
its microbiological origin. In 1822, however, Persoon (Smyth
and Obold 1930) observed that whenever any alcoholic liquid was
exposed to air, a tough membrane formed on the surface. He
called this skin Mycoderma, currently called "the mother of
vinegar". Kutzing (Smyth and Obold 1930) proved that this
Mycoderma consisted of bacteria and he classified these
bacteria as algae and named them Ulvina aceti. Liebig (Smyth
and Obold 1930), a German chemist, stated that the process, as
described by Kutzing, was devoid of life. Pasteur, in 1864
showed that the process was a physiological one, and that it
was due to the presence of a minute organism which he named
Mycoderma aceti. This discovery confirmed Kutzing's findings,
and so the foundation for the sci.entific study of vinegar pro
duction was laid. Hansen (1935) demonstrated that two species
of bacteria might be associated with the process and he named
these, Mycoderma aceti and Mycoderma pasteurianum.

Acetic acid is formed by more than one species of
Acetobacter and workers such as Henneberg and Beijerinck
(Smyth and Obold 1930) have described other species. Since
that time, a number of pellicle and non-pellicle forming
acetifying organisms were reported and over twenty five species
are now known. These organisms are classified under the genus
Acetobacter in Bergey•s Manual of Determinative Bacteriology
(Breed et al 1957).
As defined from the French vinaigre, the word vine
gar means sour or sharp wine. Species of Acetobacter vary in
their ability to oxidize or dehydrogenate substrates; some
organisms such as A· xYlinum and A· aceti can overoxidize the
acetic acid to carbon dioxide and water; others such as A· suboxydans effect incomplete oxidation of a substrate such as
ethanol thereby forming acetic acid.
The Food and Drugs Act in Canada requires that the
vinegar must contain not less than 4.1% nor more than 12.3%
acet1c ac1d.
Mechanism of Acetic Acid Formation
It was known for a long time that platinum black
oxidized alcohol to a chemical end product. Davy (Brannt
1900) synthesized acetate by using platinum black and wine.
Dobereiner (Brannt 1900) proved that atmospheric oxygen was
involved in the oxidation of alcohol while Liebig (Smyth and

6
Obold 1930) studied an intermediate compound during such an
oxidation and named it aldehyde; Royer (Prescott and Dunn 1949)
established acetaldehyde as an intermediate product of the
reaction.
A number of intermediary pathways were described to
explain the mechanics of oxidation of alcohol to acetic acid.
Neuberg and Windisch (Prescott and Dunn 1949) proposed that
ethanol is aerobically converted to acetaldehyde which isthen
dismutated, according to the reactions listed below, to equi
molar quantities of ethanol and acetic acid •
1,1 CH3. C=O + HOH
.... H ~ 2CH3• C=O
Acetaldehyde
,OH ---;. CH3• C-H
'oH
+
Acetaldehyde Hydrated acetaldehyde
PH H PH CH3• Cb~ + CH3• C=O ~ CH
3• C=O +
Hydrated aldehyde Acetaldehyde Acetic acid
2HOH
H CH • è-OH
3 li Ethanol
All of the ethanol is converted to acetic acid by
alternate oxidation and dismutation.
Another proposed mechanism for the oxidation of
ethanol to acetic acid by these organisms, is that the bacteria
dehydrogenate ethanol to acetaldehyde and this aldehyde, which
is then hydrated, is dehydrogenated to form acetic acid with
molecular oxygen acting as the hydrogen acceptor.

7
.The following equations show the postulated reactions.
(Underkofler and Hickey 19,4).
lj CH3• ~-OH + . ~0" Alcohol dehYdrogenase) . CH
3• ~:0 + ·2H +2e
Acetaldehyde Ethanol
CH3• ~=0 + HOH
Acetaldehyde
,OH CH 3 • C,- H + no "
OH Hydrated aldehyde
OH CH3• é- H
OH Hydrated aldehyde
,&lde!llde de!lydrogenase• cu3
• 8-0H•2H • 2e
Acetic acid
Cytochrome system 2 HOH
Products other than acetic acid are formed during the
incomplete oxidation; these products, among others, include
aldehydes, esters, acetoin, glycerol and lactic, malic and
tartaric acids. In very acid media or with concentrated sus
pensions, acetaldehyde may accumulate because aldehyde de
hydrogenase functions best at an alkaline pH.
Methods of Production
Vinegar can be made from those products, which, when
fermented by yeast, can yield alcohol. Raw materials such as
apples, grapes, peaches, plums, figs and oranges, most enzy
matically hydrolysed starchy substances, beer and wine can be
used. In the United States of America, wine, apple juice and
eider are used; in France, Italy, Spain and Greece, wine is

8
used, while in England malt and even honey are used as natural
substances.
The quality of the vinegar manufactured is dependent
on the quality of the raw material being used. Obviously,
materials such as fruits should be clean and at the correct
stage of maturity, while with wine or ether alcoholic media,
no preservatives should be present. The quality of the vinegar
will be increased if the usual plant sanitation precautions
are observed. The actual acetifying process should be pre
ceded by an alcoholic fermentation irrespective of the nature
of the raw materials used. Adjustment of the concentration
after alcoholic fermentation may be necessary to ensure that
a proper fermentation occurs.
The Orleans or French Method.
This method is the oldest, and, according to Prescott
and Dunn (1949), it is the best method for the production of
table vinegar. The containers used are barrels of about 200 L
capacity; each barrel is filled about one-third with vinegar
acting as a starter, and at the same time, about ten to fifteen
litres of wine are added. The same volume of wine is added to
the barrel at weekly intervals for four weeks, and after the
fifth week, about ten to fifteen litres of vinegar are with
drawn and the same volume of wine is added to the barrel. Air
is admitted to the barrels through screened holes, one at
éach end of the barrel, above the vinegar level, and the

9
Acetobacter form a zoogleal mat which contains a large n~
ber of bacteria; the mat if it is not supported, will sink and
the organisms will fail to produce acetic acid; this method
is a "slow process" that involves much attention. The oxygen
supply is a limiting factor in the rate of fermentation when
this process is used.
The Quick Vinegar Process
This method, also termed the "German Process",
originated with the discovery by Boerhaave (Prescott and Dunn
1949) that if wine was allowed to trickle through a tall re
ceptacle containing loosely packed pomace, vinegar could be
produced. Schutzenbach in 1823 (Prescott and Dunn 1949) modi
fied the Boerhaave method by using other types of porous mater
ials to expose the organisms to the air as much as was possible.
The generator is designed so that the maximum surface exposure
for a definite volume of vinegar is obtained; this ensures an
adequate surface area on which the air can act. The oxidation
of the alcohol is started by the droplet dispersion of the
vinegar stock which is allowed to come into contact with beach
wood shavings on the shelves of the generator; this vinegar
stock is trickled through the beechwood packing and the ethanol
is oxidized by the Acetobacter to acetic acid at a rate faster
than in the Orleans process; air is allowed to enter the gene
rator through the vents in the bottom shelf of the generator and
the temperature is regulated by the rate of flow of the vinegar
10
through the generator.
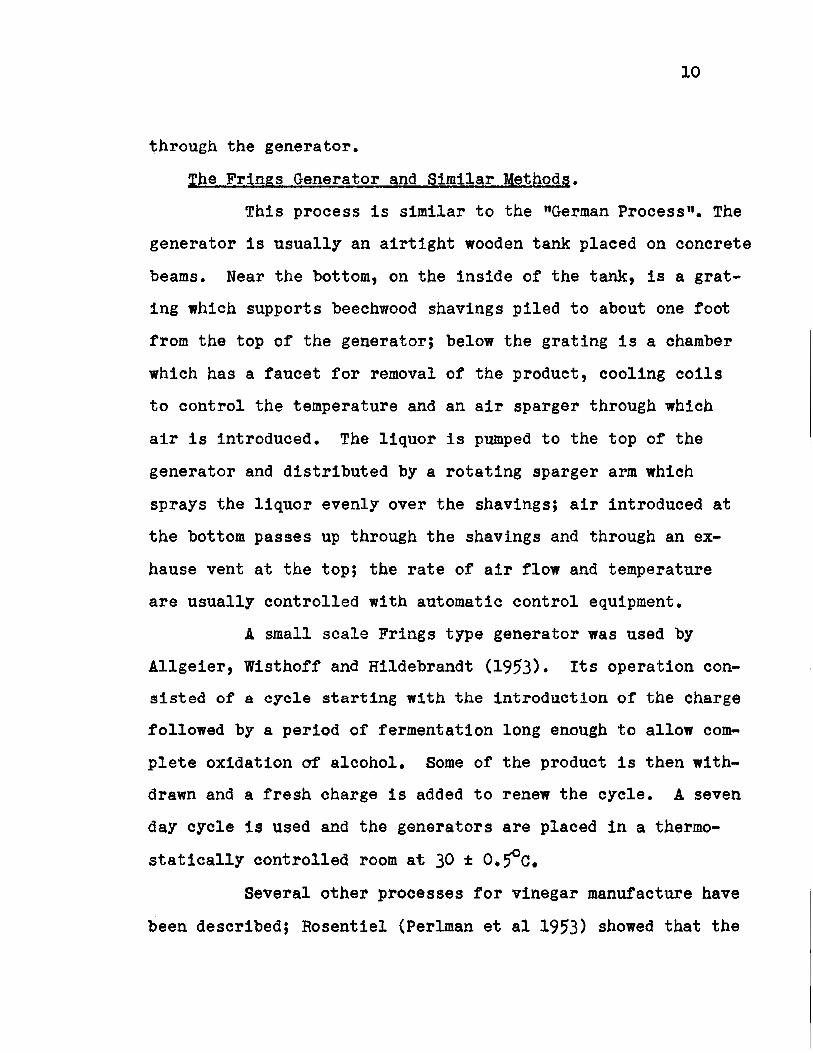
The Frings Generator and Similar Methods.
This process is similar to the "German Process". The
generator is usually an airtight wooden tank plaeed on concrete
beams. Near the bottom, on the inside of the tank, is a grat
ing which supports beechwood shavings piled to about one foot
from the top of the generator; below the grating is a ohamber
which has a fattcet for removal of the product, cooling coils
to control the temperature and an air sparger through whicb
air is introduced. The liquor is pumped to the top of the
generator and distributed by a rotating sparger arm which
sprays the liquor evenly over the shavings; air introduced at
the bottom passes up through the shavings and througb an ex
hause vent at the top; the rate of air flow and temperature
are usually controlled with automatic control equipment.
A small scale Frings type generator was used by
Allgeier, Wisthoff and Hildebrandt (1953). Its operation con
sisted of a cycle starting with the introduction of the charge
followed by a period of fermentation long enough to allow com
plete oxidation of alcohol. Some of the product is then with
drawn and a fresh charge is added to renew the cycle. A seven
day cycle is used and the generators are placed in a thermo
statically controlled room at 30 ± 0.5°c.
Several otber processes for vinegar manufacture bave
been described; Rosentiel (Perlman et al 1953) sbowed that the

11
Luxembourg or Michaelis methods using rotating drums appear
to be less efficient than the modified Frings generator
process.
Submerged Fermentation.
Oxidation of alcohol to acetic acid by submerged
fermentation has received attention in recent years.
Hromatka and Ebner (1950) compared rates in a generator ox
idation with submerged culture oxidation and found the oxygen
consumption of the former was a linear function of time, while
the latter was an exponential function of the time. In the
submerged fermentation they found that the acid formation was
thirty-two times as fast as in the generator process for the
oxidation of the same amount of alcohol. The Acetobacter
culture used in the submerged process had a Q02 of 7750 milli
litres of oxygen per gram dry weight of cells per hour.
Again, Hromatka and Ebner (1954) have described, in part, a
submerged process, which gave 0.5% increase in acid formation
per hour which is at least ten times as fast as the original
Frings generator. The workers also stated that about twenty
times the amount of acid could be produced compared with the
Frings generator if the space in the apparatus was completely
used for the submerged process.
Maxon (1955) reviewed the method of continuous fer
mentation for different processes but no r ef erence was made
about the method being used for the production of acetic acid,

12
except the paper by Vaughn. (Underkofler and Hickey 1954)
One of the disadvantages of the continuons method, however,
is that contamination is a real hazard, but this presents
no real problem in the vinegar fermentation. There can be
no doubt that, with the advance of the technology of con
tinuons submerged fermentation, manufacturers will inevitably
turn to this type of operation for production of desired
products such as acetic acid.
§orne Factors Affecting Vinegar Production
The production of acetic acid from ethanol by
Acetobacter~ is affected by several factors, e.g., selec
tion of the micro-organisms, nature of the raw materiels,
initial concentration of ethanol, pH, oxygen supply, tempera
ture and nutrients. It should be emphasized that the basic
requirement for efficient oxidation of alcohol to acetic acid
is an adequate supply of air.
Basal Medium.
Shimwell (1948) stated that in the manufacture of
spirit vinegar, industrial alcohol is diluted to the desired
concentration and nutrients are added to supply the nitrogen
requirements of the organisms. Corn steep liquor is used
mostly for its nitrogen content. Rao and Stokes (1953) showed
that A· suboxYdans and A· melanogenum cannot grow in chemi
cally defined media with ethanol as the sole carbon and energy

13
source but that growth occurred when yeast autolysate or
other complex biological material was present. Evidence is
also presented to show that the growth-promoting substance
in the biological materials is due to reducing sugars and
their derivatives. They concluded that a two substrate
phase is required for some Acetobacter ~· and also that
carbohydrates are necessary to initiate growth of the or
ganisms~ When growth occurred, the ethanol was used as an
additional source of carbon and energy and thereby oxidized
to acetic acid. Low levels of sugar in the presence of com
plex biological materials such as liver extract should there
fore cause more complete oxidation of the alcohol. Rainbow
and Mitson (1953) presented evidence to show that A· suboxydans,
A· mobile and A· acidum utilized ammonium sulfate as the sole
source of nitrogen only when lactate was present. An induction
period suggested that adaptive enzymes are involved. Rao (1957)
stated that the utilization of ammonium nitrogen is profoundly
influenced by the carbon source. Mineral nutrition studies on
the Acetobacter ~· are lacking, the only paper being that or
Mulder (Rao 1957), who showed that copper was essential for
the growth of A· aceti.
Ethanol Concentration.
The ethanol concentration of the medium is very
important. Prescott and Dunn (1949) stated that 10 to 13%
alcohol concentration is readily fermented and they warned
14
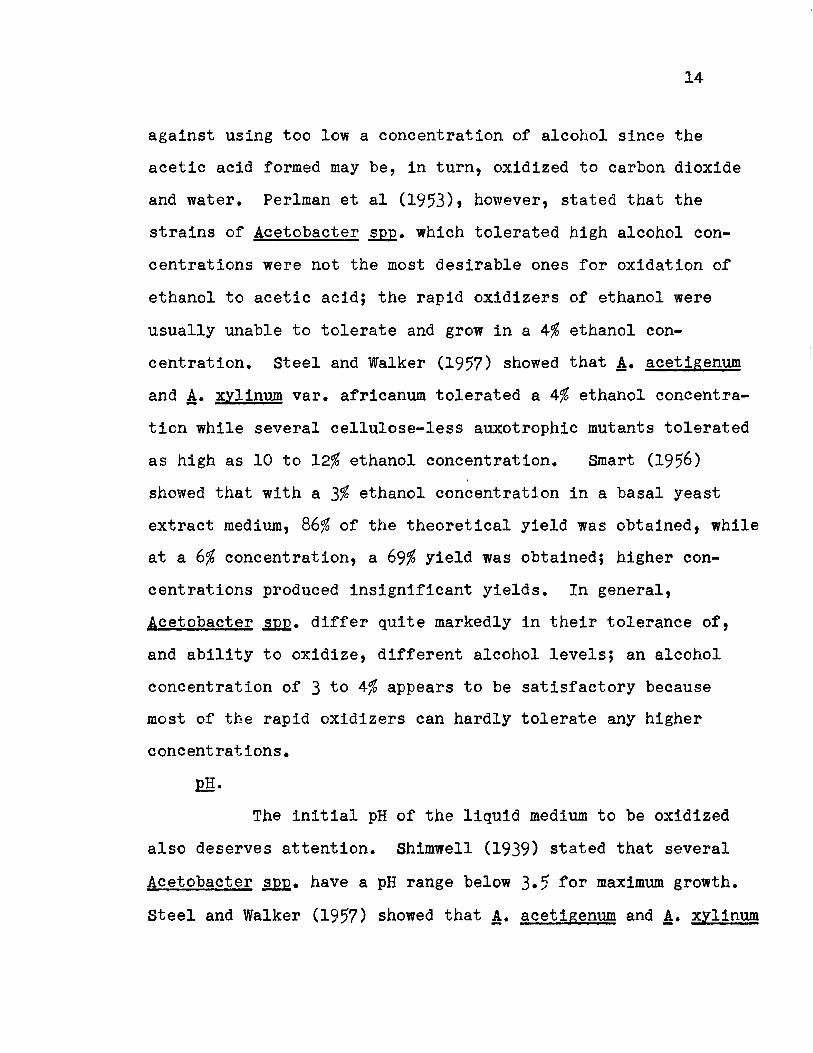
against using too low a concentration of alcohol since the
acetic acid formed may be, in turn, oxidized to carbon dioxide
and water. Perlman et al (1953), however, stated that the
strains of Acetobacter ~· which tolerated high alcohol con
centrations were not the most desirable ones for oxidation of
ethanol to acetic acid; the rapid oxidizers of ethanol were
usually unable to tolerate and grow in a 4% ethanol con
centration. Steel and Walker (1957) showed that !• acetigenum
and A· xYlinum var. africanum tolerated a 4% ethanol concentra
tion while severa! cellulose-less auxotrophic mutants tolerated
as high as 10 to 12% ethanol concentration. Smart (1956)
showed that with a 3% ethanol concentration in a basal yeast
extract medium, 86% of the theoretical yield was obtained, while
at a 6% concentration, a 69% yield was obtained; higher con
centrations produced insignificant yields. In general,
Acetobacter~· differ quite markedly in their tolerance of,
and ability to oxidize, different alcohol levels; an alcohol
concentration of 3 to 4% appears to be satisfactory because
most of the rapid oxidizers can hardly tolerate any higher
concentrations.
lili· The initial pH of the liquid medium to be oxidized
also deserves attention. Shimwell (1939) stated that severa!
Acetobacter ~· have a pH range below 3.5 for maximum growth.
Steel and Walker (1957) showed t hat !· acet i genum and !· xYlinum
15
h.ad optimum pH growth ranges from pH 5 to 6 while selected
auxotrophs varied from pH 7.5- 8.5. Tosic and Walker
(1946 Part I) studied severa! Acetobacter organisms with
relation to pH, on standard malt wort medium over the range
7.05 to 2.50, growth being observed at 12 hour intervals.
Results from these studies indicated that A· aceti,
A. acetigenum, A· suboxYdans, A· gluconicum, A· pasteurianum,
A· capsulatum, A· kutzingianus and A· xYlinum grew best be
tween the pH range 6.0 to 4.5; A· acetosum and A. ascendens
grew best at the range 5.0 to 4.0. Growth of the majority of
the species used was retarded to a certain extent at pH 7.05
and more so at pH 3.5. None of the organisms grew at pH 2.5.
Temperature
The temperature at which the oxidation of alcohol
occurs is very critical. Slow growth attendant with a morpho
logical change is observed with organisms grown below 15°C.
Normal development is observed between 15 and 34°C and sometimes
a zoogleal mat is formed; at higher temperatures, long thread
like coenocytic filaments with irregular bulging and occasional
branching are formed. This latter condition, if induced by
prolonged high temperatures, will result in malfunctioning of
the organisms, but if the temperature is lowered to about 30°C
after such a period of high temperature, sorne cells regain
their normal functioning. Evidently, the exact optimum tem•
pe~âture to be used will depend on the organism and the process
16
.being used. A slow fermentation is obtained when too low a
temperature is used while alcohol evaporation and acetic
acid losses are effected if too high a temperature is used.
Steel and Walker (1957) used A· acetigenum and A· xylinum
var. africanum and selected auxotrophs at a temperature of 0 0 40 c; the mutants grew well at 40 C in contrast to the parent
type. Hromatka and Ebner (1954), in their submerged methods,
used temperatures ranging from 28 to 33°C and obtained satis
factory growth. Tosic and Walker (1946 Part II) studied ten
Acetobacter organisms on standard malt wort medium at tempera
tures of 14, 20, 25, 28, 30, 32, 37, and 42°C. Eight of the 0 ten species had an optimum temperature for growth at 30 c;
A· gluconicum and A· xYlinum grew fastest between 25 to 28°C 0 but A. xylinum could not grow at 30 C; none of the species
0 grew at 42 C. Smart (1956) reported that satisfactory growth
was obtained at 25°C on a yeast extract medium with the organ-
isms used.
It can therefore be concluded that irrespective of
the method being used, a temperature range between 25 and 34°C
appears to be satisfactory for vinegar production.
The Genus Acetobacter
Classification.
The correct generic term for the bacteria that pro
duce acetic acid from alcohol is Acetobacter. Words synonymous

17
with Acetobacter have been used, e.g., Bacterium, Bacillus,
Ulvina, Umbina, Acetobacterium and Termobacterium. Vaughn
(1942) stated that acetic acid bacteria are related to the
family Pseudomonadaceae due to their morphological character
istics. Breed et al (1957) placed the Acetobacter in the
family Pseudomonadaceae, tribe Pseudomonadeae which contains
the genus Pseudomonas. Breed et al (1957) described the
organisms as having the following characteristics:
Individual cells are ellipsoidal to long and are
rod-shaped, occurring singly or in pairs or in short and long
chains; they are motile with polar flagella or they are non
motile; involution forms may be elongated, spherical, fila
mentons, club-shaped, swollen, curved or even branched; young
cells are Gram negative but older ones may be Gram variable.
The bacteria may be obligate aerobes and are usually catalase
positive; varions organic compounds are oxidized to organic
acids and other end products that may be furtber oxidized.
Products of oxidation may include the ~ollowing: acetic acid
from alcohol, gluconic and ketogluconic from glucose, dihY
droxy-acetone from glycerol and sorbose from sorbitol.
Their mode of nutrition is complex but best growth is obtained
in yeast infusion or autolysed yeast media with ethanol or
some other oxidizable substrate (s) included. The organisms
do not form spores; the optimum temperature for growth varies
quite widely.

18
Vaughn (1942) stated that Acetobacter ~· should be
elassified according to their ability to oxidize a substrate
such as alcohol or glucose. Shimwell (1948), however, stated
that acid production from different sugars and alcohols eannot
be established as a reliable criterion on which Acetobacter ~·
should be classified.
Tosic and Walker (1946 Part I) presented cultural media
and procedures which they considered suitable for the character
ization of ten cultures of Acetobacter ~· from the National
Collection of Type Cultures, The Lister Institute, England.
They investigated the morphological, cultural and biochemical
characteristics of the organisms. Morpbologieal studies in
cluded shape, size and arrangement of cells and involution forms;
biochemical characteristics included gas formation, acid produc
tion, utilization of acetic acid, the Voges Proskauer test and
the catalase test; physiological characteristics included tem
perature, aerobiosis, pH and alcohol tolerance. These investi
gators claimed that the eharacteristics agreed with those they
previously published, and that this was the.first attempt made
towards standardizing the procedure for such characterization
of Acetobacter species.
Walker and Kulka (1949) presented a summary of the
important cultural, physiological and biochemical character
istics which they suggested should be used for identification
of these organisms. The authors stated that of the morphological
19
cbaracteristics, that of motility was the most important;
growth in wort and beer, the behaviour and appearance on wort
agar and the type of giant colonies produced on semi-solid
wort agar were the most important cultural cbaracteristics.
Incubation temperature and oxygen requirements formed the most
important physiological characteristics, while acid production
from carbohydrates, the utilization of ammonium salts as the
sole nitrogen source and the ketogenic activity of the organisms
were the most important biochemical characteristics.
Liefson (1954) suggested that the genus Acetobacter
be divided on the basis of flagellation and acetate oxidation;
e.g. Acetobacter~., those which can oxidize acetate and have
peritrichous flagella, and Acetomonas, consisting of those that
cannot oxidize acetate and are polarly flagellated. Rainbow
and Mitson (1953) suggested lactophilié · and glycophilic
groups which corresponded to Liefson's Acetobacter and Acetomonas;
Frateur (1950) proposed a scheme of classification of Acetobacter
based on the following characteristics: catalase character,
ketogenic capacity and abil1ty to oxidize acetate to carbon
dioxide and water. He used these characteristics to group the
organisms into four groups, each subdivided into species based
on the ability of the cultures to oxidize glucose, to use ammo
nium nitrogen as the sole source of nitrogen in Hoyer's medium
and to form pigments and cellulose.
There is no widely accepted classification for the

20
group of organisms which Breed et al (1957) term Acetobacter.
Rao (1957), however, considers Frateur•s (1950) scheme of
classification to be the best available. Indeed, the words
of Stanier and van Niel (1941) are so appropriate in the classi
fication of these organisms that their repetition here is
justified:
"in any attempt to subdivide the organisms belonging
to one natural group of bacteria into species, one would have
to create as many species as there are organisms which differ
in sufficiently fundamental characteristics, regardless of the
existence of the intermediate types. It depends entirely on
the scientific tact of the investigators to decide which charac
ter shall be deemed worthy of the designation 'sufficiently
fundamental'."
The Organism - Acetobacter suboxYdans.
According to Breed et al (1957), this organism has the
following characteristics and description: it can be isolated
from spoiled beer, souring fruits and wine; occurs as short
rods, single or in chains and is non-motile; a hardly visible
pellicle is formed on liquid media; pantothenic acid, nicotinic
acid, para-aminobenzoic acid, valine, alanine, iso-leucine
histidine, cystine and proline acids, mineral salts and a two
phase ox1dizable system with alcohol and glucose all comprise
the minimum nutritional requirements for this organism; acid
is produced from ethanol, propanol , glycols, glucose, glycerol

21
and sorbitol; the optimum temperature for growth is 30°c;
partial oxidation of substrates is indicated by the formation
of calcium-5-gluconate crystals on the surface of the agar
slants containing glucose and calcium carbonate. No capsule
appears evident and, according to Liefson (1954), peritrichous
flagella are present; this seems to be contradictory to the
"non-motility" mentioned by Breed et al (1957). The organism
is catalase positive and forms no visible cellulosic pellicle
in liquid media.
Carbohydrate and Nitrogen nutrition.
The general nutrition of this organism is not well
established. Rao and Stokes (1953) showed that it could not
be grown on chemically defined media with ethanol as the sole
carbon and energy source. When autolysed yeast or ether com
plex biological material such as liver extract was included,
however, the organism grew quite well. These workers also
showed that in a two substrate system, with glucose and ethanol
as carbon and energy sources, growth is accompanied by assimi
lation of some of the carbon into cell material. Hall et al
(1952), Rao and Stokes (1953) demonstrated that the pH and
carbohydrate present in the medium influenced the growth of
A· suboxydans; above pH 5.3, with glucose present, alanine was
not essential, while niacin and valine were not required; if
glycerol or sorbitol was substituted for glucose at pH 5.0 to
5.3, all three acids were required.

22
Fulmer et al (1944) used an acid alfalfa extract as
a nitrogen source but it was inferior to autolysed yeast in
this respect. Liggett and Koffler (1948) suggested that corn
steep liquor could be used as a nitrogen source for A· suboxydans. Rainbow and Mitson (1953) found casein hydrolysate
to be a good source of nitrogen while ammonium was used as a
nitrogen source when lactate was present.
Stokes and Larsen (1945) showed that A· suboxydans
A.T.c.c. 621 required six amino acids, two being accessory for
its maximum oxidative capacity. Several strains of A· suboxydans
could not use lactate or ethanol as the sole source of carbon
and energy even when all the necessary growth factors were pre
sent. Rainbow and Mitson (1953) used a group of organisms, one
of which was A· suboxydans N.T.C. 7069,on a medium at pH 5.8 in
which the carbohydrate, nitrogen and growth factor sources were
varied; the workers reported that A· suboxydans grew poorly in
media containing amine acids and glucose but grew well when
lactate replaced glucose. Resting cells of the organism can
deaminate, by oxidation, a number of amine acids, whose products,
so far, cannot be identified. Leucine, isoleucine and valine,
essential for growth, are not attacked.
Growth Factors.
Rainbow and Mitson (1953), Lampen et al (1942) and
Underkofler et al (1943) showed that p-aminobenzoic acid,
pantothenic acid and nicotinic acid are required by A· suboxydans

23
The organism is also used for the assay of p-aminobenzoic
acid; in the presence of purines, smaller amounts of the acid
are required. Baddiley et al (1953) identified pantetheine-4-
phosphate, one of the fragments obtained from the action of
potato pyrophosphatase as a factor that stimulated the organism
quite markedly - the so called "Acetobacter Stimulatory Factor".
Karabinoos and Dicken (1944) showed that the growth promoting
activity of biotin is due to a nicotinic acid contaminant.
Mineral Nutrition.
There is no specifie work done on the mineral nutrition
of this organism. Rao (1957) stated that work on mineral
nutrition is only known for A· aceti.

Qrganism
II~
MATERIALS AND METHODS
24
The organism used in this study was Acetobacter
suboXfdans A.T.c.c. 621, obtained in a lyophilized state
from the Prairie Regional Laboratory of the National Research
Council, Saskatoon, and numbered as Gl.
Inoculum
Batch Fermentation.
The lyophilized culture was trans!erred aseptically
to a medium containing tryptone (0.1%), liver extract ~.0% v/v)
and ethanol C% v/v). When growth occurred, slants of a simi-
lar medium, but with agar (1%) and calcium carbonate (5%) added,were inoculated from the grow~ng culture; after a long
period, growth was observed by the clear zones that were calcium
carbonate free; crystals of calcium gluconate formed on the sides
of the test tube opposite these clear zones. In every experimen~
a fresh inoculation of 5 ml was made from the slants into a
flask containing the medium to be used and the culture was then
aerated on a reciprocal shaker !or 24 hours at 30 ± 2°C, prior
to the inoculation into the test flasks.
Cont1nuous Fermentation.
Inoculation was made directly, from the slants pre
viously described, into a medium conta1ning malt extract (0.1%),
25
autolysed yeast (0.1%), corn steep liquor (3.0% v/v) and
mannitol (0.1%). The flasks were incubated in 500 ml
Erlenmeyer flasks on a New Brunswick gyrorotary shaker (model
G.lO), having an eccentricity of , inch; the duration of in
cubation was 96 hours at 30 ~ 0.5°C. The fructose produced was
identified by reference spots on paper chromatograms after the
method of Trevellyan et al (1950). A sub-culture was then made
into a flask containing a similar medium except that a 0.001%
mannitol was used and a (3% v/v) ethanol. After a 7 day period
of adaptation, acetic acid was produced. The culture was main
tained in this condition by continuons withdrawal of the product
with subsequent addition of fresb medium and (3% v/v) ethanol.
The inoculum for the first continuons experiment was taken from
the sub-culture described, while the inoculum for subsequent
continuons experiments was taken from each immediate previous
experiment; in the latter instance the culture giving the
highest percentage efficiency on substrate added in any test
flask, was used as the inoculum for the next experiment.
Media
Batch Fermentation.
The medium contained:

Tryptone
Glucose
Ethanol
Caco3 Liver extract
Nicotinic acid
Pantothenic acid
0.1 gm
0.01 n
3.0 ml
5.0 gni
4.0 ml
20.0 ug
20.0 "
p-aminobenzoic acid 20.0 "
Inoculum 5.0 ml
Distilled water to make 100.0 ml
The calcium carbonate was sterilized separately and
added aseptically at the time of inoculation. The liver ex
tract was prepared by shredding 1 lb. of beef liver into 2 L
of water; this was steamed and the fat was removed by skimming; 0 the filtered liquor was then stored at 5 c.
Continuons fermentation.
The medium contained:
Malt extract
Autolysed yeast
Ethanol
Corn steep liquor
Nicotinic acid
Pantothenic acid
0.1 gm
0.1 tl
3.0 ml
3.0 "
20.0 ug
20.0 "
p-aminobenzoic acid 20.0 t1
Inoculum 5.0 ml
Distilled water to make 100.0 ml
27
The corn steep liquor was prepared after the method
of Liggett and Koffler (1948). After the experiment to
determine the concentration of corn steep liquor to be used,
the following original procedure was developed: The raw
corn steep liquor was adjusted witb distilled water to 20%
soluble solids by use of a Balling's saccharimeter. The
liquid was then centrifuged in a Lourdes centrifuge Model
L.R.at 5°C, for 25 minutes at 10,400 g. The supernatant was
decanted, sterilized using a Millipore filter and stored at
5°C.
Growth Conditions
Batch Fermentation.
After inoculation into medium, the cultures were
incubated in 500 ml Erlenmeyer flasks at a temperature range
of 27 to 33°C. on a reciprocal shaker. Samples were with
drawn at eacb 24 hour interval up to the 96th hour. Whenever
ethanol determinations were made, the samples were deprotein
ized prior to the analysis (Neish 1952). Zero time samples
were always taken and analysed for pH, alcohol and acetate
concentration. The initial pH was always 4.), any necessary
adjustment being made with 0.5 M. sodium acetate buffer.
Each experiment was continued for a further period of 168
hours to find out if the organism bad reached a steady maxi
mum rate of oxidation with continuous withdrawal of product

28
and addition of fresh medium~
Continuous Submerged Fermentation.
An apparatus (Fig. 1) for delivering a constant volume
of fresh medium was made following the design of Soltero and
Johnson (1954). Six electrolytic cells containing N/10
H2so4 were made and coupled in series to a d-e rectifier
built by Dr. W. F. Oliver, Department of Physics, following
the design of Soltero and Johnson (1954); the electrodes were
made of platinum spot welded to copper and fused through glass
tubing. Each electrolytic cell was coupled to a burette by
a glass tubing. A unit consisted of an electrolytic cell and
sterile clamped burette with its tip connected by a rubber
tubing to a capillary tubing (0.4 mm diameter) which passed
through absorbent cotton covered with gauze and touched the
bottom of the 500 ml modified Erlenmeyer flask on a New rcrn
6 Brunswick gyrorotary shaker (Model G 10) at 2 4 r.p.m. Each Il
flask was modified by making a hole about 3.5 inches from the
base and inserting a serum rubber stopper which made sampling
with a hypodermic syringe possible. The capillary tubing was
bent to a 90° angle, 2 cm from the lower tip, to which was
attached a 6 cm length rubber tubing that extended the tip to
the side of the flask where the greatest volume of broth was
whirled. This arrangement prevented the 11suck-back 11 of air.
The complete apparatus was then calibrated as follows:

29
g!g89 tybjog .
. ;~. rubber connection .·· rybber stopper:
sterile cotton pluo
rubber stopper
burette e
~ .... -~1~2~5!..!m!!Ll .!iE!.!r '!.!!!.!JRl!JmlJel)yt§t!L.r
rubbtr connectlon
caplllary tubint
çott..on- gauze plug
500 ml Erlenmeyer
serum rubber pluo
le
rubber tubtn·
- Fig.l Schemati-c diagram of continuous-feed apparatus.
(Not drawn to scale)

30
Each unit was sterilized and assembled. The burette and
flask were filled with medium and allowed to equilibrate
for 24 hours to detect leakage. The rectifier was then
turned on and the rate of delivery of each unit, coupled
in series, was determined twice for the range 0 to 5 milliamps and tbree times for the working range 0 to 2
milliamps. (Fig. 2 )
When an experiment was to be performed, the pro
cedure used for the calibration was followed except that
six un-modified Erlenmeyer flasks containing distilled water
were used for the 24 hour equilibration. During this period,
the modified-type Erlenmeyer flasks were inoculated and
allowed to undergo a 24 hour fermentation after taking zero
time samples. If no leakage occurred, the rubber tubing
connecting the burette tip to the capillary tubing in the
flask was clamped and the cotton stopper with the capillary
tubing was transferred aseptically to the modified Erlenmeyers
that bad already undergone a 24 hour period of fermentation
on the shaker. The cotton stopper was then fastened and
samples were taken for the end of the 24 hour period. The
rectifier was started at a predetermined setting so as to
deliver between 10 to 12 ml of medium per 24 hours. The
clamps on the rubber tubing were then unfastened. Samples
were withdrawn up to the 96th hour and a portion of each was
analysed for pH and turbidity; the remainder was centrifuged

1.
A 31 ·05
·03 k = • 01
•01
., -::s 0 c E . 1 3. 5 ... ., o.
"D ., ... ., > ·016 -., "D
8 • ·014 ., ... -§
E ·012
•010 k = • o ·l
•008
·006
·004
·002
0
·2 ·6 1·0 1·4 1·8
milliampa
Fig . 2 . Cal i bration curves of t he continuous-feed apparatus. A - duplicate determinations. B - triplicata determi nations.
32
and analysed for residual ethanol and for acetate. The
initial pH, except stated to the contrary, was always 4.3.
Ethanol was delivered in the medium of the burette at a
concentration of (3% v/v) to keep the concentration in each
flask as close to (3% v/v) as possible. Each experiment was
continued for a further 168 hours to find out if the organism
had reached a steady maximum rate of oxidation with continuous
withdrawal of product and addition of fresh medium.
Analytical Techniques
Determination of Acetate.
Preliminary experiments using the steam distillation
method for the determination of volatile organic acids (Neish
1952) indicated that direct titration using standardized N/10
NaOH was adequate for the determination of total acidity,
expressed as acetic acid. Sodium hydroxide, free of carbon
dioxide, was standardized with potassium acid phthalate with
subsequent counter-standardization with standard HCl. The
alkali was stored using a Caroxite breather to absorb carbon
dioxide from the air. For titrating, a Fischer automatic
electric titrimeter was used with pH 7 as the end point, but
when titrating with a burette, phenolphthalein indicator was
used. The acetate actually produced in any interval, e.g.,
the 24-48 hour, was found by deducting the total acetate
formed at the 0-24 hour interval from the total acetate value
at the end of the 24-48 hour interval. The total acetate in-

33
cluded the initial acidity.
Whenever readjustment was made with alka1i, as
with the pH experiments, eaeh interva1 was eorrected for
"the buffered acetate" which was determined after the ad
justment of the pH with alka1i and prior to the start of the
new interva1. The number of mi11i-equivalents or milligrams,
total or corrected, was calculated per 100 ml of broth.
Determination of ·Ethanol.
Residual ethanol was determined by the micro
diffusion method of Conway (1947) as modified by Neish (1952)
using porcelain No. 2 Conway diffusion plates. The centri
fuged samples were diluted with distilled water so that their
ethanol concentrations were brought within the effective range
of the method (0.1 to 0.4 mgm of ethanol) according to the
theoretical amount of ethanol used as calculated from the amount
of acid formed. The reagents used were prepared as described
by Neish (1952). After introduction of the sample and the
oxidizing mixture, each plate was sealed with an etched glass
eover smeared with 60:40 mixture of vasel1ne-paraff1n and in
eubated at room temperature for 36 hours. A 5.00 ml micro
burette or a calibrated micrometer syringe (Neish 1952) was
used in titrating with standardized N/10 sodium thiosulfate.
A blank was run for each set of determinations and the results
are expressed as milligrams of ethanol per 100 ml of broth.
The following is an example of the calculations to
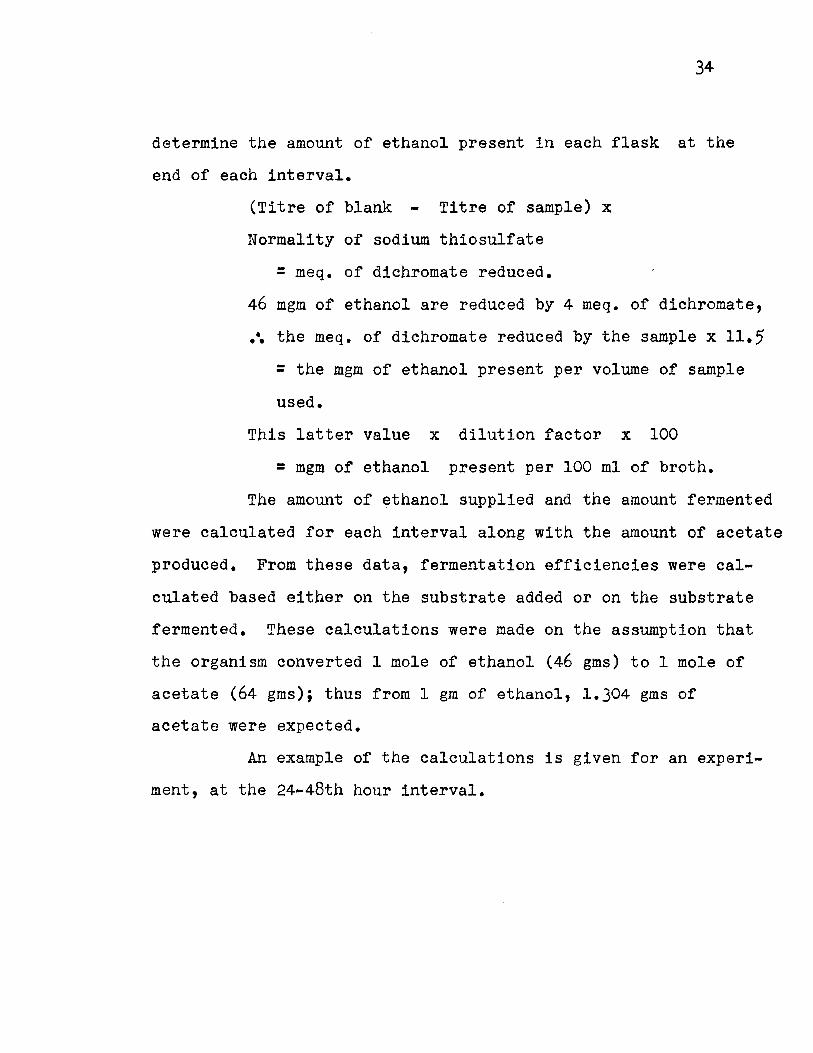
34
determine the amount of ethanol present in each flask at the
end of each interval.
(Titre of blank - Titre of sample) x
Normality of sodium thiosulfate
= meq. of dichromate reduced.
46 mgm of ethanol are reduced by 4 meq. of dichromate,
.~ the meq. of dichromate reduced by the sample x 11.5
= the mgm of ethanol present per volume of sample
used.
This latter value x dilution factor x 100
= mgm of ethanol present per 100 ml of broth.
The amount of ethanol supplied and the amount fermented
were calculated for each interval along with the amount of acetate
produced. From these data, fermentation efficiencies were cal
culated based either on the substrate added or on the substrate
fermented. These calculations were made on the assumption that
the organism converted 1 mole of ethanol (46 gms) to 1 mole of
acetate (64 gros); thus from 1 gm of ethanol, 1.304 gms of
acetate were expected.
An example of the calculations is given for an experi
ment, at the 24-48th hour interval.

35
Ethanol
Amount in flask at the 24th hour ------------ 2800 gms
tt added between 24-48th Il ------------ 359 tt
tt in flask at the 48th " ------------ 2270 "
" fermented between 24-48th Il ------------ 889 tl
Acetate
Amount in f1ask at the 24th hour ------------ 84 gms
Il tl Il Il " 48th tl
" produced between 24-48th "
Ca1cu1ations
Fermentation efficiency based on
Efficiency = 948 x 100 3159 x 1.304
------------ 1032
------------ 948
substrate added.
23%
Fermentation efficiency based on substrate fermented.
Efficiency :
Determination of pH.
~48 x 100 89 x 1.304
When the Fischer automatic titrimeter was used, the
pH was determined before each samp1e was titrated. The instru
ment was standarized with pH 4.0 buffer and the samp1e pH was
read by reference to the nu11 point of the e1ectronic eye.
When the automatic titrimeter was not used for the titration,
pH measurements were made with the Beckmann Mode1 N pH meter,
"
"
standarized with pH 4.0 buffer. Simultaneous comparative
determinations with the two instruments agreed.
Determination of TurbiditY.
Turbidimetric measurements were made with the Model
9 Coleman Nepho-colorimeter D 202. No filter was used.
Immediately before each set of daily readings the instrument
was calibrated, e.g., one division on the optical density scale
was made equivalent to 4 nephelos, using the 76 nephelos
standard unit. If growth was too dense, the sample was then
diluted with distilled water. All results are reported as
nephelos per millilitre of broth.
IV 37
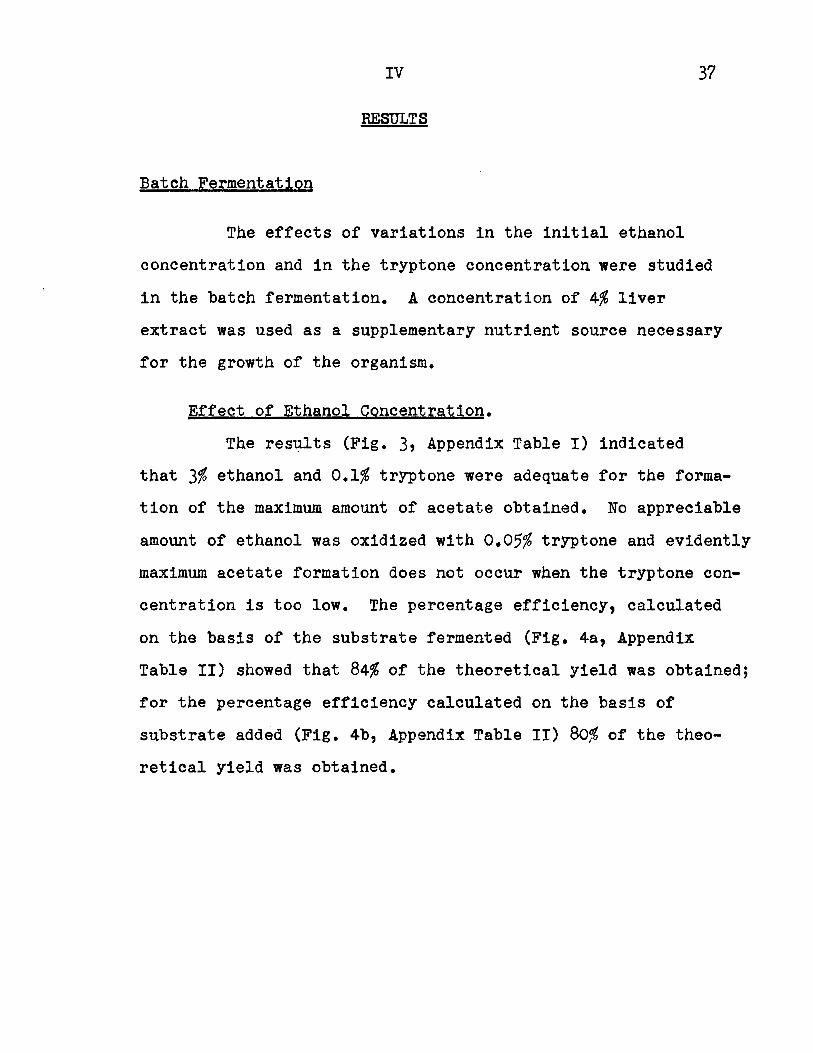
RESULTS
Batch Fermentation
The affects of variations in the initial ethanol
concentration and in the tryptone concentration were studied
in the batch fermentation. A concentration of 4% liver
extract was used as a supplementary nutrient source necessary
for the growth of the organism.
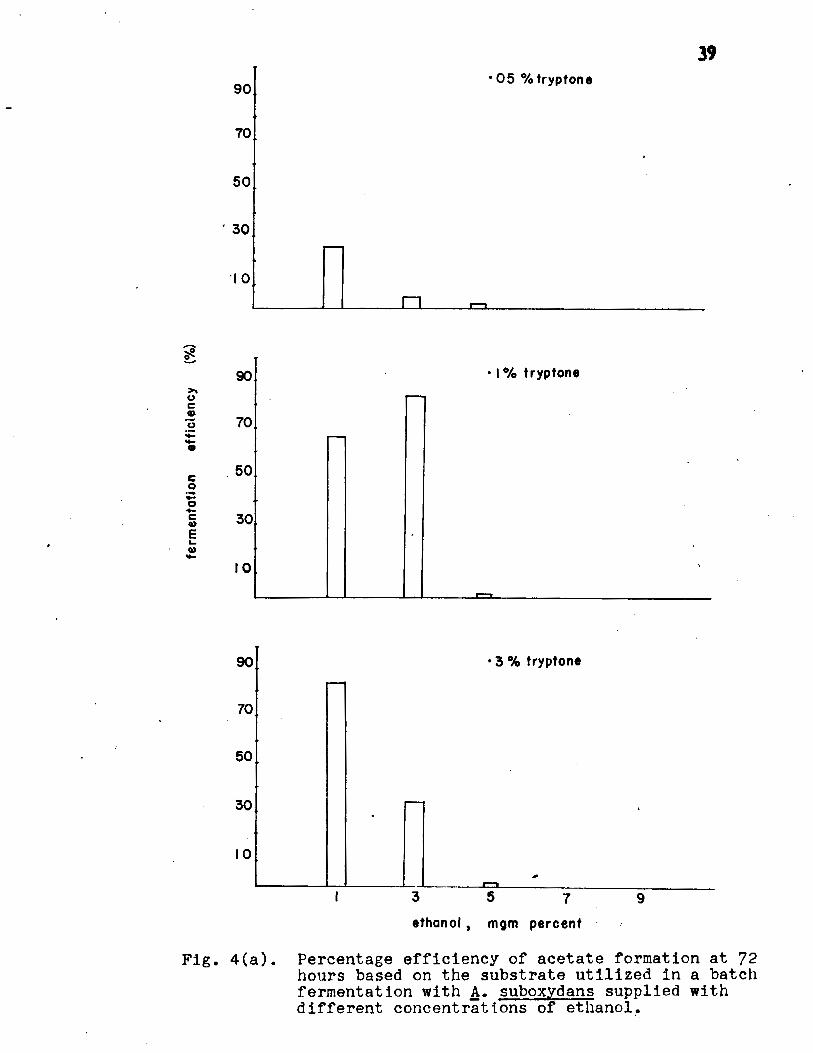
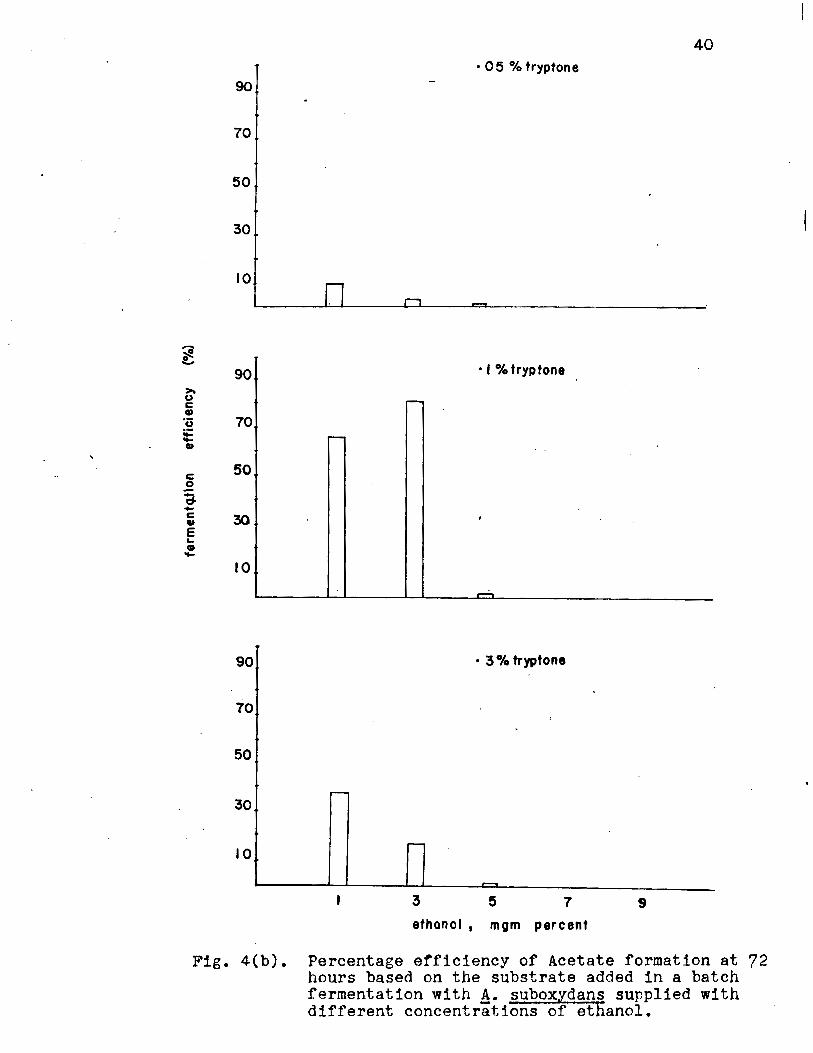
Effect of Ethanol Concentration.
The results (Fig. 3, Appendix Table I) indicated
that 3% ethanol and 0.1% tryptone were adequate for the forma
tion of the maximum amount of acetate obtained. No appreciable
amount of ethanol was oxidized with 0.05% tryptone and evidently
maximum acetate formation does not occur when the tryptone con
centration is too low. The percentage efficiency, calculated
on the basis of the substrate fermented (Fig. 4a, Appendix
Table II) showed that 84% of the theoretical yield was obtained;
for the percentage efficiency calculated on the basis of
substrate added (Fig. 4b, Appendix Table II) 80% of the theo
retical yield was obtained.

ë 0 0
45
15
... 45 •• c. ' C7 • E .. ., -.E 1 5 • "<>
0
45
15
Fig. 3.
• 05% trypton8
·1 % tryptone
· 3 % tryptone
n 3 5 7 9
ethanol , mgm percent
Effect of initial ethanol and tryptone concentrations on acetate formation at 72 hours in a batch fermentation with A· suboxydans.
39
90 • 05 % tryptone
70
50
. 30
'10
"ô ~ _.
90 • 1% tryptone ~ () ...-c CD () 70
:0:: -• Il:
. 50 0 ·--D -c 30 Q)
E .... Q) , - 10
-
90 • 3 °.4 tryptone
70
50
10
3 5 7 9
ethanol , mgm percent
Fig. 4(a). Percentage efficiency of acetate formation at 72 hours based on the substrate utilized in a batch fermentat i on with A· suboxydans supplied with dif fe rent concent r attons of ethanol~
40 • 05 %tryptone
90
70
50
30
10
'7 ~ - • 1 % tryptone 90
""' u r--c: ., 'ü 70 ;;: .... ., c: 50 0
~ -c: • E ... ., .... 10
~
90 • 3% tryptone
70
50
r--
30
10
3 5 7 9 ethanol , mom percent
Fig. 4(b). Percentage efficiency of Acetate formation at 72 hours based on the substrate added in a batch fermentation with A· suboxydans supplied with different concentrations of ethanol.

41
·Effect of Tryptone Concentration.
A tryptone concentration of 0.1% gave greater yield
of acetate than any of the other concentration studied.
(Fig. 5, Appendix Table III) The results given in Fig. 5
include only 0.01% and 0.1% concentrations of tryptone, since
these values represent the extremes of acetate production
except for the 4% tryptone concentration which gave the lowest
amount of acetate. Apparently there appears to be a maximum
and a minimum limit at which reasonable acetate formation
occurs.
The results also show that maximum acetate production
is accompanied by an increase in turbidity and a decrease in
pH and ethanol concentration. The percentage efficiency of
acetate formation calculated, at 96 hours, on the basis of the
substrate fermented (Fig. 6A, Appendix Table IV) showed that
the percentage of the theoretical yield was 79.3% for .Ol%
tryptone and 89.1% for 0.1% tryptone; for the percentage
efficiency calculated on the basis of the substrate added
at 96 hours, (Fig. 6B, Appendix Table IV) 51.6% of the theoreti
cal yield occurred at 0.01% tryptone while 76.1% occurred at
0.1% tryptone.

42
• 0 1 % tryptone
--E E oe 0 ,... .... ~8 Q)Q -«» :;;a. --o- «».._ .... ii ut :I: Q) Q) Cl) PH ga. ... o Q. ë;O.
::::~- -=-- --Q) ace tata -6e 0" .s:: Q) . Q. .,.-- 'iii lOt E CD . !E c et~onol 15 150 turbidity 1·5 80
0
•1 % tr tone
45 450~ acetate
PH
"'-.... thanol ~anot 1 · 5 800 15 150 · • furbldifi--~-::::...__,..---1
~~------ ---0 24 72
time in hours
Fig. 5. Effect of tryptone concentration on acetate formation in a batch fermentation of 3% ethanol with A· suboxydans.

90
70
50
30
"'7l 10 ~ ->.. () c .!! () --Q)
c 0 -0 -c Q)
E ... • -90
70
50
. 30
10
Fig. 6.
43
A
,--
-r-- . ,--
0 -r-- . .----0 -- 0 0 0 . .
0 0 0
8
,
r--
-. 0
r--r-
- r-- -r-- - 0 - 0 0 0 . 0 . 0 0
24 72
tlme ln hours
Percentage efficiency of acetate formation from the substrate fermented (A) and substrate added (B) in a batch fermentation with A. suboxydans supp1ied with 0.01 or 0.1% tryptone.
-. 0
)
r-
-. 0
44
Qontinuous Fermentation
Effect of pH.
The effect of various factors affecting the rate of
acetate formation in a continuous fermentation were studied;
these factors included pH, initial ethanol concentration,
nitrogen nutrition, and addition of large volumes of fresh
medium.
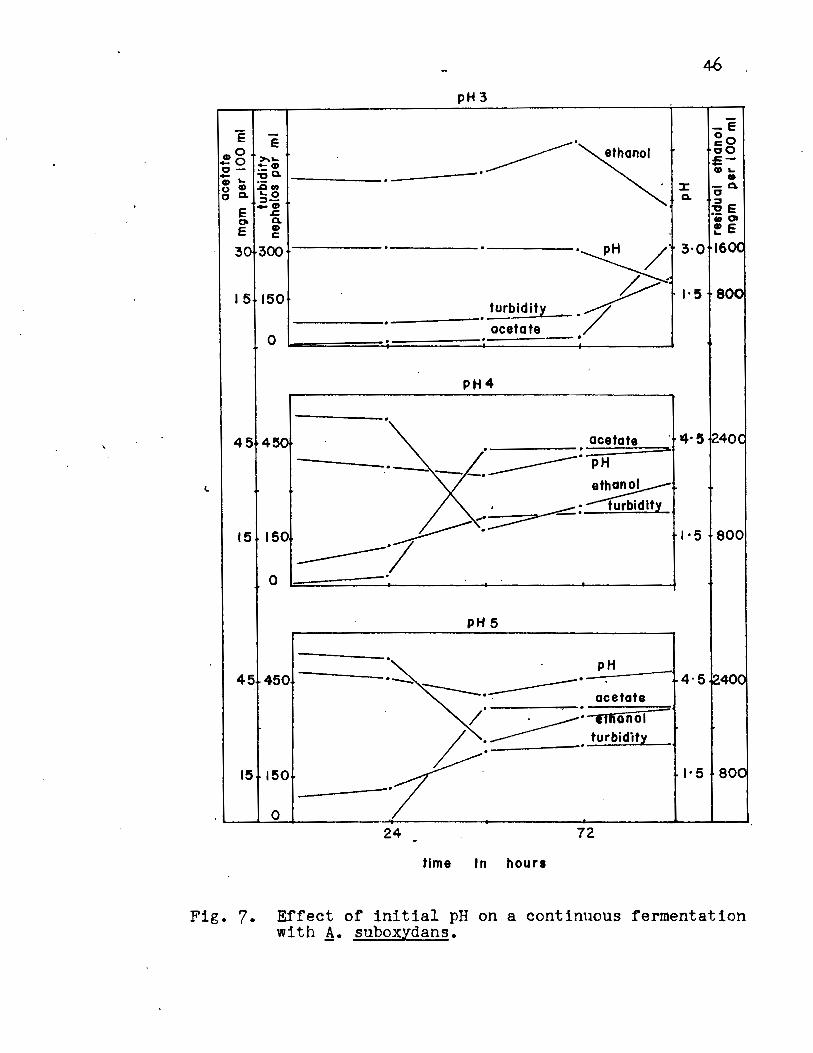
The pH values first studied, were 1, 2, 3, 4, 5, and 6. No growth occurred at pH's 1, 2 or 6 and thus the
data for the pH values of 3, 4 and 5 are given in Fig. 7,
Appendix Table v. The results indicated that acetate forma
tion is accompanied by an increase in turbidity followed by a
decrease in pH and ethanol concentration. A delay in acetate
formation occurred at pH 3 until 96 hours, while at pH 4 and
5, maximum acetate formation occurred after 48 hours.
The percentage efficiencies, for pH 4 and 5, cal
culated on the basis of the substrate fermented (Fig. 8A,
Appendix Table VI) were over 90% of the theoretical yield;
for the substrate added (Fig. 8B, Appendix Table VI), over
50% of the theoretical yield occurred. Most of the ethanol
that disappeared was fermented by the organism. (Fig. 8A,
Appendix Table VI) The calculations of the percentage
efficiencies are based on the actual amount of acetate formed
at each 24 hour interval but no constant rate of oxidation was
reached.
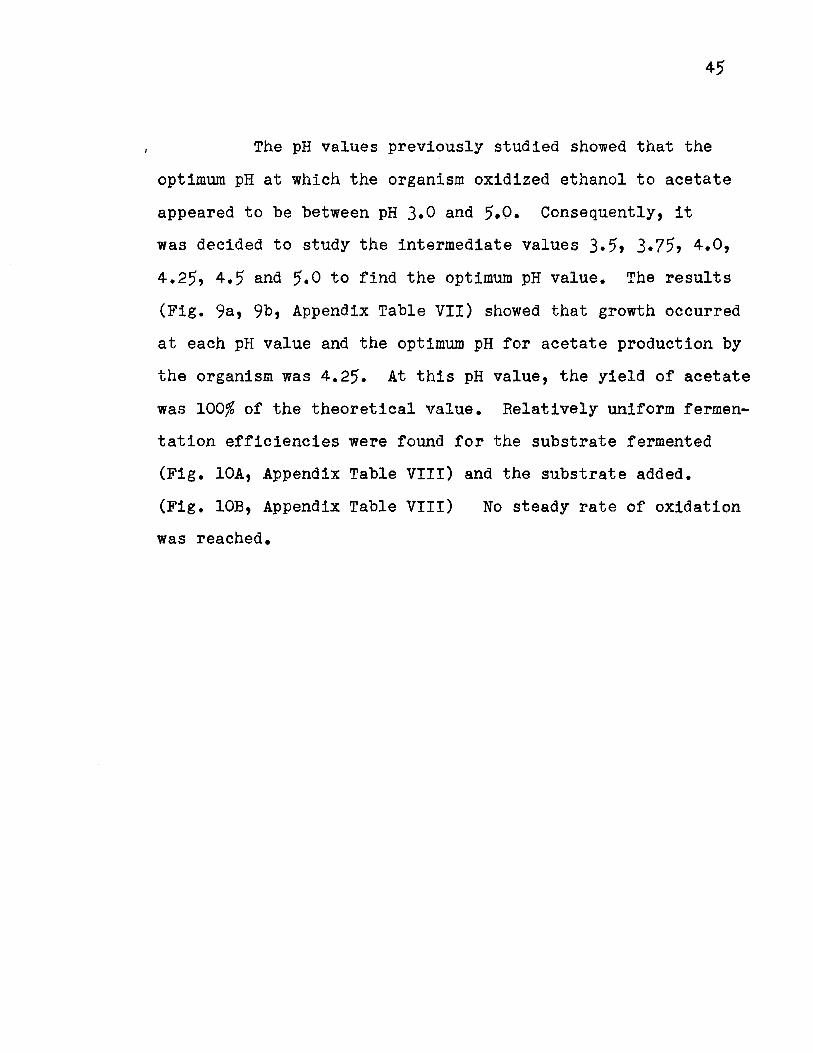
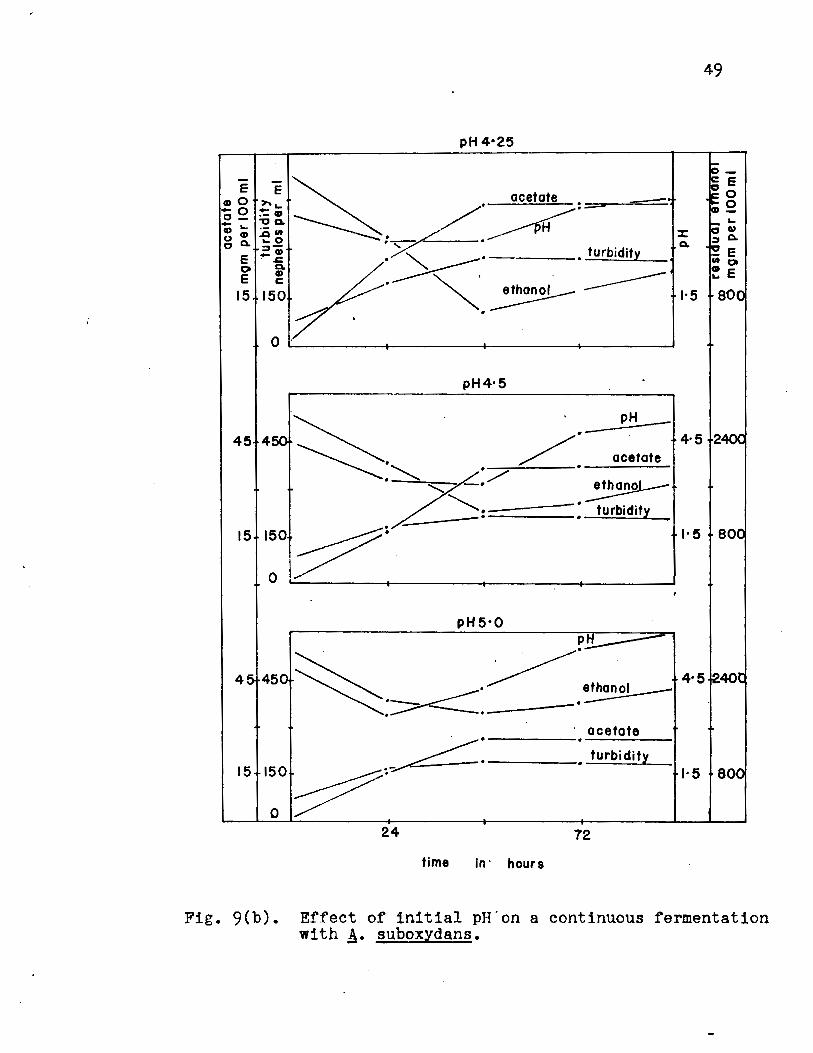
The pH values previously studied showed that the
optimum pH at which the organism oxidized ethanol to acetate
appeared to be between pH 3.0 and 5.0. Consequently, it
was decided to study the intermediate values 3.5, 3.75, 4.0,
4.25, 4.5 and 5.0 to find the optimum pH value. The results
(Fig. 9a, 9b, Appendix Table VII) showed that growth occurred
at each pH value and the optimum pH for acetate production by
the organism was 4.25. At this pH value, the yield of acetate
was lOO% of the theoretical value. Relatively uniform fermen
tation efficiencies were found for the substrate fermented
(Fig. lOA, Appendix Table VIII) and the substrate added.
(Fig. lOB, Appendix Table VIII) No steady rate of oxidation
was reached.
46
pH 3
Ë -E - 00 E
-·----------·~ a.O ~0 -o ,... ... =--a. o- :.oa. .... ~ ... ·- • u. :a., l: - Q. 0 Q. '-0 Q. 0
::J-.Se -at
E .c 0 Q. •• 0
E at ~E c
30 300 . . ·~· 3·0 160<
~-1·5 800 15 150 ·7 . turbidity .
acetate 0 . . •
PH4
. 4 5 45n acetate · If.· 5 ~40C
IV 0 •:::::::::::::::::===1
------.·----......:-- -·-----· PH
~ -~= t.urbidlty
15150 7~------· 1·5 800
0 .
PH 5
-----· pH - 4·5 ~400 45 450 •--..; ----· ~. acetate
1· 5 800
/. · -----: ttnonol -L . ____.- . turbidity
----------·7· L-~~0~----------·--------~~--------~--------~--L-~ ..
15 150
24 72
tlme ln hours
Fig. 7. Effect of initial pH on a continuous fermentation with A· suboxydans.

>() c • :2 --• c: 0
A
90
70
50
10
; 8 0 -r: • E 90 .. • -
70
50
30
lO
r--5
..--4
3 3 l 1
3 3 J._ ~
24
tl me in
47
r--r-- 5
4 r--L
3 .
3 4 5 4 5 l • L ' L
r--3
3 4 5 45 + ! ! l L 72
hours
Fig. 8. Pe~centage efficiency of acetate formation per 24 hour interval from thes1bstrate fermented (A) and the substrate added (B) in a continuous fermentation with A. suboxydans with the initial pH set at J.O, 4.0-or 5.0.

...
48
pH 3·5
--·~ ethanol
o_ e - c e >-e 0 -0 .co
~0 _._ -o _., ·---- .,_
o- ~o. ... r; ... .QCIJ
• ·~· pH :1: - . u• ... 0 Q. g Q.
c -o. :;,--· • turbidlty ~ e E .c Q. . • 0
0 • -;:7' .
ace tate ~ E E c 15 150 1·5 aoc ------· 0
.
pH3•75
45 450 ~. . pH 4·5 ~40(
-~ ocefafe
---------~·--- ~ ' ~ ..-=::: /. _......---;:= turbidity
1· 5 800 15 150 .
0 .,
pH4·0
45 450 ~ .. . ~ pH_ 4·5 ~40C
------=:·" ~~~- acetate
"7 ""' • turbidity • --• ~ . ;;;;;;;;>
15 150 /. . -1ffiOnOÎ t-5 800
0 24 72
time in hours
Fig. 9(a). Effect of initial pH on a continuons fe rmentat ion with ·A· suboxydans.
49
pH 4•25
~i ~~~~·___:::;--== -·:1: u Q. ... 0 :- • Q. c :::~- ' t b' . e - ~ . ....._ . . ur 1d1ty
0 a. ...... E !
15 150 1·5 800
0 L-------~~-------4---------+--------~
pH4·5
45 450 ~. . /.- .:~:: ~.z·/ . '-· ~
'::::: -: turbidity ,
151:0~' .. -
4·5 240C
1·5 soc
PH5·0
P!!.-----
45450~ .~ethanol 4·5240C
~:~. -·~
1·5 800
24 72
time ln· hours
Fig. 9(b). Effect of initial pH'on a continuous fermentation with A· suboxydans.

90
70
50
30
~ · 10 ~
~ ()
. c: .!? () --1)
c: 0 -Cl ... c: CD e L.. CD - 90
70
50
30
10
A
r--lt) . ft)
8
lt)
l'f)
50
-Ill 0
lt) 0 lt) lt) 0 lt) 0 ~
lt) IC) r:- N ~ ,.._
~ v ~ lt)
v ~ Ill f() rt) rt)
)
~ ..
r-~ ' r-o ...
10 · ,.._v 1---
r-- r--rf> . lt)
lt) lt) ~
(\1 rt)
-~---IC)ro oit r-,.._ . ~0 0 . v v lb rt) U)
24 72
time in hours
Fig. 10. Percentage efficiency of acetate formation per 24 hour interval from the substrate fermented (A) and the substrate added (B) in a continuous fermentation with A. suboxydans with the initial pH set at 3.5 to 5:0 as indicated.

51
Effect of Initial Ethanol Concentration.
The batch fermentation on initial ethanol concentra
tion indicated that 1, 3 and 7% were suitable for study. The
results of such an experiment (Fig. 11, Appendix Table IX)
showed that the peak of acetate formation occurred with 1 and
3% ethanol at 72 hours. Acetate formation was accompanied by
an increase in turbidity, followed by a decrease in pH and
ethanol concentration.
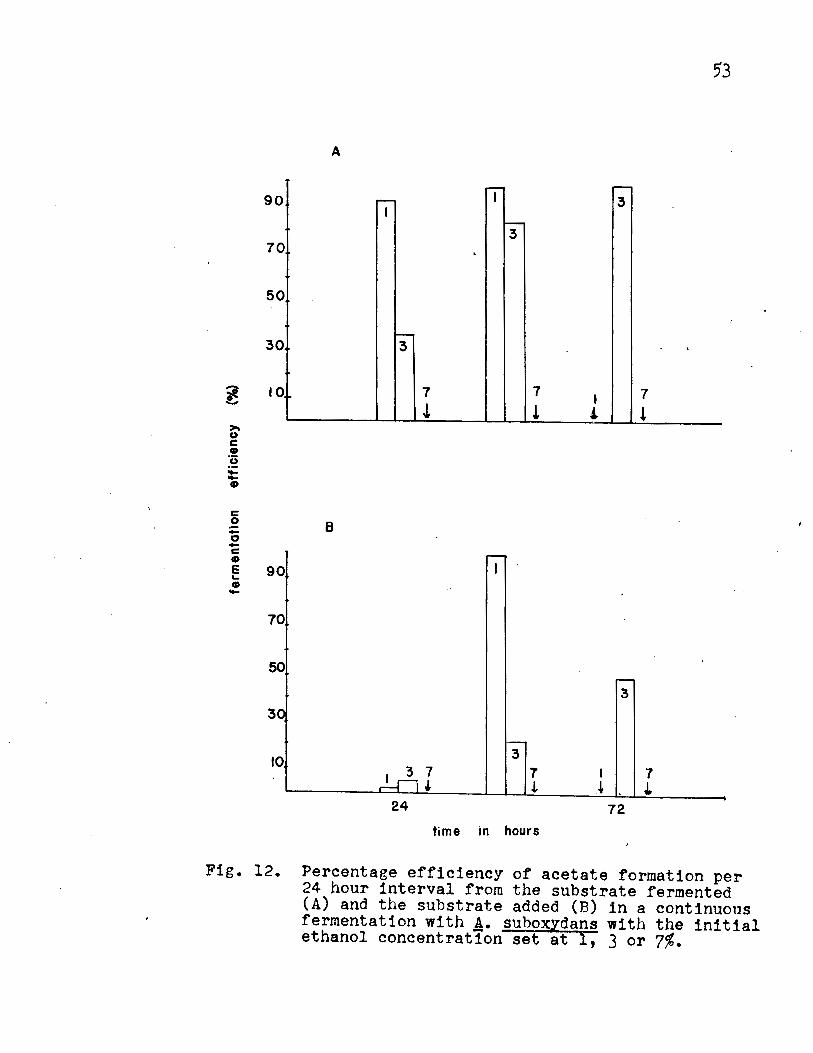
The percentage efficiency on the substrate fermented
(Fig. 12A, Appendix Table X) and the substrate added (Fig. 12B,
Appendix Table X) showed that at the 1% ethanol concentration,
approximately lOO% of the theoretical yield was obtained.
The 3% ethanol concentration reached 99% of the theoretical
yield calculated on the basis of the substrate fermented and
47.8% for the substrate added. No steady maximum rate of
oxidation was reached.

1%
! E
.......
ër-----·
H ----·'\-- pH ~ l \ ·-----:-.-u-rb-id_i_ty __
• ~·- acetate
15'0 A. :~~ 1-------: ~~
0
3%
7% -~ - -· ethanol ~. ·-
45 450 pH . . .
15 150
0 ---- -·-----·-----· turbidlty
acetate
24 72
time in hours
52
-0 E co 00 =-CD ~
CD ::r: 0 a. Q. :::1 ., e •• 0
• e ...... 1·5 300
4·5 240<
800
4·5 15100
1·5 1700
Big.ll. Effect of initial ethanol concentration on a continuous fermentation with A· suboxydans.
90
70
50
30
il 10 ->o 0 c • ·s --• c 0 :;: 0 -c • Ë 90 • -
70
50
3C
10
A
8
-,.- 1
1
.
1--3
7 J,
r--
I
,__ 3
1--3
7
!
7 J.
1 i
1 .~
,.-
3
24 72
time ln hours
7
l
7 L
53
Fig. 12. Percentage efficiency of acetate formation per 24 hour interval from the substrate fermented (A) and the substrate added (B) in a continuous fermentation with A. suhoxydans with the initial ethanol concentration set at 1, 3 or 7%.

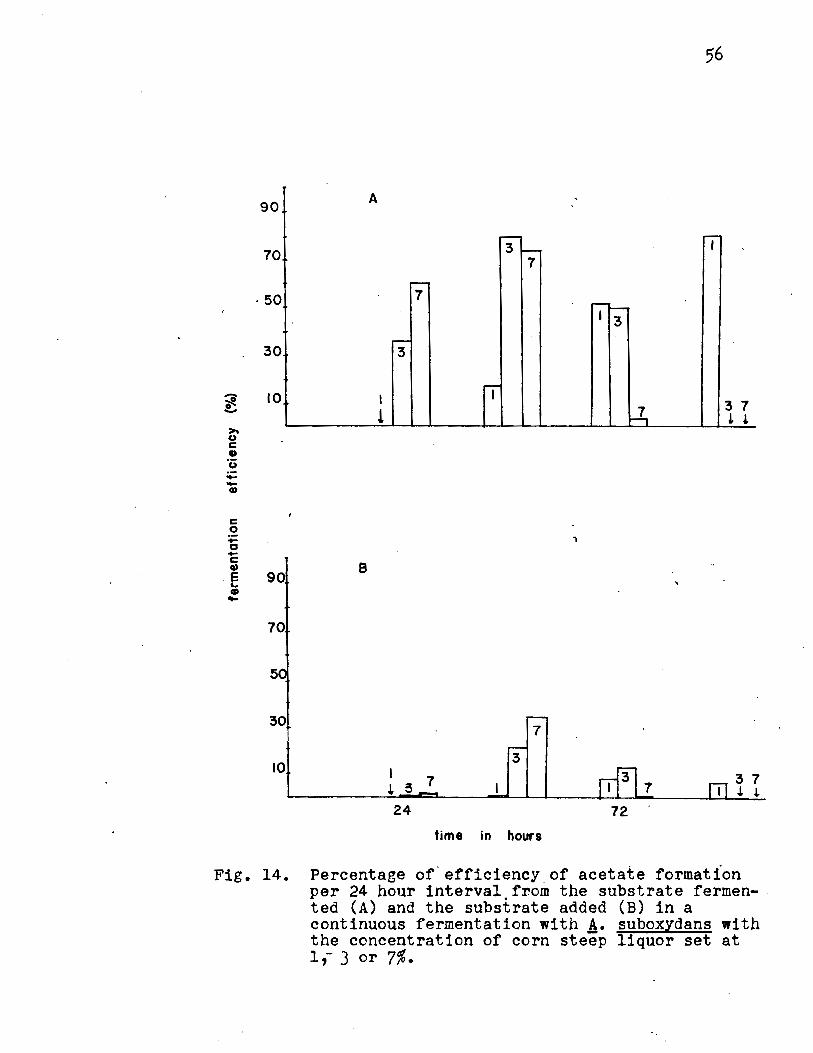
Effect of the Concentration of Corn Steep Liguor.
The concentrations of corn steep liquor studied were
·1, 3 and 7%. The results (Fig. 13, Appendix Table XI) in
dicated that low concentrations of corn steep liquor do not
faveur large yields of acetate. This fact, also evident at
low concentrations of tryptone (Appendix Table III) indicates
that low concentrations of the nitrogen source do not faveur
high acetate yields calculated on the basis of the substrate
added. Acetate formation is also accompanied by an increase
in turbidity and a decrease in pH and ethanol concentrations.
A slightly higher acetate yield was obtained at the 7% con
centration than at either the 1 or 3%.
The percentage efficiency calculated on the basis
of substrate fermented (Fig. 14A, Appendix Table XII) in
dicated that approximately 80% of the theoretical yield was
obtained for 3% corn steep liquor; the percentage efficiency
calculated on the basis of the substrate added (Fig. 14B,
Appendix Table XII) indicated that all concentrations of corn
steep liquor gave yields that were below 50% of the theoreti
cal yield. No steady rate of oxidation was reached.

1 (%)
e ·----·- ethanol _ -0 >.._ JL-------·----- -· -o- ·---- pH - ·-G) ·~ ;:~: ~ g ~ ~~ ------· turbidity - ~ .
; ; .~ E· c
E
:c o.
55
-oe 5o .r=o --G) .. - G) 0 o. ~
~ E ln 0 f E
15 150
0
~1·5
·-------· ~========~··==========~--------+-------~ '
800
3(%)
-· 45 450 _____ :~~ t::bidity
/~=-./ acetate --------- -·
4·5 240(
15 150 1·5 80(
0
15 150
turbidity _
45 450 -----·~/ /. • ·?'-·- . PH .
------· ·~;~ - / ' acetate
0
4· 5l240C
1·5 800
24 72
time in hours
Fig. 13. Effect of the concentration of corn steep liquor on a continuous fermentation with A· suboxydans.
90
70
·50
30
"ô 10 00::: -
c 0 -0 -c .,
. e 9o L. • ..
70
5
30
10
A
1 1
B
'
....-- ,-3 ,__ 7
r--7
.--~
1 3
...--3
,.... 1
ri, 3 7 L L
3
7 3 7
1 J. ~
1 ~ 3 7
24 72
time in hours
Fig. 14. Percentage of . efficiency _of acetate formation per 24 hour interval from the substrate fermen- . ted (A) and the substrate added (B) in a continuous fermentation with A. suboxydans with the concentration of corn steëp liquor set at 1,- 3 or 7%.

57
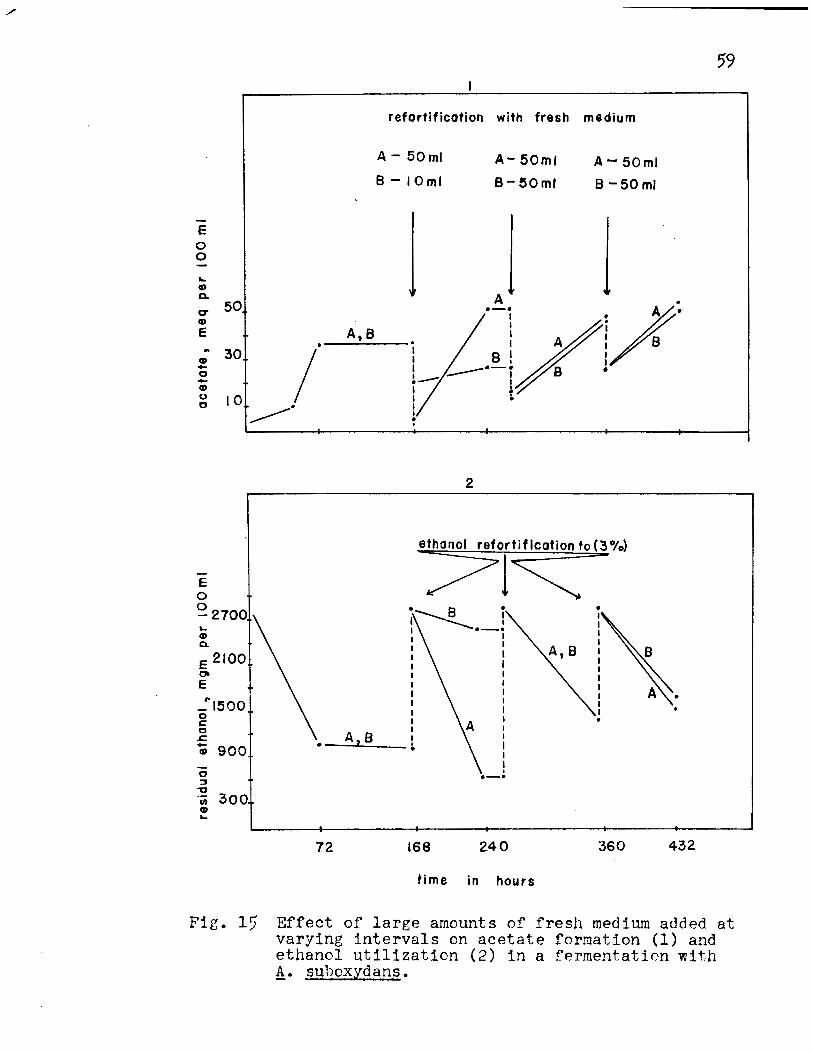
Effect of Addition of Large Volumes of Fresh Medium.
This experiment was organized to combine all of the
factors that were previously studied. The experiment was
separated into two parts, A and B, three flasks per experiment.
The results for acetate formation are presented in Fig. 15-1
Appendix Table XIII. After inoculation, the culture reached
its peak of oxidation at 72 hours and then entered a stationary
phase for 96 hours. At the end of this time (168 hours in
cubation time), 50 ml of broth were withdrawn and replaced by
fresh medium in Experiment A and 10 ml in Experiment B. After
72 hours, the peak of oxidation occurred (240 hours incubation
time) and 75.5% of the theoretical yield of acetic acid cal
culated on the basis of the substrate added (Fig. 16-2 Appendix
Table XIV) was obtained for A while 11.3% was obtained for B.
Experiments A and B were now treated in the same
manner; 48 hours after reaching the peak of oxidation (288
hours incubation time) 50 ml of broth were withdrawn and re
placed by 50 ml of fresh medium. The peak of oxidation oc
curred 72 hours after the refortification. (360 hours incuba
tion time) The percentage efficiency calculated on the basis
of the substrate added was 48.5% for A and 50.5 for B.
(Fig. 16-2, Appendix Table XIV)
One-half hour after the peak of oxidation 50 ml of
the broth were withdrawn and replaced by 50 ml of fresh medium

58
so that the stationary phase was extremely brief. The peak
of oxidation occurred 72 hours after the refortification.
(432 hours incubation time) The percentage efficiency cal
culated on the basis of the substrate added was 47.0 for A
and 40.5 for B. (Fig. 16-2, Appendix Table XIV)
The over-all percentage efficiency calculated on
the basis of the substrate added indicated that 76.1% was
obtained for Experiment A while 68.0% was obtained for Experi
ment B. The withdrawal of 50 ml of broth and replacement by
50 ml of fresh medium in both experiments gave uniform yields
of acetate. The highest rate (1.0 mgm/ml/hr)of oxidation
of ethanol to acetate occurred at 240 hours. The corresponding
decrease in ethanol concentration during oxidation to acetate
is shown in Fig. 15-2, Appendix Table XIII.
E 0 0
... G)
Q.
C7' 50 G)
E
; 30 -0 -G)
refortificotion with fresh medium
A- 50 ml
B- IOml
A- 50ml
B-50ml
A- 50ml
B -50 ml
J j . 1 ~·-• B • !__....-: ~ 1 ~
u 0
/• __ A,'--8 __ 1 J/A !/'
0 1 ~ 1 • 1
E
L. G)
Cl.
E 2100 a> E
_"t500 0 c 0 .c -; 900
~ ~
2
ethanol reforti flcation to (3 %)
71~ ~~ i ·-
•
A,B
72 168 240 360 432
time in hours
59
Fig. 15 Effect of large amounts of fresh medium added at varying intervals on acetate formation (1) and ethanol utilization (2) in a fermentation with f!. suhoxydans.

90
70
50
30
~ 10
--Cll
C" 0 -0
c c;:
E
-
' ' 1
r '
l.
..---A 8
-72
60
A 8
---- -- ____ _._ __ ......
2
r--
A
.---T 1 A B
1 r--
1 B
1
~ 240 3()0 432
time in hours
Fig . 16. Percentage efficiency of acetate format.ion as affefted by addition of fresh medium (as described in Fig . 1 5) in a fermentation with ~· suboxvdans.
1 - Calculated on basis of suhstrate f ermented. 2 - Calculated en basis of substrate added .
v
DISCUSSION
61
The oxidation of ethanol to vinegar, with its active
chemical ingredient as acetate, is of great importance be
cause edible vinegar, by law, must be of biological origin.
The main reason for this is that the characteristic flaveur
of vinegar develops during the fermentation and it is diffi
cult to create an artificial flaveur that is satisfactory as
would be required in the synthetic process. There is, there
fore, no competition from the chemical industry though acetate
can be manufactured synthetically from acetylene or by the
catalytie oxidation of ethanol. One advantage of all syn
thetic processes is that there is no difficulty in coneentrat
ing the acetate to any strength while ordinary vinegar must
undergo careful chemical processing before a eoncentrated pro
duct can be obtained. Synthetic acetate is used, not for
edible purposes, but for the manufacture of cellulose acetate,
white lead, for precipitating casein from milk, for precipi
tating the latex from natural rubber and for numerous other
purposes.
Vinegar production, however, is essentially an aerobic
fermentation. Two mechanisms of production have been proposed
in the literature, and the process whereby molecular
oxygen acts as the hydrogen accepter appears to be the more
tenable one. All the mechanisms proposed show that 1 mole of
ethanol is converted to 1 mole of acetate.
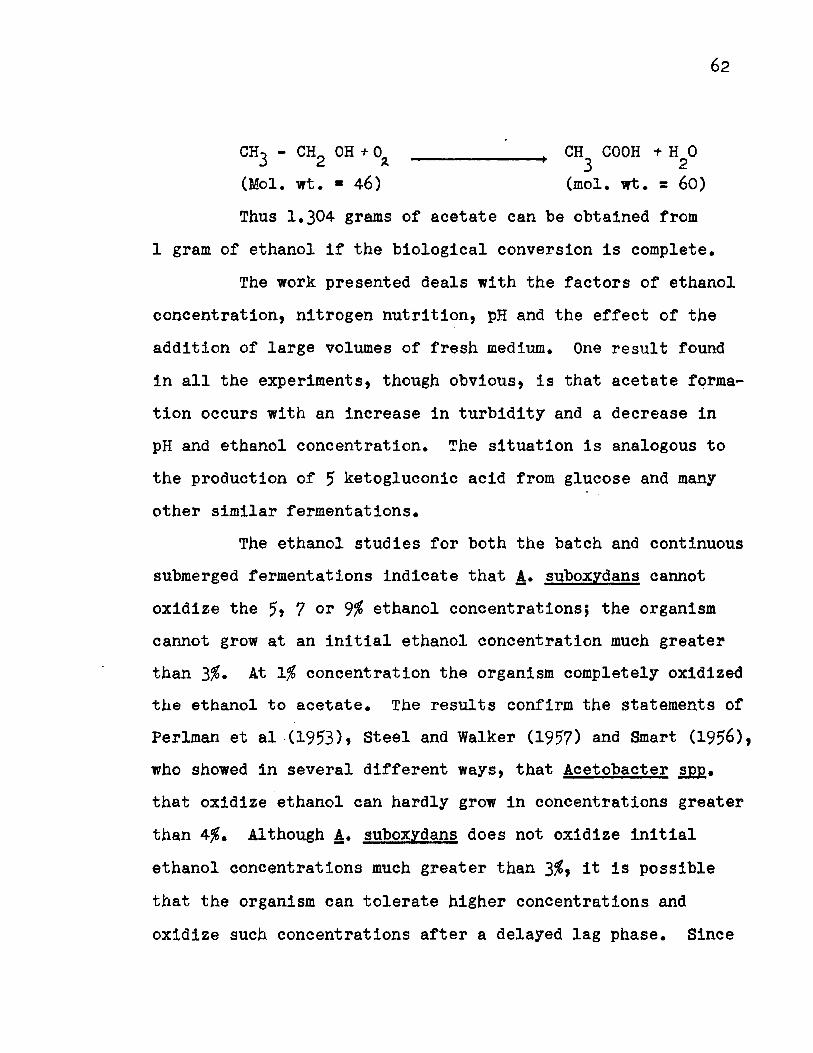
CH3 - CH2 OH + o,. (Mol. wt. • 46)
CH COOH + H 0 3 2
(mol. wt. = 60)
Thus 1.304 grams of acetate can be obtained from
1 gram of ethanol if the biological conversion is complete.
The work presented deals with the factors of ethanol
concentration, nitrogen nutrition, pH and the effect of the
addition of large volumes of fresh medium. One result round
in all the experiments, though obvious, is that acetate forma
tion occurs with an increase in turbidity and a decrease in
pH and ethanol concentration. The situation is analogous to
the production of 5 ketogluconic acid from glucose and many
other similar fermentations.
The ethanol studies for both the batch and continuous
submerged fermentations indicate that !· suboxydans cannot
oxidize the 5, 7 or 9% ethanol concentrations; the organism
cannot grow at an initial ethanol concentration much greater
than 3%. At 1% concentration the organism completely oxidized
the ethanol to acetate. The results confirm the statements of
Perlman et al (1953), Steel and Walker (1957) and Smart (1956),
who showed in several different ways, that Acetobacter ~·
that oxidize ethanol can hardly grow in concentrations greater
than 4%. Although A· suboxydans does not oxidize initial
ethanol concentrations much greater than 3%, it is possible
that the organism can tolerate higher concentrations and
oxidize such concentrations after a delayed lag phase. Since

the Food and Drug Act in Canada requires that the concentra
tion of acetate present in vinegar should not be less than
4.1%, an ethanol concentration of least 3.1% should be used
to obtain the minimum desired strength.
The nitrogen nutrition of this organism appears to
be of paramount importance. The results indicate that low
concentrations of the nitrogen source do not favour high
acetate yields; thus it appears that the available nitrogen
might be a limiting factor. Corn steep liquor and tryptone
botb gave good growth and high yields of acetate; the liquor
has the advantage that it is relatively cheap and the addition
of synthetic growtb factors are unnecessary; tryptone, on the
contrary, is an expansive product, and requires several growth
factors for adequate growth of the organism. In general 3%
corn steep liquor or 0.1% tryptone concentration appears to
be satisfactory for supporting the growth of A· suboxYdans in
fermenting 3% ethanol. Rao and Stokes (1953) showed that the
available carbon source greatly influences the nitrogen require
ment of Acetobacter species; thus future studies of the inter
action between the types of carbon and nitrogen sources appear
to be justified. The supplementary sources of nutrient -
autolysed yeast and malt extract - supported the growth of
A· suboXfdans quite satisfactorily. Allegeier et al (1954)
used media containing either antolysed yeast and corn steep
liquor or autolysed yeast and Diamalt and obtained good
results.
64
The pH studies clearly indicate that A. suboxydans
grows from pH 3.0 to pH 5.0. At pH 3.0, however, growth of
the organism did not occur until 96 hours showing that low
pH induces a prolongation of the lag phase. Tosic and
Walker (1946 Part II) also reported that species of
Acetobacter, one of which was A· suboxydans, show marked
retardation of growth at pH 3.0 and no growth at pH 2.5.
These workers also reported that A. suboxydans had an optimum
growth range between 4.5 and 6.0. The present studies do not
confirm this latter report because the optimum pH for this
organism was found to be 4.25. The pH values 4.0 and 5.0 show
uniform acetate yields based on the substrate fermented and the
substrate added. At these latter pH values no further acetate
was formed after 48 hours. These results indicate that the pH
value 4.25 is best suited for the oxidation of ethanol to
acetate with A. suboxYdans.
The previous experiments show that if 5 ml, from a
submerged culture, that had already reached its stationary
phase, are inoculated into fresh medium, as at the start of
a new experiment, the inoculated culture reaches its peak of
oxidation in either 48 or 72 hours. Evidently the number of
cells in an old culture is not as important as the volume of
'fresh medium added; thus fresh nutrient has a revitalizing
, effect on the fermentation and therefore causes a rapid
formation of young cells. Consequently, two simultaneous
experiments were organised, A and B, three flasks per expert
ment. The difference between the values obtained for the
theoretical yield, based on the substrate added (240 hours in
cubation time) was enormous - 75.5% for Experiment A and 11.3%
for Experiment B. Subsequent withdrawals of 50 ml of broth and
addition of 50 ml of fresh medium to both Experiments A and B
indicate that uniform rates of oxidation occurred. The per
centage efficiencies based on substrate fermented showed that
almost all the ethanol was converted to acetate, 90% or over in
all trials. This experiment, using addition of large volumes of
fresh medium to a culture in the stationary phase, could be
criticized because of the number of variables involved. What
is important, however, is the fact that the stationary phase
can be decreased and a point reached whereby continuons with
drawal of the product and addition of fresh nutrient would
create a steady rate of oxidation by the organism. This is in
deed, the main object of this investigation - to induce the or
ganism to attain a maximum rate of oxidation of ethanol to
acetate so that biological commercial production could be in
creased with a decrease in the fermentation time. In this latter
respect, the continuous submerged fermentation is of greater im
portance than the batch method. One great disadvantage of the

66
pontinuous submerged fermentation method is that contamination
could be hazardous, but this does not present a difficult
problem in the vinegar fermentation since most ether species
of bacteria cannot grow at such low pH values. The advantages
of continuons submerged fermentation greatly outweigh its dis
advantages; for instance, there is a marked reduction in fer
mentation time as is clearly illustrated by the 96 hours re
quired for the peak of oxidation in the batch fermentation
studies compared to 48 or 72 hours for the continuous fermen
tation studies; also, the factors such as pH and nutrient can
be studied without changing the conditions as is characteristic
of the batch fermentation; finally,the fact that a steady rate
of oxidation is possible makes the continuous submerged fermen
tation method superior to the batch fermentation method, to the
extent that manufacturers of vinegar might turn to this method
of production for higher yields.
Severa! investigators report rates of acetate forma
tion from ethanol in different ways. The following data compare
the rates of oxidation found in sorne of the work of these in
vestigators to the rate found in t his present work.
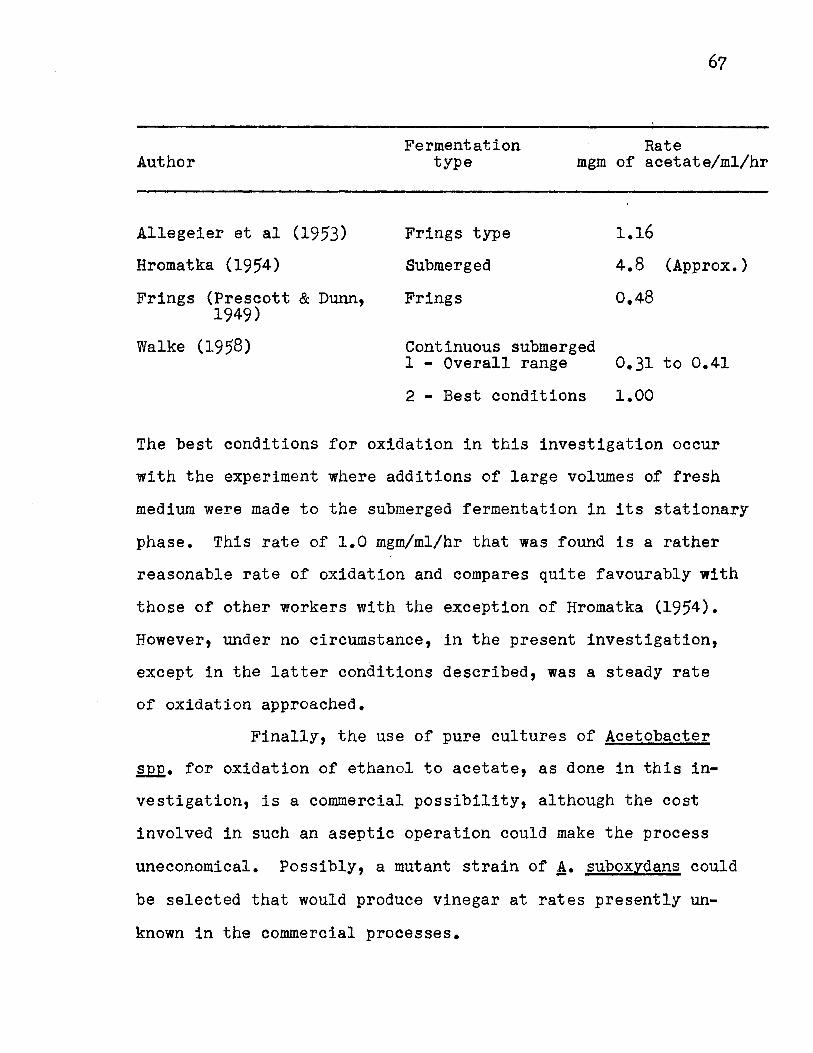
Rate Author
Fermentation type mgm of acetate/ml/hr
Allegeier et al (1953) Frings type 1.16
Hromatka (1954) Submerged 4.8 (Approx.)
Frings (Prescott & Dunn, Frings 0.48 1949)
Walke (1958) Continuous submerged 1 - Overall range 0.31 to 0.41
2 - Best conditions 1.00
The best conditions for oxidation in this investigation occur
with the experiment where additions of large volumes of fresh
medium were made to the submerged fermentation in its stationary
phase. This rate of 1.0 mgm/ml/hr that was found is a rather
reasonable rate of oxidation and compares quite favourably with
those of other workers with the exception of Hromatka (1954).
However, under no circumstance, in the present investigation,
except in the latter conditions described, was a steady rate
of oxidation approached.
Finally, the use of pure cultures of Acetobacter
~· for oxidation of ethanol to acetate, as done in this in
vestigation, is a commercial possibility, although the cost
involved in such an aseptic operation could make the process
uneconomical. Possibly, a mutant strain of A· suboxydans could
be selected that would produce vinegar at rates presently un-
known in the commercial processes.

VI
SUMMARY
A· suboxydans can oxidize ethanol to acetate quite
satisfactorily, using the submerged fermentation method,
when autolysed yeast and malt extract are used as supple
mentary sources of nutrients.
A· suboxydans in beth the batch and continuous fermen
tation methods, gives high acetate yields at 1 or 3% ethanol
concentration but not at the 5 or 7% levels.
A· suboxYdans oxidizes 3% ethanol to acetate in medium
containing 0.1% tyrptone or 3% corn steep liquor. These
concentrations of the nitrogen source appear to be minimal
values since lower concentrations do not faveur high acetate
yields.
A· suboxydans grows at pH values between 3.0 and 5.0.
No growth occurs below pH 3.0 or above pH 6.0. The optimum
pH value is 4.25.
Addition of large volumes of fresh medium containing
ethanol faveur rapid oxidation of the ethanol thereby giving
high yields of acetate.
68
The continuous submerged method of fermentation is
superior to the batch fermentation method because higher uni
form rates of oxidation of ethanol to acetate were found.
This accompanied higher fermentation efficiencies based on
either the amount of ethanol fermented or the amount added.

VII
REFERENCES
ALLEGEIER, R.J., WISTHOFF, R.T. and HILDEBRANDT, F.M.
1953 Pilot plant vinegar generatcrs. Ind. and Eng. Chem. 45: 489-494
----------·-· 1954 Packing for vinegar generators.
Ind. and Eng. Chem. 45: 2023-2026
BADDILEY, J., TRAIN, E.M., NOVELLI, G.D. and LIPWÂNN, F.
1953
BRANNT, W.T.
Structure of Co-Enzyme A. Nature 171: 76
1900 A practical treatise on the manufacture of vinegar and acetates, eider, fruit and wines and the preservation of fruits, vegetables, meat, fish and eggs. (2nd Edition) Henry Carey Band & Co., Phila., Pa.
BFEED, R.S., MURRAY, E.G.D. and SMITH, A.P.
1957
CONWAY, E.J.
Bergey's Manual of Determinative Bacteriology. (7th Edition) The Williams and Wilkins Co., Baltimore.
1947 Micro-diffusion analysis and volumetrie errer. Crosby, Lockwood and Son, London, E.C. 4.
FRATEUR, J.
1950 Essai sur la systematique des Acetobacters. La Cellule, 53.
Ft~MEP, E.I., BANTZ, A.C. and UNDERKOFLER, L.A.
1944 The use of alfalfa extract to supply nutrients for the growth of Acetobacter suboxydans. Iowa State Coll. Journ. Sei. 18: No. 4 369-376

70
HALL, A.N., TIWARI, K.S. and WALKER, T.K.
1952 The influence of pH value and of carbon source on the Nutritional Requirements of Acetobacter suboxydans. Biochem. J. (London) 51: 36
HANSEN, A.E.
1935 Making vinegar by the Frings process. Food Ind. 7: 277-312
HROMATKA, O. and EBNER, H.
1950
1954
Researches in vinegar fermentation. Biol. Abs. Vol. 24: No. 11 (33561)
Procedure for the production of carboxy11c acids. Austrian patent No. 179283.
KARABINOOS, J.V. and DICKEN, M.
1944 The Isolation of Nicotinic Acid from Mi1k and its Ro1e as an Essential Growth Factor for A. suboxydans. Arch. Eiochem. 4: 211 -
LAMPEN, J.o., UNDPRKOFLER, L.A. and PETERSON, W.H.
1942 p-Aminobenzoic acid. A growth factor for Acetobacter suboxYdans. J. Biol. Chem. 146: 277-278
LIEFSON, E.
1954 The flagellation and taxonomy of species of Acetobacter. Antonie van Leeuwenhoek. J. M1crobio1. Serol. 20: 102-110
LIGGETT, R.W. and KOFFLER, H.
1948 Corn steep liquor in microbiology. Bact. Rev. 12: 297-311
MAXON, WILLIAM D.
1955 Continuous fermentation. App. Micro. 3: 110-122
71
NEISH, A.C.
1952 Ana1ytica1 methods for bacterial fermentations. National Research Council No. 2952, Ottawa.
PERLMAN, D., TEMPEL Jr. A.E. and BROWN, W.E.
1953 Fermentation. Ind. and Eng. Chem. 45: 1944-1969.
PRESCOTT, S.C. and DUNN, C.G.
1949 Industrial Microbio1ogy. (2nd Edition) McGraw Hill Book Co. Inc., N.Y.
RAO, M.R.R. and STOKES, J.L.
1953
RAO, M.R.R.
1957
Utilization of ethanol by acetic acid bacteria. J. Bact. 66: 634-638.
Acetic acid bacteria. Ann. Rev. Micro. 11: 317-338.
RAINBOW, C.
1953
and MITSON, G.W.
SHIMWELL, J.L.
1939
Nutritional requirements of acetic acid bacteria. J. Gen. Microbiol. 9: 371-375.
Some facts and fallacies in brewing bacteriology. Wallerstein Labs. Comm. 2: 55.
1948 Brewing Bacterio1ogy IV. The acetic acid bacteria. Wallerstein Labs. Comm. 11: 27-39.
SMART, C.E.
1956 Rates of acetic acid formation. PhD. Thesis. McGill University.

SMYTH, H.F. and OBOLD, W.L.
1930 The utilization of Bacteria, Yeast and Molds in industrial processes. The Williams and Wilkins Co., Baltimore.
SOLTERO, F.V. and JOIDfSON, M.J.
72
1954 Continuous addition of glucose for evaluation of penicillin producing cultures. App. Micro. 2: 41-44
STANIER, R.Y. and van NIEL, C.B.
1941 The main outlines of bacterial classification. J. Bact. 42: 437-466
STEEL, R.S. and WALKER, T.K.
1957 Â comparative study of cellu1ose-producing cultures and ce1lulose-1ess mutants of certain Acetobacter ~· J. Gen. Micro. 17: 445-452
STOKES, J.L. and LARSEN, A.
1945 Amine acid requirements of Acetobacter suboxydans J. Bact. 49: 495-501
TOSIC, J. and WALKER, T.K.
1946 Part I - A procedure for the characterization of the acetic acid bacteria. J. Soc. Chem. Indus. 65: 104-107
1946 Part II - A procedure for the characterization of the acetic acid bacteria. J. Soc. Chem. Indus. 65: 180-184
TREVELLYAN, W.E., PROCTER, D.P. and HARRISON, J.S.
1950 Detection of sugars on paper chromatography. Nature 166: 444
UNDERKOFLER, L.A. and HICKEY, R.J.
1954 Industria1 fermentation. Chem. Pub. Co. Inc., N.Y.

UNDERKOFLER, L.A., BANTZ, A.C. and PETERSON, W.H.
1943
VAUGHN, R.H.
1942
Growth factors for bacteria. J. Bact. 45: 183-190.
The acetic acid bacteria. Wa11erstein Labs. Comm. 5: 5-26.
WALKER, T.K. and TOSIC, J.
1946 The characterization and identification of acetic acid bacteria. Journ. Inst. Brew. 52: 238-249.
WALKER, T .K. and KULKA, D.
73
1949 Comparative studies of Acetobacter ~· with particular reference to beer contaminants. Wa1lerstein Labs. Comm. 12: 7-28.

VIII
APPENDIX TABLES
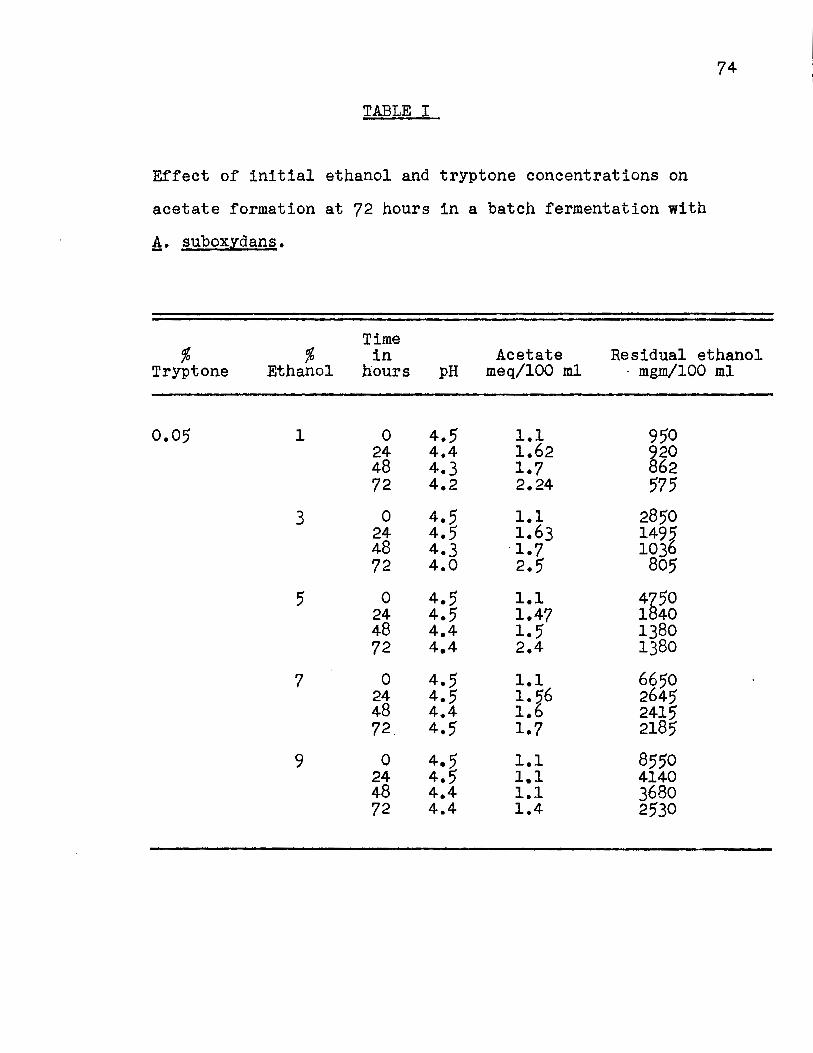
TABLE I
Effect of initial ethanol and tryptone concentrations on
acetate formation at 72 hours in a batch fermentation with
A· suboxydans.
Ti me
74
% % in Acetate Residual ethanol Tryptone Ethanol hours pH meq/100 ml · mgm/100 ml
0.05 1 0 4.5 1.1 950 24 4.4 1.62 ~20 48 4.3 1.7 62 72 4.2 2.24 575
3 0 4.5 1.1 2850 24 4.5 1.63 1495. 48 4.3 ·1.7 1036 72 4.0 2.5 805
5 0 4.5 1.1 4~50 24 4.5 1.47 1 40 48 4.4 1.5 1380 72 4.4 2.4 1380
7 0 4.5 1.1 6650 24 4.5 1. 5.6 2645 48 4.4 1.6 2415 72 4.5 1.7 2185
9 0 4.5 1.1 8550 24 4.5 1.1 4140 48 4.4 1.1 3680 72 4.4 1.4 2530

75
TABLE I Continued
Time % % in Acetate Residual ethanol
Tryptone Ethanol hours pH meq/100 ml mgm/100 ml
0.1 1 0 4.5 1.1 905 24 4.1 3.96 805 48 3.1 12.0 575 72 2.9 13.9 230
3 0 4.5 1.1 2850 24 4.1 3.9 862 48 3.0 33.2 230 72 2.7 5o.o 115
0 4.5 1.1 4~50 24 4.5 1.~ 1 40 48 4.2 1. 14~5 72 4.1 2.5 13 0
7 0 4.5 1.1 6650 24 4.5 1.56 1840 48 4.5 1.6 1380 72 . 4.5 1.9 1265
9 0 4.5 1.1 8550 24 4.5 1.68 2645 48 4.5 1.67 2415 72 4.5 1.95 2185

.TABLE I Cont inued
Time %
Tryptone % in Acetate Residual ethanol
Ethanol ,hours pH meq/100 ml mgm/100 ml
0.3 1 0 4.5 1.1 é50 24 4.5 1.65 62 48 4.4 1.7 575 72 3-7 7.2 515
3 0 4.5 1.1 2850 24 4.5 1.~ 14é5 48 4.4 1. 13 0 72 3-7 12.5 1265
5 0 4.5 1.1 4750 24 4.5 1.82 1980 48 4.4 1.86 1495 72 4.5 2.5 1265
7 0 4.5 1.1 6650 24 4.5 3.3 2530 48 4.4 5.1 2300 72 4.3 5.0 2185
9 0 4.5 1.1 8550 24 4.5 1.2 3105 48 4.3 1.5 1980 72 4.2 1.7 1840

77
1'ABLE II
The percentage etficiency of acetate formation calculated
tor 72 hours on the basis of substrate fermented and
substrate added in a batch fermentation with !• suboxYdans
at 72 hours suppl1ed with different ethanol concentrations.
% . % Percentage efficiencY Tryptone Ethanol Substrate fermented Substrate added
0.05 1 27.4 10.8 3 5.6 4.0 5 3.2 2.3 7 0 0 9 0 0
0.1 1 ~1.7 66·~ 3 4.1 8 r,
5 3.4 2.4 7 0 0 9 0 0
0.3 1 86.7 3é·7 3 33.3 1 .5 5 3.4 2.4 7 0 0 9 0 0

78
TABLE III
Effect of tryptone concentration on acetate formation in
a batch fermentation of 3% ethanol with A· suboxYdans.
Time % in Acetate Turbidity Residual ethanol
Tryptone hours pH meq/100 ml nehpelos/ml mgm/100 ml
0.01 48 3.4 26.7 68 1265 72 3.1 29.6 84.0 1070 96 3.0 32.6 84.1 993
0.1 48 3.2 32.6 100 1135 72 2.9 45' .1 104 750 96 2.9 47.0 106 425
0.3 48 3.2 34.2 99 875 72 3.1 38.6 102 590 96 3.1 45.0 108 400
3.0 48 3.6 27.6 92 1137 72 3.2 43.0 lOi 650 96 3.2 45.0 10 420
4.0 48 4.4 9.0 20 400 72 4.2 9.6 22 2100 96 3.9 22.0 68 1561

79
TABLE IV
Percentage efficiency of acetate formation calculated
on the basis of substrate fermented and substrate added
in a batch fermentation with A· suboxydans supplied with
0.01 or 0.1% tryptone.
% Tryptone
o.o1
0.1
Time in hours
48
72
96
48
72
96
Perpentage efficiencY Substrate fermented Substrate added
77.5 43.1
76.5 47.7
79.3 51.6
87.4 52.6
98.4 72.8
89.1 76.1
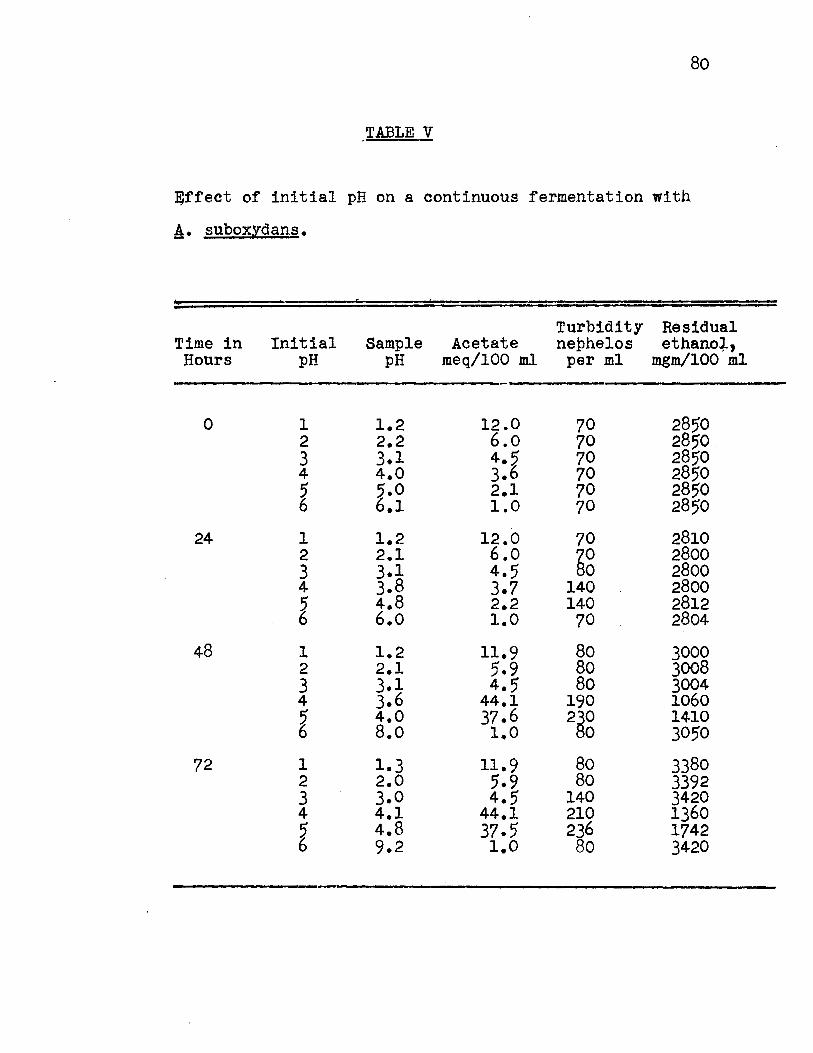
80
TABLE V
~ffect of initial pH on a continuous fermentation with
A· suboxYdans.
Turbidity Residual Time in Initial Sample Acetate nephelos ethano~, Hours pH pH meq/100 ml per ml mgm/100 ml
0 1 1.2 12.0 70 2850 2 2.2 6.0 70 2850 . 3 3.1 4.5 70 2850 4 4.0 3.6 70 2850 g 5.0 2.1 70 2850
6.1 1.0 70 2850
24 1 1.2 12.0 70 2810 2 2.1 6.0 ~g 2800 3 3.1 4.5 2800 4 3.8 3.7 140 2800 g 4.8 2.2 140 2812
6.0 1.0 70 2804
48 1 1.2 11.9 80 3000 2 2.1 5.9 80 3008 3 3.1 4.5 80 3004 4 3.6 44.1 190 1060 g 4.0 37.6 2~g 1410
8.0 1.0 3050
72 1 1.3 11.9 80 3380 2 2.0 5.9 80 3392 3 3.0 4.5 140 3420 4 4.1 44.1 210 1360 g 4.8 37.5 236 1742
9.2 1.0 80 3420

Time in hours
Initial pH
1 2 3 4
l
TABLE V Continued
Sample pH
1.3 1.9 2.5 4.0 4.9
10.0
Turbidity Acetate nephelos
meq/100 ml per ml
11.8 5.7
30.0 44.0 37.5 1.0
80 80
190 210 2~g
81
Residual ethanol,
mgm/100 ml
3600 3610 2310 1o1o 1990 3647
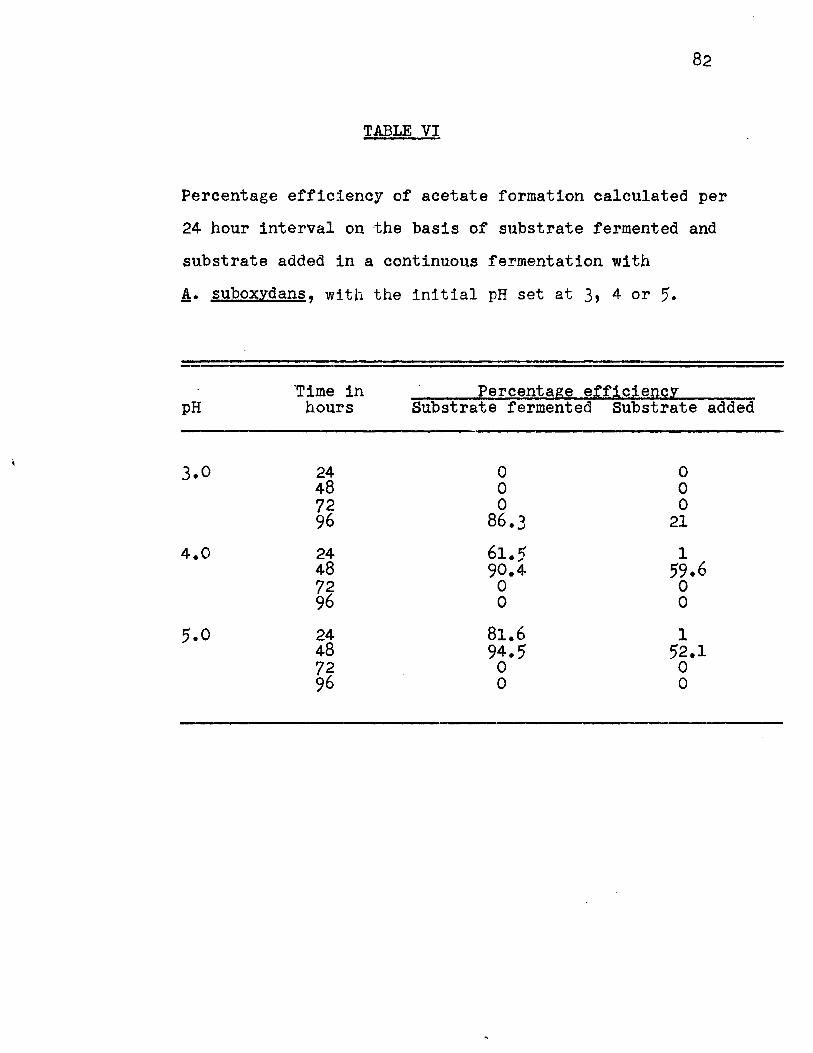
TABLE VI
Percentage efficiency of acetate formation calculated per
24 hour interval on the basis of substrate fermented and
substrate added in a continuous fermentation with
A· suboxydans, with the initial pH set at 3, 4 or 5.
pH
3.0
4.0
5.0
"Time in hours
24 48 72 96
24 48 72 96
24 48 72 96
Percentage efficiencY Substrate fermented Substrate added
0 0 0 0 0 0
86.3 21
61.5 1 90.4 59.6
0 0 0 0
81.6 1 94.5 52.1
0 0 0 0
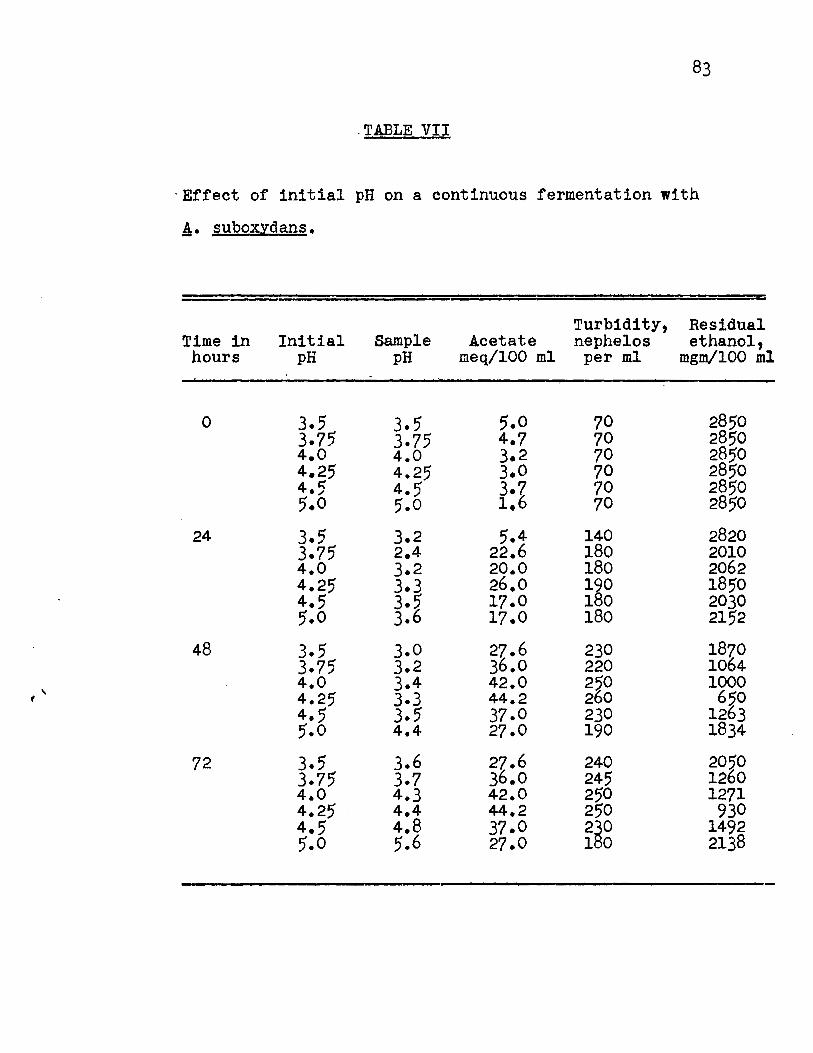
' ~
. TABLE VII
· Effect of initial pH on a continuous fermentation with
A· suboxYdans.
Time in hours
0
24
48
72
Initial pH
3.5 3.75 4.0 4.25 4.5 5.0
3.5 3.75 4.0 4.25 4.5 5.0
3.5 3.75 4.0 4.25 4.5 5.0
3.5 3.75 4.0 4.25 4.5 5.0
Sample pH
3.5 3.75 4.0 4.25 4.5 5.0
3.2 2.4 3.2 3.3 3.5 3.6
3.0 3.2 3.4 3·3 3.5 4.4
3.6 3.7 4.3 4.4 4.8 5.6
Acetate meq/100 ml
5.0 4.7 3.2 3.0 3.7 1.6
5.4 22.6 20.0 26.0 17.0 17.0
27.6 36.0 42.0 44.2 37.0 27.0
27.6 36.0 42.0 44.2 37.0 27.0
Turbidity, nephelos
per ml
70 70 70 70 70 70
140 180 180 1é0 1 0 180
230 220 220 260 230 190
240 245 250 250 2~0 1 0
Residual ethanol,
mgm/100 ml
2850 2850 2850 2850 2850 2850
2820 2010 2062 1850 2030 2152
1870 1064 1000
650 1263 1834
2020 1260 1271
930 1492 2138
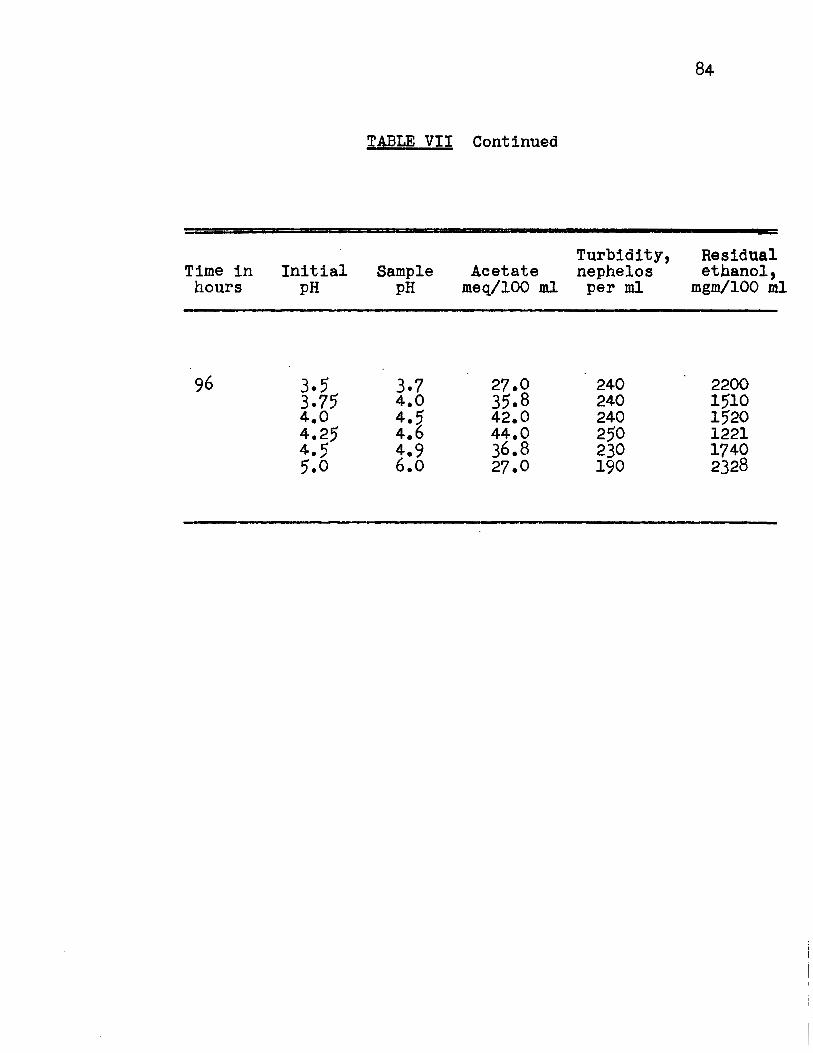
Time in hours
96
Initial pH
3.5 3.75 4.0 4.25 4.5 5.0
T4BLE VII Continued
Sample pH
3.7 4.0 4.5 4.6 4.9 6.0
Turbidity, Acetate nephelos
meq/100 ml per ml
27.0 240 35.8 240 42.0 240 44.0 250 36.8 230 27.0 190
84
Residual ethanol,
mgm/100 ml
2200 1510 1520 1221 1740 2328

TABLE VIII
Percentage efficiency of acetate formation ca1cu1ated per
24 hours interva1 on the basis of substrate fermented and
substrate added in a continuous fermentation with
A· suboxYdans, with the pH set as indicated.
pH
3.5
3·75'
4.0
4.25'
4.5'
5.0
Time in hours
24 48 72 96
24 48 72 96
24 48 72 96
24 48 72 96
24 48 72 96
24 48 72 96
Percentage efficiencY Substrate fermented Substrate added
61.5 o.6 99.0 40.3 0 0 0 0
98.0 28.9 100.0 54.2
0 0 0 0
98.1 2~.2 99.8 5 .2 0 0 0 0
100.0 i7.2 99.4 9.8 0 0 0 0
98.9 28.4 99.4 46.3 0 0 0 0
9é·' 24.4 9 .5' 25.8 0 0 Q 0

86
TABLE IX
Effect of initial ethanol concentration on a continuous
fermentation with A. suboxYdans.
% Time in Acetate TurbiditY Residual ethanol Ethanol _hours pH .meq/100 ml .nephelos/ml . mgm/100 ml
1 0 4.~ 1.0 45 950 24 3. 0.4 50 930 48 3.1 20.1 190 5 72 3.1 20.0 220 260 96 3.1 20.1 220 490
3 0 4.3 1.0 45 2850 24 3.9 2.4 47 25é6 48 3.2 14.6 140 19 0 72 2.9 36.6 250 1100 96 2.9 36.0 250 1392
7 0 4.3 1.0 45 6650 24 4.0 0.2 46 6,300 48 3.9 0.3 47 6280 72 3.9 0.3 47 6400 96 3-9 0.3 47 6620
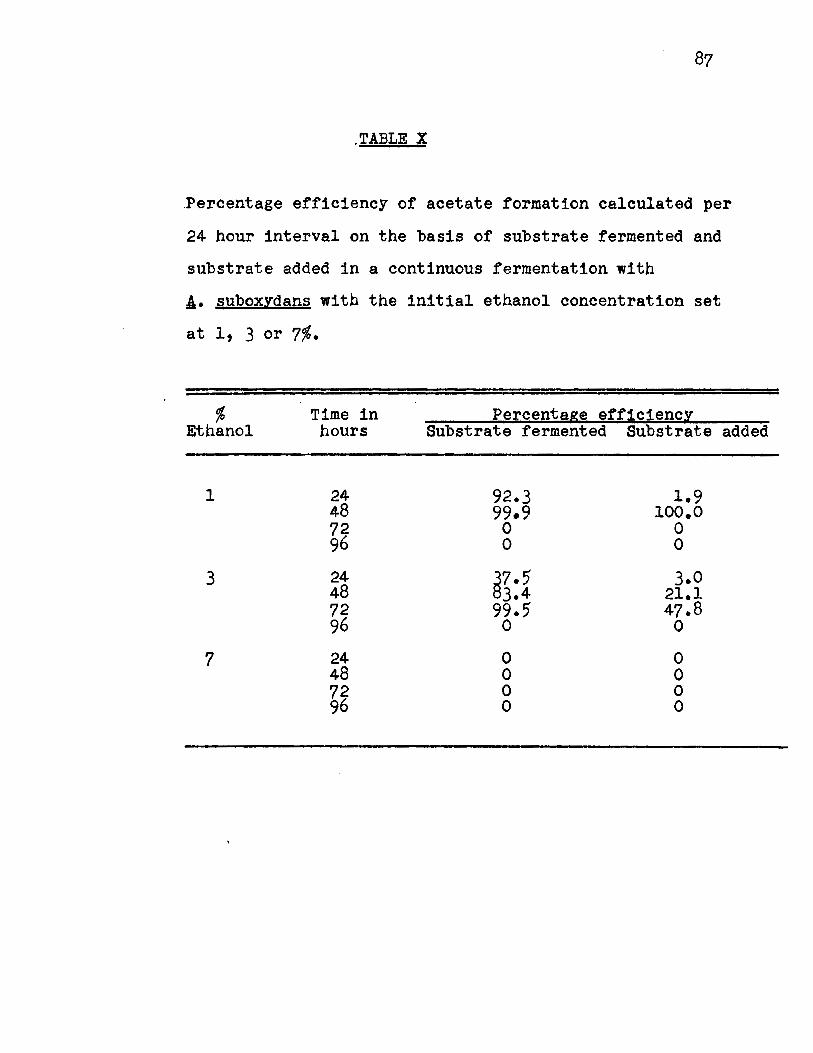
.TABLE X
.Percentage efficiency of acetate formation calculated per
24 hour interval on the basis of substrate fermented and
substrate added in a continuons fermentation with
A· suboxYdans with the initial ethanol concentration set
at 1, 3 or 7%.
% Ethanol
1
3
7
Time in hours
24 48 72 96
24 48 72 96
24 48 72 96
Percentage efficiencr Substrate fermented Substrate added
92.3 1.9 99.9 100.0
0 0 0 0
~7.5 3.0 3.4 21.1
99.5 47.8 0 0
0 0 0 0 0 0 0 0

88
TABLE XI
Effect of the concentration of corn steep liquor on a
continuous fermentation with A· suboX1dans.
Corn steep Time in Acetate Turbidity Residual ethanol . liquor hours . pH . meq/100 ml nephelos/ml · mgm/100 ml
1 0 4.4 1.0 190 285'0 24 4.4 1.0 190 2800 48 4.3 3.0 266 2630 72 3.9 9.2 360 245'0 96 3.7 14.4 440 25'00
3 0 4.4 1.0 190 285'0 24 4.~ 1.4 266 2802 48 3. 17.2 422 2270 72 3.5 25.0 512 1900 96 3.5 25'.0 5'20 2200
7 0 4.4 1.0 190 2850 24 4.4 1.8 210 2790 48 3.6 25.6 520 1704 72 3.4 27.4 540 135'0 96 3.4 27.3 542 1704

TABLE XII
Percentage efficiency of acetate formation ca1cu1ated per
24 hour interva1 on the basis of substrate fermented and
substrate added in a continuous fermentation with
A· suboxYdans with the concentration of corn steep 1iquor
set at 1, 3 or 7%.
% Corn steep
11quor
1
3
7
Time in hours
24 48 72 96
24 48 72 96
24 48 72 96
Percentage efficiency Substrate fermented Substrate added
0 0 17.3 2.9 g3.9 é·6 2.1 .5
~7.0 o.6 1.7 23.0
51.7 13.9 0 0
61.5 1.2 76.6 36.8 2.6 0.9 0 0
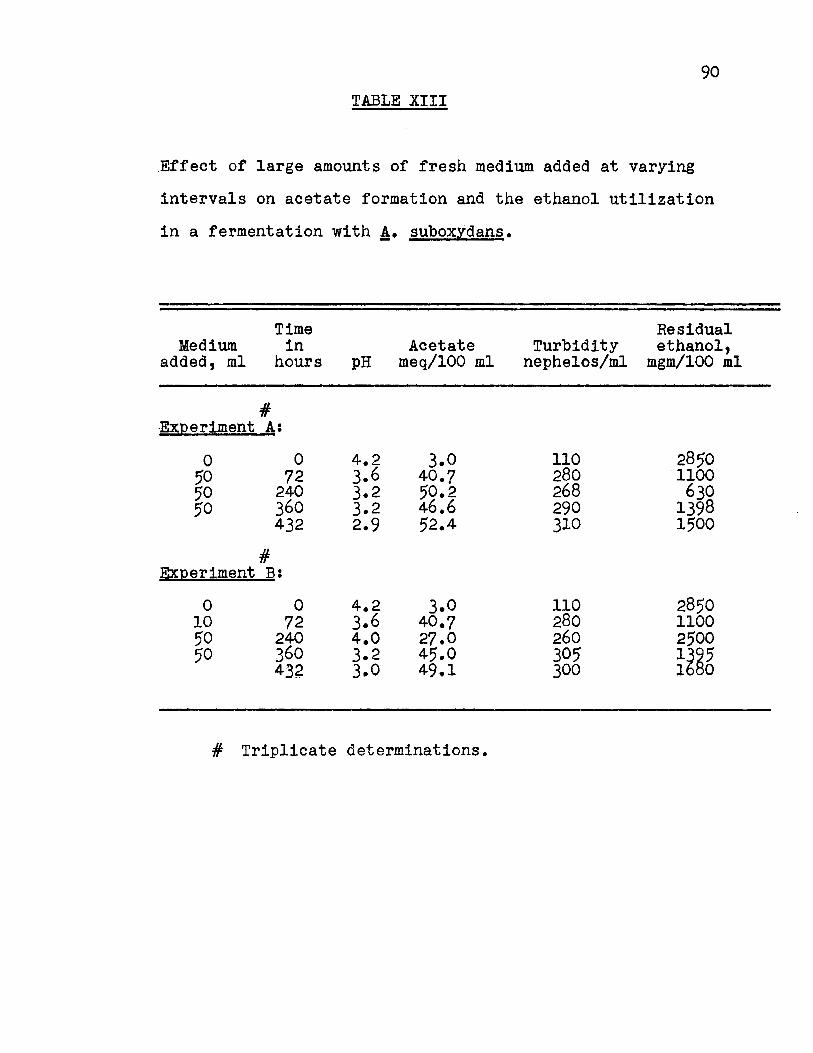
90
TABLE XIII
Effect of large amounts of fresh medium added at varying
intervals on acetate formation and the ethanol utilization
in a fermentation with A· suboxydans.
Time Residual Medium in Acetate Turbidity ethanol,
added, ml hours pH meq/100 ml nephelos/ml mgm/100 ml
# ·EXJ2 e riment A:
0 0 4.2 3.0 110 2850 50 72 3.6 40.7 280 1100 50 240 3.2 50.2 268 630 50 360 3.2 46.6 290 1398
432 2.9 52.4 310 1500
# ~:Qer;l.ment B:
0 0 4.2 3.0 110 2850 10 72 3.6 40.7 280 1100 50 240 4.0 27.0 260 2500 50 360 3.2 45.0 305 î~é6 43~ 3.0 49.1 300
# Triplicata determinations.
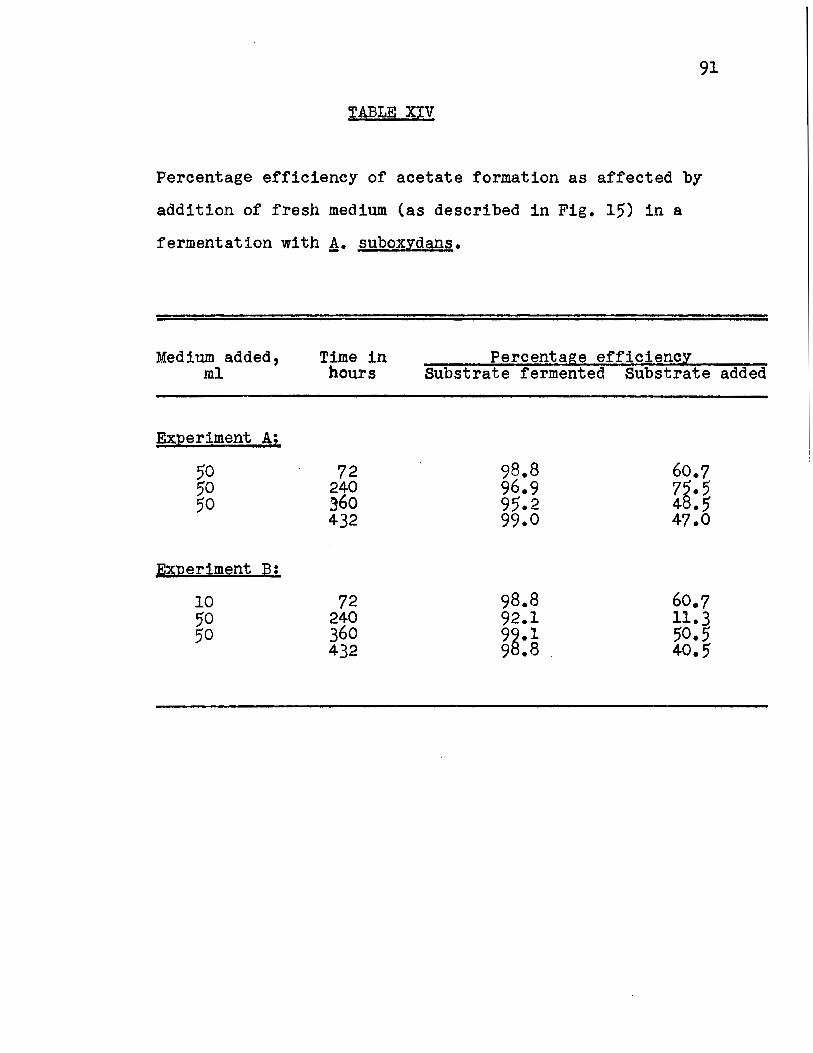
91
'l'ABLE XIV
Percentage efficiency of acetate formation as affected by
addition of fresh medium (as described in Fig. 15) in a
fermentation with A· suboxydans.
Medium added, ml
Ex:eeriment A:
50 50 50
~nerim~nt ;e:
10 50 50
Time in hours
72 240 360 432
72 240 360 432
Percentage efficiency Substrate fermented Substrate added
98.8 60.7 96.9 75.5 95.2 48.5 99.0 47.0
98.8 60.7 92.1 11.3 9é.l 50.5 9 .8 40.5