rates of recombin ation in the ribo somal dna of apom...
TRANSCRIPT
Copyright ! 2007 by the Genetics Society of AmericaDOI: 10.1534/genetics.105.050229
Rates of Recombination in the Ribosomal DNA of ApomicticallyPropagated Daphnia obtusa Lines
Seanna J. McTaggart,*,1 Jeffry L. Dudycha,†,2 Angela Omilian† and Teresa J. Crease*,3
*Department of Integrative Biology, University of Guelph, Guelph, Ontario N1G 2W1, Canada and†Department of Biology, Indiana University, Bloomington, Indiana 47405-3700
Manuscript received August 29, 2005Accepted for publication October 26, 2006
ABSTRACTRibosomal (r)DNA undergoes concerted evolution, the mechanisms of which are unequal crossing over
and gene conversion. Despite the fundamental importance of these mechanisms to the evolution ofrDNA, their rates have been estimated only in a few model species. We estimated recombination rate inrDNA by quantifying the relative frequency of intraindividual length variants in an expansion segment ofthe 18S rRNA gene of the cladoceran crustacean, Daphnia obtusa, in four apomictically propagated lines.We also used quantitative PCR to estimate rDNA copy number. The apomictic lines were sampled every 5generations for 90 generations, and we considered each significant change in the frequency distributionof length variants between time intervals to be the result of a recombination event. Using this method, wecalculated the recombination rate for this region to be 0.02–0.06 events/generation on the basis of threedifferent estimates of rDNA copy number. In addition, we observed substantial changes in rDNA copynumber within and between lines. Estimates of haploid copy number varied from 53 to 233, with a meanof 150. We also measured the relative frequency of length variants in 30 lines at generations 5, 50, and 90.Although length variant frequencies changed significantly within and between lines, the overall averagefrequency of each length variant did not change significantly between the three generations sampled,suggesting that there is little or no bias in the direction of change due to recombination.
THE ribosomal (r)DNA of metazoan animals is alarge multigene family consisting of one or more
arrays of tandemly repeated units. Each unit containsone copy of the 18S, 5.8S, and 28S rRNA genes sep-arated by spacers. These arrays make up the nucleolarorganizing regions and can be located on one or morechromosomes. Generally, rRNA gene copies retain ahigh degree of sequence similarity within species. Thissimilarity is caused by a homogenization process, knownas concerted evolution, which results from recombina-tion within and between rDNA arrays (Dover 1982;Arnheim 1983; Zimmer et al. 1983). Two specific recom-binationmechanisms that drive concerted evolution areunequal crossing over and gene conversion, both ofwhich can occur during meiosis and mitosis.
Mitotic recombination occurs in all eukaryotes andis intimately involved in the repair of damaged DNA(Helleday 2003). It can be stimulated in many waysincluding single-strand DNA breaks, mismatches, tran-
scription, and replication. In addition, the formation ofstructures in the DNA that inhibit normal transcriptionand replication, such as replication fork blocks (re-viewed in Aguilera et al. 2000) and other types of DNAdamage (e.g., methylation or oxidation), can stimulaterecombination during mitosis. Double-stranded DNAbreaks, which are thought to induce the majority ofrecombination events in meiosis, can also occur duringmitosis and induce recombination (Paques and Haber1999; Prado et al. 2003; Aylon and Kupiec 2004).Whilemitotic recombination is a ubiquitous process, its oc-currence may not be uniformly distributed throughoutthe genome. For example, there is some evidence thatchromatin structure mediated by the protein SIR2 mayplay a role in suppressing recombination in rDNA (re-viewed in Aguilera et al. 2000).Despite our growing understanding of the genes and
mechanisms involved in recombination, little is knownabout its rate in rDNA, which has important implica-tions for the process of concerted evolution in rDNA innatural populations. This gap in our knowledge resultsfrom the fact that measuring recombination rates ex-perimentally can be a difficult task, even in model or-ganisms. Nevertheless, many elegant experiments havebeen done to estimate the number of recombinationevents per generation in the rDNA of Saccharomycescerevisiae [e.g., 1 3 10!2/generation (Szostak and Wu1980), 1.3 3 10!3 (Merker and Klein 2002), and
Sequence data from this article have been deposited with the EMBL/GenBank Data Libraries under accession nos. EF014291–EF014296.
1Present address: School of Biological Sciences, Edinburgh University,Edinburgh, United Kingdom EH9 3JT.
2Present address: Department of Biology, William Paterson University,Wayne, NJ 07470.
3Corresponding author: Department of Integrative Biology, University ofGuelph, Guelph, ONN1G 2W1, Canada. E-mail: [email protected]
Genetics 175: 311–320 ( January 2007)
7.4–7.5 3 10!5 (Kobayashi et al. 2004)] and in therDNA of murine cells [1.2–1.8 3 10!5 (Nelson et al.1989)]. Statistical approaches have also been developedto estimate recombination rates indirectly from popu-lation genetic data (reviewed in Stumpf and McVean2003), but these methods need empirical confirmation.In this study, we estimate the recombination rate in therDNA of Daphnia obtusa by quantifying changes in thefrequency of length variants of the 18S rRNA expansionsegment 43/e4 through time in apomictically propa-gated lines that were established from a single wild-caught female.
Daphnia (Crustacea: Anomopoda) are small, fresh-water organisms that generally reproduce by cyclicparthenogenesis. When environmental conditions arefavorable, females produce diploid eggs via apomicticparthenogenesis (apomixis), which develop directlyinto females. Environmental cues trigger the produc-tion of meiotically produced haploid diapausing eggsthat require fertilization by males. An analysis of re-striction site polymorphism has shown that organismsthat reproduce parthenogenetically have highly homog-enized rDNA repeats, demonstrating that the frequencyof recombination events during germ-line apomixisis sufficiently high for concerted evolution to occur(Crease and Lynch 1991).
Expansion segments are regions within the rDNA thatexhibit high sequence diversity within species and,in some cases, within individuals. Regardless of theirlength, expansion segments tend to fold into energet-ically stable hairpin or helical secondary structures inthe rRNA, which may or may not contain unpairednucleotides that form bulges or loops. For a given se-quence length and base composition, the energeticstability of helices containing unpaired nucleotides isgenerally lower than that of helices in which all nucleo-tides are involved in base pairing.
Previously, McTaggart and Crease (2005) exam-ined the frequency of length variants in expansionsegment 43/e4 of the 18S rRNA (see Wuyts et al. 2001for a diagram showing the location of all expansionsegments in the 18S rRNA gene) in six individuals fromfour North American populations of D. obtusa. Theyidentified two pairs of short (di- or trinucleotide) indelsites that pair with each other when the secondary struc-ture of the sequence is formed. They found that thelength variants containing energetically stable struc-tures, i.e., those in which indels do not result in a de-stabilizing bulge (compensated length variants), werepresent at a wide range of frequencies, while variantscontaining indels that do cause a bulge (uncompen-sated length variants) were present only at low frequen-cies. These results suggest that uncompensated lengthvariants are selectively disadvantageous, while compen-sated length variants are selectively neutral with respectto one another. Furthermore, the frequency distribu-tion of the compensated length variants suggests that
there is no bias in the frequency changes caused by re-combination.However,McTaggartandCrease (2005)were unable to show this definitively due to the smallnumber of individuals examined and the fact that thepopulations sampled may have been experiencing dif-ferent selective constraints. If there is no bias in the di-rection of length variant frequency change caused byrecombination, then we predict that the frequency ofcompensated length variants should change randomlywithin and between the apomictic lines through timein the absence of selection. Here, we test this predictionin addition to providing an estimate of the rate of re-combination in the rDNA of apomictically propagatedD. obtusa lines.
MATERIALS AND METHODS
Establishment and maintenance of the apomictic D. obtusalines: A single female D. obtusa was isolated in May 2001 fromthe pond in Trelease Woods near Urbana, Illinois. An apo-mictic line was established and maintained under standard,uncrowded conditions at 20" and well fed. All animals werekept in beakers of filtered (1 mm) lake water. In October 2001,a single individual was randomly chosen to be the stemmotherfor all of the experimental apomictic lines. A total of 48apomictically produced daughters were collected from thestem mother and each was used to initiate an experimentalline. The standardized procedure for propagating the exper-imental lines was as follows: 8–10 days following the start of theprevious generation, a single randomly chosen female off-spring was transferred to a new beaker of lake water. Mat-uration takes place after"7 days at 20", which ensured that thetransferred individual was a daughter and not a granddaugh-ter. If a line had not produced offspring by the time of transfer,themother was transferred to a newbeaker and the generationnumber for that line was not increased.
In addition to the focal individual transferred, two of hersisters were transferred into separate beakers to serve as back-ups. Backups were used for a transfer when the focal individualeither died before reproducing or produced only male off-spring and/or diapausing eggs over her entire life. Through-out the course of the project, backups were used in "10% ofthe transfers. Use of backups neither showed a trend over timenor was clustered in certain lineages ( J. L. Dudycha, un-published data). Approximately every fifth generation, sistersof the focal individual were collected and frozen at !80" forthe molecular analyses described below.
Several steps were taken to minimize the risk of exogenouscontamination and cross-contamination among the lines. Bea-kers were kept covered to prevent splash contamination whenthey were not in use. Pipettes used to handle the animals wererinsed in nearly boiling water after each transfer to kill anyneonates that may have adhered to the pipette. To safeguardagainst exogenous contamination, all lines were scored for 8–12microsatellite loci at generation"40 andwere confirmed tobe identical to each other ( J. L. Dudycha, unpublished data).In addition, all lines were morphologically inspected and di-agnostic allozyme loci were analyzed at generation "90. Iden-tifying cross-contamination among the apomictic lines wasmore difficult. However, at generation"100, 16 nuclear geneswere sequenced in the lines and only two pairs of lines (4 and10, 8 and 14) had similar sequence profiles (A. Omilian, un-published data), suggesting sharedmutational events or cross-contamination. These lines were included in the final analysis
312 S. J. McTaggart et al.
of the coarse-grained time series (see Data analysis) as theirexclusion did not alter the results.
DNA analysis: For each generation that was sampled withineach line, total genomic DNAwas extracted from 2–50 pooled,apomictically produced sisters using the CTAB method(Doyle and Doyle 1987). DNA samples were obtained for30 lines at generations 5, "50 (generations 49–59), and "90(generations 80–92). These lines were sampled only threetimes and are referred to as the coarse-grained time series. Dueto occasional sampling difficulties, 10 lines were not sampledat all three times. These include 5 lines that were sampled onlyat generation 5, 2 lines that were sampled only at generations 5and "50, 2 lines that were sampled only at generations 5 and"90, and 1 line that was sampled only at generations "50 and"90. A total of 35 lines were sampled at least twice. The fine-grained time series consists of four lines (3, 12, 29, and 30) thatwere sampled approximately every 5 generations, starting atgeneration 5 and ending at approximately generation 90.
The 18S rRNA expansion segment 43/e4 was amplifiedfrom 1 ml (20–200 ng) of each genomic DNA sample using theprimers 1522F (59-HEX-ATTCCGATAACGAACGAG) and1880R (59-GAAGACTGCGTGACGGAC) in a 10-ml reactioncontaining 10mm Tris–HCl, pH 8.3, 20mm KCl, 1.5mmMgCl2,0.05mm of each of dNTP, 0.75mm of each primer, and 1 unit ofTaq polymerase. Amplification conditions were 94" for 1 minand 35 cycles of 94" for 20 sec, 55" for 20 sec, 72" for 1 min,followed by 72" for 5 min. Each of the fluorescently labeledPCR products was electrophoresed on a 7% polyacrylamide(19:1) denaturing gel at 35 W for 5 hr. Each gel was scannedwith a Hitachi FM BIOII scanner on channel 2. The bandswithin each lane were marked by hand on the resulting gelimage using the FM BIOII software. The six length variantsthat were observed among all of the samples were eachmarkedin every lane, even if they could not be detected by eye. The FMBIOII analysis tool was used to quantify the relative fluorescentsignal of each band as a function of the total intensity withineach lane. We amplified and analyzed the expansion segmentfrom each DNA sample three times to evaluate the reproduc-ibility of the band intensity estimates. The average intensity ofeach band from the three PCR products was calculated foreach sample at generations 5 (N# 39),"50 (N# 33), and"90(N# 33). The average band intensities were used as a measureof the relative frequency of the length variants. In addition,the impact of PCR cycle number on the relative frequencyof length variants was determined by amplifying six of thesamples at each of 35, 30, and 25 cycles. All other PCR con-ditions remained the same as those described above.
To sequence each of the length variants, a PCR product wasamplified from one DNA sample (line 12, generation 10) withprimers 1413F (59-TCACCAGGCCCGGACACTGGAAGG)and 2004R (59-TGGGGATCATTGCAGTCCCCAATC), ligatedinto the pGEM plasmid (Promega, Madison, WI) and trans-formed into DH5a cells (Invitrogen, Carlsbad, CA), accordingto the manufacturer’s instructions. Plasmid DNA was isolatedfrom 48 of the resulting colonies using theMillipore (Billerica,MA) PlasmidMiniprep kit. To determine the insert size, 2ml ofthe plasmid preparation was used in a 10-ml PCR reactioncontaining the primers 1522F (HEX) and 1880R as describedabove. One plasmid containing each length variant was se-quenced using the BigDye 3.1 terminator kit (Applied Bio-systems, Foster City, CA) on a 3730 Genetic Analyzer (AppliedBiosystems).
Quantitative PCR: Haploid rDNA copy number was esti-mated for a subset of the fine-grained time series samplesusing the relative quantification method of quantitative PCR(qPCR), which compares the rate of amplification of rDNA tothat of a single-copy reference gene (user bulletin no. 2, ABI7700 SDS; Applied Biosystems). The entire 18S rRNA gene of
Daphnia pulex has been cloned and sequenced (GenBankaccession no. AF014011) (Crease and Colbourne 1998) andwe used this clone to conduct preliminary experiments. Wechose two single-copy nuclear genes that were present incDNA libraries of D. pulex and Daphnia magna. PCR primerswere designed in conserved regions shared by these twospecies and used to amplify these genes from D. obtusagenomic DNA. These PCR products were cloned into thepCR 4-TOPO vector (Invitrogen) according to the manufac-turer’s instructions. We used one TOPOplasmid clone of eachgene for our preliminary qPCR experiments. BLAST analysisof these two genes indicated that one of them is likely to be amember of the Rab subfamily of small GTPases, while theother is likely to encode a transcription initiation factor. Forthe purposes of this study, we refer to them as GTP and TIF,respectively.
Primers for qPCR were designed from plasmid clones ofD. pulex (18S rRNA gene) and D. obtusa (GTP and TIF genes),using the ABI Primer Express software (version 2.0, AppliedBiosystems). All primer pairs produce a 50-nt amplicon. The18S rRNA gene primers are located just downstreamof the 43/e4 expansion segment in a conserved region that is identicalin cloned sequences from D. obtusa (this study) and D. pulex(AF014011). The primer sequences are as follows: 18S rRNAforward, 59-CCGCGTGACAGTGAGCAATA; 18S rRNA reverse,59-CCCAGGACATCTAAGGGCATC; GTP forward, 59-TATTCAGCATGGAGAGACGGC; GTP reverse, 59-GATGTCGACTGACGCTGGAA; TIF forward, 59-GACATCATCCTGGTTGGCCT;and TIF reverse, 59-AACGTCAGCCTTGGCATCTT.
To estimate relative amplification efficiency between the18S rRNA gene and each of the single-copy genes, we did pre-liminary experiments using the plasmid clones as templates.We created a composite template containing all three genes inequal copy number (3,000,000) by mixing the three plasmidstogether. This template was then serially diluted to create fouradditional templates containing 300,000, 30,000, 3000, and300 copies. We performed a qPCR experiment in which eachof these five concentrations for each gene was measured induplicate and then generated a plot of log (DNA concentra-tion) against DCT for each single-copy gene in comparisonwith rDNA, where CT is the threshold cycle and DCT is thedifference betweenCT for rDNA and the single-copy referencegene. CT is the cycle number at which the intensity of fluo-rescence from a reporter dye in the sample, in this case SYBRGreen, exceeds a fixed threshold that is set above the back-ground baseline. The threshold should be set close to thebaseline and well within the exponential phase of the am-plification reaction.
The absolute value of the slope of the regression line foreach gene was,0.1 in both cases (!0.052 for rDNA relative toGTP and 0.074 for rDNA relative to TIF), indicating that therelative amplification efficiency of these genes is sufficientlysimilar to allow the use of the relative quantification method(user bulletin no. 2, ABI 7700 SDS; Applied Biosystems). Inaddition, we performed preliminary experiments with severalsamples of genomic DNA from the D. obtusa lines and foundthat using a template quantity of $10 ng gave a relative copynumber very close to one when the single-copy genes werecompared to one another. On the other hand, template quan-tities beyond 20 ng caused a high baseline and thus inter-fered with establishment of the threshold for subsequent CT
estimation.All qPCR reactions were 20 ml in volume and contained 13
Power SYBR GreenMaster Mix (Applied Biosystems), 10 pmolof each primer, and 20 ng of template in the case of genomicDNA samples from the D. obtusa apomictic lines. The 260/280ratio of these DNA samples is "2.0, indicating that they alsocontain RNA, so the actual amount of DNA in each qPCR
Recombination Rate in Daphnia rDNA 313
reaction was substantially less than the estimated value.However, it is not necessary to know the exact amount ofDNA template that is used in relative quantification experi-ments, as long as it is not so high that it interferes withsubsequent CT analysis.
Amplification was performed on an ABI 7000 SDS real-timethermal cycler (Applied Biosystems), using the default param-eters for thermal cycling (50" for 10 min, 95" for 1 min,followed by 40 cycles of 95" for 15 sec and 60" for 1 min) andfor analysis [automatic threshold cycle (CT) and baseline].The threshold for CT estimation was set to 0.3 (the defaultvalue is 0.2) so that we could use template quantities of 20 ng.Each gene from each sample was amplified in duplicate.
We averaged duplicate CT-values within an experiment,calculated the difference in average CT between rDNA andone of the single-copy genes (DCT), and then used the value of2!DCT as the estimate of haploid rDNA copy number. On thebasis of the range of estimates that we obtained using qPCR, wereplicated all relevant analyses using three values of haploidrDNA copy number, 120, 160, and 200.Data analysis: Coarse-grained time series: To estimate changes
in the length variant frequency distribution between lineswithin a generation (i.e., generation 5), we compared thelength variant frequencies of each line to those of one otherline (the next line in the numerical sequence) from the samegeneration with a G -test. The probability values for all G -testswere sequentially Bonferroni corrected for multiple tests(Rice 1989). Results were considered to be significant if theprobability values were,0.01. We did not compare the lengthvariant frequency distribution in all pairwise comparisonswithin a generation due to the loss of statistical power inmultiple tests. In addition, we compared the length variantfrequency distributions from the same line from two consec-utive samples (i.e., from generation 5 to "50 or from "50 to"90) with a G -test.Fine-grained time series: Sequentially Bonferroni-corrected
(Rice 1989) G -tests were used to determine if differences inthe distribution of length variant frequencies between eachconsecutive time interval (i.e., generations 5–10, generations10–15, etc.) are significant within each of lines 3, 12, 29,and 30.
Recombination events were counted in two ways. First, wecounted the number of time intervals that had a significant G -value. We considered that every time interval with a significantshift in the distribution of length variant frequencies wascaused by a single recombination event. The final rate ofrecombination was calculated as the total number of signifi-cant events in each line, divided by the total number ofgenerations elapsed. Second, we calculated the residual valuesfor each length variant from the G -tests within each timeinterval. We considered any length variant that had a residualvalue .2 or , !2 to have changed substantially during thetime interval. Thus, in this second test, if at least one residualvalue within a time interval was .2 or , !2, a recombinationevent was counted, even if the overall G -score was not sig-nificant. Both of these methods of counting recombinationevents are conservative and are likely to underestimate theactual number of events. However, because it is possible for asingle recombination event to change the frequency of morethan one length variant (for example, if variants are clusteredtogether within the array), we counted only one event for anyparticular time interval, even if more than one residual valuewas,!2 or.2. Furthermore, this method is unable to detectequal exchanges between sister chromatids or recombinationevents that do not change length variant frequencies to theextent that we can detect them on the gels. Finally, if arecombination event occurs between chromatids from homo-logs, and the four chromatids segregate such that both par-
ental chromatids or both recombinant chromatids end up inthe same daughter cell, we will not be able to detect a recom-bination event because the relative frequencies of length var-iants will not change from the parental frequencies.
RESULTS
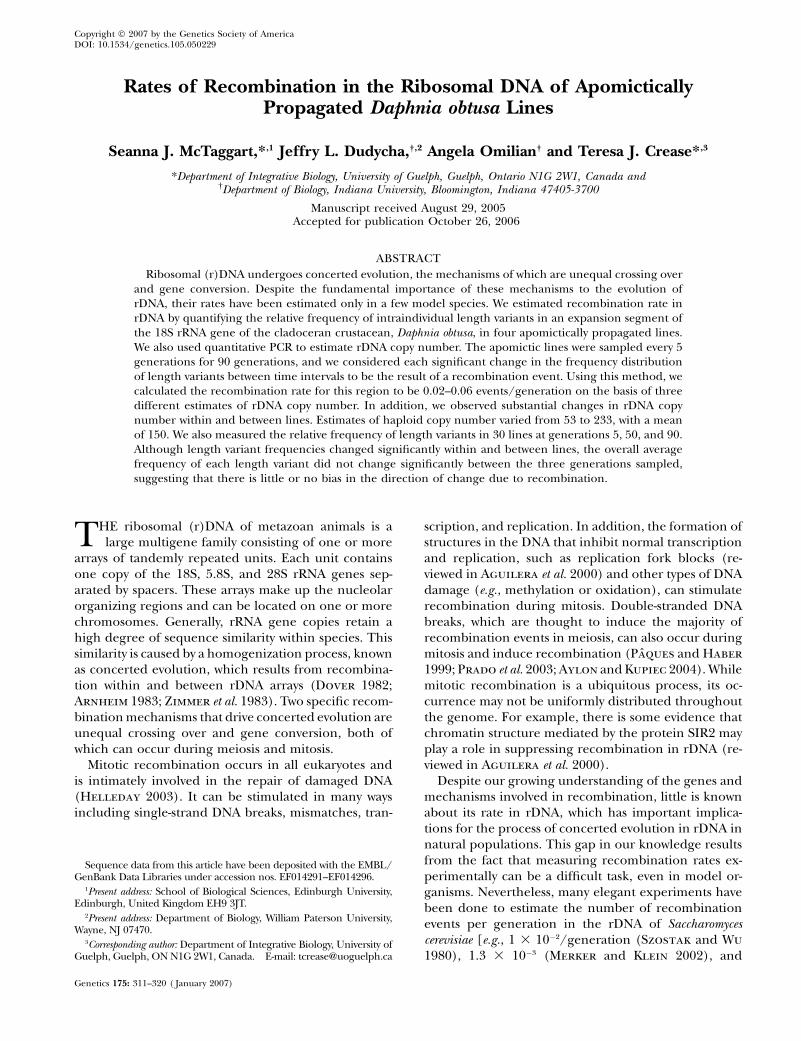
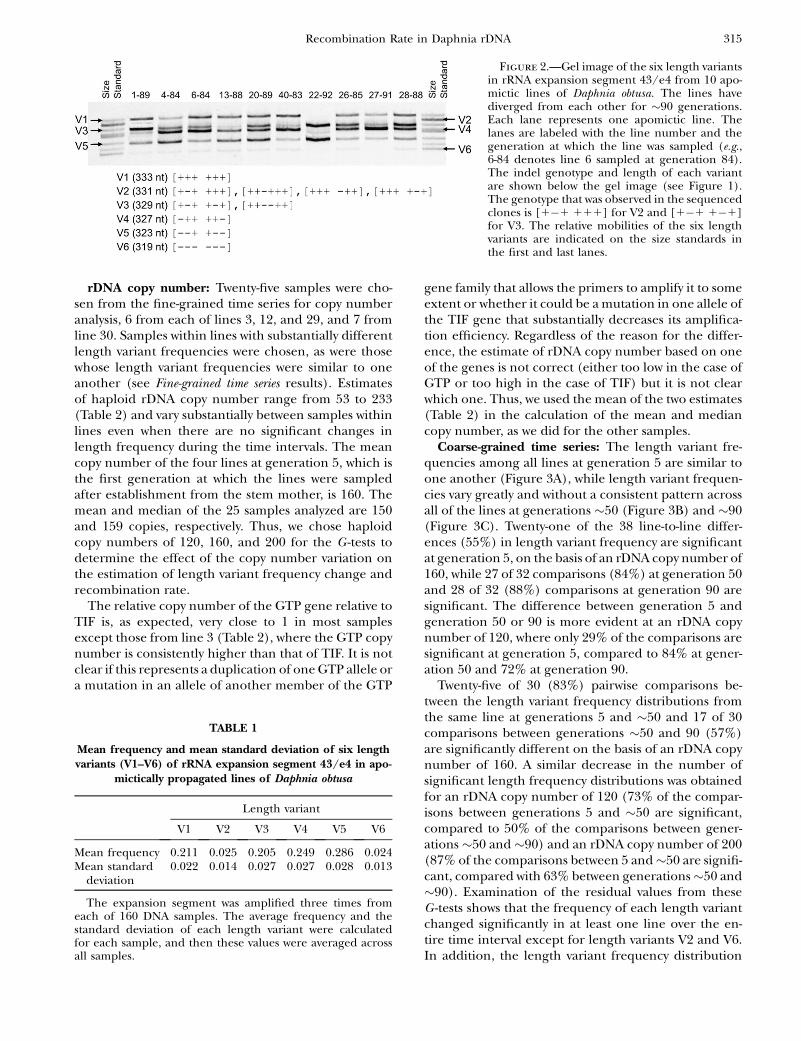
PCR amplification of expansion segment 43/e4 fromthe D. obtusa experimental lines revealed six length var-iants (V1–V6), which vary in length from 319 to 333 nt.The length variation is due to six indel sites (1–6) thatform three complementary pairs, such that sites 1 and 6,2 and 5, and 3 and 4 are opposite each other in thesecondary structure (Figure 1A). Length variants aredesignated as compensated if nucleotides are eitherpresent [1] or absent [!] at both complementary sitesof any pair (Figure 1B). From the sequences of the dif-ferent length variants, we found that V1, V3, V4, V5, andV6 are compensated, whereas V2 is uncompensated. V2could be amixture of four different uncompensated var-iants of the same length, while V3 could be a mixture oftwo compensated variants (Figure 2). However, only onerepresentative of each length variant was sequenced.The fact that more than one variant could be presentwithin these two size classes will result in a more con-servative estimate of recombination frequency.
Expansion segment 43/e4 was amplified three timesfrom a total of 160 samples. The average standard de-viations relative to the average band intensities of eachlength variant (Table 1) show that estimates of relativevariant frequency based on band intensity are repro-ducible. The standard deviation of three amplificationsat 35, 30, and 25 cycles was of the samemagnitude as thatfor the three replicates done at 35 cycles (0.002–0.012across all fragments in the six samples), showing thatcycle number of the PCR reaction has no impact on therelative frequency of the length variants.
Figure 1.—(A) Secondary structure of a portion of rRNAexpansion segment 43/e4 showing the putative nucleotidepairing of six indel sites. Boundaries between adjacent indelsites are indicated with a vertical dashed line. (B) Indel sitesare classified as [1] if the nucleotides are present and [!]if the nucleotides are absent. In this example, sites 1–6 and2–5 are uncompensated, while indel sites 3 and 4 are compen-sated. Thus, the genotype of this variant would be [!!1111].
314 S. J. McTaggart et al.
rDNA copy number: Twenty-five samples were cho-sen from the fine-grained time series for copy numberanalysis, 6 from each of lines 3, 12, and 29, and 7 fromline 30. Samples within lines with substantially differentlength variant frequencies were chosen, as were thosewhose length variant frequencies were similar to oneanother (see Fine-grained time series results). Estimatesof haploid rDNA copy number range from 53 to 233(Table 2) and vary substantially between samples withinlines even when there are no significant changes inlength frequency during the time intervals. The meancopy number of the four lines at generation 5, which isthe first generation at which the lines were sampledafter establishment from the stem mother, is 160. Themean and median of the 25 samples analyzed are 150and 159 copies, respectively. Thus, we chose haploidcopy numbers of 120, 160, and 200 for the G -tests todetermine the effect of the copy number variation onthe estimation of length variant frequency change andrecombination rate.
The relative copy number of the GTP gene relative toTIF is, as expected, very close to 1 in most samplesexcept those from line 3 (Table 2), where the GTP copynumber is consistently higher than that of TIF. It is notclear if this represents a duplication of oneGTP allele ora mutation in an allele of another member of the GTP
gene family that allows the primers to amplify it to someextent or whether it could be amutation in one allele ofthe TIF gene that substantially decreases its amplifica-tion efficiency. Regardless of the reason for the differ-ence, the estimate of rDNA copy number based on oneof the genes is not correct (either too low in the case ofGTP or too high in the case of TIF) but it is not clearwhich one. Thus, we used the mean of the two estimates(Table 2) in the calculation of the mean and mediancopy number, as we did for the other samples.Coarse-grained time series: The length variant fre-
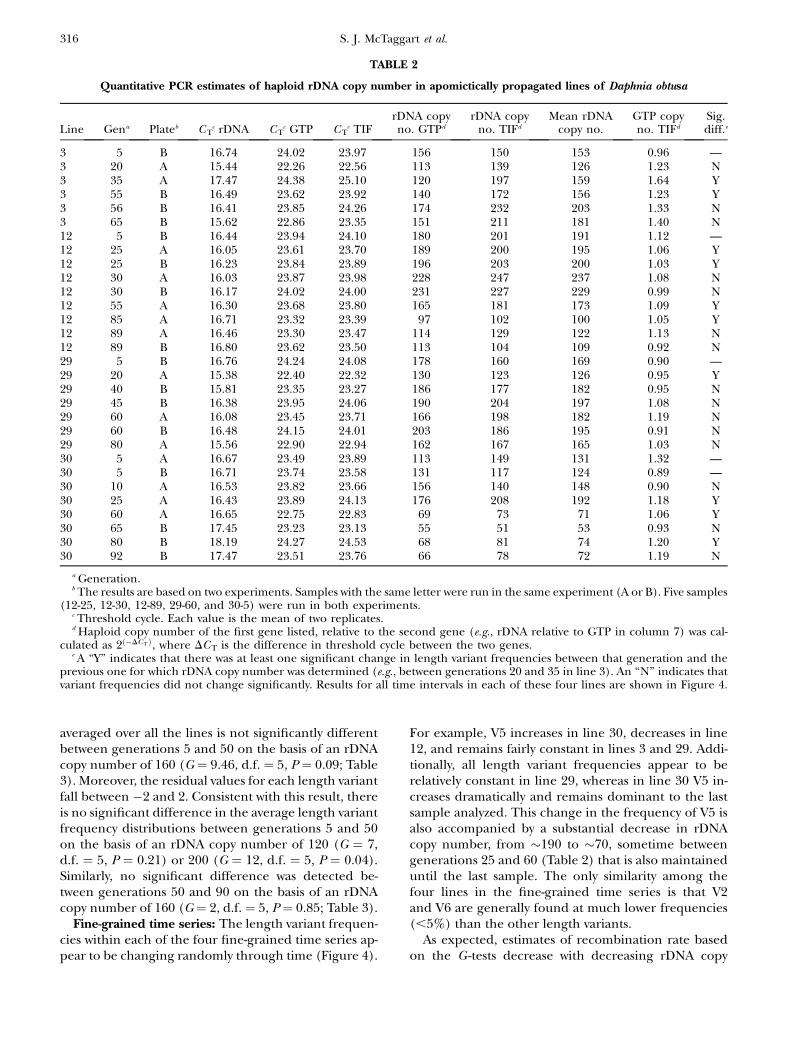
quencies among all lines at generation 5 are similar toone another (Figure 3A), while length variant frequen-cies vary greatly and without a consistent pattern acrossall of the lines at generations "50 (Figure 3B) and "90(Figure 3C). Twenty-one of the 38 line-to-line differ-ences (55%) in length variant frequency are significantat generation 5, on the basis of an rDNA copy number of160, while 27 of 32 comparisons (84%) at generation 50and 28 of 32 (88%) comparisons at generation 90 aresignificant. The difference between generation 5 andgeneration 50 or 90 is more evident at an rDNA copynumber of 120, where only 29% of the comparisons aresignificant at generation 5, compared to 84% at gener-ation 50 and 72% at generation 90.Twenty-five of 30 (83%) pairwise comparisons be-
tween the length variant frequency distributions fromthe same line at generations 5 and "50 and 17 of 30comparisons between generations "50 and 90 (57%)are significantly different on the basis of an rDNA copynumber of 160. A similar decrease in the number ofsignificant length frequency distributions was obtainedfor an rDNA copy number of 120 (73% of the compar-isons between generations 5 and "50 are significant,compared to 50% of the comparisons between gener-ations "50 and "90) and an rDNA copy number of 200(87% of the comparisons between 5 and"50 are signifi-cant, compared with 63% between generations"50 and"90). Examination of the residual values from theseG -tests shows that the frequency of each length variantchanged significantly in at least one line over the en-tire time interval except for length variants V2 and V6.In addition, the length variant frequency distribution
Figure 2.—Gel image of the six length variantsin rRNA expansion segment 43/e4 from 10 apo-mictic lines of Daphnia obtusa. The lines havediverged from each other for "90 generations.Each lane represents one apomictic line. Thelanes are labeled with the line number and thegeneration at which the line was sampled (e.g.,6-84 denotes line 6 sampled at generation 84).The indel genotype and length of each variantare shown below the gel image (see Figure 1).The genotype that was observed in the sequencedclones is [1!1 111] for V2 and [1!1 1!1]for V3. The relative mobilities of the six lengthvariants are indicated on the size standards inthe first and last lanes.
TABLE 1
Mean frequency and mean standard deviation of six lengthvariants (V1–V6) of rRNA expansion segment 43/e4 in apo-
mictically propagated lines of Daphnia obtusa
Length variant
V1 V2 V3 V4 V5 V6
Mean frequency 0.211 0.025 0.205 0.249 0.286 0.024Mean standard
deviation0.022 0.014 0.027 0.027 0.028 0.013
The expansion segment was amplified three times fromeach of 160 DNA samples. The average frequency and thestandard deviation of each length variant were calculatedfor each sample, and then these values were averaged acrossall samples.
Recombination Rate in Daphnia rDNA 315
averaged over all the lines is not significantly differentbetween generations 5 and 50 on the basis of an rDNAcopy number of 160 (G # 9.46, d.f. # 5, P # 0.09; Table3). Moreover, the residual values for each length variantfall between !2 and 2. Consistent with this result, thereis no significant difference in the average length variantfrequency distributions between generations 5 and 50on the basis of an rDNA copy number of 120 (G # 7,d.f. # 5, P # 0.21) or 200 (G # 12, d.f. # 5, P # 0.04).Similarly, no significant difference was detected be-tween generations 50 and 90 on the basis of an rDNAcopy number of 160 (G # 2, d.f. # 5, P # 0.85; Table 3).
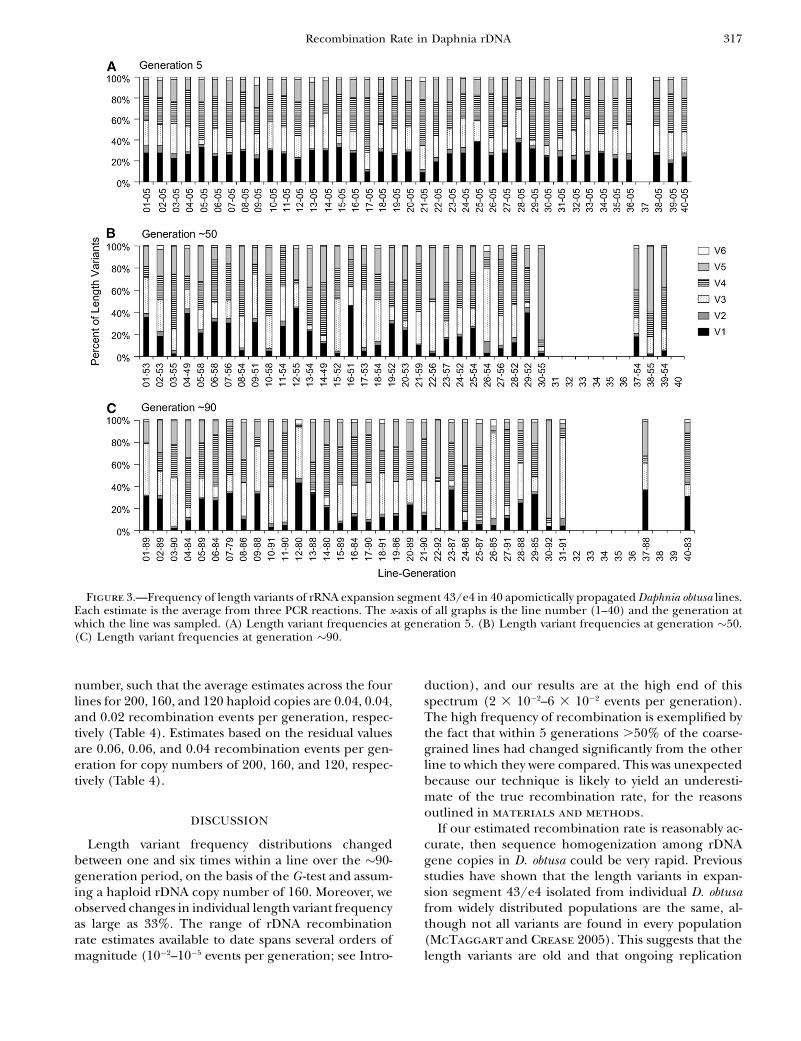
Fine-grained time series: The length variant frequen-cies within each of the four fine-grained time series ap-pear to be changing randomly through time (Figure 4).
For example, V5 increases in line 30, decreases in line12, and remains fairly constant in lines 3 and 29. Addi-tionally, all length variant frequencies appear to berelatively constant in line 29, whereas in line 30 V5 in-creases dramatically and remains dominant to the lastsample analyzed. This change in the frequency of V5 isalso accompanied by a substantial decrease in rDNAcopy number, from "190 to "70, sometime betweengenerations 25 and 60 (Table 2) that is also maintaineduntil the last sample. The only similarity among thefour lines in the fine-grained time series is that V2and V6 are generally found at much lower frequencies(,5%) than the other length variants.
As expected, estimates of recombination rate basedon the G -tests decrease with decreasing rDNA copy
TABLE 2
Quantitative PCR estimates of haploid rDNA copy number in apomictically propagated lines of Daphnia obtusa
Line Gena Plateb CTc rDNA CT
c GTP CTc TIF
rDNA copyno. GTPd
rDNA copyno. TIFd
Mean rDNAcopy no.
GTP copyno. TIFd
Sig.diff.e
3 5 B 16.74 24.02 23.97 156 150 153 0.96 —3 20 A 15.44 22.26 22.56 113 139 126 1.23 N3 35 A 17.47 24.38 25.10 120 197 159 1.64 Y3 55 B 16.49 23.62 23.92 140 172 156 1.23 Y3 56 B 16.41 23.85 24.26 174 232 203 1.33 N3 65 B 15.62 22.86 23.35 151 211 181 1.40 N12 5 B 16.44 23.94 24.10 180 201 191 1.12 —12 25 A 16.05 23.61 23.70 189 200 195 1.06 Y12 25 B 16.23 23.84 23.89 196 203 200 1.03 Y12 30 A 16.03 23.87 23.98 228 247 237 1.08 N12 30 B 16.17 24.02 24.00 231 227 229 0.99 N12 55 A 16.30 23.68 23.80 165 181 173 1.09 Y12 85 A 16.71 23.32 23.39 97 102 100 1.05 Y12 89 A 16.46 23.30 23.47 114 129 122 1.13 N12 89 B 16.80 23.62 23.50 113 104 109 0.92 N29 5 B 16.76 24.24 24.08 178 160 169 0.90 —29 20 A 15.38 22.40 22.32 130 123 126 0.95 Y29 40 B 15.81 23.35 23.27 186 177 182 0.95 N29 45 B 16.38 23.95 24.06 190 204 197 1.08 N29 60 A 16.08 23.45 23.71 166 198 182 1.19 N29 60 B 16.48 24.15 24.01 203 186 195 0.91 N29 80 A 15.56 22.90 22.94 162 167 165 1.03 N30 5 A 16.67 23.49 23.89 113 149 131 1.32 —30 5 B 16.71 23.74 23.58 131 117 124 0.89 —30 10 A 16.53 23.82 23.66 156 140 148 0.90 N30 25 A 16.43 23.89 24.13 176 208 192 1.18 Y30 60 A 16.65 22.75 22.83 69 73 71 1.06 Y30 65 B 17.45 23.23 23.13 55 51 53 0.93 N30 80 B 18.19 24.27 24.53 68 81 74 1.20 Y30 92 B 17.47 23.51 23.76 66 78 72 1.19 N
a Generation.b The results are based on two experiments. Samples with the same letter were run in the same experiment (A or B). Five samples
(12-25, 12-30, 12-89, 29-60, and 30-5) were run in both experiments.c Threshold cycle. Each value is the mean of two replicates.d Haploid copy number of the first gene listed, relative to the second gene (e.g., rDNA relative to GTP in column 7) was cal-
culated as 2$!DCT%, where DCT is the difference in threshold cycle between the two genes.e A ‘‘Y’’ indicates that there was at least one significant change in length variant frequencies between that generation and the
previous one for which rDNA copy number was determined (e.g., between generations 20 and 35 in line 3). An ‘‘N’’ indicates thatvariant frequencies did not change significantly. Results for all time intervals in each of these four lines are shown in Figure 4.
316 S. J. McTaggart et al.
number, such that the average estimates across the fourlines for 200, 160, and 120 haploid copies are 0.04, 0.04,and 0.02 recombination events per generation, respec-tively (Table 4). Estimates based on the residual valuesare 0.06, 0.06, and 0.04 recombination events per gen-eration for copy numbers of 200, 160, and 120, respec-tively (Table 4).
DISCUSSION
Length variant frequency distributions changedbetween one and six times within a line over the "90-generation period, on the basis of the G -test and assum-ing a haploid rDNA copy number of 160. Moreover, weobserved changes in individual length variant frequencyas large as 33%. The range of rDNA recombinationrate estimates available to date spans several orders ofmagnitude (10!2–10!5 events per generation; see Intro-
duction), and our results are at the high end of thisspectrum (2 3 10!2–6 3 10!2 events per generation).The high frequency of recombination is exemplified bythe fact that within 5 generations .50% of the coarse-grained lines had changed significantly from the otherline to which they were compared. This was unexpectedbecause our technique is likely to yield an underesti-mate of the true recombination rate, for the reasonsoutlined in materials and methods.If our estimated recombination rate is reasonably ac-
curate, then sequence homogenization among rDNAgene copies in D. obtusa could be very rapid. Previousstudies have shown that the length variants in expan-sion segment 43/e4 isolated from individual D. obtusafrom widely distributed populations are the same, al-though not all variants are found in every population(McTaggart and Crease 2005). This suggests that thelength variants are old and that ongoing replication
Figure 3.—Frequency of length variants of rRNA expansion segment 43/e4 in 40 apomictically propagated Daphnia obtusa lines.Each estimate is the average from three PCR reactions. The x-axis of all graphs is the line number (1–40) and the generation atwhich the line was sampled. (A) Length variant frequencies at generation 5. (B) Length variant frequencies at generation "50.(C) Length variant frequencies at generation "90.
Recombination Rate in Daphnia rDNA 317
slippage events are not a suitable explanation for theirpersistence. Alternatively, some of the length variantscould be generated de novo by recombination. For exam-ple, recombination at different locations between the
longest (V1) and the shortest (V6) length variant canyield all of the other observed variants. This may alsogenerate length variants that we did not observe, per-haps because they are energetically unstable and there-fore do not persist. If the length variants were old, then
TABLE 3
Frequency of length variants of rRNA expansion segment43/e4 averaged across all of the apomictically propagated
Daphnia obtusa lines at generations 5, "50, and "90
Generation
Variant 5 50 90
V1 0.257 (0.009) 0.185 (0.022) 0.178 (0.023)V2 0.032 (0.002) 0.029 (0.003) 0.025 (0.002)V3 0.210 (0.011) 0.235 (0.024) 0.264 (0.032)V4 0.296 (0.013) 0.274 (0.022) 0.293 (0.031)V5 0.179 (0.005) 0.258 (0.026) 0.218 (0.029)V6 0.026 (0.002) 0.019 (0.002) 0.022 (0.002)
Standard errors of the estimates are given in parentheses.The length variant frequency distributions are significantlydifferent between generations 5 and 50 (see text), althoughnone of the residual values for any of the length variants were,!2 or.2. The number of lines at generation 5 is 39 and thenumber of lines at generations "50 and "90 is 33.
Figure 4.—Frequency of length variants of rRNA expansion segment 43/e4 in each of four apomictically propagated Daphniaobtusa lines. The lines were sampled approximately every five generations. Asterisks indicate significant G -scores, and arrows in-dicate length variants with residual scores , !2 or .2 for a particular time interval. These analyses are based on an rDNA copynumber of 160 per haploid genome.
TABLE 4
Number of recombination events per generation in the rDNAof four apomictically propagated Daphnia obtusa lines
G-test: Residual:Haploid rDNA copy no. Haploid rDNA copy no.
Line Gen 120 160 200 120 160 200
3 92 0.01 0.03 0.04 0.04 0.05 0.0912 91 0.05 0.07 0.07 0.05 0.07 0.0729 86 0.00 0.01 0.02 0.01 0.07 0.0330 92 0.03 0.03 0.03 0.03 0.04 0.04Mean 0.02 0.04 0.04 0.04 0.06 0.06
The recombination rates were calculated using two ap-proaches. In the G -test method, one recombination eventwas counted if a G -statistic was significant for a given time in-terval. In the residual method, one recombination event wascounted if at least one residual value within a time interval was, !2 or .2. Gen, total number of generations for each line.
318 S. J. McTaggart et al.
we would predict that different compensated lengthvariants would go to fixation via genetic drift in D. obtusapopulations that are isolated from one another. A pre-liminary analysis of the frequency of length variants inexpansion segment 43/e4 from 24D. obtusa populationsacross its North American range (S. J. McTaggart andT. J. Crease, unpublished data) indicates that all in-dividuals surveyed (n # 3–10 per population) withinthree populations are indeed fixed for one of thecompensated length variants (V1 in all cases). This geo-graphic comparison supports the hypothesis that thelength variants are old and furthermore shows thatthe presence of intraindividual length variation in ex-pansion segment 43/e4 is not a ubiquitous characteris-tic of D. obtusa populations, as was previously thought(McTaggart and Crease 2005).
Although the data from our study cannot identify therecombination mechanisms that are responsible for thechanges that we observed, the wide range of length var-iant frequency changes detected (2–33%) within shorttime intervals suggests that we are detecting more thanone type of event. Recombination events can be dividedinto two general classes depending on whether or notthey change rDNA copy number. Events that do notchange rDNA copy number include equal crossover andgene conversion. Previous studies have provided evi-dence that interchromosomal recombination occursless frequently than intrachromosomal recombinationin rDNA (Schlotterer and Tautz 1994; Liao et al.1997), and there is some indirect evidence that this is thecase in D. pulex rDNA (Crease 1995). Thus, it is likelythat the length variant frequency changes we observedare primarily due to unequal sister chromatid or intra-chromatid exchange, both of which will result in genecopy number change. Indeed, our qPCR analysis of sam-ples in thefine-grained time series shows that rDNAcopynumber can indeed change substantially in only a fewgenerations. The largest change occurred in line 30 be-tween generation 25 and 60 when copy number de-creased from "190 to "70 and then remained low untilthe last sample analyzed. This is consistent with a sub-stantial increase in the frequency of V5 at the expenseof all the other length variants in this line.Moreover, theassociation of substantial changes in variant frequencywith copy number changes provides indirect evidencethat length variants are clustered along an rDNA array.
Changes in rDNA copy number of themagnitude thatwe observed have also been observed in replicate lines ofDrosophilamelanogaster, with copynumbers on theXchro-mosome varying between 140 and 310 after 400 gen-erations of laboratory culture (Averbeck and Eickbush2005). Furthermore, the similarity between copy num-ber estimates in D. obtusa (53–233) and D. melanogaster isconsistent with the similarity of their genome sizes: 180Mb for D. melanogaster (Adams et al. 2000) and 200 Mbfor D. pulex, a close relative of D. obtusa (draft genomesequence, Joint Genome Institute).
In the coarse-grained time series, each of the com-pensated length variants is present at a wide range offrequencies, except for V6, which is present only at lowfrequencies. Even so, the average length variant fre-quency across all of the lines does not differ significantlyamong the three generations sampled. These resultsstrongly suggest that there is no bias with respect to therecombination mechanisms that are operating in therDNA. The significant change in the frequencies of V1and V5 between the first two time points but not the lasttwo is likely due to sampling error, as it is difficult toimagine a molecular mechanism that could create sucha short-lived bias.The availability of whole-genome information has
confirmed that, in humans at least, rates of recombina-tion vary by as much as four orders of magnitude acrossall nucleotides (McVean et al. 2004). To determine howthe rate that we observed in rDNA compares to that inthe genome as a whole, it will be necessary to compareour estimate of recombination rate with those obtainedfrom (a) other portions of the rDNA and (b) other ge-nomic regions. There are opposing viewpoints on howrDNA structure will affect recombination rate. For ex-ample, the recombination rate in rDNA may be highrelative to the genomewide average due to the fact thateach primary unit, which is repeated tens to thousandsof times, contains a copy of a region containing thereplication fork block, which is known to be associ-ated with an increased probability of recombination(Kobayashi 2003). Indeed, selection may favor an ele-vated rate of recombination in rDNAdue to its impact onthe homogenization of gene copies along the rDNAarray. In contrast, it has been argued that theheterochro-matin structure of rDNA inhibits its accessibility to therecombination machinery, which predicts a lower thanaverage recombination rate. Recent work by Kobayashiet al. (2004) has shown that this latter view may not becorrect as they did not see a decrease in the overall rateof recombination in mutant SIR2 yeast strains vs. wild-type strains, although the wild-type strains did have adecreased rate of unequal sister chromatid exchangecompared to mutant strains.In conclusion, we have presented a novel procedure
for the cost-effective quantification of recombinationrate in rDNA, which is typically a difficult and labor-intensive task (Stumpf andMcVean 2003). Thismethodwas sensitive enough to detect recombination events thatoccurred during apomixis in D. obtusa lines over five-generation time intervals and is applicable to any mul-tigene family that contains easily detectable sequencevariation and to any species that can be propagated inthe lab.
We thank A. Danielson and C. Puzio for assistance in culturing theexperimental lines and M. Cristescu for extracting DNA from some ofthe Daphnia samples. S.J.M. thanks M. Lynch for the opportunity tovisit his lab anddiscuss this project with him.We also thankT. Eickbushand the anonymous reviewers for helpful comments on an earlier
Recombination Rate in Daphnia rDNA 319
version of themanuscript. This project was funded by a grant from theNatural Sciences and Engineering Research Council of Canada toT.J.C. and a grant from the National Science Foundation to M. Lynch.S.J.M. was supported by an Ontario Graduate Scholarship in Scienceand Technology, and J.L.D. was supported by a National Institutes ofHealth Kirchstein Fellowship.
LITERATURE CITED
Adams, M. D., S. E. Celnkier, R. A. Holt, C.A. Evans, J. D. Gocayneet al., 2000 The genome sequence of Drosophila melanogaster.Science 287: 2185–2195.
Aguilera, A., S. Chavez and F. Malagon, 2000 Mitotic recombina-tion in yeast: elements controlling its incidence. Yeast 16: 731–754.
Arnheim, N., 1983 Concerted evolution of multigene families, pp.38–61 in Evolution of Genes and Proteins, edited by M. Nei and R. K.Koehn. Sinauer Associates, Sunderland, MA.
Averbeck, K. T., and T. H. Eickbush, 2005 Monitoring the modeand tempo of concerted evolution in the Drosophila melanogasterrDNA locus. Genetics 171: 1837–1846.
Aylon, Y., and M. Kupiec, 2004 New insights into the mechanism ofhomologous recombination in yeast. Mutat. Res. 566: 231–248.
Crease, T., 1995 Ribosomal DNA evolution at the population level:nucleotide variation in intergenic spacer subrepeat arrays ofDaphnia pulex. Genetics 141: 1327–1337.
Crease, T., and J. Colbourne, 1998 Unusually long small subunitribosomal RNA of the crustacean, Daphnia pulex: sequence andpredicted secondary structure. J. Mol. Evol. 46: 307–313.
Crease, T., and M. Lynch, 1991 Ribosomal DNA variation in Daph-nia pulex. Mol. Biol. Evol. 8: 620–640.
Dover, G., 1982 Molecular drive: a cohesive mode of species evolu-tion. Nature 299: 111–117.
Doyle, J. J., and J. L. Doyle, 1987 A rapid DNA isolation procedurefor small quantitiesof fresh leaf tissue. Phytochem.Bull.19:11–15.
Helleday, T., 2003 Pathways for mitotic homologous recombina-tion in mammalian cells. Mutat. Res. 532: 103–115.
Kobayashi, T., 2003 The replication fork barrier site forms a uniquestructure with Fob1p and inhibits the replication fork. Mol. Cell.Biol. 23: 9178–9188.
Kobayashi, T., T. Horiuchi, P. Tongaonkar, L. Vu and M. Nomura,2004 SIR2 regulates recombination between different rDNA re-
peats, but not recombination within individual rRNA genes inyeast. Cell 117: 441–453.
Liao, D., T. Pavelitx, J. R. Kidd, K. K. Kidd and A. M. Weinder,1997 Concerted evolution of the tandemly repeated genes en-coding human U2 snRNA (the RNU2 locus) involves rapid intra-chromosomal homogenization and rare interchromosomal geneconversion. EMBO J. 3: 588–598.
McTaggart, S. J., and T. J. Crease, 2005 Selection on the structuralstability of a ribosomal RNA expansion segment inDaphnia obtusa.Mol. Biol. Evol. 22: 1309–1319.
McVean, G. A. T., S. R. Myers, S. Hunt, P. Deloukas, D. R. Bentleyet al., 2004 The fine-scale structure of recombination rate vari-ation in the human genome. Science 304: 581–584.
Merker, R. J., and H. L. Klein, 2002 hpr1D affects ribosomal DNArecombination and cell life span in Saccharomyces cerevisiae. Mol.Cell. Biol. 22: 421–429.
Nelson, F. K., W. Frankel and T. V. Rajan, 1989 Mitotic recombi-nation is responsible for the loss of heterozygosity in culturedmurine cell lines. Mol. Cell. Biol. 9: 1284–1288.
Paques, F., and J. E. Haber, 1999 Multiple pathways of recombina-tion induced by double-stranded breaks in Saccharomyces cerevi-siae. Microbiol. Mol. Biol. Rev. 63: 349–404.
Prado, F., F. Cortes-Ledesman, P. Huertas and A. Aguilera,2003 Mitotic recombination in Saccharomyces cerevisiae. Curr.Genet. 42: 185–198.
Rice, W. R., 1989 Analyzing tables of statistical tests. Evolution 43:223–225.
Schlotterer, C., and D. Tautz, 1994 Chromosomal homogeneityof Drosophila ribosomal DNA arrays suggests intrachromosomalexchanges drive concerted evolution. Curr. Biol. 4: 777–783.
Stumpf, M. P. H., and G. A. T. McVean, 2003 Estimating recombi-nation rates from population data. Nat. Genet. 4: 959–968.
Szostak, J. W., and R. Wu, 1980 Unequal crossing over in the ribo-somal DNA of Saccharomyces cerevisiae. Nature 284: 426–430.
Wuyts, J., Y. Van de Peer and R. de Wachter, 2001 Distribution ofsubstitution rate and location of insertion sites in the tertiarystructure of ribosomal RNA. Nucleic Acids Res. 29: 5017–5028.
Zimmer, E. A., S. L. Martin, S. M. Beverley, Y. W. Kan and A. C.Wilson, 1983 Rapid duplication and loss of genes coding forthe alpha chains of hemoglobin. Proc. Natl. Acad. Sci. USA77: 2158–2162.
Communicating editor: T. H. Eickbush
320 S. J. McTaggart et al.