rating : hold aia engineering (aiaeng) target period : 12...
TRANSCRIPT

May 27, 2016
ICICI Securities Ltd | Retail Equity Research
Result Update
Good performance in challenging times… • Revenues declined 2.1% YoY to | 592 crore, higher than our
expectations of | 535.6 crore. The key surprise came in from 5% YoY growth in volumes at 53500 tonnes vs. our estimate of 8.1% YoY decline in volumes. In terms of segment, mining volumes grew 13% YoY. For FY16, AIA ended on a flattish volume base on the back of a weak global mining scenario. However, the management maintained its incremental 120000 tonnes of volume addition in FY17E-19E
• On the margin front, the EBITDA margin expanded 290 bps YoY to 28.9% (above I-direct estimate of 27.5%). Key drivers for margin beat were lower-than-expected employee costs, | 25 crore for Q4FY16 and lower other expenses that were down 15% YoY. However, gross margins contracted YoY and QoQ to 62% in Q4FY16
• Higher revenue and EBITDA coupled with lower effective tax rate of 27.1% in Q4FY16 vs. 34.4% in Q4FY15, led to PAT growth of 19.9%, which was way ahead of our estimates of | 100.6 crore
• On the capacity addition front, AIA will add greenfield capacity of 10000 tonnes by Q3FY18 with an estimated capex of | 350 crore. In FY17, the capex was pegged at | 150 crore while capex for FY16 was at | 178 crore
Opportunity in mining segment 4x that of cement for AIA
Current global consumption of high chrome mill internals (HCMI), which is equally applied in the cement and the mining space, is at ~6,00,000 tonnes per annum (TPA). With almost 80% penetration achieved for HCMI in the cement space, the mining segment provides the next leg up for HCMI players. It is estimated that at least 1.2 MTPA mining segment volumes for mill internals can be converted from forged media into HCMI, going ahead. Hence, we believe this will create an opportunity 4x that of current consumption of 3,00,000 TPA for HCMI players in mining.
Capacity expansion commences but tough global environment poses volume growth challenges in FY17E-18E
AIA has already commenced the first phase of capacity expansion of 80000 tonnes in Q3FY16 whereas the second phase will be coming in Q3-Q4FY18. The company is expected to further invest | 350 crore over FY17-18E towards this capex. However, given the weak global commodity cycle that we are passing through, the benefits of this expansion will be witnessed in FY18E-19E. Also, EBITDA margins would decline to 2% over the next few years as AIA will adopt entry level pricing strategy to market new capacity and win mining clients globally. Hence, in FY16E-17E, one may witness a muted financial performance of the company in terms of EBIDTA margins and profitability. We expect revenues to grow a meagre 6.2% CAGR in FY16-18E whereas 28% margins of FY16E may moderate to 24% in FY17E-18E. Magnitude of moderation in margin key in FY17E-18E AIA will be the biggest beneficiary of conversion from forged media to HCMI consumables in the long run as it will be the largest player globally by FY18E. However, a weak mining environment and pressure on margins owing to marketing of new capacity is expected to lead to muted 1.8% PAT CAGR in FY16-18E. We believe AIA possesses all the qualities of a portfolio stock. The stock is likely to consolidate in the medium term. We maintain HOLD rating with a target price of | 917.
AIA Engineering (AIAENG) | 938 Rating matrix
Rating : HoldTarget : | 917Target Period : 12 monthsPotential Upside : -2%
What’s changed?
Target Changed from | 765 to | 917EPS FY17E Chnaged from | 38.1 to | 42.9EPS FY18E Changed from | 40.3 to | 46.5Rating Unchanged
Quarterly performance
Q4FY16 Q4FY15 YoY (%) Q3FY16 QoQ (%)Revenue 592.0 604.8 -2.1 493.1 20.1EBITDA 171.3 157.5 8.8 148.6 15.3EBITDA (%) 28.9 26.0 290 bps 30.1 -119 bpsPAT 134.3 112.3 0.3 93.4 43.8
Key financials
| Crore FY15 FY16 FY17E FY18ENet Sales 2,183.6 2,100.4 2,279.2 2,430.2 EBITDA 549.4 609.3 603.4 642.9 Net Profit 413.2 417.8 405.0 432.8 EPS (|) 43.8 44.3 42.9 45.9
Valuation summary
FY15 FY16 FY17E FY18EP/E 22 21.3 22.0 20.5 Target P/E 26.4 26.1 26.9 25.2 EV / EBITDA 4.3 13.1 13.2 12.0 P/BV 20.0 3.7 3.3 3.0 RoNW (%) 23 17.5 15.1 14.4 RoCE (%) 22.5 21.0 18.0 17.0
Stock data Particular AmountMarket Capitalization | 8894.4 CroreTotal Debt (FY15) |125 croreCash and Investments (FY15) | 890 croreEV |812952 week H/L | 1082/701Equity capital | 18.9 CroreFace value | 2
Price performance
1M 3M 6M 12MCummins India (0.0) 9.3 36.1 104.0 Greaves Cotton (1.1) 21.9 32.8 106.8 VA Tech Wabag (1.1) 1.8 27.8 134.0 AIA Engineering (2.7) (5.7) 7.7 171.8
Research Analyst
Chirag J Shah [email protected]

ICICI Securities Ltd | Retail Equity Research Page 2
Variance analysis Q4FY16 Q4FY16E Q4FY15oY (Chg %) Q3FY16oQ (Chg %) Comments
Sales 592.0 535.9 604.8 -2.1 493.1 20.1 Volume growth of 5% YoY at 53500 tonnes surprised positively led by the mining segment
Other Income 21.4 17.0 17.0 26.0 7.0 206.7
Raw Materials Expenses 223.3 166.1 217.4 2.7 146.5 52.5Employee Cost 25.3 29.5 27.6 -8.2 26.5 -4.5Other Expenditure 172.0 192.9 202.4 -15.0 171.5 0.3
EBITDA 171.3 147.4 157.5 8.8 148.6 15.3EBITDA Margin (%) 28.9 27.5 26.0 290 bps 30.1 -119 bps Lower other expenses and employee costs led to EBITDA margin beat
Depreciation 18.1 18.0 18.0 0.3 15.1 19.9Interest 2.0 0.0 1.7 22.6 0.8 166.5
PBT 172.7 146.4 154.8 11.5 139.7 23.6Taxes 38.3 45.4 42.5 -9.9 46.3 -17.2PAT 134.3 101.0 112.3 19.6 93.4 43.8 Higher revenues, margin and lower tax rate led to PAT beat
Key MetricsVolume (in tonnes) 53,502 46,486 50,626 5.7 44,238 20.9 Mining volumes surised on the upside owing to destocking of inventory at
clinet siteNet Realisation (|/tonne) 111,362 111,419 116,002 -4.0 108,651 2.5 Realisations were flattish QoQ
Source: Company, ICICIdirect.com Research Change in estimates
(| Crore) Old New % Change Old New % Change CommentsRevenue 2,194.4 2,279.2 3.9 2,339.2 2,430.2 3.9 We have revised our mining volumes assumptions marginally upwards owing to storng
guidance from the managementEBITDA 542.6 603.4 11.2 572.5 642.9 12.3EBITDA Margin (%) 24.7 26.5 175 bps 24.5 26.5 198 bps Though margins will come down owing to markeeting of new capacity, we have been
conservative. Hence, we inch up our estiamtes marginally upwards
PAT 363.0 405.0 11.6 384.3 432.8 12.6EPS (|) 38.1 42.9 12.7 40.7 45.9 12.8 Revision in margin in FY17E and FY18E led to PAT revision upwards
FY17E FY18E
Source: Company, ICICIdirect.com Research Assumptions
FY15 FY16E FY17E FY18E FY17E FY18EOverall Volumes (tonnes) 186,656 185,788 204,367 235,022 194,392 223,551Mining Volumes (tonnes) 106,056 98,740 110,355 133,489 97,931 119,373Capacity 260,000 340,000 340,000 440,000 340,000 340,000 Capacity expansion is on track and will get executed by FY18E endNet Realisations 116,987 113,054 111,523 103,404 115,519 103,579 Realisation has been revised down as AIA will market new capacities at
competitive prices to penetrate new mines and clients globally
Current Earlier
Source: Company, ICICIdirect.com Research

ICICI Securities Ltd | Retail Equity Research Page 3
Company Analysis Volumes to face challenges owing to a weak external environment
Weak commodity cycle globally will affect the volume growth adversely in FY17E-18E as mining volumes have declined in FY16 to 98740 tonnes from 105300 tonnes. The same is expected to recover at a moderate rate at 110000 tonnes and 133000 tonnes. However, with new capacity coming on stream by FY17E, we expect modest volume growth of 10% and 15% in FY17E and FY18E, respectively. On a longer term basis, AIA has guided for incremental volumes of 120000 tonnes in FY16E-18E, most of which will be back-ended in nature.
Exhibit 1: Trend in revenues
9731172
1417
1751
2080 2184 21002279
2430
300
800
1300
1800
2300
2800
FY10 FY11 FY12 FY13 FY14 FY15 FY16E FY17E FY18E
(| c
rore
)
-10
-5
0
5
10
15
20
25
30
(%)
Revenues Growth in revenues
Source: Company, ICICIdirect.com, Research
Exhibit 2: Share of mining segment to rise to 67% by FY18E
55.6 46.5 45.4 37.4 36.4 39.5 38.8 41.9
35.8 45.1 45.7 54.4 56.8 53.1 54.065.3
8.2 8.5 8.7 8.2 6.8 7.3 7.2
0102030405060708090
100
FY11 FY12 FY13 FY14 FY15 FY16 FY17E FY18E
(%)
Cement Mining Utilities
Source: Company, ICICIdirect.com, Research
Exhibit 3: Trend in volume growth
50000
100000
150000
200000
250000
300000
350000
400000
FY08
FY09
FY10
FY11
FY12
FY13
FY14
FY15
FY16
E
FY17
E
FY18
E
(Ton
nes)
-5
0
5
10
15
20
25
(%)
Production Sales Growth in sales
Source: Company, ICICIdirect.com, Research
Exhibit 4: Trend in capacity
2000070000
120000170000220000270000320000370000420000470000
FY07
FY08
FY09
FY10
FY11
FY12
FY13
FY14
E
FY15
FY16
E
FY17
E
FY18
E
(Lak
h To
nnes
)
Source: Company, ICICIdirect.com, Research
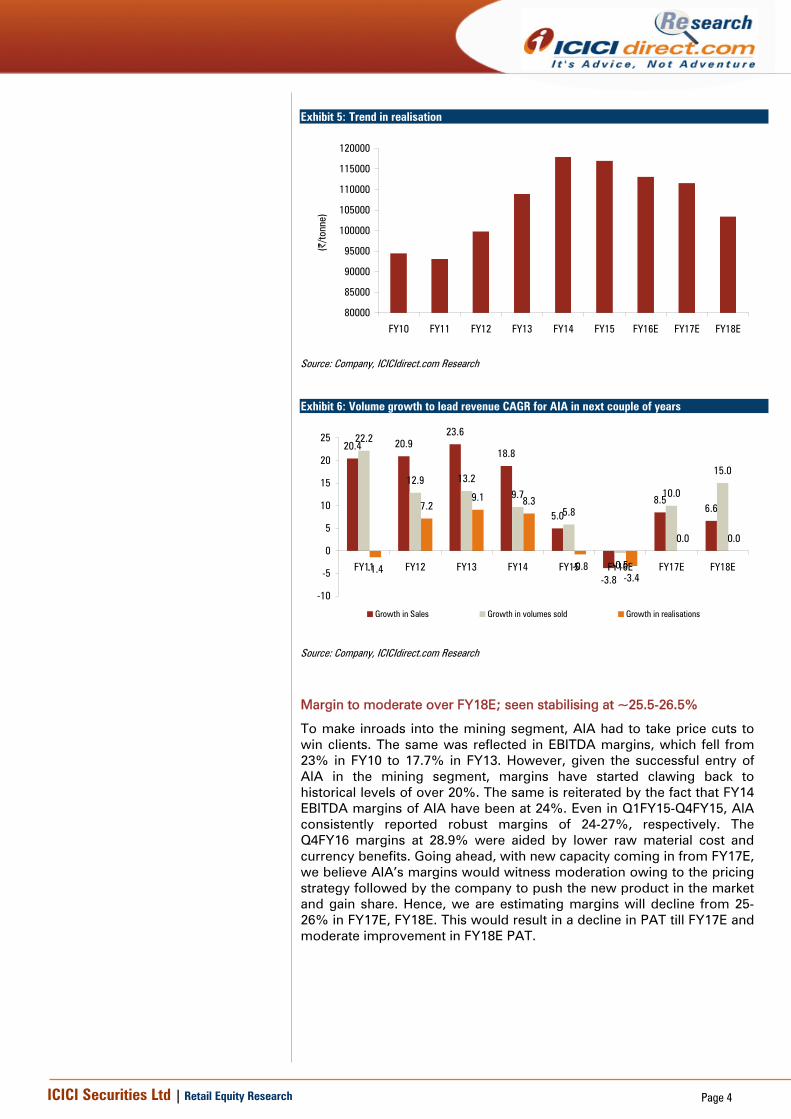
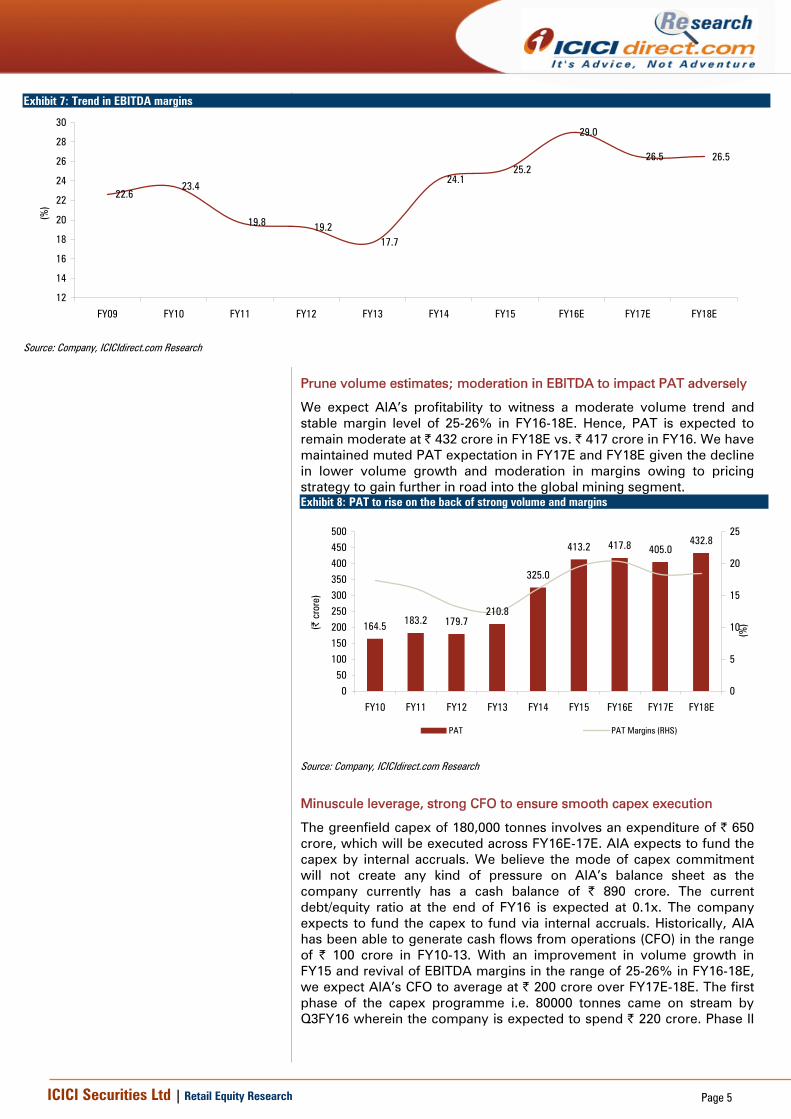
We do like the quality of revenue growth that AIA has posted historically and also that it is likely to register, going ahead. In any given fiscal, revenue growth is mainly explained by volume growth rather than realisation growth. On an average, in FY10-13, ~78% of revenue growth can be explained by volume growth. Even going ahead, over FY14-16E, our expectation is that revenue growth will be mainly volume driven as compared to flattish realisation. Our forecasts assume flattish realisations, which was at | 111000/tonne in FY17E-18E while we have assumed a decline of 8% YoY in FY18E as AIA penetrates new markets and clients with an entry level pricing strategy.
ICICI Securities Ltd | Retail Equity Research Page 4
Exhibit 5: Trend in realisation
80000
85000
90000
95000
100000
105000
110000
115000
120000
FY10 FY11 FY12 FY13 FY14 FY15 FY16E FY17E FY18E(|
/tonn
e)
Source: Company, ICICIdirect.com Research
Exhibit 6: Volume growth to lead revenue CAGR for AIA in next couple of years
20.4 20.923.6
18.8
5.0
-3.8
8.56.6
22.2
12.9 13.29.7
5.8
-0.5
10.0
15.0
-1.4
7.29.1 8.3
-0.8-3.4
0.0 0.0
-10
-5
0
5
10
15
20
25
FY11 FY12 FY13 FY14 FY15 FY16E FY17E FY18E
Growth in Sales Growth in volumes sold Growth in realisations
Source: Company, ICICIdirect.com Research
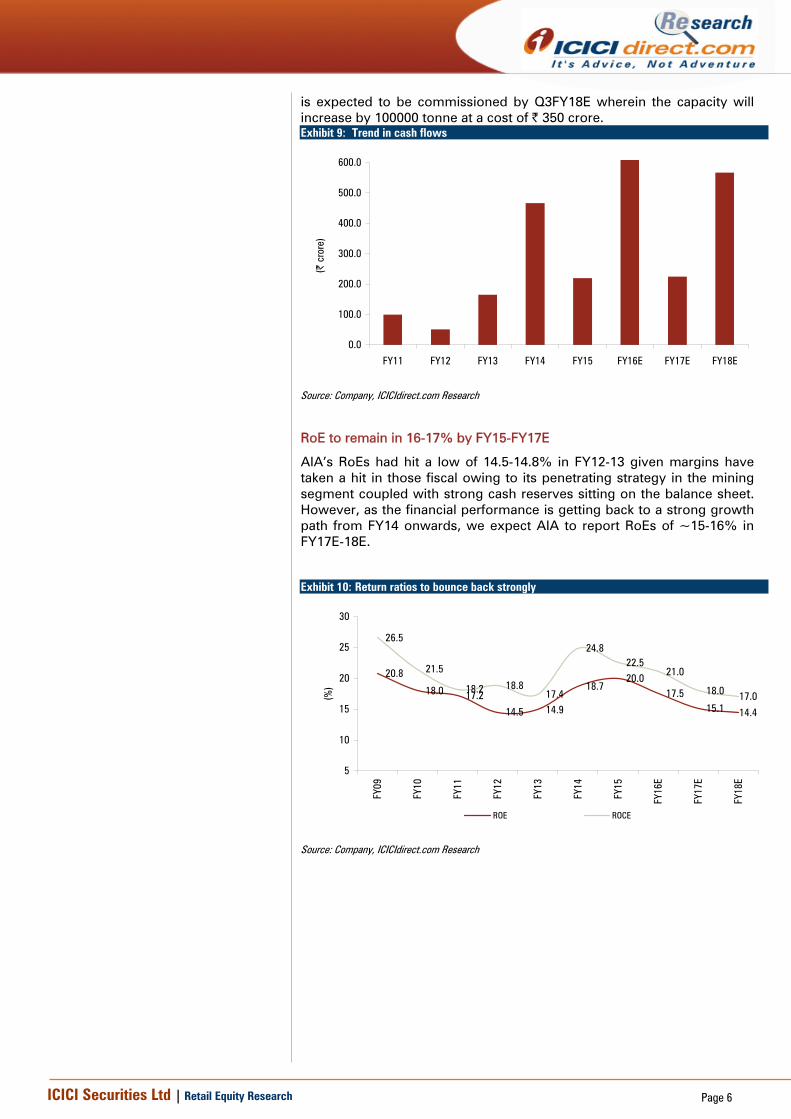
Margin to moderate over FY18E; seen stabilising at ~25.5-26.5%
To make inroads into the mining segment, AIA had to take price cuts to win clients. The same was reflected in EBITDA margins, which fell from 23% in FY10 to 17.7% in FY13. However, given the successful entry of AIA in the mining segment, margins have started clawing back to historical levels of over 20%. The same is reiterated by the fact that FY14 EBITDA margins of AIA have been at 24%. Even in Q1FY15-Q4FY15, AIA consistently reported robust margins of 24-27%, respectively. The Q4FY16 margins at 28.9% were aided by lower raw material cost and currency benefits. Going ahead, with new capacity coming in from FY17E, we believe AIA’s margins would witness moderation owing to the pricing strategy followed by the company to push the new product in the market and gain share. Hence, we are estimating margins will decline from 25-26% in FY17E, FY18E. This would result in a decline in PAT till FY17E and moderate improvement in FY18E PAT. Exhibit 34: Exiting lower margin projects to help drive margins
ICICI Securities Ltd | Retail Equity Research Page 5
Exhibit 7: Trend in EBITDA margins
22.623.4
19.8 19.217.7
24.125.2
29.0
26.5 26.5
12
14
16
18
20
22
24
26
28
30
FY09 FY10 FY11 FY12 FY13 FY14 FY15 FY16E FY17E FY18E
(%)
Source: Company, ICICIdirect.com Research
Prune volume estimates; moderation in EBITDA to impact PAT adversely
We expect AIA’s profitability to witness a moderate volume trend and stable margin level of 25-26% in FY16-18E. Hence, PAT is expected to remain moderate at | 432 crore in FY18E vs. | 417 crore in FY16. We have maintained muted PAT expectation in FY17E and FY18E given the decline in lower volume growth and moderation in margins owing to pricing strategy to gain further in road into the global mining segment. Exhibit 8: PAT to rise on the back of strong volume and margins
164.5 183.2 179.7210.8
325.0
413.2 417.8 405.0432.8
050
100150200250300350400450500
FY10 FY11 FY12 FY13 FY14 FY15 FY16E FY17E FY18E
(| c
rore
)
0
5
10
15
20
25
(%)
PAT PAT Margins (RHS)
Source: Company, ICICIdirect.com Research
Minuscule leverage, strong CFO to ensure smooth capex execution
The greenfield capex of 180,000 tonnes involves an expenditure of | 650 crore, which will be executed across FY16E-17E. AIA expects to fund the capex by internal accruals. We believe the mode of capex commitment will not create any kind of pressure on AIA’s balance sheet as the company currently has a cash balance of | 890 crore. The current debt/equity ratio at the end of FY16 is expected at 0.1x. The company expects to fund the capex to fund via internal accruals. Historically, AIA has been able to generate cash flows from operations (CFO) in the range of | 100 crore in FY10-13. With an improvement in volume growth in FY15 and revival of EBITDA margins in the range of 25-26% in FY16-18E, we expect AIA’s CFO to average at | 200 crore over FY17E-18E. The first phase of the capex programme i.e. 80000 tonnes came on stream by Q3FY16 wherein the company is expected to spend | 220 crore. Phase II
ICICI Securities Ltd | Retail Equity Research Page 6
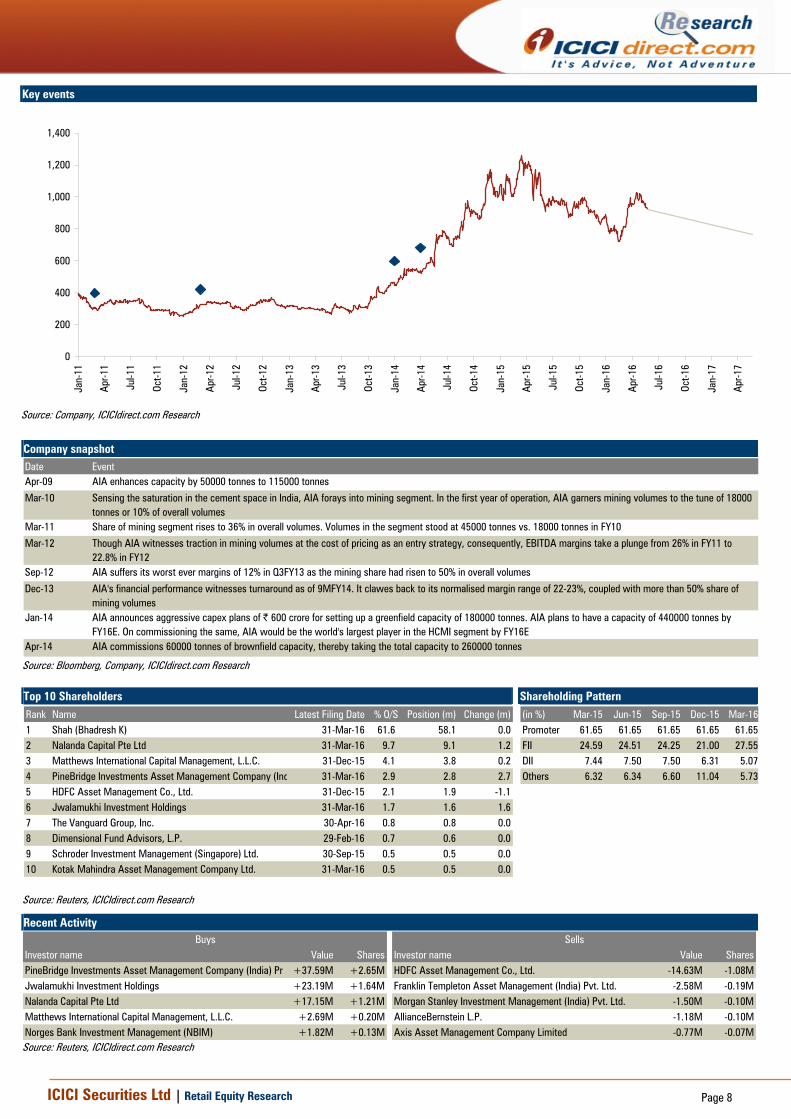
is expected to be commissioned by Q3FY18E wherein the capacity will increase by 100000 tonne at a cost of | 350 crore. Exhibit 9: Trend in cash flows
0.0
100.0
200.0
300.0
400.0
500.0
600.0
FY11 FY12 FY13 FY14 FY15 FY16E FY17E FY18E
(| c
rore
)
Source: Company, ICICIdirect.com Research
RoE to remain in 16-17% by FY15-FY17E
AIA’s RoEs had hit a low of 14.5-14.8% in FY12-13 given margins have taken a hit in those fiscal owing to its penetrating strategy in the mining segment coupled with strong cash reserves sitting on the balance sheet. However, as the financial performance is getting back to a strong growth path from FY14 onwards, we expect AIA to report RoEs of ~15-16% in FY17E-18E.
Exhibit 10: Return ratios to bounce back strongly
20.8
18.0 17.2
14.5 14.9
18.720.0
17.515.1 14.4
26.5
21.5
18.2 18.817.4
24.822.5
21.0
18.0 17.0
5
10
15
20
25
30
FY09
FY10
FY11
FY12
FY13
FY14
FY15
FY16
E
FY17
E
FY18
E
(%)
ROE ROCE
Source: Company, ICICIdirect.com Research

ICICI Securities Ltd | Retail Equity Research Page 7
Outlook and Valuation AIA will be the biggest beneficiary of conversion from forged media to HCMI consumables in the long run as it will be the largest player globally by FY18E. However, a weak mining environment and pressure on margins owing to marketing of new capacity is expected to lead to muted 1.8% PAT CAGR in FY16-18E. We believe AIA possesses all the qualities of a portfolio stock. The stock is likely to consolidate in the medium term. We maintain HOLD rating on the stock with a target price of | 917/share.
ICICI Securities Ltd | Retail Equity Research Page 8
Key events
0
200
400
600
800
1,000
1,200
1,400
Jan-
11
Apr-1
1
Jul-1
1
Oct-1
1
Jan-
12
Apr-1
2
Jul-1
2
Oct-1
2
Jan-
13
Apr-1
3
Jul-1
3
Oct-1
3
Jan-
14
Apr-1
4
Jul-1
4
Oct-1
4
Jan-
15
Apr-1
5
Jul-1
5
Oct-1
5
Jan-
16
Apr-1
6
Jul-1
6
Oct-1
6
Jan-
17
Apr-1
7
Source: Company, ICICIdirect.com Research
Company snapshot Date EventApr-09 AIA enhances capacity by 50000 tonnes to 115000 tonnes
Mar-10 Sensing the saturation in the cement space in India, AIA forays into mining segment. In the first year of operation, AIA garners mining volumes to the tune of 18000 tonnes or 10% of overall volumes
Mar-11 Share of mining segment rises to 36% in overall volumes. Volumes in the segment stood at 45000 tonnes vs. 18000 tonnes in FY10
Mar-12 Though AIA witnesses traction in mining volumes at the cost of pricing as an entry strategy, consequently, EBITDA margins take a plunge from 26% in FY11 to 22.8% in FY12
Sep-12 AIA suffers its worst ever margins of 12% in Q3FY13 as the mining share had risen to 50% in overall volumes
Dec-13 AIA's financial performance witnesses turnaround as of 9MFY14. It clawes back to its normalised margin range of 22-23%, coupled with more than 50% share of mining volumes
Jan-14 AIA announces aggressive capex plans of | 600 crore for setting up a greenfield capacity of 180000 tonnes. AIA plans to have a capacity of 440000 tonnes by FY16E. On commissioning the same, AIA would be the world's largest player in the HCMI segment by FY16E
Apr-14 AIA commissions 60000 tonnes of brownfield capacity, thereby taking the total capacity to 260000 tonnes
Source: Bloomberg, Company, ICICIdirect.com Research Top 10 Shareholders Shareholding Pattern Rank Name Latest Filing Date % O/S Position (m) Change (m)1 Shah (Bhadresh K) 31-Mar-16 61.6 58.1 0.02 Nalanda Capital Pte Ltd 31-Mar-16 9.7 9.1 1.23 Matthews International Capital Management, L.L.C. 31-Dec-15 4.1 3.8 0.24 PineBridge Investments Asset Management Company (Ind 31-Mar-16 2.9 2.8 2.75 HDFC Asset Management Co., Ltd. 31-Dec-15 2.1 1.9 -1.16 Jwalamukhi Investment Holdings 31-Mar-16 1.7 1.6 1.67 The Vanguard Group, Inc. 30-Apr-16 0.8 0.8 0.08 Dimensional Fund Advisors, L.P. 29-Feb-16 0.7 0.6 0.09 Schroder Investment Management (Singapore) Ltd. 30-Sep-15 0.5 0.5 0.010 Kotak Mahindra Asset Management Company Ltd. 31-Mar-16 0.5 0.5 0.0
(in %) Mar-15 Jun-15 Sep-15 Dec-15 Mar-16Promoter 61.65 61.65 61.65 61.65 61.65FII 24.59 24.51 24.25 21.00 27.55DII 7.44 7.50 7.50 6.31 5.07Others 6.32 6.34 6.60 11.04 5.73
Source: Reuters, ICICIdirect.com Research
Recent Activity
Investor name Value Shares Investor name Value SharesPineBridge Investments Asset Management Company (India) Pr +37.59M +2.65M HDFC Asset Management Co., Ltd. -14.63M -1.08MJwalamukhi Investment Holdings +23.19M +1.64M Franklin Templeton Asset Management (India) Pvt. Ltd. -2.58M -0.19MNalanda Capital Pte Ltd +17.15M +1.21M Morgan Stanley Investment Management (India) Pvt. Ltd. -1.50M -0.10MMatthews International Capital Management, L.L.C. +2.69M +0.20M AllianceBernstein L.P. -1.18M -0.10MNorges Bank Investment Management (NBIM) +1.82M +0.13M Axis Asset Management Company Limited -0.77M -0.07M
Buys Sells
Source: Reuters, ICICIdirect.com Research

ICICI Securities Ltd | Retail Equity Research Page 9
.
Financial summary Profit and loss statement | Crore (Year-end March) FY15 FY16 FY17E FY18ETotal operating Income 2,183.6 2,100.4 2,279.2 2,430.2Growth (%) 5.0 -3.8 8.5 6.6Raw Material Expenses 797.1 715.0 814.8 881.4Employee Expenses 98.1 102.2 103.2 110.0Other expenses 739.1 674.0 757.8 795.9Total Operating Expenditure 1,634.3 1,491.1 1,675.8 1,787.3EBITDA 549.4 609.3 603.4 642.9Growth (%) 9.4 10.9 -1.0 6.5Depreciation 50.3 71.8 88.1 98.8Interest 5.6 6.4 0.0 0.0Other Income 83.2 61.2 70.8 80.0PBT 576.6 592.3 586.1 624.1Others 0.0 0.0 0.0 0.0Total Tax 163.4 174.5 181.1 191.2PAT 413.2 417.8 405.0 432.8Growth (%) 27.1 1.1 -3.0 6.9EPS (|) 43.8 44.3 42.9 45.9
Source: Company, ICICIdirect.com Research
Cash flow statement | Crore (Year-end March) FY15 FY16 FY17E FY18EProfit after Tax 413.2 417.8 405.0 432.8Add: Depreciation 50.3 71.8 88.1 98.8(Inc)/dec in Current Assets -147.8 274.5 -265.7 20.1Inc/(dec) in CL and Provisions -96.2 -13.2 -3.4 14.4Others 3.3 3.0 5.0 5.0CF from operating activities 219.5 750.9 224.0 566.2(Inc)/dec in Investments 0.0 0.0 0.0 0.0(Inc)/dec in Fixed Assets -214.8 -343.3 -150.0 -200.0Others 0.0 0.0 0.0 0.0CF from investing activities -234.8 -363.3 -170.0 -270.0Issue/(Buy back) of Equity 0.0 0.0 0.0 0.0Inc/(dec) in loan funds 20.0 20.0 20.0 0.0Dividend paid & dividend tax -88.3 -99.3 -110.4 -110.4Inc/(dec) in Sec. premium 0.0 0.0 0.0 0.0Others 0.0 7.6 0.0 0.0CF from financing activities -63.9 -79.3 -90.4 -110.4Net Cash flow -79.2 308.2 -36.4 185.8Opening Cash 220.1 140.9 449.1 412.8Closing Cash 140.9 449.1 412.8 598.6
Source: Company, ICICIdirect.com Research
Balance sheet | Crore (Year-end March) FY15 FY16 FY17E FY18ELiabilitiesEquity Capital 18.9 18.9 18.9 18.9Reserve and Surplus 2,049.3 2,367.7 2,662.4 2,984.9Total Shareholders funds 2,068.1 2,386.6 2,681.2 3,003.7Total Debt 140.6 160.6 180.6 180.6Deferred Tax Liability 20.0 20.0 20.0 20.0Minority Interest / Others 0.0 0.0 0.0 0.0Total Liabilities 2,266.5 2,635.0 2,979.6 3,332.1
AssetsGross Block 849.7 1,128.0 1,278.0 1,428.0Less: Acc Depreciation 253.5 323.4 409.5 506.5Net Block 596.2 804.7 868.5 921.6Capital WIP 35.0 100.0 100.0 150.0Total Fixed Assets 631.2 904.7 968.5 1,071.6Investments 579.1 629.1 679.1 779.1Inventory 434.6 307.9 504.6 332.5Debtors 433.1 421.9 454.8 482.9Loans and Advances 272.7 137.9 171.9 298.1Other Current Assets 2.8 0.9 3.1 0.7Cash 140.9 449.1 412.8 598.6Total Current Assets 1,284.1 1,317.8 1,547.1 1,712.8Creditors 138.6 135.0 145.5 154.5Provisions 110.9 101.3 87.3 92.7Total Current Liabilities 249.5 236.3 232.8 247.3Net Current Assets 1,034.6 1,081.5 1,314.3 1,465.6Others Assets 0.0 0.0 0.0 0.0Application of Funds 2,266.5 2,635.0 2,979.6 3,332.1
Source: Company, ICICIdirect.com Research
Key ratios (Year-end March) FY15 FY16 FY17E FY18EPer share data (|)EPS 43.8 44.3 42.9 45.9Cash EPS 49.1 51.9 52.3 56.4BV 219.3 253.0 284.3 318.5DPS 8.0 9.0 10.0 10.0Cash Per Share 14.9 47.6 43.8 63.5Operating Ratios (%)EBITDA Margin 25.2 29.0 26.5 26.5PBT / Total Operating income 27.4 28.8 26.5 26.6PAT Margin 18.9 19.9 17.8 17.8Inventory days 68.0 66.0 67.0 65.0Debtor days 75.0 75.0 75.0 75.0Creditor days 24.0 24.0 24.0 24.0Return Ratios (%)RoE 20.0 17.5 15.1 14.4RoCE 22.5 21.0 18.0 17.0RoIC 33.0 36.9 28.8 30.2Valuation Ratios (x)P/E 21.5 21.3 22.0 20.5EV / EBITDA 15.1 13.1 13.2 12.0EV / Net Sales 3.9 3.9 3.6 3.3Market Cap / Sales 4.2 4.3 4.0 3.8Price to Book Value 4.3 3.7 3.3 3.0Solvency RatiosDebt/EBITDA 0.3 0.3 0.3 0.3Debt / Equity 0.1 0.1 0.1 0.1Current Ratio 5.1 5.6 6.6 6.9Quick Ratio 4.6 3.7 4.9 4.5
Source: Company, ICICIdirect.com Research

ICICI Securities Ltd | Retail Equity Research Page 10
ICICIdirect.com coverage universe (Capital Goods) CMP M Cap
(|) TP(|) Rating (| Cr) FY15 FY16E FY17E FY15 FY16E FY17E FY15 FY16E FY17E FY15 FY16E FY17EAIA Engineering 938 917 Hold 8630 34.5 43.7 44.0 30.3 23.9 23.7 24.8 22.8 21.6 18.7 19.8 17.4
Thermax (THERMA) 744 822 Hold 8891 32.3 23.1 27.1 35.3 41.4 31.3 13.2 14.2 14.2 10.8 11.8 12.1
KEC International (KECIN) 132 150 Buy 3881 7.5 9.2 11.6 17.6 14.4 11.4 12.8 16.1 17.3 13.6 14.5 15.8
Kalpataru Power(KPP) 230 234 Buy 3531 10.9 11.8 15.6 21.1 19.5 14.7 12.7 12.1 13.5 8.6 8.5 10.3
L&T (LARTOU) 1420 1655 Buy 131350 51.3 43.5 56.3 27.7 32.6 25.2 11.9 9.2 12.0 13.6 10.8 12.9
Greaves Cotton (GREAVE) 139 177 Buy 3392 3.5 7.5 8.9 39.3 18.5 15.5 18.0 12.6 14.5 10.5 19.6 20.3
SKF 1215 1170 Hold 6171 38.5 48.8 45.9 31.6 24.9 26.5 21.6 20.1 21.0 14.3 13.1 14.0VaTech Wabag 570 823 Buy 3150 25.0 23.5 30.3 22.8 24.2 18.8 17.8 17.4 16.3 12.7 15.0 12.9NRB Bearing 115 122 Hold 1115 5.5 6.2 7.9 20.9 18.6 14.5 16.3 17.1 20.3 20.9 20.2 22.1Timken India 537 594 Buy 3652 11.9 13.5 16.6 45.2 39.8 32.4 28.1 27.6 28.3 18.4 18.1 18.4Grindwell Norton 640 823 Buy 3543 18.6 18.5 22.4 34.3 34.7 28.6 24.1 22.0 24.0 16.8 15.1 16.4
RoE (%)EPS (|) P/E (x) RoCE (%)
Source: Company, ICICIdirect.com Research

ICICI Securities Ltd | Retail Equity Research Page 11
RATING RATIONALE ICICIdirect.com endeavours to provide objective opinions and recommendations. ICICIdirect.com assigns ratings to its stocks according to their notional target price vs. current market price and then categorises them as Strong Buy, Buy, Hold and Sell. The performance horizon is two years unless specified and the notional target price is defined as the analysts' valuation for a stock. Strong Buy: >15%/20% for large caps/midcaps, respectively, with high conviction; Buy: >10%/15% for large caps/midcaps, respectively; Hold: Up to +/-10%; Sell: -10% or more;
Pankaj Pandey Head – Research [email protected]
ICICIdirect.com Research Desk, ICICI Securities Limited, 1st Floor, Akruti Trade Centre, Road No 7, MIDC, Andheri (East) Mumbai – 400 093
ICICI Securities Ltd | Retail Equity Research Page 12
ANALYST CERTIFICATION We /I, Chirag Shah PGDBM, Research Analyst, authors and the names subscribed to this report, hereby certify that all of the views expressed in this research report accurately reflect our views about the subject issuer(s) or securities. We also certify that no part of our compensation was, is, or will be directly or indirectly related to the specific recommendation(s) or view(s) in this report.
Terms & conditions and other disclosures: ICICI Securities Limited (ICICI Securities) is a Sebi registered Research Analyst having registration no. INH000000990. ICICI Securities Limited (ICICI Securities) is a full-service, integrated investment banking and is, inter alia, engaged in the business of stock brokering and distribution of financial products. ICICI Securities is a wholly-owned subsidiary of ICICI Bank which is India’s largest private sector bank and has its various subsidiaries engaged in businesses of housing finance, asset management, life insurance, general insurance, venture capital fund management, etc. (“associates”), the details in respect of which are available on www.icicibank.com. ICICI Securities is one of the leading merchant bankers/ underwriters of securities and participate in virtually all securities trading markets in India. We and our associates might have investment banking and other business relationship with a significant percentage of companies covered by our Investment Research Department. ICICI Securities generally prohibits its analysts, persons reporting to analysts and their relatives from maintaining a financial interest in the securities or derivatives of any companies that the analysts cover. The information and opinions in this report have been prepared by ICICI Securities and are subject to change without any notice. The report and information contained herein is strictly confidential and meant solely for the selected recipient and may not be altered in any way, transmitted to, copied or distributed, in part or in whole, to any other person or to the media or reproduced in any form, without prior written consent of ICICI Securities. While we would endeavour to update the information herein on a reasonable basis, ICICI Securities is under no obligation to update or keep the information current. Also, there may be regulatory, compliance or other reasons that may prevent ICICI Securities from doing so. Non-rated securities indicate that rating on a particular security has been suspended temporarily and such suspension is in compliance with applicable regulations and/or ICICI Securities policies, in circumstances where ICICI Securities might be acting in an advisory capacity to this company, or in certain other circumstances. This report is based on information obtained from public sources and sources believed to be reliable, but no independent verification has been made nor is its accuracy or completeness guaranteed. This report and information herein is solely for informational purpose and shall not be used or considered as an offer document or solicitation of offer to buy or sell or subscribe for securities or other financial instruments. Though disseminated to all the customers simultaneously, not all customers may receive this report at the same time. ICICI Securities will not treat recipients as customers by virtue of their receiving this report. Nothing in this report constitutes investment, legal, accounting and tax advice or a representation that any investment or strategy is suitable or appropriate to your specific circumstances. The securities discussed and opinions expressed in this report may not be suitable for all investors, who must make their own investment decisions, based on their own investment objectives, financial positions and needs of specific recipient. This may not be taken in substitution for the exercise of independent judgment by any recipient. The recipient should independently evaluate the investment risks. The value and return on investment may vary because of changes in interest rates, foreign exchange rates or any other reason. ICICI Securities accepts no liabilities whatsoever for any loss or damage of any kind arising out of the use of this report. Past performance is not necessarily a guide to future performance. Investors are advised to see Risk Disclosure Document to understand the risks associated before investing in the securities markets. Actual results may differ materially from those set forth in projections. Forward-looking statements are not predictions and may be subject to change without notice. ICICI Securities or its associates might have managed or co-managed public offering of securities for the subject company or might have been mandated by the subject company for any other assignment in the past twelve months. ICICI Securities or its associates might have received any compensation from the companies mentioned in the report during the period preceding twelve months from the date of this report for services in respect of managing or co-managing public offerings, corporate finance, investment banking or merchant banking, brokerage services or other advisory service in a merger or specific transaction. ICICI Securities or its associates might have received any compensation for products or services other than investment banking or merchant banking or brokerage services from the companies mentioned in the report in the past twelve months. ICICI Securities encourages independence in research report preparation and strives to minimize conflict in preparation of research report. ICICI Securities or its analysts did not receive any compensation or other benefits from the companies mentioned in the report or third party in connection with preparation of the research report. Accordingly, neither ICICI Securities nor Research Analysts have any material conflict of interest at the time of publication of this report. It is confirmed that Chirag Shah PGDBM, Research Analyst of this report have not received any compensation from the companies mentioned in the report in the preceding twelve months. Compensation of our Research Analysts is not based on any specific merchant banking, investment banking or brokerage service transactions. ICICI Securities or its subsidiaries collectively or Research Analysts do not own 1% or more of the equity securities of the Company mentioned in the report as of the last day of the month preceding the publication of the research report. Since associates of ICICI Securities are engaged in various financial service businesses, they might have financial interests or beneficial ownership in various companies including the subject company/companies mentioned in this report. It is confirmed that Chirag Shah PGDBM, Research Analyst do not serve as an officer, director or employee of the companies mentioned in the report. ICICI Securities may have issued other reports that are inconsistent with and reach different conclusion from the information presented in this report. Neither the Research Analysts nor ICICI Securities have been engaged in market making activity for the companies mentioned in the report. We submit that no material disciplinary action has been taken on ICICI Securities by any Regulatory Authority impacting Equity Research Analysis activities. This report is not directed or intended for distribution to, or use by, any person or entity who is a citizen or resident of or located in any locality, state, country or other jurisdiction, where such distribution, publication, availability or use would be contrary to law, regulation or which would subject ICICI Securities and affiliates to any registration or licensing requirement within such jurisdiction. The securities described herein may or may not be eligible for sale in all jurisdictions or to certain category of investors. Persons in whose possession this document may come are required to inform themselves of and to observe such restriction.