rating systems and sbtool - aiacc · a1.2 pre-development agricultural value of land. 1 1 a1.3...
TRANSCRIPT

Rating Systems and SBTool
Nils Larsson
The International Initiative for a Sustainable Built Environment
Seoul, June 2007

To improve building performance, we must first be able to measure it;
Measuring energy or water consumption or indoor air quality during operations is relatively easy;
At the design stage, energy can be predicted by simulation programs, and other parameters can be roughly predicted by following standards or by the type of equipment used;
Given the popularity of “green” or “sustainable” we want to assess a wide range of performance, at design stage and during operations;
The kinds of performance parameters relevant to green or sustainable building include the following:
Performance

A practical definition of specific performance
aspects relevant to GB and SB
Fuel consumption of non-renewable fuels
Water consumption
Land consumption
Materials consumption
Greenhouse gas emissions
Other atmospheric emissions
Impacts on site ecology
Solid waste / liquid effluents
Indoor air quality, lighting, acoustics
Longevity, adaptability, flexibility
Operations and maintenance
Su
sta
inab
le B
uild
ing
Gre
en
Bu
ildin
g
Social and economic considerations
Urban / planning issues

If we want to have an overall understanding of such a broad range of performance issues, we must make an overall assessment of performance;
This means that we must develop an understanding of the relative importance of issues (e.g. air quality relative to emissions) as well as being able to estimate performance levels of specific issues;
To meet this need, performance rating systems, such as BREEAM, LEED or CASBEE were developed;
The early systems, BREEAM and LEED, started as checklists of what to do and what not to do;
They rapidly developed into systems that awarded points for the achievement of various specific achievements;
Performance Rating Systems

Since some issues were awarded more points than others (more for good air quality than for bicycle parking), these systems also include embedded weightings of importance;
The advantage of such systems is simplicity, but the disadvantage is that the weightings of relative importance tend to be developed for one location, but then used in many others;
Similarly, benchmarks of what is considered good performance also tend to have limited regional application;
SBTool follows a different model.
Performance Rating Systems
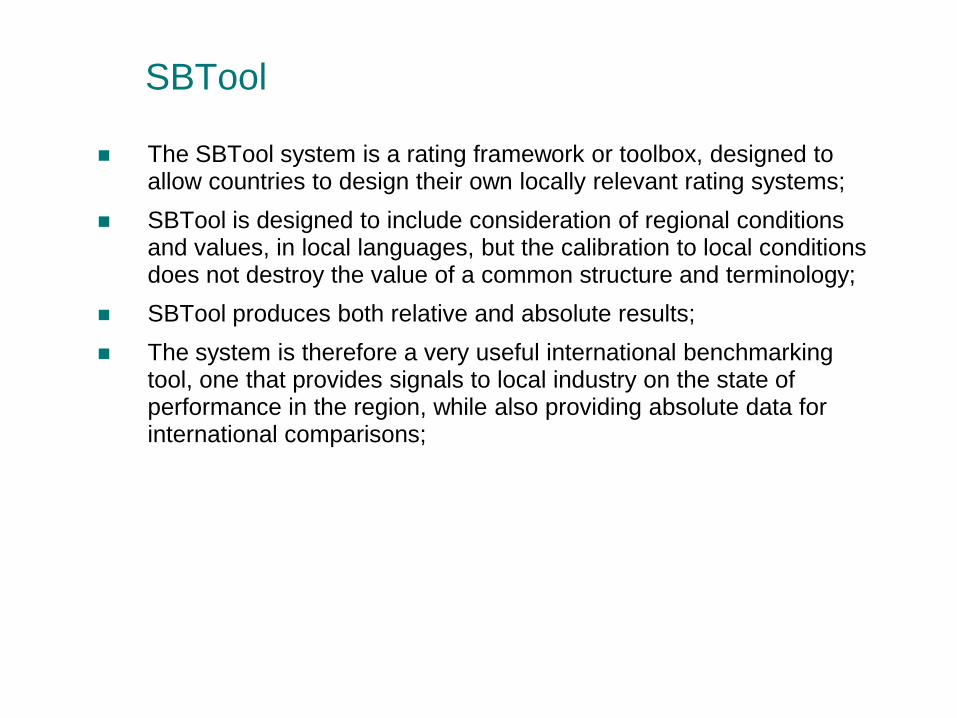
The SBTool system is a rating framework or toolbox, designed to allow countries to design their own locally relevant rating systems;
SBTool is designed to include consideration of regional conditions and values, in local languages, but the calibration to local conditions does not destroy the value of a common structure and terminology;
SBTool produces both relative and absolute results;
The system is therefore a very useful international benchmarking tool, one that provides signals to local industry on the state of performance in the region, while also providing absolute data for international comparisons;
SBTool
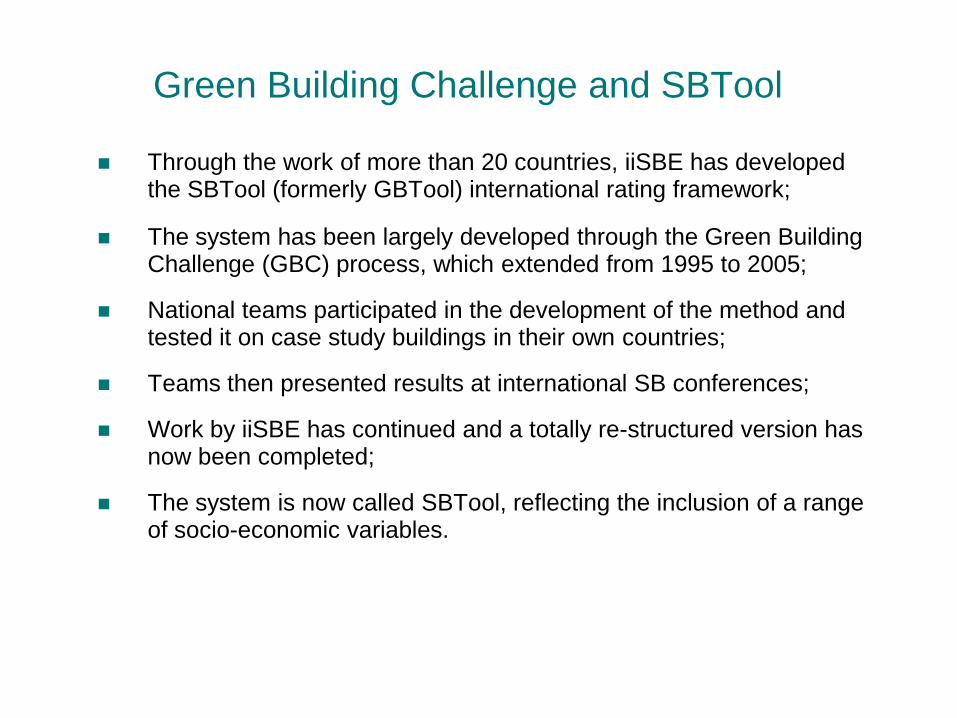
Through the work of more than 20 countries, iiSBE has developed the SBTool (formerly GBTool) international rating framework;
The system has been largely developed through the Green Building Challenge (GBC) process, which extended from 1995 to 2005;
National teams participated in the development of the method and tested it on case study buildings in their own countries;
Teams then presented results at international SB conferences;
Work by iiSBE has continued and a totally re-structured version has now been completed;
The system is now called SBTool, reflecting the inclusion of a range of socio-economic variables.
Green Building Challenge and SBTool

SBTool Structure

Very important to note: the system is a rating framework or
toolbox and only becomes a rating tool after a third party
calibrates it for their region by defining scope and setting
weights, context and performance benchmarks;
The system is totally modular in scope;
It is set up to allow easy insertion of local criteria and/or
language;
It handles all four major phases;
… new and renovation projects;
… up to three occupancy types in a single project;
SBTool provides relative and absolute outputs.
2007 SBTool - Features

Basis of SBTool
The system contains three levels of parameters that nest within each
other; Issues, Categories and Criteria;
Criteria are scored according to the following scale:
-1 = Deficient
0 = Minimum acceptable performance
+3 = Good Practice
+5 = Best practice
Criteria scores are weighted;
Category scores are the total of weighted Criteria scores;
Issue scores are the total of weighted Category scores.

Structure and Scoring
8 Issues
(Indoor Env. Quality)
29 Categories
(Ventilation)
125 Criteria
(Ventilation effectiveness)
Sum of weighted
Issue scores
Sum of weighted
Criteria scores
within Category
Sum of weighted
Category scores
within Issue

A Site Selection, Project Planning and Development
A1 Site Selection
A2 Project Planning
A3 Urban Design and Site Development
B Energy and Resource Consumption
B1 Total Life Cycle Non-Renew able Energy
B2 Electrical peak demand for facility operations
B3 Renew able Energy
B4 Materials
B5 Potable Water
C Environmental Loadings
C1 Greenhouse Gas Emissions
C2 Other Atmospheric Emissions
C3 Solid Wastes
C4 Rainw ater, Stormw ater and Wastew ater
C5 Impacts on Site
C6 Other Local and Regional Impacts
D Indoor Environmental Quality
D1 Indoor Air Quality
D2 Ventilation
D3 Air Temperature and Relative Humidity
D4 Daylighting and Illumination
D5 Noise and Acoustics
E Service Quality
E1 Safety and Security During Operations
E2 Functionality and efficiency
E3 Controllability
E4 Flexibility and Adaptability
E5 Commissioning of facility systems
E6 Maintenance of Operating Performance
F Social and Economic aspects
F1 Social Aspects
F2 Cost and Economics
G Cultural and Perceptual Aspects
G1 Culture & Heritage
G2 Perceptual
Issues and
Categories
are the
highest
level of
parameters.

Master List of SBTool Parameters
P-Dsn Dsn C&C Ops
A Site Selection, Project Planning and Development
A1 Site Selection
A1.1 Pre-dev elopment ecological v alue or sensitiv ity of land. 1 1
A1.2 Pre-dev elopment agricultural v alue of land. 1 1
A1.3 Vulnerability of land to f looding. 1 1
A1.4 Potential f or dev elopment to contaminate nearby bodies of water. 1 1
A1.5 Pre-dev elopment contamination status of land. 1 1
A1.6 Proximity of site to public transportation. 1 1
A1.7 Distance between site and centres of employ ment or residential occupancies. 1 1
A1.8 Proximity to commercial and cultural f acilities. 1 1
A1.9 Proximity to public recreation and f acilities. 1 1
A2 Project Planning
A2.1 Feasibility of use of renewables. 1 1
A2.2 Use of Integrated Design Process. 1 1
A2.3 Potential env ironmental impact of dev elopment or re-dev elopment. 1 1
A2.4 Prov ision of surf ace water management sy stem. 1 1 1
A2.5 Av ailability of potable water treatment sy stem. 1 1 1
A2.6 Av ailability of a split grey / potable water sy stem. 1 1 1
A2.7 Collection and recy cling of solid wastes in the community or project. 1 1 1
A2.8 Composting and re-use of sludge in the community or project. 1 1 1
A2.9 Site orientation to maximize passiv e solar potential. 1 1
A3 Urban Design and Site Development
A3.1 Dev elopment density . 1 1
A3.2 Prov ision of mixed uses within the project. 1 1 1
A3.3 Encouragement of walking. 1 1
A3.4 Support f or bicy cle use. 1 1
A3.5 Policies gov erning use of priv ate v ehicles. 1 1
A3.6 Prov ision of project green space. 1
A3.7 Use of nativ e plantings. 1 1 1
A3.8 Prov ision of trees with shading potential. 1 1 1
A3.9 Dev elopment or maintenance of wildlif e corridors. 1 1 1
B Energy and Resource Consumption
B1 Total Life Cycle Non-Renewable Energy
B1.1 Annualized non-renewable primary energy embodied in construction materials. 1
B1.2 Annual non-renewable primary energy used f or f acility operations 1 1
B2 Electrical peak demand for facility operations 1 1
B3 Renewable Energy
B3.1 Use of of f -site energy that is generated f rom renewable sources. 1 1
B3.2 Prov ision of on-site renewable energy sy stems. 1 1
B4 Materials
B4.1 Re-use of suitable existing structure(s). 1 1 1
B4.2 Minimal use of f inishing materials. 1 1
B4.3 Minimal use of v irgin materials. 1 1
B4.4 Use of durable materials. 1 1
B4.5 Re-use of salv aged materials. 1 1
B4.6 Use of recy cled materials f rom of f -site sources. 1 1
B4.7 Use of bio-based products obtained f rom sustainable sources. 1 1
B4.8 Use of cement supplementing materials in concrete. 1 1
B4.9 Use of materials that are locally produced. 1 1
B4.10 Design f or disassembly , re-use or recy cling. 1 1
B5 Potable Water
B5.1 Use of potable water f or site irrigation. 1 1
B5.2 Use of potable water f or occupancy needs. 1 1
B5.3 Water embodied in materials - not activ e.
C Environmental Loadings
C1 Greenhouse Gas Emissions
C1.1 Annualized GHG emissions embodied in construction materials. 1
C1.2 Annual GHG emissions f rom all energy used f or f acility operations. 1 1
C1.3 Annual GHG emissions f rom commuting transport
C2 Other Atmospheric Emissions
C2.1 Emissions of ozone-depleting substances during f acility operations. 1 1
C2.2 Emissions of acidif y ing emissions during f acility operations. 1 1
C2.3 Emissions leading to photo-oxidants during f acility operations. 1 1
C3 Solid Wastes
C3.1 Solid waste resulting f rom the construction and demolition process. 1 1
C3.2 Solid waste resulting f rom f acility operations. 1 1
C4 Rainwater, Stormwater and Wastewater
C4.1 Liquid ef f luents f rom f acility operations sent of f the site. 1 1
C4.2 Retention of rainwater f or later re-use. 1 1
C4.3 Untreated stormwater retained on the site. 1 1
C4.4 Embodied waste water - not activ e.
C5 Impacts on Site
C5.1 Impact of construction process on natural f eatures of the site. 1 1
C5.2 Impact of construction process or landscaping on soil erosion. 1 1
C5.3 Changes in biodiv ersity on the site. 1 1 1
C5.4 Adv erse wind conditions at grade around tall buildings. 1
C5.5 Minimizing danger of hazardous waste on site. 1 1
C6 Other Local and Regional Impacts
C6.1 Impact on access to day light or solar energy potential of adjacent property 1
C6.2 Cumulativ e thermal changes to lake water or sub-surf ace aquif ers. 1 1
C6.3 Heat Island Ef f ect - landscaping and pav ed areas. 1 1
C6.4 Heat Island Ef f ect - roof ing. 1 1
C6.5 Atmospheric light pollution. 1 1
C6.6 Mercury waste f rom power generation - not activ e.
C6.7 Nuclear waste f rom power generation - not activ e.
D Indoor Environmental Quality
D1 Indoor Air Quality
D1.1 Protection of materials during construction phase. 1
D1.2 Remov al, bef ore occupancy , of pollutants emitted by new interior f inish materials. 1
D1.3 Of f -gassing of pollutants f rom interior f inish materials. 1
D1.4 Pollutant migration between occupancies. 1 1
D1.5 Pollutants generated by f acility maintenance. 1 1
D1.6 Pollutants generated by occupant activ ities 1 1
D1.7 CO2 concentrations in indoor air. 1 1
D1.8 IAQ monitoring during project operations. 1 1
D2 Ventilation
D2.1 Ef f ectiv eness of v entilation in naturally v entilated occupancies. 1 1
D2.2 Air quality and v entilation in mechanically v entilated occupancies. 1 1
D2.3 Air mov ement in mechanically v entilated occupancies. 1 1
D2.4 Ef f ectiv eness of v entilation in mechanically v entilated occupancies. 1 1
D3 Air Temperature and Relative Humidity
D3.1 Air temperature and relativ e humidity in mechanically cooled occupancies. 1 1
D3.2 Air temperature in naturally v entilated occupancies. 1 1
D4 Daylighting and Illumination
D4.1 Day lighting in primary occupancy areas. 1 1
D4.2 Glare in non-residential occupancies. 1 1
D4.3 Illumination lev els and quality of lighting in non-residential occupancy design. 1 1
D5 Noise and Acoustics
D5.1 Noise attenuation through the exterior env elope. 1 1
D5.2 Transmission of f acility equipment noise to primary occupancies. 1 1
D5.3 Noise attenuation between primary occupancy areas. 1 1
D5.4 Acoustic perf ormance within primary occupancy areas. 1 1
D6 Control of electromagnetic emissions
E Service Quality
E1 Safety and Security During Operations
E1.1 Minimization of risk to occupants and f acilities f rom f ire.
E1.2 Minimization of risk to occupants and f acilities f rom f looding.
E1.3 Minimization of risk to occupants and f acilities f rom earthquake.
E1.4 Minimization of risk to occupants and f acilities f rom use of explosiv e dev ices.
E1.5 Minimization of risk to occupants f rom biological or chemical substances.
E1.6 Maintenance of core building f unctions during power outages. 1 1
E1.7 Personal security f or building users during normal operations.
E1.8 Security f rom thef t f or building tenancies and occupants during normal operations.
E2 Functionality and efficiency
E2.1 Adequacy of ty pe of f acilities prov ided f or tenant or occupant needs.
E2.2 Functionality of lay out(s).
E2.3 Adequacy of space prov ided f or required f unctions.
E2.4 Adequacy of equipment f or required f unctions.
E2.5 Spatial ef f iciency . 1 1
E2.6 Volumetric ef f iciency . 1 1
E3 Controllability
E3.1 Prov ision and operation of an ef f ectiv e f acility management control sy stem. 1 1
E3.2 Capability f or partial operation of f acility technical sy stems. 1 1
E3.3 Degree of local control of lighting sy stems in non-residential occupancies. 1 1
E3.4 Degree of personal control of technical sy stems by occupants. 1 1
E4 Flexibility and Adaptability
E4.1 Ability to modif y f acility technical sy stems. 1 1
E4.2 Adaptability constraints imposed by structure. 1
E4.3 Adaptability constraints imposed by f loor-to-f loor heights. 1
E4.4 Adaptability constraints imposed by building env elope and technical sy stems. 1
E4.5 Adaptability to f uture changes in ty pe of energy supply . 1
E5 Commissioning of facility systems 1 1 1
E6 Maintenance of Operating Performance
E6.1 Maintenance of building env elope perf ormance. 1 1
E6.2 Use of durable materials - not y et activ e
E6.3 Dev elopment and implementation of a maintenance management plan. 1 1
E6.4 On-going monitoring and v erif ication of perf ormance. 1 1
E6.5 Retention of as-built drawings and documentation. 1
E6.6 Prov ision and maintenance of a building log. 1
E6.7 Perf ormance incentiv es in leases or sales agreements. 1 1
E6.8 Skills and knowledge of operating staf f . 1 1
F Social and Economic aspects
F1 Social Aspects
F1.1 Minimization of construction accidents. 1 1
F1.2 Access f or phy sically handicapped persons. 1
F1.3 Access to direct sunlight f rom liv ing areas of dwelling units. 1
F1.4 Access to priv ate open space f rom dwelling units. 1
F1.5 Visual priv acy f rom the exterior in principal areas of dwelling units. 1
F1.6 Access to v iews f rom work areas. 1 1
F1.7 Integration of project with local community .
F2 Cost and Economics
F2.1 Minimization of lif e-cy cle cost. 1 1
F2.2 Minimization of construction cost. 1 1
F2.3 Minimization of operating and maintenance cost. 1 1
F2.4 Af f ordability of residential rental or cost lev els. 1 1
F2.5 Support of Local Economy . 1 1
F2.6 Commercial v iability 1
G Cultural and Perceptual Aspects
G1 Culture & Heritage
G1.1 Relationship of design with existing streetscapes. 1
G1.2 Compatibility of urban design with local cultural v alues. 1
G1.3 Maintenance of heritage v alue of existing f acility . 1 1 1
Maximum number of parameters that may currently be active 21 115 23 73
Phase activ e
02 September 2006
The full list
of Criteria is
quite long…

Subject
Benchmark
5
3
1
0
-1
Weights Performance Profile
Performance Explanation
EcoLabel
Core criteria & weights
Region / Bldg. Mods.
Hard Data
Soft Data
Schematic of SBTool Scoring and Weighting
Input Assessment Output

SBTool Process Flow
Local iiSBE defines
scope, context,
weights & benchmarks
in A file
Design team defines
basic and detailed
project characteristics
in B file
Design team enters
performance targets
and official self-
assessment values in
C file
Independent assessor
reviews self-
assessments in C file
Local iiSBE reviews
Simulations and
other external
calculations
iiSBE HQ provides
SBTool framework
iiSBE HQ does QA
and issues
certification
Certification

Defining scope and
setting weights for the
region and generic
building type in the
SBT07-A Settings file

Site Selection, Project
Planning and Urban Design
Energy and Resource
Consumption
Environmental Loadings
Indoor Environmental Quality
Service Quality
Social and Economic
Aspects
Cultural and Perceptual
Aspects
Pre-Design DesignConstruction & Commissioning
Operations
Office
Residential
Other
Scope is
easy to
define

… a form that suits the
definition of Green Building….
Office
Residential
Other
Energy and Resource
Consumption
Environmental Loadings
Indoor Environmental
Quality
DesignConstruction &
CommissioningOperations

…or a very
compact form,
suitable for
governments…
Energy and Resource
Consumption
Environmental Loadings
Operations


… but in most
cases, local
organizations
will want to
establish their
own scope,
weights and
benchmarks

Design PhaseWeighting of Criteria for Ottawa, Canada
Generic
Wei
ghting o
n or off
Ext
ent o
f pote
ntial e
ffec
t (glo
bal o
r re
gional
= 3
,
urban
or nbhd. =
2, b
uildin
g or s
ite =
1)
Inte
nsity
of p
otentia
l effec
t (st
rong o
r dir
ect =
3,
moder
ate
or in
direc
t = 2
, wea
k =
1)
Dura
tion o
f pote
ntial e
ffec
t
(>5
0 yr
= 3
, >1
0 yr
= 2
, <10
yr =
1)
Weights for Criteria are established
through the estimates of environmental
impact at left. The initial w eights are then
modified by various Site Context conditions, or building
characteristics, such as size, height etc.
These settings can be seen in Columns H-J (hidden). The
w eights can also be turned off (Col. A).
We
igh
ts w
ith
in g
rou
p
We
igh
ts, to
tal syste
m
A Site Selection, Project Planning and Development
A1 Site Selection
2 2 3 A1.1 Pre-dev elopment ecological v alue or sensitiv ity of land. 0.0% 0.0%
2 2 3 A1.2 Pre-dev elopment agricultural v alue of land. 0.0% 0.0%
2 3 1 A1.3 Vulnerability of land to f looding. 0.0% 0.0%
3 2 3 A1.4 Potential f or dev elopment to contaminate nearby bodies of water. 0.0% 0.0%
2 3 3 A1.5 Pre-dev elopment contamination status of land. 0.0% 0.0%
2 3 2 A1.6 Proximity of site to public transportation. 0.0% 0.0%
2 3 2 A1.7Distance between site and centres of employ ment or residential occupancies.
0.0% 0.0%
2 1 2 A1.8 Proximity to commercial and cultural f acilities. 0.0% 0.0%
2 1 2 A1.9 Proximity to public recreation areas and f acilities. 0.0% 0.0%
A2 Project Planning
1 2 3 A2.1 Feasibility of use of renewables. 10.0% 0.5%
1 2 3 A2.2 Use of Integrated Design Process. 10.0% 0.5%
2 2 3 A2.3 Potential env ironmental impact of dev elopment or re-dev elopment. 20.0% 0.9%
2 2 2 A2.4 Prov ision of surf ace water management sy stem. 13.3% 0.6%
2 3 1 A2.5 Av ailability of potable water treatment sy stem. 10.0% 0.5%
9.3%
0.0%
50.0%
Def ault v alues below =2. Range is 1 to 3.
Weighting of Criteria
for generic building
type in SBT07-A
Settings file
Criteria
weights are
set
automatically,
but can be
toggled off
Weights are zero
since Category A1
was set to zero
Weights within Category
Weights within all

Defining Context and
Benchmarks for the
generic building type in
the region, in the
SBT07-A Settings file

Context for
the Urban
area is
defined in the
SBT07-A
Settings file
Click blue boxes to select specific condition
1 2 1/2% Winter Design Temperature 2 1/2% Winter Design Temperature is below 0 Deg. C.
2 Climate zone 5 (to be def ined in the region)
3Percentage of day s during warm season when night temperatures are at least 10 deg. C. lower than day -time temps (f ree cooling potential).
75%
4 Av erage annual hours of sunshine in the region 2500
5 Urban area ty pe Small city of 10,000 to 50,000 population
6 Quality of public transportation in the area There is public transport serv ice with f requent serv ice.
7 Capability of municipal potable water sy stem to meet demand.There is suf f icient water f or current and anticipated uses and there is no rationing.
8Capability of local storm water inf rastructure to meet marginal demand.
Existing storm water inf rastructure can satisf y base and peak loads, using 95% of capacity or less.
9 Capability of local sewage inf rastructure to meet marginal demand.Existing sewage inf rastructure can satisf y base and peak loads, using 98% of capacity or less.
10Capability of electrical distribution inf rastructure to meet marginal demand.
Existing inf rastructure can satisf y base and peak loads, using 95% of capacity or less.
11Regional av ailability of materials and products that can be re-used in a new structure.
There are materials, products or f urnishings av ailable in the region f or re-use in the project, and they can be refurbished.
12Regional av ailability of recy cled materials that are produced in an energy -ef f icient process.
There is an adequate range of recy cled materials av ailable in the region f or use in the project, and the recy cling processes are somewhat ef f icient.
Context Issue
Click 1 or 2 at upper left to show details
Regional or Urban Context for Ottawa, Canada
The purpose of this worksheet is to characterize aspects of urban surroundings that may support or limit the performance of the building. Go to Level 2 to see available text to make your choice, or change those choices.

To make the system relevant for local conditions, benchmarks
must be established for the generic building type at the 0, +3
and +5 performance levels, for all active criteria;
Benchmarks are structured in two forms: data-oriented
benchmarks that describe performance parameters that can
validly be described in numbers, and text-oriented; and text
benchmarks that attempt to describe various levels of
performance in more subjective areas;
Benchmarks can be established through a review of
regulations, analysis of local building performance data, or by
consensus within small expert groups
Benchmarking

E2.5
To encourage the efficient utilization of space within buildings.
The ratio of directly f unctional net areas to total net area in each occupancy . Total Net Areas exclude only structure and building env elope areas; Net Functional Areas exclude interior garages, v ertical circulation and building mechanical rooms.
Dsn. Ops
0
Office on Percent Score
71% -1
75% 0
87% 3
95% 5
f
Applicable Standards
Applicable Standards
Inf ormation Submittals
Inf ormation Submittals
b
c
d
e
Inf ormation Submittals
All occupancies
Acceptable practice
Negativ e
Best Practice
Applicable phases (Activ e if green)
The ratio of directly f unctional net areas to total net area within the occupancy , according to design documentation.
Applicable project ty pe
Intent
Inf ormation sources
a
Indicator
Spatial efficiency.
Good Practice
Occupancy 1
Applicable Standards
SBT07-A Settings file : Example of
a numeric Benchmark
Values entered in yellow cells
determine the slope of the line
and hence other values.
Active phase is
Operations
In this case, there is one occupancy (Office)

Active phase
is Design
E3.1
To ensure that a building management control system is provided to maximize the operational efficiency of building systems, such as HVAC, lighting and vertical transportation systems.
The presence of a computerized building management control sy stem whose capability is consistent with the complexity of building sy stems.
Dsn Ops.
0
Score
-1
0
3
5
Negativ eThe building has no management control sy stem capable of ensuring the ef f icient operation of building technical sy stems.
Acceptable practice
Total project Total Project
The building has a management control sy stem capable of ensuring normal operation of building technical sy stems.
The building has a management control sy stem capable of ensuring that building technical sy stems operate at close to peak ef f iciency during normal operating conditions, and the sy stem prov ides partial monitoring of sy stem operations.
e
f
Inf ormation Submittals
Inf ormation Submittals
Inf ormation Submittals
cApplicable Standards
d
Rev iew of contract documents and specif ications of proposed sy stem(s).
bApplicable Standards
Applicable project ty pe
Assessment method
0
Provision and operation of an effective facility management control system.
IntentApplicable phases (Activ e if green)
Indicator
Applicable Standards
Inf ormation sources
a
Good Practice
Best PracticeThe building has a management control sy stem capable of ensuring that building technical sy stems operate at peak ef f iciency during all operating conditions, and the sy stem prov ides f ull monitoring of sy stem operations, as well as diagnostic reporting.
These are default
benchmark statements, one
for each major scoring level
SBT07-A Settings file : Example of
a text Benchmark

C Environmental Loadings
C1 Greenhouse Gas Emissions
C1.1 Annualized GHG emissions embodied in construction materials.
C1.2 Annual GHG emissions f rom all energy used f or f acility operations.
C2 Other Atmospheric Emissions
C2.1 Emissions of ozone-depleting substances during f acility operations.
C2.2 Emissions of acidif y ing emissions during f acility operations.
C2.3 Emissions leading to photo-oxidants during f acility operations.
C3 Solid Wastes
C3.1 Solid waste resulting f rom the construction and demolition process.
C3.2 Solid waste resulting f rom f acility operations.
C4 Rainw ater, Stormw ater and Wastew ater
C4.1 Liquid ef f luents f rom f acility operations sent of f the site.
C4.2 Retention of rainwater f or later re-use.
C4.3 Untreated stormwater sent of f the site.
C5 Impacts on Site
C5.1 Impact of construction process on natural f eatures of the site.
C5.2 Impact of construction process or landscaping on soil erosion.
C5.3 Adv erse wind conditions at grade around tall buildings.
C5.4 Minimizing danger of hazardous waste on site.
C6 Other Local and Regional Impacts
C6.1 Impact of f acility on access to day light or solar energy potential of adjacent property
C6.2 Cumulativ e thermal changes to lake water or sub-surf ace aquif ers.
C6.3 Heat Island Ef f ect - landscaping and pav ed areas.
C6.4 Heat Island Ef f ect - roof ing.
C6.5 Atmospheric light pollution.
C Environmental Loadings
C1 Greenhouse Gas Emissions
C1.1 N.A.
C1.2 Annual GHG emissions f rom all energy used f or f acility operations.
C2 Other Atmospheric Emissions
C2.1 Emissions of ozone-depleting substances during f acility operations.
C2.2 Emissions of acidif y ing emissions during f acility operations.
C2.3 Emissions leading to photo-oxidants during f acility operations.
C3 Solid Wastes
C3.1 N.A.
C3.2 Solid waste resulting f rom f acility operations.
C4 Rainw ater, Stormw ater and Wastew ater
C4.1 Liquid ef f luents f rom f acility operations sent of f the site.
C4.2 Retention of rainwater f or later re-use.
C4.3 Untreated stormwater sent of f the site.
C5 Impacts on Site
C5.1 N.A.
C5.2 N.A.
C5.3 N.A.
C5.4 Minimizing danger of hazardous waste on site.
C6 Other Local and Regional Impacts
C6.1 N.A.
C6.2 Cumulativ e thermal changes to lake water or sub-surf ace aquif ers.
C6.3 N.A.
C6.4 N.A.
C6.5 N.A.
Operations Phase
Design Phase
SBT07-A Settings file : An
excerpt from the Issues
worksheet, showing that
different parameters can be
active in Design and
Operations settings.

B5.2
To minimize the amount of potable water imported to the site and used for occupancy needs, excluding building system uses or irrigation of exterior areas.
Net annual potable water v olume used f or occupancy needs, as recorded on metering sy stems ov er a period of at least one y ear.
Dsn. C&C. Ops
Assumptions f or daily use PP and v olume per f ixture: Toilet 6 L x 2 Times per Day , Urinal 1.5 L x 3 TPD, Shower 70 L x 0.8 TPD, Tub 90 L x 0.2 TPD, Lav atory 0.6 L x 4 TPD, Kitchen sink 15 L x 2 TPD, Clothes washer 40 L x 0.2.
Apartment onL. pp / day .
Score
400 -1
350 0
200 3
100 5
Acceptable practice
Negativ e
Good Practice
Inf ormation Submittals
Best Practice
Occupancy 1
Applicable Standards
Inf ormation Submittals
Applicable Standards
Inf ormation Submittals
Intent
Assessment method
Applicable Standards
Applicable phases (Activ e if green)
By separate occupancies, excluding irrigation water f or outdoor areas.
Use of potable water for occupancy needs.
The volume of potable water actually used for occupancy needs, as recorded on metering systems over a period of at least one year, is :
d
f
Rev iew of contract documentation by a specialist in water use.
c
e
b
a
Applicable project ty pe
Indicator
Inf ormation sources
B5.2
To minimize the amount of potable water imported to the site and used for occupancy needs, excluding building system uses or irrigation of exterior areas.
Prediction of total potable water use, in L per person per day , based on a credible water management plan f or occupancy f ixtures and use.
Dsn C&C. Ops.
Assumptions f or daily use PP and v olume per f ixture: Toilet 6 L x 2 Times per Day , Urinal 1.5 L x 3 TPD, Shower 70 L x 0.8 TPD, Tub 90 L x 0.2 TPD, Lav atory 0.6 L x 4 TPD, Kitchen sink 15 L x 2 TPD, Clothes washer 40 L x 0.2.
Apartment onL. pp / day .
Score
400 -1
350 0
200 3
100 5
Acceptable practice
Negativ e
Good Practice
Inf ormation Submittals
Best Practice
Occupancy 1
Applicable Standards
Inf ormation Submittals
Applicable Standards
Inf ormation Submittals
Intent
Assessment method
Applicable Standards
Applicable phases (Activ e if green)
By separate occupancies, excluding irrigation water f or outdoor areas.
Use of potable water for occupancy needs.
Based on a credible water management plan, the volume of potable water predicted to be used for occupancy needs :
d
f
Rev iew of contract documentation by a specialist in water use.
c
e
b
a
Applicable project ty pe
Indicator
Inf ormation sources
SBT07-A Settings
file: examples of
default text criteria
tailored to suit
Design and
Operating phases.

Text used for Benchmarks is taken
automatically from the Generic or Local
(green) cells in SBT07-A Settings file
B4.9
To encourage the procurement of high-weight materials such as aggregate, sand, concrete, masonry, steel and glass,from sources within the greater urban region.
To encourage the procurement of high-weight materials such as aggregate, sand, concrete, masonry, steel and glass,from sources within the greater urban region.
To encourage the procurement of high-weight materials such as aggregate, sand, concrete, masonry, steel and glass,from sources within the greater urban region.
The percentage, by weight, of the aggregate, sand, concrete, masonry , steel and glass used in the project produced within the greater urban region, if local sources of acceptable quality are av ailable.
Dsn C&C. Ops.
The percentage, by weight, of the aggregate, sand, concrete, masonry, steel and glass used in the project produced within the greater urban region, if local sources of acceptable quality are available.
The percentage, by weight, of the aggregate, sand, concrete, masonry, steel and glass used in the project produced within the greater urban region, if local sources of acceptable quality are available.
LEED specifies specific distances, but we consider that this is not applicable to all areas.
LEED specifies specific distances, but we consider that this is not applicable to all areas.
Total building, all sizes. Total building, all sizes.
Review of contract documentation by an outside materials specialist.
Review of contract documentation by an outside materials specialist.
a a
b b
c c
d d
e e
f f
% by weight
Score
42% -1
50% 0
74% 3
90% 5
LEED specif ies specif ic distances, but we consider that this is not applicable to all areas.
Good Practice
Negativ e
Inf ormation Submittals
f
b
Applicable phases (Activ e if green)
The percentage, by weight, of the aggregate, sand, concrete, masonry, steel and glass used in the project produced within the greater urban region :
c
Inf ormation sources
Applicable project ty pe
Applicable Standards
Applicable Standards
Acceptable practice
Assessment method
Applicable Standards
Inf ormation Submittals
Inf ormation Submittals
Intent
a
e
Total Project
d
The percentage, by weight, of the aggregate, sand, concrete, masonry, steel and glass used in the project produced within the greater urban region :
Total project
Rev iew of contract documentation by an outside materials specialist.
Total building, all sizes.
Use of materials that are locally produced.
Indicator
Best Practice
The percentage, by weight, of the aggregate, sand, concrete, masonry, steel and glass used in the project produced within the greater urban region :
Generic benchmarks Local benchmarks

Basic parameters
for the region and
the generic building
type are set in the
SBT07-A Settings
file (left).
9 June 2007
Name of this file
City / region location
Country location
Contact name
Contact e-mail address
Specify Local Content name
Select Generic or Local content and/or language
Select Phase for Assessment
Specify currency used
Select assumed li fespan of design in years
Select amortization rate for embodied energy of existing
structures
Set minimum score for Mandatory i tems (min. 2 of 5)
Define "Large Project" size, in m2 gross area.
Select for height category of building, no. of floors.
This f ile currently contains Generic User-selected benchmarks and
w eights for Design Phase assessment for a location in Ottaw a,
Canada, suited to the follow ing parameters:
New Apartment, and/or 0 and/or 0 occupancies.
3
CD
This f eature allows a reduction in the embodied energy of existing structures and their materials that are re-used, with the reduction depending on the age of the existing structure or materials.
2.0%
Set parameter at right for renovation of existing buildings.
Apartment
10,000
8 to 12
SBT07 Ottawa Region Basic Settings
Click to select v alue
Generic
Reminder: unless you assign correct file names in the Open
w orksheet, the Macro features w ill not w ork, because the program w ill
not know w here it should look. Enter or rev ise text
Plan B
TitlesRevision date:
This software tool was developed by iiSBE on behalf of the countries participating in the Green Building Challenge process. The intellectual content of the system is freely available, but use of the software requires agreement with iiSBE.
For information on use or for regional contacts, e-mail Nils Larsson at: <[email protected]>.
Luis Ebensperger is thanked for ideas on enabling a dual-language version, and Caroline Cheng for her work in developing macros.
Canada
Current settings for this file
Set parameter at right for large projects that include both project planning and specific
building requirements.
Select number of dwelling units in the housing project
No
To be completed by Regional Third Party
Select up to three possible Occupancy types by clicking blue
boxes at right.
Applies to parameters A3.2, A3.5, E5, E6.3 and E6.8
Applies to parameters C5.3 and D2.1
Mandatory items are those parameters considered to be of exceptional importance - set on the WtA and WtB worksheets, see also IssuesA worksheet.
Design Phase
75
Ottawa
SBT07-ERP-Settings
17 to 24

Fuel emissions
data and power
generation mix are
set in the SBT07-A
Settings file.
Ottawa, Canada
CO2 SO2
Fuel used for on- site heating or cooling only
Natural gas 50.95 0.00041
Propane or LPG 57.52 0.00197
Light Oil 72.94 0.45412
Heavy Oil 73.57 0.06286
Coal 81.37 0.46732
Fuel used for off-site gen. of electricity only
Natural gas (BC) 131.39 0.00105
Fuel Oil (QC) 200.00 1.93889
Coal (ON) 241.11 1.16389
biomass and other 0.00 0.00
nuclear 0.00 0.00
hydro, with high-methane emission reservoir 0.00 0.00
hydro, with moderate-methane emission reservoir 0.00 0.00
hydro, with low- or no-methane emission reservoir 0.00 0.00
wind 0.00 0.00
geothermal 0.00 0.00
natural gas
oil-fired
coal-fired
nuclear Nat. gas 8.4% 11.04
hydro, with high-methane emission reservoir Oil 0.5% 0.98
hydro, with moderate-methane emission reservoir Coal 24.6% 59.29
hydro, with low- or no-methane emission reservoir Biom/Oth 0.7% 0.00
wind 71.31
solar
geothermal
biomass
other
Modif y emissions data in this sheet to suit local generation mix.
0.0016%
0.00%
Emissions data and generation mix for :
0.00%
Title
Click to select value
Enter or revise text
Fuel Emissions Data for Ottawa, Canada
0.00%
0.66%
0.00%
Primary energy and environmental factors
Emissions f rom combustion in Kg. per GJ of energy
produced
8.40%
0.49%
24.59%
40.80%
0.00%
24.91%
Electricity power generation base load mixGeneration mix by
source
GHG fuels as % of al l GJ
kg. GHG per GJ primary
Fuel type
Note: Only emissions from non-renewables are included. Emissions for biomass and other fuels are assumed to be zero, as per IPCC.
kg. GHG / GJ f or elec.
Gross-up f actor f or primary energy(incl. combustion & deliv ery loss)
2.84
3.02
3.26
Composite gross-up f or electrical primary energy , based on generation mix,
assuming only deliv ery losses f or nuclear or hy dro
2.78
0.00
Arcane calculations for electricty GHGs
The resulting
number at left is
used to convert
delivered electrical
consumption to
primary energy

Defining the Project in the
SBT07-B Project file

Context for the
site is defined by
the Architect in
the SBT07-B
Project file
The upper section of this worksheet contains a description of context conditions in the Urban Area, as defined in the SBT Region file. The lower section contains descriptors of Site Conditions, as selected by the Project Assessor.
Title Descriptors
13 Solar av ailability f or a new building on the siteNatural f eatures or built structures on adjacent land will block solar access at 1200 on Winter Soltice to 40% or more of the building env elope located as close to the property line as regulations permit.
14 Height of immediately adjacent buildings Immediately adjacent building(s) hav e 17-20 f loors abov e grade.
15 Av ailability & adequacy of sub-surf ace aquif er. Aquif er can be used with some adv erse ef f ect on long-term aquif er capacity .
16 Presence of Radon There is no Radon in the soil
17 Soil contamination The site is documented as hav ing moderate sub-surf ace contamination.
18 Existing land use on the site The site has existing structures, or has prev iously been built on.
19 Agricultural v alue of land used f or the project. Land used f or the project is Class C (lowest grade) agricultural land.
20 Ecological status of the siteThe site currently supports a range of f lora and f auna consistent with other sites in the area.
21Ambient noise conditions at the noisiest site boundary . If residential occupancy is included, measure av erage of peak v alues during hours of 2300-0600.
57.5 dba
22 Existence and suitability of existing structure(s) on the site Not applicable - there is no existing structure on the site.
23 N.A.Not applicable - no materials or components f rom an existing structure on the site can be re-used to meet the new requirements.
24 N.A. Not applicable - there is no existing structure on the site.
Site context conditions defined by Architect
Click 1 or 2 at upper left to show or hide details
Context for Megaplex project in Ottawa, Canada

Preliminary project
characteristics are
defined by the
Architect in the
SBT07-B Project file
Click blue boxes to select specific conditions
1
All new
No
Not yet decided
Not yet decided
Not yet decided
Not yet decided
Megaplex project
4,500
Name of Element 1 (new) Bayley Block
Occupancy Type A in Bayley Block Apartment
Specify number of residential dwelling units in Bayley Block 20
Number of floors below grade in Bayley Block 1
Number of floors above grade in Bayley Block 5
Building footprint of Bayley Block, m2 800
Gross floor area above grade in Bayley Block, m2 4,000
Total gross floor area in Bayley Block, m2 4,800
Total number of Elements in project 1
Site area in project, m2 4,500
Maximum number of floors below grade in project 1
Maximum number of floors above grade in project 5
Total building footprint in project, m2 800
Total gross floor area above grade in all Elements 4,000
Total gross floor area above and below grade in al l Elements 4,800
Floor area ratio (total gross area above grade / site area) 0.9
Percent of site built on at grade 17.8%
Total number of dwelling units in Megaplex project 20
Gross floor area of Apartment occupancy in Megaplex project, m2 4,800
Gross floor area of 0 occupancy in Megaplex project, m2 0
Gross floor area of 0 occupancy in Megaplex project, m2 0
Estimated age of existing structure in years
Will the project include mechanical cooling?
Preliminary Project Information for Megaplex project, Ottawa, Canada
Is a site already selected?
The purpose of this worksheet is to identify the basic characteristics of the project and the separate Elements within it, as far as may be known at this stage. Click on the upper left buttons to show 1, 2 or 3 block data sections.
Information
Summary project data for Megaplex project
Site area of total project, m2
Will the project include mechanical venti lation?
Will the project include hybrid or natural ventilation systems?
Will the project include ground- or water-source heat pumps?
Project name
Identify existing Elements to be renovated (more than 50% of work).
Number of separate Elements in this project (1 to 3)
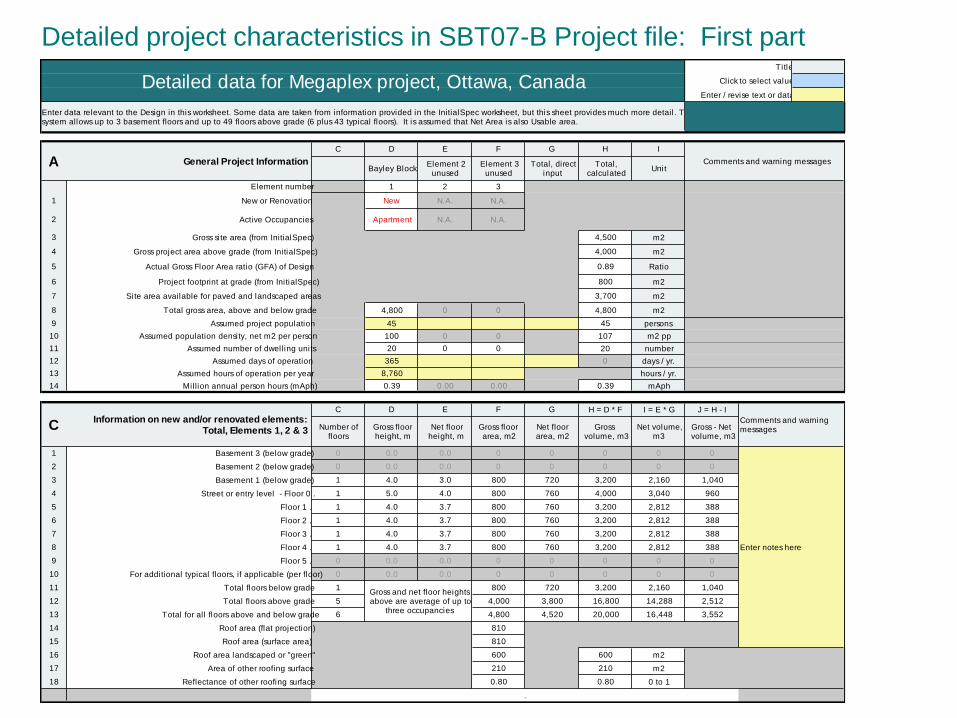
Detailed project characteristics in SBT07-B Project file: First part
C D E F G H I
Bayley BlockElement 2
unusedElement 3
unusedTotal, direct
inputTotal,
calculatedUnit
Element number 1 2 3
1 New or Renovation New N.A. N.A.
2 Active Occupancies Apartment N.A. N.A.
3 Gross site area (from InitialSpec) 4,500 m2
4 Gross project area above grade (from InitialSpec) 4,000 m2
5 Actual Gross Floor Area ratio (GFA) of Design 0.89 Ratio
6 Project footprint at grade (from InitialSpec) 800 m2
7 Site area available for paved and landscaped areas 3,700 m2
8 Total gross area, above and below grade 4,800 0 0 4,800 m2
9 Assumed project population 45 45 persons
10 Assumed population density, net m2 per person 100 0 0 107 m2 pp
11 Assumed number of dwelling units 20 0 0 20 number
12 Assumed days of operation 365 0 days / yr.
13 Assumed hours of operation per year 8,760 hours / yr.
14 Mil lion annual person hours (mAph) 0.39 0.00 0.00 0.39 mAph
C D E F G H = D * F I = E * G J = H - I
Number of floors
Gross floor height, m
Net floor height, m
Gross floor area, m2
Net floor area, m2
Gross volume, m3
Net volume, m3
Gross - Net volume, m3
1 Basement 3 (below grade) 0 0.0 0.0 0 0 0 0 0
2 Basement 2 (below grade) 0 0.0 0.0 0 0 0 0 0
3 Basement 1 (below grade) 1 4.0 3.0 800 720 3,200 2,160 1,040
4 Street or entry level - Floor 0 . 1 5.0 4.0 800 760 4,000 3,040 960
5 Floor 1 . 1 4.0 3.7 800 760 3,200 2,812 388
6 Floor 2 . 1 4.0 3.7 800 760 3,200 2,812 388
7 Floor 3 . 1 4.0 3.7 800 760 3,200 2,812 388
8 Floor 4 . 1 4.0 3.7 800 760 3,200 2,812 388
9 Floor 5 . 0 0.0 0.0 0 0 0 0 0
10 For additional typical floors, if applicable (per floor) 0 0.0 0.0 0 0 0 0 0
11 Total floors below grade 1 800 720 3,200 2,160 1,040
12 Total floors above grade 5 4,000 3,800 16,800 14,288 2,512
13 Total for al l floors above and below grade 6 4,800 4,520 20,000 16,448 3,552
14 Roof area (flat projection) 810
15 Roof area (surface area) 810
16 Roof area landscaped or "green" 600 600 m2
17 Area of other roofing surface 210 210 m2
18 Reflectance of other roofing surface 0.80 0.80 0 to 1
Information on new and/or renovated elements: Total, Elements 1, 2 & 3
.
Gross and net floor heights above are average of up to
three occupancies
Comments and warning messagesC
Enter notes here
Comments and warning messages
Title
Enter / revise text or data
Enter data relevant to the Design in this worksheet. Some data are taken from information provided in the InitialSpec worksheet, but this sheet provides much more detail . The system allows up to 3 basement floors and up to 49 floors above grade (6 plus 43 typical floors). It is assumed that Net Area is also Usable area.
A General Project Information
Click to select valueDetailed data for Megaplex project, Ottawa, Canada

C D E F G H I
Number of Floors
Net floor area, m2
Occupancy type
Area Nat. Ventilated
% Area Nat. venti lated
Area mech. Vent/cooled
% area mech. Conditioned
1 Basement 3 (below grade) 0 0 0 0% 0 0%
2 Basement 2 (below grade) 0 0 0 0% 0 0%
3 Basement 1 (below grade) 1 720 200 28% 520 72%
4 Street or entry level - Floor 0 1 760 760 100% 0 0%
5 Floor 1 1 760 760 100% 0 0%
6 Floor 2 1 760 760 100% 0 0%
7 Floor 3 1 760 760 100% 0 0%
8 Floor 4 1 760 760 100% 0 0%
9 Floor 5 0 0 0 0% 0 0%
10 For additional typical floors, if applicable (per floor) 0 0 0 0% 0 0%
11 Total Bayley Block below grade 1 720 200 28% 520 72%
12 Total Bayley Block above grade 5 3,800 3,800 100% 0 0%
13 Total Bayley Block above and below grade 6 4,520 4,000 88% 520 12%
Bayley BlockElement 2
unusedElement 3
unusedTotal project Bayley Block
Element 2 unused
Element 3 unused
Total project
1 Total net area, m2 4,520 0 0 4,520 4,520 0 0 4,520
2Project estimated annual amount of fuel-based energy used for
operations, MJ / year2,000,000 2,000,000 2,000,000 0 0 2,000,000
3 Project fuel-based MJ/m2 per year 442 0 0 442 442 0 0 442
4Project estimated annual amount of electrical energy used for
operations, MJ / year500,000 500,000 0 1,388,688 0 0 1,388,688
5 Project electrical MJ/m2 per year 111 0 0 111 307 0 0 307
6Project estimated annual amount of total energy used for
operations, MJ / year2,500,000 0 0 2,500,000 3,388,688 0 0 3,388,688
7 Project total MJ/m2 per year 553 0 0 553 750 0 0 750
8Reference estimated annual amount of fuel-based energy used for
operations, MJ2,260,000 0 0 2,260,000 2,260,000 0 0 2,260,000
9 Reference fuel-based MJ/m2 per year 500 1,000 100 500 500 0 0 500
10Reference estimated annual amount of electrical energy used for
operations, MJ1,356,000 0 0 1,356,000 3,766,121 0 0 3,766,121
11 Reference electrical MJ/m2 per year 300 2,000 50 300 833 0 0 833
12Reference estimated annual amount of total energy used for
operations, MJ3,616,000 0 0 3,616,000 6,026,121 0 0 6,026,121
13 Reference total MJ/m2 per year 800 3,000 150 800 1,333 0 0 1,333
14Best Practice estimated annual amount of fuel-based energy used
for operations, MJ1,582,000 0 0 1,582,000 1,582,000 0 0 1,582,000
15 Best practice fuel-based MJ/m2 per year 350 400 40 350 350 0 0 350
16Best Practice estimated annual amount of electrical energy used for
operations, MJ678,000 0 0 678,000 1,883,061 0 0 1,883,061
17 Best practice electrical MJ/m2 per year 150 1,100 40 150 417 0 0 417
18Best Practice estimated annual amount of total energy used for
operations, MJ2,260,000 0 0 2,260,000 3,465,061 0 0 3,465,061
19 Best practice total MJ/m2 per year 500 1,500 80 500 767 0 0 767
Occupancies by type, by net area, and areas with natural or mechanical
ventilation and cooling: Total, Elements 1, 2 & 3
New Apartment
E
Enter total project data in Col. G above OR for each occupancy
Delivered energyTotal project direct entry
...
Primary non-renew able energy (B1.2)
FPerformance calculations for
operating energy consumption
Comments & messages
.
N.A.
Detailed project characteristics in SBT07-B Project file: Second part

Setting performance
targets and assessing
the project in the
SBT07-C Evaluation file

Architect or Third
Party sets targets
Architect enters
relevant information
Self-assessment
score submitted
SBT07-C Assess file
Active occupancy
A2.1 Activ e 10.0% 0.5%
To encourage the consideration of the technical and economic feasibility of renewable energy at the pre-design stage.
Results f rom analy sis of f easibility using RETSCreen sof tware. P-Dsn. Dsn Ops.
The RETSCreen sof tware prov ides an analy sis of Wind Energy , Small Hy dro, Photov oltaics, Solar Air Heating, Biomass Heating, Solar Hot Water Heating, Passiv e Solar Heating and Ground-Source Heat Pumps.
Any occupancy . Apartment 0 0
Score Wtd. Score
4.0 4.0 0.40
RETScreen sof tware was used to study the f easibility of using PV, solar thermal, GSHP and biomass f or the project.
5.0 4.5 0.45
-1
0
3
5
Submittal requirements
Submittal requirements
Acceptable practice
Feasibility of use of renewables.
Go to www.retscreen.net
Applicable Phases (activ e if green)
Indicator
Total Project
f
Rev iew of design team analy sis by renewables specialist.
Intent
Applicable standards
Applicable standards a
c
b
Design or Operating data
d
.
Designer's target v alue
Good Practice
Design or Operating data
Design or Operating data
Total Project
Design or Operating data
e
Submittal requirements
The RETScreen sof tware has been used to carry out a study of the f easibility of using one renewable energy technology f or the project.
The RETScreen sof tware has been used to carry out a study of the f easibility of using more than three renewable energy technologies f or the project.
Actual perf ormance as per contract documents
Negativ eThe RETScreen sof tware has not been used to carry out a study of the f easibility of using renewable energy sy stems f or the project.
Design or Operating data
The RETScreen sof tware has been used to carry out a study of the f easibility of using three renewable energy technologies f or the project.
Relev ant Context inf ormation
Best Practice
Applicable project ty pe
Applicable standards
Assessment method
Inf ormation sources
Design or Operating data
Official assessment
score
Weighted score
Weight within Category
Weight within all

Results

116Max. potential low-
lev el parameters: 118
3Activ e low-lev el
mandatory parameters:
10
Active WeightsWeighted
scores
A 8% 3.3
B 23% 2.3
C 27% 3.7
D 18% 3.4
E 16% 2.9
F 5% 2.9
G 3% 4.3
3.1
The number of active low-level mandatory parameters with a score of less than 3 is:
With current context and building data, the number of active low-level parameters is:
Site Selection, Project Planning and Development
Energy and Resource Consumption
Service Quality
Social and Economic aspects
This is a Renovation project with a total gross area of 7000 m2. It has an estimated lifespan of 75 years, and contains the following occupancies: Apartment and Retail and is located in Ottawa, Canada. The assessment is valid for the Design Phase.
Assumed life span is 75 years, and
monetary units are in CD
Design target scores for Megaplex project, Ottawa, Canada
Predicted performance results based on information available during Design Phase
Project Information
Design PhaseActive Phase
(set in Region file)
Relative Performance Results
Amortization rate for embodied energy of
existing materials is set at 2 %
To see a full l ist of Issues, Categories and Criteria, go to the Issues worksheet.
Design target scoresThe project contains 20 apartment
units
Design Phase scores indicate Potential Performance as predicted by an assessment of
building features and plans for construction and operation that are developed during the
design process.
Environmental Loadings
Indoor Environmental Quality
T o t a l w e I g h t e d b u i l d i n g s c o r e
Cultural and Perceptual Aspects
1
0
1
2
3
4
5A
B
C
DE
F
G
Performance Issue Areas
0 = Acceptable Practice; 3 = Good Practice; 5 = Best Practice

Absolute results
116Max. potential low-
lev el parameters: 118
3Activ e low-lev el
mandatory parameters:
10
Active WeightsWeighted
scores
A 8% 3.3
B 23% 2.3
C 27% 3.7
D 18% 3.4
E 16% 2.9
F 5% 2.9
G 3% 4.3
3.1
By area
1 22 27 GJ/m2*maph
2 296 361 MJ/m 2*maph
3 617 751 MJ/m 2*maph
4 1258 1533 MJ/m 2*maph
5 63 77 MJ/m 2*maph
6 63 77 MJ/m 2*maph
7 1554 1893 MJ/m 2*maph
8 90 109 MJ/m 2*maph
9 #REF! #REF! m3/m2*maph
10 #REF! #REF! m3/m2*maph
11 69 84 kg/m2*maph
12
13
14
64%
Proportion of gross area of project provided by re-use of existing structure(s), percent
Net annualized primary embodied energy and annual operating primary energy, MJ/m2*yr.
Total on-site renewable energy used for operations, MJ/m2*yr.
Net annual consumption of potable water for building operations, m3 / m2 * year
Annual use of grey water and rainwater for building operations, m3 / m2 * year
Proportion of gross area of existing structure(s) re-used in the new project, percent
63%
8,886Total present value of 25-year life-cycle cost fot total project, CD per m2.
Absolute Performance Results
Net annual GHG emissions from building operations, kg. CO2 equivalent per year
These data are based on the Self-Assessment values
Total performance level is Good Practice or better
Net annual consumption of delivered energy for building operations, MJ/m2*year
Net annual consumption of primary non-renewable energy for building operations, MJ/m2*yr.
By area & occupancy
Total net consumption of primary embodied energy for structure and envelope, GJ/m2
Net annualized consumption of embodied energy for envelope and structure, MJ/m2*yr.
The number of active low-level mandatory parameters with a score of less than 3 is:
With current context and building data, the number of active low-level parameters is:
Site Selection, Project Planning and Development
Energy and Resource Consumption
Service Quality
Social and Economic aspects
This is a Renovation project with a total gross area of 7000 m2. It has an estimated lifespan of 75 years, and contains the following occupancies: Apartment and Retail and is located in Ottawa, Canada. The assessment is valid for the Design Phase.
Assumed life span is 75 years, and
monetary units are in CD
Design target scores for Megaplex project, Ottawa, Canada
Predicted performance results based on information available during Design Phase
Project Information
Design PhaseActive Phase
(set in Region file)
Relative Performance Results
Amortization rate for embodied energy of
existing materials is set at 2 %
To see a full l ist of Issues, Categories and Criteria, go to the Issues worksheet.
Design target scoresThe project contains 20 apartment
units
Net annual consumption of primary non-renewable energy per dwelling unit in project, MJ/m2*yr.
Net annual consumption of primary non-renewable energy per dwelling unit in residential element, MJ/m2*yr.
Design Phase scores indicate Potential Performance as predicted by an assessment of
building features and plans for construction and operation that are developed during the
design process.
Environmental Loadings
Indoor Environmental Quality
T o t a l w e I g h t e d b u i l d i n g s c o r e
Cultural and Perceptual Aspects
1
0
1
2
3
4
5A
B
C
DE
F
G
Performance Issue Areas
0 = Acceptable Practice; 3 = Good Practice; 5 = Best Practice
By area
1 22 27 GJ/m2*maph
2 296 361 MJ/m 2*maph
3 617 751 MJ/m 2*maph
4 1258 1533 MJ/m 2*maph
5 63 77 MJ/m 2*maph
6 63 77 MJ/m 2*maph
7 1554 1893 MJ/m 2*maph
8 90 109 MJ/m 2*maph
9 0.3 0.3 m3/m2*maph
10 18 22 m3/m2*maph
11 69 84 kg/m2*maph
12
13
14
64%
Proportion of gross area of project provided by re-use of existing structure(s), percent
Net annualized primary embodied energy and annual operating primary energy, MJ/m2*yr.
Total on-site renewable energy used for operations, MJ/m2*yr.
Net annual consumption of potable water for building operations, m3 / m2 * year
Annual use of grey water and rainwater for building operations, m3 / m2 * year
Proportion of gross area of existing structure(s) re-used in the new project, percent
63%
8,886Total present value of 25-year life-cycle cost fot total project, CD per m2.
Absolute Performance Results
Net annual GHG emissions from building operations, kg. CO2 equivalent per year
These data are based on the Self-Assessment values
Total performance level is Good Practice or better
Net annual consumption of delivered energy for building operations, MJ/m2*year
Net annual consumption of primary non-renewable energy for building operations, MJ/m2*yr.
By area & occupancy
Total net consumption of primary embodied energy for structure and envelope, GJ/m2
Net annualized consumption of embodied energy for envelope and structure, MJ/m2*yr.
Net annual consumption of primary non-renewable energy per dwelling unit in project, MJ/m2*yr.
Net annual consumption of primary non-renewable energy per dwelling unit in residential element, MJ/m2*yr.

Our SBTool work is mainly R&D and it has influenced national
systems being used in Austria, Spain, Japan and Korea;
A custom version has been developed to assess entries in an
international competition for an 11 ha. urban expansion of Monaco
(underway);
Even in regions where other systems, such as BREEAM or LEED,
are predominant, the wider scope of SBTool and its ease of adapting
to local conditions - even down to a municipality or university
campus - makes it a more relevant and finely graduated instrument
than other commercial systems;
Custom versions of SBTool have been produced for Italy, and several commercial assessments are being undertaken by iiSBE Italia;
A compact version of SBTool is being used in Italy as a reference system in provinces, for a bank and for an insurance firm.
Applications of SBTool

In 2002 ITACA, the Federal Association of the Italian Regions, adopted the GBC methodology as basis to develop an institutional assessment system for residential buildings: Protocollo ITACA;
Main objective of the association is to promote and disseminate the good practices for the environmental sustainability and to develop common policies for the Regions (the environment falls within regional competence).
The aim of ITACA was to establish an objective set of requirements to define “what is” a green building and to develop a simple assessment method to measure the environmental performance of buildings necessary to improve policies on sustainable building;
The Green Building Challenge (GBC) method and its software tool (SBTool) was found to give local authorities the ability to adapt the tool to their own conditions and priorities;
The “Protocollo ITACA” was officially approved by the Conference of the Presidents of the Italian Regions in January 2004. It is now the reference rating system of the regional authorities in Italy.
SBTool in Italy

A brief overview of iiSBE

An international non-profit networking organization;
Focus on guiding the international construction industry towards
sustainable building practices;
Emphasis is on research and policy, with a special emphasis on
building performance and its assessment;
Board members from 16 countries;
Secretariat is in Ottawa;
Local chapters exist in Italy, Spain, Czech Republic, Israel and
Canada, others are being formed in Poland, Portugal, France,
Malaysia, Taiwan and Germany, and associated organizations exist
in Korea, Mexico and Brazil;
Andrea Moro is President, Nils Larsson is XD.
iiSBE at a glance

Leadership of the international Sustainable Building Challenge process (formerly GBC process);
Development of rating framework, now called SBTool;
Technical meetings in the Spring and Fall;
Operation of SBIS, a web-based database of SB information;
Operation of a Sustainable Education working group;
Publication of PDF newsletters;
Active networking support.
iiSBE –activities

Support to Commission for Environmental Cooperation (CEC) on a study on the status, future and implications of green building in Canada, USA and Mexico (2006);
Preparation of a study on SB policies in six selected countries, for CMHC (2006);
Sponsorship, with CIB and UNEP, of a series of major SB conferences.
Other Projects and Activities

SB07 conferences rev . 12 April, 2007
Country City Date
Canada Toronto 30 May - 01 June
Italy Torino 7-8 June
Korea Seoul 27-29 June
Portugal Lisbon 12-14 September
Sweden Malmš 12-14 September
Czech Republic Prague 24-26 September
Brazil S‹o Paulo 8-9 October
Chile Santiago 10-11 October
Malay sia Kuala Lumpur 5-7 Nov ember
Taiwan Taipei 9-11 Nov ember
New Zealand Auckland 14-16 Nov ember
China Hong Kong SAR 4-5 December
Greece Athens 10-12 January , 2008
SB07 Events

Melbourne was selected by representatives of CIB, iiSBE and SB05
from proposals by Washington, Toronto, Berlin, Rome and Sydney;
This will be a four-day event, to be held during 21-25 September,
2008;
Case study assessments, using a variety of rating tools, will be
presented as part of Sustainable Building Challenge (SBC);
SB08 will offer travel bursaries and free registration to selected
developing country delegates;
It will aim for zero net emissions related to the conference;
It will have solid links with the SB07 regional and national
conferences;
www.sb08melbourne.com
SB08 World Conference, Melbourne

Contacts & Info
http://www.iisbe.org
http://www.sbis.info
Chair of Technical Committee: Manuel Macias, [email protected]
SBTool design: Nils Larsson, [email protected]