ratio analysis syntax
TRANSCRIPT

1
CONTENT
Chapter 1:
Introduction
Conceptual Framework.
Chapter 2:
Review of Literature,
Rationale
Objectives
Chapter 3:
Research Methodology
o Universe
o Sample
o Hypothesis
Research Design (if any),
Tools for Data Collection and Analysis
Chapter 4:
Results
Discussion & Interpretation
Chapter 5:
Conclusions
Implications,
Limitations
Scope for future work

2
Chapter-1
Introduction
Conceptual Framework.

3
INTRODUCTION-
Sintex leads in meaningful innovations and solutions. With their multifarious capabilities in the
field of plastics, metals, concrete etc. They have created many path breaking products They have an
excellent design, engineering, marketing and manufacturing set up to offer many standard and
custom products and solutions for satisfying needs anywhere in the world
• Sintex Industries Limited (Earlier known as The Bharat Vijay Mills Ltd) has two divisions –
textiles and plastics.
• Global spanning 9 countries
• Established in India in 1931
• Plastics Division started in the year 1975
Products
Sintex have pioneered development of number of products in such as Water Tanks, Doors,
Windows, Frames, Partitions, False Ceiling, Wall Paneling, Prefabs etc. for Buildings and Interiors.
they also brought for the first time in India Pallets, Intermediate Bulk Containers, Insulated Boxes,
Milk Cans, Multibins, Waste Bins etc. that are delivering better utility and value to the customers.
Recently they have created number of innovative products for the Electrical, Telecom and
Infrastructure Sectors such as Tamper Proof Meter Boxes, Shock Proof Chequered Plates, FRP
Cable Trays, BTS Shelters, Prefab Schoolrooms, Prefab Anganwadis, Prefab Police Chowkies etc.
There are six different types of Products range
1. Building & Construction
2. Prefabs
3. Interiors
4. Industrial
5. Electrical Engineering
6. Consumer
Sintex has an effective network of 10 manufacturing plants, 12 branch offices, over 500 distributors
and around 10,000 retailers spread across India.

4
ACHIEVEMENT
Major landmarks Along the Journey
1975 Moulded Polyethylene Industrial Containers and Tanks of sizes up to
10,000 litre
1977 Material Handling Containers for Industries and Institutions
1978 Water Tank
1985 Plastic Sections for Conversion into Partitions, False Ceilings, Wall
Panellings, Cabins, Cabinets, Furniture etc.
1988 Plastic Doors, Windows and Frames
1989 Insulated Containers, Sandwich Panels, Agri Containers and Biogas
Holders
1990 SMC and SMC Moulded Products, Pultruded Products, Resin Transfer
Moulded (RTM) Products, Blow Moulded Products, Injection Moulded
Products etc.
1995 Water Filters cum Purifiers
2000 Solar Water Heaters
2001 Prefabs
2002 Turnkey Blow Moulding & Profile Extrusion Plants
2004 FRP Underground Storage Tanks
2005 ISO 9001 Certification
Monolithic Concrete Construction Technology
2006 UL Listed for FRP Underground Petroleum Tanks
2008 Sandwich Panels
2010 Package Sewage Treatment Plants (PSTP) & Manholes
2011 Prefab Homes, Gloria Siding Panels

5
Finance performance definition:-
A subjective measure of how well a firm can use assets from its primary mode of business and
generate revenues. This term is also used as a general measure of a firm's overall financial health
over a given period of time, and can be used to compare similar firms across the same industry or to
compare industries or sectors in aggregation.
By financial analysis we come to know about the financial position of the company. Following are
the few terms which we have to understand
RATIO ANALYSIS
Meaning of Ratio: - A ratio is simple arithmetical expression of the relationship of one number to
another. It may be defined as the indicated quotient of two mathematical expressions.
According to Accountant‟s Handbook by Wixon, Kell and Bedford, “a ratio is an expression o f the
quantitative relationship between two numbers”.
Ratio Analysis: - Ratio analysis is the process of determining and presenting the relationship of
items and group of items in the statements. According to Batty J. Management Accounting “Ratio
can assist management in its basic functions of forecasting, planning coordination, control and
communication”.
It is helpful to know about the liquidity, solvency, capital structure and profitability of an
organization. It is helpful tool to aid in applying judgement, otherwise complex situations.
Ratio analysis can represent following three methods.
Ratio may be expressed in the following three ways:
1. Pure Ratio or Simple Ratio: - It is expressed by the simple division of one number by
another. For example, if the current assets of a business are Rs. 200000 and its current
liabilities are Rs. 100000, the ratio of „Current assets to current liabilities‟ will be 2:1.
2. ‘Rate’ or ‘so Many Times: - In this type, it is calculated how many times a figure is, in
comparison to another figure. For example , if a firm‟s credit sales during the year are Rs.
200000 and its debtors at the end of the year are Rs. 40000 , its Debtors Turnover Ratio is
200000/40000 = 5 times. It shows that the credit sales are 5 times in comparison to debtors.
3. Percentage: - In this type, the relation between two figures is expressed in hundredth. For
example, if a firm‟s capital is Rs.1000000 and its profit is Rs.200000 the ratio of profit capital, in
term of percentage, is 200000/1000000*100 = 20%
ADVANTAGE OF RATIO ANALYSIS 1. Helpful in analysis of Financial Statements.
2. Helpful in comparative Study.
3. Helpful in locating the weak spots of the business.
4. Helpful in Forecasting.
5. Estimate about the trend of the business.
6. Fixation of ideal Standards.

6
7. Effective Control.
8. Study of Financial Soundness.
LIMITATIONS OF RATIO ANALYSIS 1. Comparison not possible if different firms adopt different accounting policies.
2. Ratio analysis becomes less effective due to price level changes.
3. Ratio may be misleading in the absence of absolute data.
4. Limited use of a single data.
5. Lack of proper standards.
6. False accounting data gives false ratio.
7. Ratios alone are not adequate for proper conclusions.
8. Effect of personal ability and bias of the analyst.
CLASSIFICATION OF RATIO Ratio may be classified into the four categories as follows:
A. Liquidity Ratio
a. Current Ratio
b. Quick Ratio or Acid Test Ratio
B. Leverage or Capital Structure Ratio
a. Debt Equity Ratio
b. Debt to Total Fund Ratio
c. Proprietary Ratio
d. Fixed Assets to Proprietor‟s Fund Ratio
e. Capital Gearing Ratio
f. Interest Coverage Ratio
C. Activity Ratio or Turnover Ratio
a. Stock Turnover Ratio
b. Debtors or Receivables Turnover Ratio
c. Average Collection Period
d. Creditors or Payables Turnover Ratio
e. Average Payment Period
f. Fixed Assets Turnover Ratio
g. Working Capital Turnover Ratio
D. Profitability Ratio or Income Ratio
(A) Profitability Ratio based on Sales: a. Gross Profit Ratio
b. Net Profit Ratio
c. Operating Ratio
d. Expenses Ratio
(B) Profitability Ratio Based on Investment:
I. Return on Capital Employed
II. Return on Shareholder’s Funds:
a. Return on Total Shareholder‟s Funds
b. Return on Equity Shareholder‟s Funds

7
c. Earning Per Share
d. Dividend per Share
e. Dividend Payout Ratio
f. Earning and Dividend Yield
g. Price Earning Ratio

8
Chapter-2
Review of Literature,
Rationale
Objectives
Variables

9
LITERATURE REVIEW
Pinc research Suman Memani +91-22-6618 6479
Abhishek Kumar +91-22-6618 6398
Structurally a strong growth story: We initiate coverage on Sintex with a BUY rating (upside of
38%). We like Sintex primarily for: (1) A diversified business model marked bylow volatility in
sales, profit and cash flows; (2) Market leadership in the prime Monolithic and Prefab segments
which are expected to show CAGR of 25% and 27% during FY11-FY13E respectively; (3)
Acquired overseas and domestic subsidiaries likely to show operational improvement with
300bps increase in margin in FY13e v FY10; (4) Emerging cash flow positive in FY12-FY13e
through better management. At our TP of Rs220, the stock looks attractive
and discounts 12x & 10.6x FY12e & FY13e EPS of Rs18.5 & Rs20.7 respectively.
On behalf of the Board,
Date : April 30, 2011
Dinesh B. Patel
Chairman
Place : Ahmedabad
Your Directors have pleasure in presenting the 80th Annual Report of the Company, together with
audited accounts for the year, which ended on March 31, 2011.
Your Company reported another strong performance this year as it extended its presence into value-
added business verticals and strengthened its market position in existing businesses – delivering
superior value to its stakeholders.
Gross turnover grew 29% from `2,103.56 crore in 2009-10 to `2,718.74 crore in 2010-11, due to a
significant increase in existing business volumes. While all business segments contributed to your
Company‟s growth, the key growth drivers were monolithic construction and civil infrastructure.
24th September 2010
Ms. Revati Kasture
+91-22-6754 3465
CARE Equity Research assigns 4/5 on fundamental grade to Sintex Industries Limited
CARE Equity Research assigns fundamental grade of 4/5 to Sintex Industries Limited (Sintex).
This indicates „Very Good Fundamentals‟. The grade draws strength from Sintex‟s leadership
position in plastic water tanks, prefabricated building systems and monolithic construction coupled
with experienced management. While strong order book of monolithic construction gives revenue
visibility for next 20-22 months, increased Government focus on social spending provide huge

10
growth opportunities for Sintex. Furthermore, CARE Equity Research believes that risks associated
with acquired subsidiaries are behind us and Sintex is likely to start realizing synergy benefits
going forward.
Sintex‟s textile business had witnessed dip in FY10. Though CARE Equity Research is skeptical,
the management is positive about the future of this business. Additionally Sintex‟s increased focus
on monolithic business may elongate the working capital cycle of the company and any gap in
securing funding may affect the company‟s prospects adversely.

11
RATIONALE
The purpose of the research is to increase the knowledge and experience about the financial
position of the company and to learn about the financial aspect and financial position of the
company.
This study is related to the financial performance of the sintex industries. The finding will be
helpful for the sintex industries to improve their financial performance in future. Ratio analysis is a
very important to know about the financial performance and position (strengths and weaknesses) of
companies. To understand about the overall performance and efficiency of the company. For
investor to invest money in sintex industries it is very important that to know about ability of this
company. Before knowing about the financial position of the company, we can‟t say anything
about that company.
Financial (ratio) analysis reflects the inside mirror image of company. After doing study of
financial analysis you can easily identify ability (strength and weaknesses) of the company.
Financial analysis is just like weather forecast. Today there is more chance for rain then before to
go out from your house you prepare for rain. Same way financial analysis gives that guide about
company, for trading or long term investment.

12
OBJECTIVE
Primary objective –
An analytical Study of financial performance of Sintex Industries Ltd. with reference to last
three years
Secondary objective -
To analyse profit and loss account.
To analyse the balance sheet of the company.
To analyse the cash flow and fund flow statement of the company.

13
VARIABLES
The variables which affect the financial performance of the company are as follows:
1. Economic growth:-
Slowdown in the growth of Indian economy or future volatility in global financial market,
could adversely affect the business, including the future financial performance,
2. Significant change in the Government‟s policies
Any significant change in the Government‟s policies or any political instability in India
could adversely affect the business and economic conditions in India and could also adversely
affect the business, future financial performance.
3. Sensitivity to the economy and extraneous factors:-
The Company‟s performance is highly correlated to the performance of the economy and
the financial markets. The health of the economy and the financial markets in turn depends on
the domestic economic growth.
4. Legal and Compliance Risk:
The market regulators in India. New laws / rules and changes in any law and application of
current laws / rules could affect our manner of operations and profitability.

14
Chapter-3
Research Methodology
Research Design (if any),
Tools for Data Collection and Analysis
15
RESEARCH METHODOLOGY
Tools for data collection Secondary data will be taken from last 3 years
annual report
Tools for data analysis Percentage, Pie chart, Bar graph.
Performance analysis
Credit analysis
Security analysis
Competitive analysis

16
Chapter -4
Results
Discussion & Interpretation

17
RATIO ANALYSIS
1. LIQUIDITY RATIOS:
1. Current Ratio
Formula 2008-2009 2009-2010 2010-2011
Current Assets
Current Liabilities
3.82 4.68 4.00
Significance: - This ratio is calculated for knowing short term solvency of the organization. This ratio indicates
the solvency of the business. Certain authorities have suggested that in order to ensure solvency of
a concern current assets should be twice the current liabilities and therefore this ratio is known as
2:1 ratio . Here the Current Ratio of Sintex industries Ltd indicates that it has got sufficient assets to
pay off short term liabilities as. The company has maintained its short term solvency
throughout the years and it is improving its short term solvency status which is appreciable.
3.82
4.68
4
0
1
2
3
4
5
2008-09 2009-10 2010-11
Financial years
Current Ratio

18
2. Acid Test
Formula 2008-2009 2009-2010 2010-2011
Liquid Assets Liquid Liabilities
3.02 2.85 3.36
Significance: -
It gives a better picture of the firms ability to meet its short term debts out of its short term
assets. An Acid Test Ratio of 1:1 is considered to be ideal and standard. Here the Acid Ratios throughout the years considered indicates that it has adequate assets which
can be converted in the form of cash almost immediately to pay off those liabilities which are to be
paid off immediately. It must be remembered that the company has improved its Acid Test Ratio
in year 2010-11 as compared to previous year which is appreciable as such higher the liquid ratio
better the situation
3.02
2.85
3.36
2.4
2.6
2.8
3
3.2
3.4
2008-09 2009-10 2010-11
Financial Year
Acid Test Ratio

19
2. TURNOVER RATIO:
1. Fixed Assets Turnover Ratio
Formula 2008-2009 2009-2010 2010-2011
Net sales Fixed assets
1.32 1.36 1.36
Significance:- This ratio indicates whether the fixed assets are being fully utilized. It is an important measure of the
efficient and profit earning capacity of the business. The financial year 2008-09 had low ratio out of these three years. In the financial year
2009-10 and 2010-2011 has same ratio. This shows better asset management policy of these years.
1.32
1.36 1.36
1.3
1.31
1.32
1.33
1.34
1.35
1.36
1.37
2008-09 2009-10 2010-11
Financial Years
Fixed Assets Turnover Ratio

20
2. Current Assets Turnover Ratio
Significance: -
This ratio indicates capability of the organization in efficient use of current assets. It indicates the
sales generated per rupee of investment in current assets. The financial year 2008-09 and 2009-10 the ratio decreased i.e. the sale in the coming year slightly
decreased. In the 2010-11 the ratio increase means sales increase compared to the last years.
0.84 0.82
1.07
0
0.2
0.4
0.6
0.8
1
1.2
2008-09 2009-10 2010-11
Financial Years
Current Assets Turnover Ratio
Formula 2008-2009 2009-2010 2010-2011
Net sales Current assets
0.84 0.82 1.07

21
3. Inventory Turnover Ratio
Formula 2008-2009 2009-2010 2010-2011
Net sales
Avg. inventory
14.37 15.00 20.96
Significance: This is a test of inventory to discover possible trouble in the form of overstocking or
overvaluation. A low inventory turnover may reflect dull business, over investment in inventory.
A high inventory turnover indicates relatively lower amount of working capital locked in
inventories. In the financial year 2008-09 the inventory is very low and the 2009-10 and 2010-11 the
inventory turnover ratio is increasing. In year 2010-11 excellent inventory turnover ratio has
been seen.
14.37 15
20.96
0
5
10
15
20
25
2008-09 2009-10 2010-11
Financial Years
Inventory Turnover Ratio

22
4. Debtor Turnover Ratio
Formula 2008-2009 2009-2010 2010-2011
Net Credit Sales
Closing Sundry Debtors
4.81 3.88 3.43
Significance: -
This ratio indicates the speed at which the sundry debtors are converted in the form of cash.
In the 2008-09 the debtor turnover ratio is very high it means in that is good for the business but in
the financial year 2010-11 the debtor turnover ratio is less that is not good indicator for the company.
4.81
3.88 3.43
0
1
2
3
4
5
6
2008-09 2009-10 2010-11
Financial Years
Debtor Turnover Ratio

23
3. SOLVENCY RATIO
1. Debt-Equity Ratio
Formula 2008-2009 2009-2010 2010-2011
External liabilities
Shareholders fund
0.54 0.41 0.28
Significance: -
A high debt-equity ratio may indicate that financial status of the creditors is more than
that of the owners. A very low debt equity rate may mean that the borrowing capacity of the
organization is being underutilized. It is a measure of financial strength of a concern. Lower the
ratio greater the security available to the creditors. Generally 1:2 ratio is acceptable, but the ratio
of at least 1:1 is desirable as banks even do accept this.
In the financial year 2008-09 the debt-equity ratio is more than the other years it means it
is not good sign for the company. In the 2010-11 the debt-equity ratio is very less means in that
year the borrowing capacity of the organization is being underutilized.
0.54
0.41
0.28
0
0.1
0.2
0.3
0.4
0.5
0.6
2008-09 2009-10 2010-11
Financial Years
Debt-Equity Ratio

24
2. Capital Employed Ratio
Formula 2008-2009 2009-2010 2010-2011
Fixed assets *100
Capital employed
38.37 35.00 39.28
Significance: -
Normally a proprietor should provide all the funds required to purchase fixed assets. If the
capital employed ratio exceeds 100%, it indicates that the company has used short-term funds for
acquiring fixed assets, which policy is not desirable. when the percentage is less that 100, a part of
the net working capital is supplied by the shareholders, provided that there are no other non-current
assets. The ratio should generally be 65%.
In the financial year 2010-11 the ratio is 38.28 that is very less improvement from the last
year because the fixed assets of company is having minor improvement in the 2010-11 so that
ratio is approximately same for the past years.
38.37
35
39.28
32
33
34
35
36
37
38
39
40
2008-09 2009-10 2010-11
Financial Years
Capital Employed Ratio
25
4. PROFITABILITY RATIO
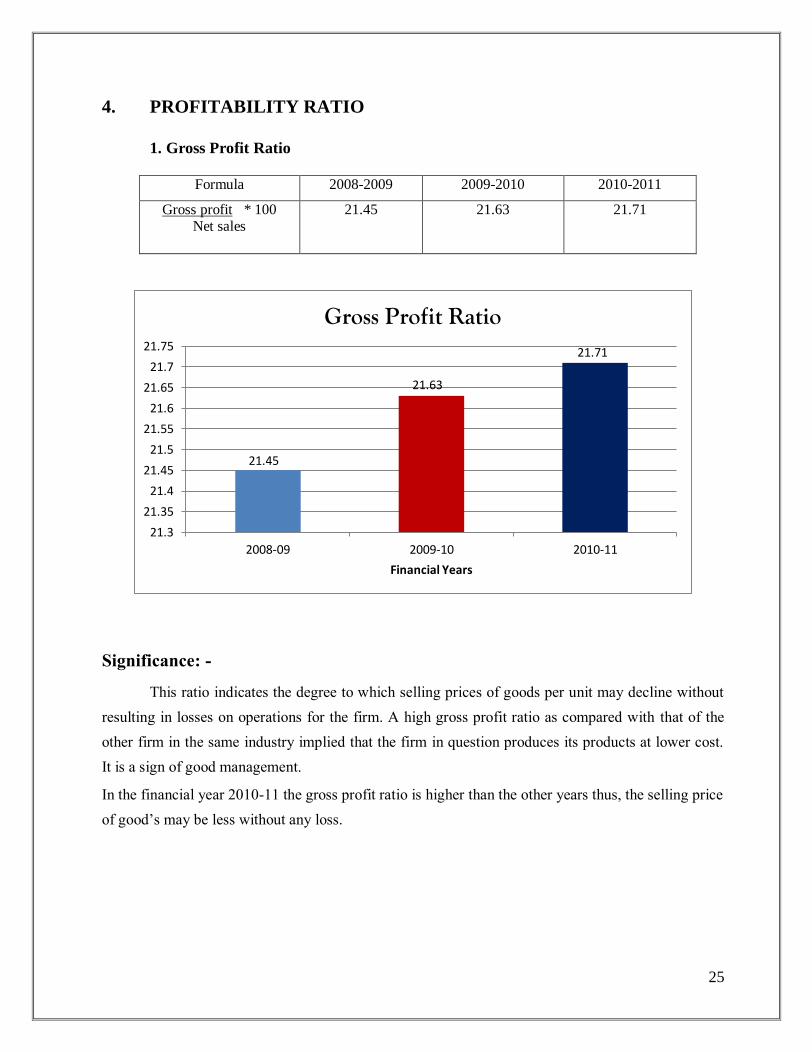
1. Gross Profit Ratio
Formula 2008-2009 2009-2010 2010-2011
Gross profit * 100 Net sales
21.45 21.63 21.71
Significance: -
This ratio indicates the degree to which selling prices of goods per unit may decline without
resulting in losses on operations for the firm. A high gross profit ratio as compared with that of the
other firm in the same industry implied that the firm in question produces its products at lower cost.
It is a sign of good management. In the financial year 2010-11 the gross profit ratio is higher than the other years thus, the selling price
of good’s may be less without any loss.
21.45
21.63
21.71
21.3
21.35
21.4
21.45
21.5
21.55
21.6
21.65
21.7
21.75
2008-09 2009-10 2010-11
Financial Years
Gross Profit Ratio

26
2. Net Profit Ratio
Formula 2008-2009 2009-2010 2010-2011
Net profit(after tax)*100 Net sales
17.26 13.61 17.58
Significance: -
This ratio is widely used as a measure of over-all profitability and is very useful to the
proprietors. it gives an idea of the efficiency as well as profitability of the business to a limited
extent. The company has improved its net profits in the financial year 2010-11 the net profit ratio is
17.58.It means in that year the profit is more than the other years. The sale of the company has
been improved.
17.26
13.61
17.58
0
2
4
6
8
10
12
14
16
18
20
2008-09 2009-10 2010-11
Financial Years
Net Profit Ratio

27
3. Return On Assets
Formula 2008-2009 2009-2010 2010-2011
Net Profit * 100
Total Assets
6.69 6.13 7.42
Significance:-
The ratio is a measure of the return on the total resources of the business enterprise. It
shows how efficiently management has used the funds provided be the creditors and the owners. It can be referred that the financial year 2009-10 had not so good ratio because of high operating
expenses. However the company has improved in year 2010-11. The financial year 2010-11 had
7.42% as returns on its various resources which is appreciable.
6.69 6.13
7.42
0
1
2
3
4
5
6
7
8
2008-09 2009-10 2010-11
Financial Years
Return On Assets

28
5. Return On Shareholders’ Fund
Formula 2008-2009 2009-2010 2010-2011
PAT * 100
Total shareholders fund
19.06 14.05 21.17
Significance:-
This ratio is a measure of the profitableness of an enterprise. The realization of a
satisfactory net income is the major objective is being achieved. The financial year 2009-10 had low returns on shareholders fund as compared to next financial
years. In the 2010-11 the return on share holder‟s fund is high for compare than the past years. It
is good sign for the Company.
19.06
14.05
21.17
0
5
10
15
20
25
2008-09 2009-10 2010-11
Financial Years
Return On Shareholders’ Fund

29
5. Earnings Per Share
Significance:-
The earning per share ratio help to determining the market price of equity share of the
company. In the financial year 2010-11 the EPS has decreased as compare to previous year
and it is 13.19% thus, that is not sign for the company.
19.68 20.2
13.19
0
5
10
15
20
25
2008-09 2009-10 2010-11
FInancial years
Earnings Per Share
Formula 2008-2009 2009-2010 2010-2011
NPATD No. of eq. Shareholders
19.68 20.20 13.19

30
6. Dividend Pay Out Ratio
Formula 2008-2009 2009-2010 2010-2011
Dividend per share* 100
EPS
5.58 5.94 4.67
Significance:-
It indicates the policy of management to pay cash dividend. A high dividend pay out
ratio is better position of the company in the 2010-11 the ratio is 4.67 but in the 2010-11 the
dividend payout ratio is 5.94% it means the company has good position in paying dividend.
5.58 5.94
4.67
0
1
2
3
4
5
6
7
2008-09 2009-10 2010-11
Financial Years
Dividend Pay Out Ratio

31
FINAL DISCUSSION
The conclusion about Sintex industries ltd, it is growing and increasing year by year.
By the comparison of the Ratio analysis this conclusion can be drawn.
Net Profit & Gross profit ratio of company is favourable and has increased.
Return on equity capital of company is favourable and has increased.
EPS of the company is unfavourable
Liquidity ratio is favourable more than the standard.
Stock turnover ratio is increasing.
Debtor‟s turnover ratio is negative.
Fixed And Current assets turnover ratio of company has increasing.
Current ratio of company is increasing year by year.
On the basis of these findings I would say that SINTEX INDUSTRIES LTD has
improved financial position and continually increasing its financial position year by year.
32
Chapter-5
Conclusions
Implications
Limitations
Scope for future work
33
Conclusion
The term ratio refers to the numerical or quantities relationship between two items or
variables. Ratio analysis is a widely used tool of financial analysis. It is defined as the
systematic use of ratio, to interpret the financial statements, so that the strengths & weakness
of the firm as well as its history, performance and current financial position can be
determined. Ratio analysis is the most simplified method of appraisal of business
performance.
By going through the different variables We arrived at this conclusion that the |SINTEX
INDUSTRIES LTD. is growing every years. The company do the business of plastic and it is
one of the leading company in India.The product are of international standards.
On The ratios basis of the ratios analysing I can conclude the financial position of the
company and conclude the ratios.
Liquidity Ratio
In liquidity ratio the current ratio in the financial year 2010-
11 is 4.00 it is improved by 14.5% for compare to the past year. And acid test ratio in
financial year 2010-11 is 3.36 it is improved by17.89% for compare to the past year. Thus I
conclude on the basis of liquidity ratios that it is sign of improvement.
Turnover Ratio In the turnover ratio the fixed assets turnover ratio in the
financial year 2010-11 is 1.36 it has not improved as compare to the last year and the
current assets turnover ratio in the financial year 2010-11 is 1.07 and other inventory turnover
ratios are also improved in 2010-11 for compared to the last year but and debtor turnover has
decreased as compare to previous year.
Solvency Ratio In the solvency ratio the debt equity ratio in the financial
year 2010-11 is 0.28 and the capital employed ratio is 39.28, on the basis of these ratio I can
say that company financial position is positive.

34
Profitability Ratio In the profitability ratios the gross profit ratio in the 2010-
11 is 21.71 and the net profit ratio is 17.58 it means the profit of the company is increasing
every year.

35
Suggestions
After the detailed study of financial analysis of Sintex industries ltd. there are some
suggestions to offer for improving their performance, profitability, liquidity & sales. The
main suggestions are given below: -
1) GROSS PROFIT RATIO: The company is doing well and has potential to earn
more profit by exploring those market segments which are yet to explore to increase
their sales. Gross profit will increase with the help of reducing their cost of production
and direct expenses.
2) NET PROFIT RATIO: The company can improve its net profit ratio by reducing
operating expenses.
3) RETURN ON INVESTMENT: Return on investment is improving every year and
they should try improving operational efficiency and borrowing policy of enterprise.
4) FIXED ASSETS TURNOVER RATIO: They should use fixed assets efficiently so
that the fixed assets turnover ratio improves.
5) INVENTORY TURNOVER RATIO: For better performance of business and to
make inventory turnover ratio higher they should increase the sale.

36
Limitations
The annual report may be not exact so the result interpreted may vary from actual
situation
This research is stick to only quantitative analysis of the company.

37
Scope For Future Work
After analyzing the annual reports, profit and loss and balance sheet of Sintex industries ltd. I
found that company is growing and it has good potential to do best in coming years.
With the help of analysis the ratio of Sintex industries ltd the researchers can forecast the
position of that company in future and if we think from investors point of view on the basis of
these ratio they can invest in Sintex industries ltd.
So we can say that there are scope and opportunity for Sintex industries ltd. in the
future.
38
Reference

39
REFERENCE
Webliography
http://www.sintex-plastics.com
http://www.sintex-india.com
http://www.moneycontrol.com/india/stockpricequote/diversified/sintexindustries/SI27
Bibliography
Sharma & Gupta „Fianacial Management‟ Kalyani Publication 2010
Pandey I M „Fianacial Management‟ Tata Mchill Pubilcation 2010
Research paper & report
Pinc research (2011) Suman memani, abhishek kumar pp 1
Annual report sintex industries ltd (2010-2011)
Care equigrade (2010) Ms. Revati Kasture

40
Annexure

41
Data analysis
Data 2008-09(in crore) 2009-10(in crore) 2010-11(in crore)
Current asset 2221.15 2450.06 2437.14
Current liability 581.10 522.70 609.16
Liquid asset 2154.45 2377.57 1536.17
Net sales 1883.41 2010.55 2615.97
Fixed asset 1418.67 1473.34 1909.61
Avg. Inventory 140.95+121.03
2
126.98+140.95
2
126.98 + 121.62
2
Net credit sales 1,982.04 2,103.56 2,718.74
Closing debtors 495.80 677.06 838.12
Ext. Liabilities 934.76 801.45 609.16
Share holders fund 1,704.92 1,946.88 2172.42
Gross profit 404.06 425.51 567.94
Net profit after tax 325.12 273.70 460.01
Net profit 341.66 341.48 478.69
Total assets 5104.38 5566.94 6445.46
PAT 325.12 273.70 460.01
Total share holders
fund
1,704.92 1,946.88 2172.42
NPATD same
No of eq. Share
holders
37,374 37,210 56586
Dividend per share Rs. 1.1 Per Share ` 1.20 ` 0.65 Per Share
EPS 19.68 20.20 13.19