rational developer for ibm i (rdi) distance learning …€¦ · · 2010-08-13• ibm rational®...
TRANSCRIPT

IBM Software
Rational Developer for IBM i (RDI)
Distance Learning hands-on LabsIBM Rational Developer for i
Maintain an ILE RPG application using
Remote System Explorer
Debug a CL/RPG program member
Lab Exercises Lab04
Catalog Number
Lab 4 Page 6
IBM Software
�2009 IBM Corporation

IBM Software
© Copyright International Business Machines Corporation, 2009. All rights reserved.
US Government Users Restricted Rights - Use, duplication or disclosure restricted by GSA ADP Schedule Contractwith IBM Corp.
Page 7 Rational Developer for i V7.5

IBM Software
Contents
LAB 4 DEBUGGING IBM I PROGRAMS USING THE INTEGRATED IBM I DEBUGGER..................94.1 OVERVIEW....................................................................................................94.2 INTRODUCING THE INTEGRATED IBM I DEBUGGER............................................104.3 STARTING A DEBUG SESSION USING A SERVICE ENTRY POINT................................104.4 STARTING THE INTEGRATED DEBUGGER USING THE DEBUG ACTION......................304.5 DEBUGGING A JOB........................................................................................374.6 LAB SUMMARY.............................................................................................394.7 OVERALL SUMMARY LAB 01 TO LAB04..........................................................40
Lab 4 Page 8

IBM Software
Lab 4 Debugging IBM i programs using the integrated IBM i debugger
4.1 OverviewThis module teaches you how to debug a CL and ILE RPG program. You will learn how to start the debugger,set breakpoints, monitor variables, run, and step into a program, view the call stack in the Debug view, removea breakpoint, add a memory monitor, and set Watch breakpoints and all from the Debug perspective.
4.1.1 Skill levelIntroductory
4.1.2 AudienceIBM i developer
4.1.3 System requirements• IBM Rational® Developer for i, V7.5 and all software updates through the IBM Installation Manager.• IBM i V5R3, V5R4, or V6R1
4.1.4 PrerequisitesBasic Microsoft Windows operations such as working with the desktop and basic mouse operations such as openingfolders and performing drag-and-drop operations• It will also help if you understand CL and ILE RPG.This tutorial is divided into a number of modules, each with its own learning objectives. You can choose toskip the modules. . You can go directly to the Debug module if you are only interested in that part, however youshould complete module LAB01 to create a connection to the IBM i server. The connection will be used in thismodule.Each module contains several lessons that must be completed in order for the tutorial to work as shown in thisscript.
4.1.5 Expected resultsUpon completion of this tutorial you will know how to verify/compile an IBM i application from the RemoteSystem Explorer. You will also know how to run an interactive program using the Remote System Explorer.
4.1.6 Conventions used in this tutorial• Bold font for user interface controls• Mono-spaced font for user input and code blocks• Italic font for variable names and glossary terms.
Important!You should go through Lab01 'Create a connection and get startedwith RSE' before you work on this Lab. Lab01 contains the followinginformation:
• Which IBM i server to connect to,
• Which userid to use,
• How to setup the correct library list for this lab.
Page 9 Rational Developer for i V7.5

IBM Software
4.2 Introducing the Integrated IBM i DebuggerThe Integrated IBM i Debugger is a source-level debugger that enables you to debug and test an application that isrunning on an IBM i system. It provides a functionally rich interactive graphical interface that allows you to:• View source code or compiler listings, while the program is running on an IBM i host.• Set, change, delete, enable and disable line breakpoints in the application program. You can easily manage all
your breakpoints using the Breakpoints view.• Set Watch breakpoints to make the program stop whenever a specified variable changes.• View the call stack of your program in the Debug view. As you debug, the call stack gets updated dynamically.
You can view the source of any debug program by clicking on its call stack entry.• Step through your code one line at a time.• Step return, step into or step over program calls and ILE procedure calls.• Suspend program execution and get control back to the debug session.• Display a variable and its value in the Monitors view. The value can easily be changed to see the effect on the
program’s flow.• Locate procedure calls in a large program quickly and easily using the Modules/ Programs view.• Debug multi-threaded applications, maintaining separate stacks for each thread with the ability to enable and
disable any individual thread.• Load source from the workstation or a different IBM i system than the one the program runs on – useful if
you don’t want the source code on a production machine.• Debug client/server and distributed applications.The Debugger supports RPG/400® and ILE RPG, COBOL and ILE COBOL, C, C++ and CL.Now that you know the basic features of the debugger, let’s try them out.
4.3 Starting a Debug session using a service entry point
You will be working with the ILE RPG program PAYROLLG.Instruction for creating a connection, which IBM i system to use, are contained in Lab01 of this series of Labs. Ifyou haven't worked through Lab01, please do this first. The instruction in this Lab depend on the correct setup ofa connection to an IBM i server.
Note:PAYROLLG is the same RPG program as PAYROLL but without compileerrors. You are using it instead of PAYROLL in this lesson, to accommodateanyone who decided to skip right to this Lab, without completing Lab02 orLab03.
To make the lesson more interesting you will use CL program CLR1 to call PAYROLLG and you will pass oneparameter to CLR1.In this lesson, you will use a service entry point to start a debug session for your application. The service entry pointfeature is designed to allow easy debugging of applications that invoke business logic written in RPG, COBOL,CL, or even C or C++. The service entry point is a special kind of entry breakpoint that can be set directly fromthe Remote System Explorer. It is triggered when the first line of a specified procedure is executed in a job thatis not under debug. Service entry points allow you to gain control of your job at that point. A new debugsession gets started and execution is stopped at that location.
Lab 4 Page 10

IBM Software
Tip:To use a service entry point to start a debug session for your application andto allow updating of files in production libraries while debugging, the UpdateProduction Files must be checked in the preferences of IBM i Debug.
To set the i Debug preference: __i. Use Window > Preferences__ii. Expand Run/Debug __iii. Select IBM i Debug)
Since you are using test libraries for the exercises, you don’t have to check this IBM i Debug preference.To start a debug session using a service entry breakpoint:__1. In the Remote Systems view expand the Library list filter, if it isn’t expanded already.__2. Expand library RSELABxx, if it isn’t expanded already.
Page 11 Rational Developer for i V7.5

IBM Software
__3. Right-click program CLR1 in library RSELABxx.
__4. Click Debug (Service Entry) > Set Service Entry Point on the pop-up menu to set a service entrypoint.
A message displays indicating the service entry point was successfully set.
If you get this error message instead,
indicating that the Debug Server has not been started yet,
__i. Right-click Objects in the Remote Systems view __ii. Select Remote Servers > Debug > Start __iii. Perform step 2 again.
Lab 4 Page 12

IBM Software
The Service Entry Points view is automatically added to the stacked views at the lower right. It lists all the serviceentry points. You use this view to delete, activate, de-activate, modify and refresh service entry points.
__1. Switch to the 5250 emulation session.
TroubleshootingIf you have done the exercises in Lab03, your 5250 session might still beassociated with the RSE server job,.you need to release the interactivesession. To do so, in the Remote Systems view, right-click Objects and clickRelease Interactive Job on the pop-up menu.
On the command line of the 5250 screen, :add the library RSELABxx to the library list and invoke theprogram CLR1, by entering the following commands:__2. ADDLIBLE RSELABxx and then __3. CALL PGM(RSELABxx/CLR1) PARM( ’XX’) (where XX is your team number)As soon as the program enters the system, the service entry point is hit and the debug session is started on theworkstation and the perspective displays with the CLR1 source code in the editor. The Debug perspectivegives you access to all available debugger features. Let’s look at some of them.__4. Click anywhere in the workbench to give it focus.
4.3.1 Setting breakpointsYou can only set breakpoints at executable lines. One way to set a breakpoint is to right-click on the line in theSource view.
To set a breakpoint:
Page 13 Rational Developer for i V7.5

IBM Software
__1. Position the cursor on line 11.__2. Right-click anywhere on line 11.__3. Click Add breakpoint on the pop-up menu.A dot with a checkmark in the prefix area indicates that a breakpoint has been set for that line.The prefix area is the small grey margin to the left of the source lines.Now you add a conditional breakpoint to stop in the loop when it loops the 99th time.
4.3.2 Adding a conditional breakpoint
__1. Select line 8.__2. Click the Breakpoints tab in the upper right pane of the Debug perspective. The Breakpoints view opens.
__3. Right-click anywhere within the Breakpoints view.
__4. Click Add Breakpoint > Line on the pop-up menu. The Add a Line Breakpoint window opens.
Lab 4 Page 14

IBM Software
Tip:You can select an existing breakpoint by right-clicking it and selecting EditBreakpoint.
__5. Click Next.
Page 15 Rational Developer for i V7.5

IBM Software
You only want to stop in the loop when it executes for the 99th time or more. You can do that by setting theFrom field of the Frequency group to 99.__6. Under Frequency in the From field, type 99.__7. Click Finish.You have added a breakpoint including a conditional breakpoint to your debug session.
4.3.3 Monitoring variables
You can monitor variables in the Monitors view. Now you will monitor the variable &count.To monitor a variable:
Lab 4 Page 16

IBM Software
__1. In the Source view, double-click the variable &count.__2. Right-click &count.__3. Click Monitor Expression on the pop-up menu.
The Monitors view opens.
The variable appears in the Monitors view. Its current value is zero.Now that some breakpoints and a monitor are set, you can start to run the application.
__4. Click the Resume icon from the Debug toolbar.The program starts running and stops at the breakpoint at line 8. (Be patient, the Debugger has to stop 98times but because of the condition continues to run until the 99th time.) Notice in the Monitors view, that&count now has the value 99.__5. Click the Resume icon again.The program stops at the breakpoint at line 8 again and &count now has the value 100.__6. Click the Resume icon once more so that the program runs to the breakpoint at line 11.__7. If you do not see the error message below, go to “Stepping into a program” topic 4.5.3.
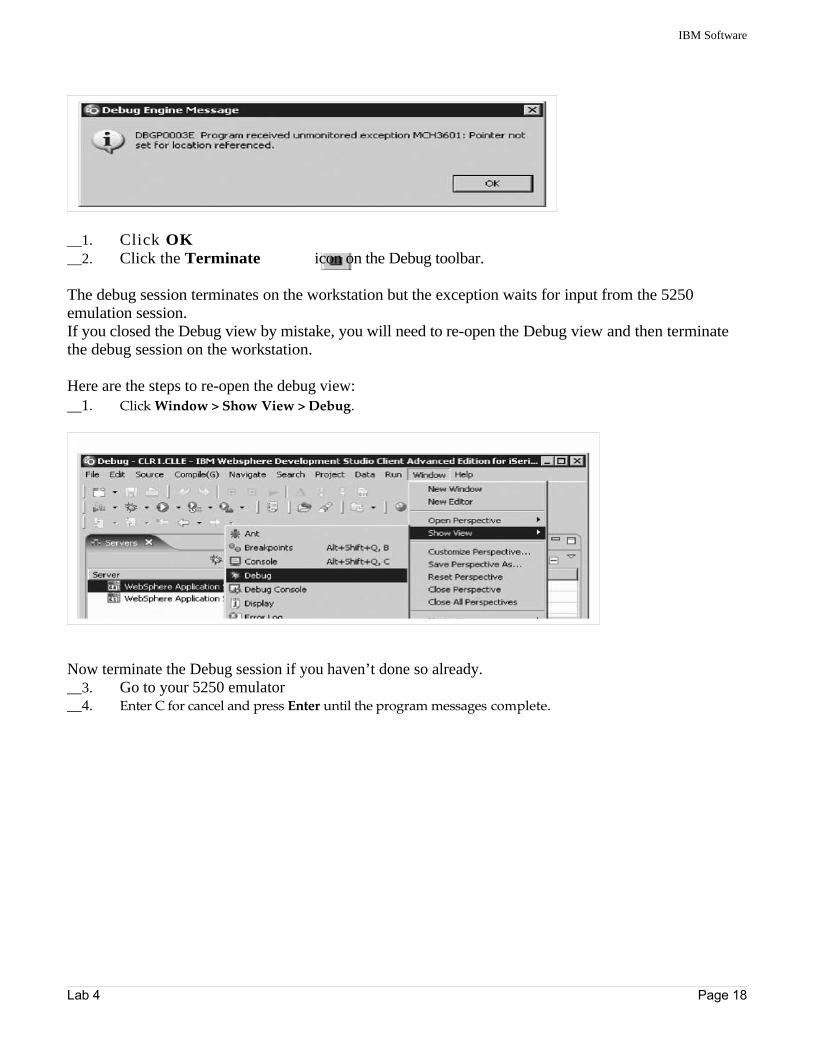
4.3.4 Error HandlingIf you don't have any errors, skip to the next section 'Stepping into a program'If you forget to add the parameter to the CALL program command when you call the program, you willsee this error message.
Page 17 Rational Developer for i V7.5
IBM Software
__1. Click OK__2. Click the Terminate icon on the Debug toolbar.
The debug session terminates on the workstation but the exception waits for input from the 5250emulation session.If you closed the Debug view by mistake, you will need to re-open the Debug view and then terminatethe debug session on the workstation.
Here are the steps to re-open the debug view:__1. Click Window > Show View > Debug.
Now terminate the Debug session if you haven’t done so already.__3. Go to your 5250 emulator __4. Enter C for cancel and press Enter until the program messages complete.
Lab 4 Page 18

IBM Software
In the workbench,__5. Click the Remove all terminated launches icon on the Debug toolbar to clean up the Debug
view.
To restart the program and start the debug session again:On the 5250 command line, call the CLR1 program with the parameter XX.__6. Enter: CALL PGM(RSELABxx/CLR1) PARM(’XX’). XX being your team number
4.3.5 Stepping into a programThe Debugger allows you to step over a program call or step into it. When you step over a program call, thecalled program runs and the Debugger stops at the next executable statement in the calling program.
You are going to step into the PAYROLLG program.
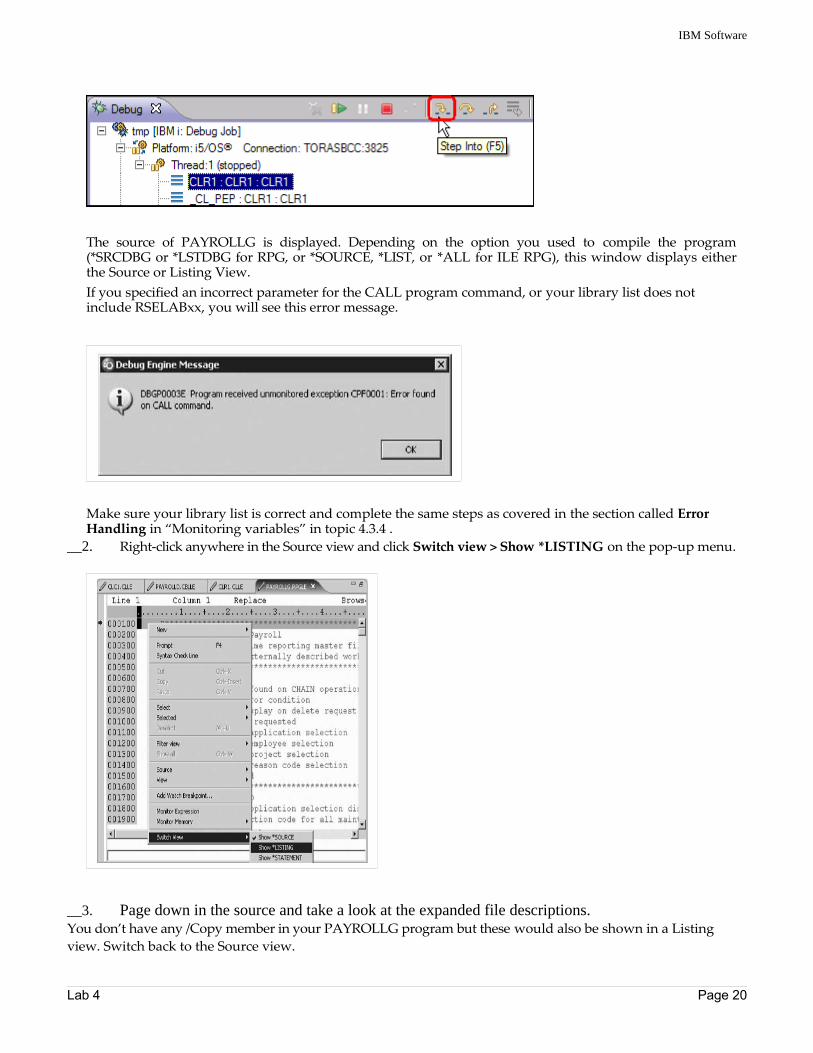
To step into a program:__1. Click the Step into icon on the Debug toolbar.
Page 19 Rational Developer for i V7.5
IBM Software
The source of PAYROLLG is displayed. Depending on the option you used to compile the program(*SRCDBG or *LSTDBG for RPG, or *SOURCE, *LIST, or *ALL for ILE RPG), this window displays eitherthe Source or Listing View.If you specified an incorrect parameter for the CALL program command, or your library list does notinclude RSELABxx, you will see this error message.
Make sure your library list is correct and complete the same steps as covered in the section called ErrorHandling in “Monitoring variables” in topic 4.3.4 .
__2. Right-click anywhere in the Source view and click Switch view > Show *LISTING on the pop-up menu.
__3. Page down in the source and take a look at the expanded file descriptions.You don’t have any /Copy member in your PAYROLLG program but these would also be shown in a Listingview. Switch back to the Source view.
Lab 4 Page 20

IBM Software
__4. Right-click anywhere in the Source view.__5. Click Switch view > Show *SOURCE on the pop-up menu.
You have stepped into PAYROLLG program, switched the view from source to listing and back to source.
4.3.6 Listing call stack entriesThe Debug view in the upper left pane, lists all call stack entries. It contains a tree view for each thread. Thethread can be expanded to show every program, module, and procedure that is on the stack at the currentexecution point. If you double-click on a stack entry you will display the corresponding source if it is available.Otherwise the message No Debug data available appears in the Source view.In the Debug view, expand the stack entry of Thread1 if it is not expanded already.
The stack entry allows you to work with and switch between different programs and/or ILE modules.You have viewed the call stack entries of your program.
4.3.7 Setting breakpoints in PAYROLLGNow you add some breakpoints in PAYROLLG. To add breakpoints:__1. Select PAYROLLG in Thread1.__2. In the source view scroll to line 57.__3. Double-click the prefix area of line 57.A breakpoint icon is added to the prefix area of this line to indicate that a breakpoint is set.__4. Repeat the above step for line 58
Page 21 Rational Developer for i V7.5

IBM Software
__5. Right-click in the prefix area of line 87 and click Add Breakpoint on the pop-up menu.
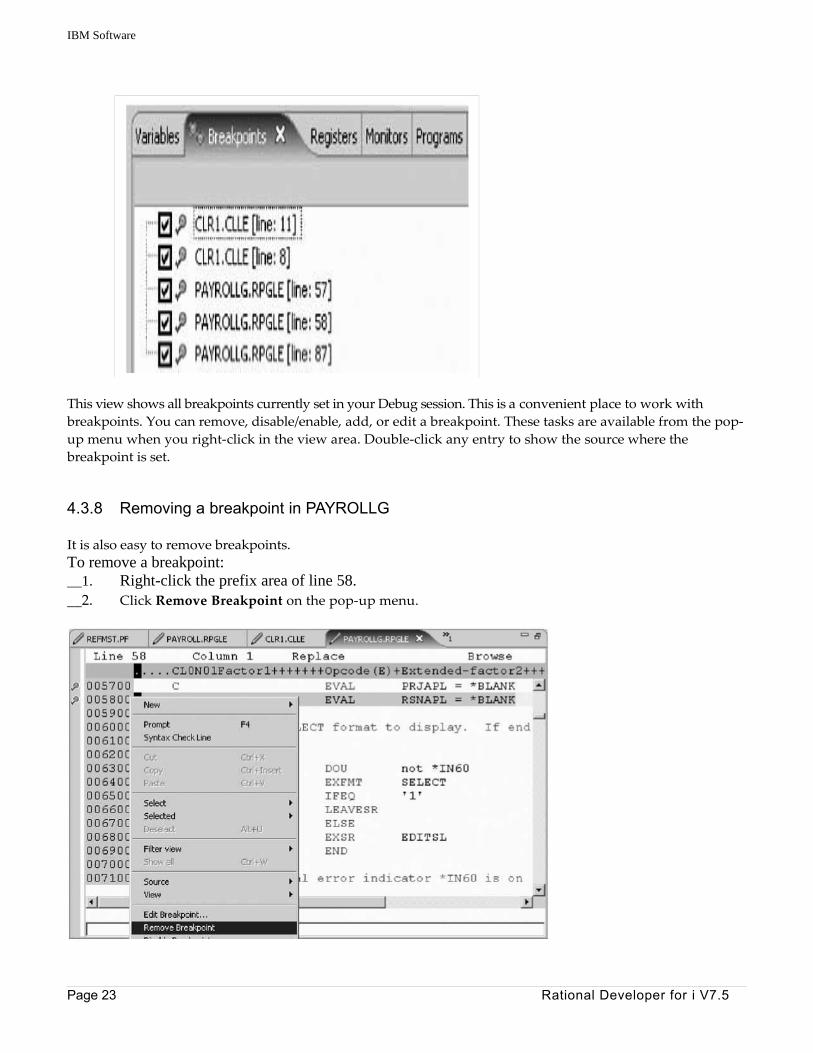
To view all breakpoints, select the Breakpoints tab from the top left pane.
Lab 4 Page 22
IBM Software
This view shows all breakpoints currently set in your Debug session. This is a convenient place to work withbreakpoints. You can remove, disable/enable, add, or edit a breakpoint. These tasks are available from the pop-up menu when you right-click in the view area. Double-click any entry to show the source where thebreakpoint is set.
4.3.8 Removing a breakpoint in PAYROLLG
It is also easy to remove breakpoints.To remove a breakpoint:__1. Right-click the prefix area of line 58.__2. Click Remove Breakpoint on the pop-up menu.
Page 23 Rational Developer for i V7.5

IBM Software
The icon is removed from the prefix area indicating that no breakpoint is set on that line. The breakpoint is alsoremoved from the list in the Breakpoints view.
Tip:Double-clicking on a breakpoint in the prefix area will also remove thatbreakpoint.
Now you are ready to run the PAYROLLG program.__3. Click the Resume icon from the Debug toolbar.The program starts running and runs to the breakpoint at line 57.__4. Click the Resume icon again.The program waits for input from the 5250-emulation session.
__5. Type an X beside the Project Master Maintenance option.__6. Press Enter in the emulation session. The program runs to the breakpoint at line 87.You have removed a breakpoint from PAYROLLG and started to run the program.
4.3.9 Monitoring variables in PAYROLLGNow let’s monitor variables and change them in PAYROLLG.To monitor variables:__1. In the source view, double-click the variable EMPAPL on line 88.__2. Right-click the variable.__3. Click Monitor Expression on the pop-up menu.
Lab 4 Page 24
IBM Software
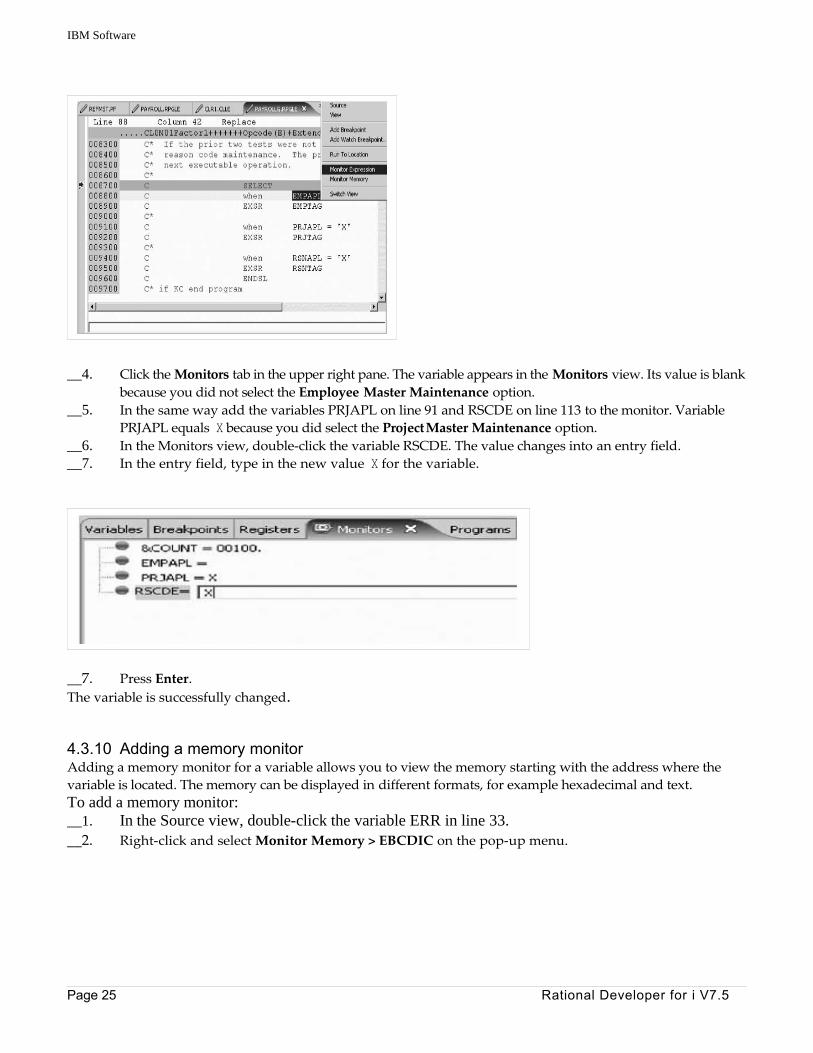
__4. Click the Monitors tab in the upper right pane. The variable appears in the Monitors view. Its value is blankbecause you did not select the Employee Master Maintenance option.
__5. In the same way add the variables PRJAPL on line 91 and RSCDE on line 113 to the monitor. VariablePRJAPL equals X because you did select the Project Master Maintenance option.
__6. In the Monitors view, double-click the variable RSCDE. The value changes into an entry field.__7. In the entry field, type in the new value X for the variable.
__7. Press Enter. The variable is successfully changed.
4.3.10 Adding a memory monitorAdding a memory monitor for a variable allows you to view the memory starting with the address where thevariable is located. The memory can be displayed in different formats, for example hexadecimal and text.To add a memory monitor:__1. In the Source view, double-click the variable ERR in line 33.__2. Right-click and select Monitor Memory > EBCDIC on the pop-up menu.
Page 25 Rational Developer for i V7.5

IBM Software
This will open the Memory view in the pane at the bottom of the perspective. The tab shows the name of thevariable.
__3. Use the scroll bar on the right of the Memory view to scroll down. You can see the current content of thememory.
__4. Right-click in the view area.__5. Click Reset to Base Address on the pop-up menu to return to the starting address.__6. To get the hex content of the memory starting with the selected variable, click the tab New Renderings and
select Hex for example. A new page with the hex values is added to the Memory view.__7. Click the Toggle Split Pane icon to display the character values as well.
You have added a memory monitor for the variable ERR.
Lab 4 Page 26

IBM Software
4.3.11 Setting Watch breakpointsA Watch breakpoint provides a notification to the user when a variable changes. It will suspend the execution ofthe program until an action is taken.To set a Watch breakpoint:__1. Go to the Line number field at the bottom of the source area. In this field enter 116 to go to that line.
__2. Double-click variable *IN60 to highlight it.__3. Right-click and click Add Watch Breakpoint on the pop-up menu
The Add a Watch Breakpoint window opens. The Expression field is pre-filled with the highlighted variable*IN60.By default the Number of bytes to watch field is set to zero, which means the variable will be watched in itsdefined length.
__4. Click Finish. The Watch breakpoint is now set.__5. Click the Resume button on the Debug toolbar.The application waits for input from the 5250-emulation session.
Page 27 Rational Developer for i V7.5

IBM Software
In the 5250 emulation session, type:__6. 123 for Project Code and D (for delete) in the Action Code field.__7. Press Enter. A message is displayed indicating that the variable *IN60 has changed.
__8. Click OK. The program stops at line 465. This line is located immediately after the statement which causedthe variable *IN60 to change.
You have added a Watch breakpoint for the variable *IN60 and run the program to see the notification that thevariable has changed.
4.3.12 Terminate a debug sessionTo close the debugger:__1. Click the Resume icon on the Debug toolbar. The application waits for input from the 5250 emulation
session.__2. Switch to the 5250 emulation session.__3. Press F3 to end the program. A message Program terminated appears:
Lab 4 Page 28

IBM Software
__4. Click OK.
4.4 Starting the Integrated Debugger using the Debug action Besides using service entry points to start a debug session, you can start the Debugger in several ways: directlyfrom the pop-up menu of a program or service program in the Remote Systems view, or from a LaunchConfigurations window. Starting directly from the Remote Systems view without prompt doesn’t allow you tospecify parameters to be passed to the program. The Launch Configurations window allows you to modify howthe program is invoked and to specify parameters.CLR1 requires a parameter.Before starting the debugger you need to associate a 5250 emulation session with the connection in thesame way you did for running the program. __1. In the command line of the 5250 emulation session, type the command STRRSESVR connectionName__2. Press Enter. The connectionName parameter is the name of your connection defined in the Remote Systems
view. This associates the interactive job with the Remote System Explorer communications server.__3. Return to the workbench.To start the debugger:__4. Select program CLR1 in the Remote Systems view.__5. Right-click and select Debug (Prompt) > Interactive from the pop-up menu.
The debugger prompt window opens for the selected program. The connection is prefilled with the name of thecurrent connection. The program to be debugged is also prefilled with the library, program and type
Page 29 Rational Developer for i V7.5

IBM Software
__6. In the Name field, type the program name CLR1. This gives your debug configuration a unique name soyou can use it again when you debug this program.
Note:If you invoke the debugger even without prompting, a launch configurationwith the default configuration named My program (Interactive) will bereused.
__7. You can leave the Step into and Terminate debug session on program completion check boxes selectedand Update production files check box deselected, since you are working with a test library.
__8. Click the How To Start tab.
Lab 4 Page 30

IBM Software
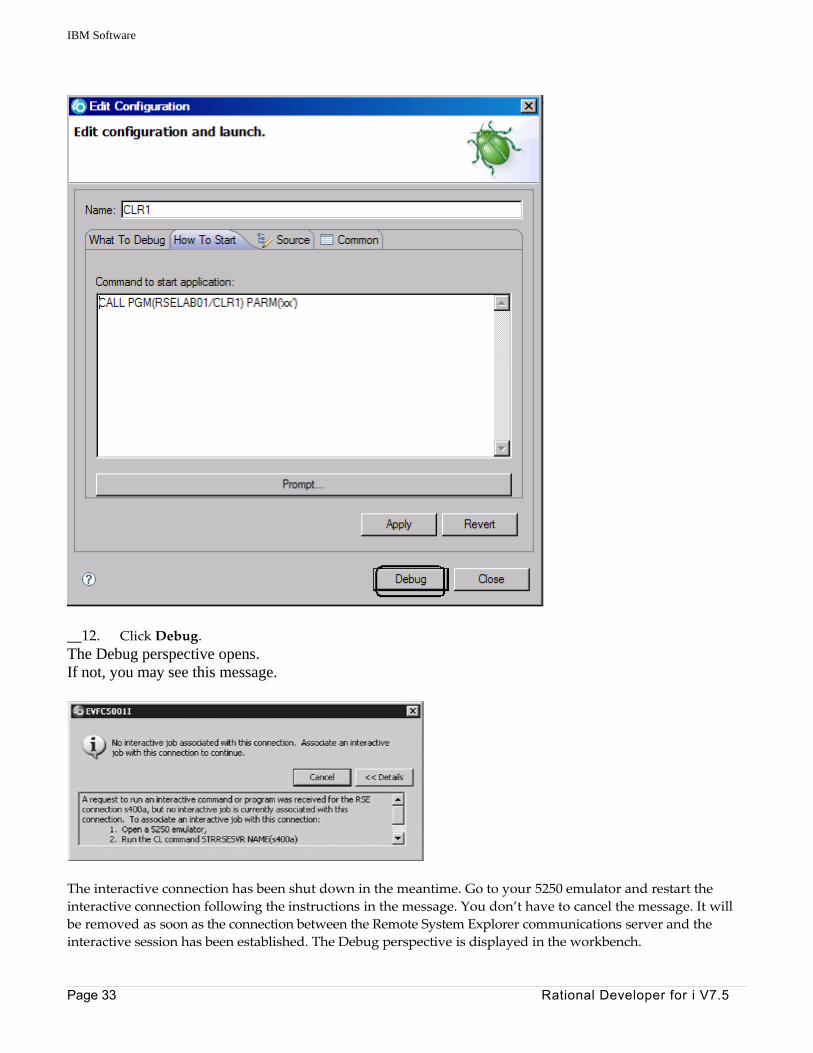
By default, the page contains a call for the program specified in the What To Debug tab.__9. Click Prompt.The Call Program (CALL) window opens.
Page 31 Rational Developer for i V7.5

IBM Software
__10. In the Parameters field, type ’ XX’ where ’XX’ is your workstation number.__11. Click OK.The complete start command for the program appears
Lab 4 Page 32
IBM Software
__12. Click Debug.The Debug perspective opens.If not, you may see this message.
The interactive connection has been shut down in the meantime. Go to your 5250 emulator and restart theinteractive connection following the instructions in the message. You don’t have to cancel the message. It willbe removed as soon as the connection between the Remote System Explorer communications server and theinteractive session has been established. The Debug perspective is displayed in the workbench.
Page 33 Rational Developer for i V7.5

IBM Software
Now that the program is active on IBM i and stopped at the first executable statement, the debugger displays thesource and the debug functions are available.
You have started an interactive debug session.__13. Remove all breakpoints. In the Breakpoints view, click the Remove All Breakpoints button in the toolbar or
select Remove All from the pop-up menu.
__14. Click Resume
PAYROLLG is called and waits for input from the 5250 session.Only Terminate and Suspend buttons are available on the Debug view toolbar.To get control back to the Debug session:__15. Click SuspendYou can now set breakpoints and use all the Debug features.
Tip:Suspend is a valuable feature to debug a looping program.
__16. Click Terminate to end the Debug session.
The Debug session is terminated, but this does not end the program.__17. Leave the program running, we will use it again a little later.__18. Switch to the Remote System Explorer Perspective
Window > Open Perspective > Remote System Explorer
Tip:You can edit, delete and create debug configurations by clicking the arrowbeside the Debug icon on the workbench toolbar and selecting DebugConfigurations from the list.
Lab 4 Page 34

IBM Software
You can also click Run on the workbench menu and select Debug Configurations.The Debug Configurations window opens
Here you can see the CLR1 configuration that you just created. This is your saved configuration to debug CLR1 as
Page 35 Rational Developer for i V7.5
IBM Software
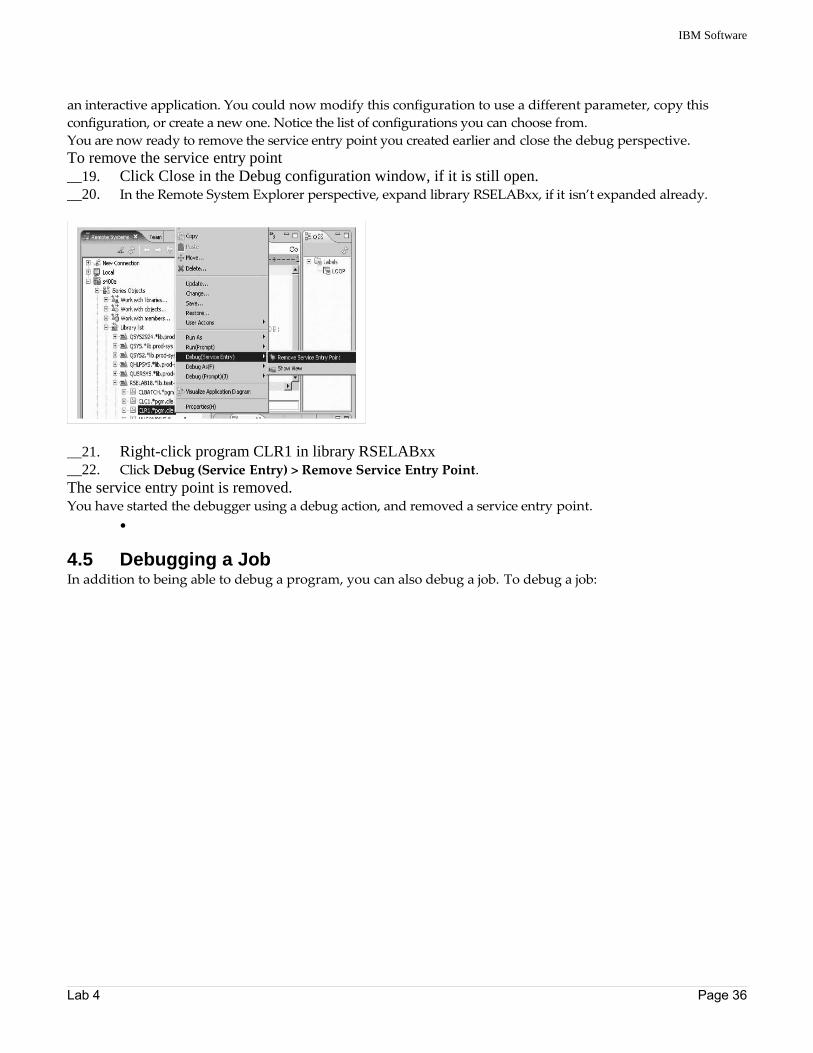
an interactive application. You could now modify this configuration to use a different parameter, copy thisconfiguration, or create a new one. Notice the list of configurations you can choose from.You are now ready to remove the service entry point you created earlier and close the debug perspective.To remove the service entry point __19. Click Close in the Debug configuration window, if it is still open.__20. In the Remote System Explorer perspective, expand library RSELABxx, if it isn’t expanded already.
__21. Right-click program CLR1 in library RSELABxx __22. Click Debug (Service Entry) > Remove Service Entry Point.The service entry point is removed.You have started the debugger using a debug action, and removed a service entry point.
●
4.5 Debugging a JobIn addition to being able to debug a program, you can also debug a job. To debug a job:
Lab 4 Page 36

IBM Software
In the Remote System Explorer perspective, under your active server connection, s400a,
__1. expand Jobs > My Active Jobs > QINTER
__2. Right-click the active job under QINTER, and select Debug As > IBM i Job.
The debug session begins and connects you to the running application.Now you can set breakpoints, monitor variables and memory in the same way you did before .
Page 37 Rational Developer for i V7.5

IBM Software
__3. Terminate the debug session by right-clicking the job in the Debug view and selecting Terminate from thepop-up menu.
The debug session is terminated
4.6 Lab summaryIn this module, you learned how to debug a program using the Integrated IBM i Debugger.Lessons learned
• Start a debug session using service entry points• Add a breakpoint• Add a conditional breakpoint• Edit a breakpoint• Monitor a variable in the Monitors view• Step into your payroll program• Show a Listing view• Display source from call stack entries• View all breakpoints• Remove a breakpoint
Lab 4 Page 38

IBM Software
• Monitor memory• Set a Watch breakpoint• Close the debugger• Invoke the debugger from a Debug Configurations window.
4.7 Overall summary Lab 01 to Lab04This tutorial has taught you so far how to maintain a payroll application using the Remote System Explorer.You learned how to start the product and open the Remote System Explorer perspective and how to use toolsand views in this perspective to connect to an IBM i system and edit, verify, compile and debug the payrollapplicationThe other labs available will guide you through using the Screen designer to edit DDS display file source andusing the Application Diagram Viewer to visually show the Call hierarchy of procedure/subroutines/programs ina source member or show the binding relations of ILE programs and service programs
Congratulations!You have successfully completed the introduction to the RDi Debugger .
Feel free to exploit the other Labs that are available
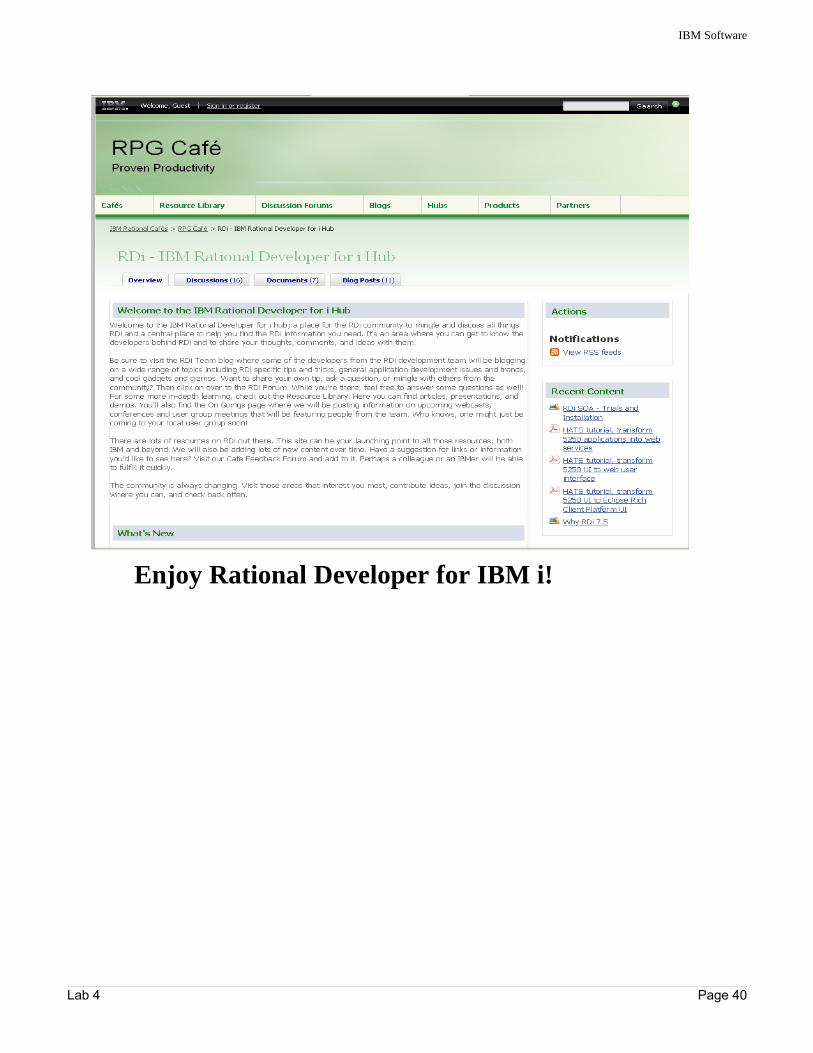
More information and material can be found at our RPG CAFE
http://www-949.ibm.com/software/rational/cafe/community/rpg
Look for the RDi hub
Page 39 Rational Developer for i V7.5
IBM Software
Enjoy Rational Developer for IBM i!
Lab 4 Page 40

IBM Software
Notices© Copyright IBM Corporation 1992, 2009 All rights reserved.
U.S. Government Users Restricted Rights - Use, duplication or disclosure restricted by GSA ADP ScheduleContract with IBM Corp.
This information was developed for products and services offered in the U.S.A. IBM may not offer the products,services, or features discussed in this documentation in other countries. Consult your local IBM
representative for information on the products and services currently available in your area. Any referenceto an IBM product, program, or service is not intended to state or imply that only that IBM product, program,or service may be used. Any functionally equivalent product, program, or service that does not infringe any IBMintellectual property right may be used instead. However, it is the user’s responsibility to evaluate and verifythe operation of any non-IBM product, program, or service.
IBM may have patents or pending patent applications covering subject matter described in thisdocumentation. The furnishing of this documentation does not give you any license to these patents. You cansend license inquiries, in writing, to:
IBM Director of Licensing IBMCorporationNorth Castle DriveArmonk, NY 10504-1785 U.S.A.
For license inquiries regarding double-byte (DBCS) information, contact the IBM Intellectual PropertyDepartment in your country or send inquiries, in writing, to:
IBM World Trade Asia Corporation Licensing2-31 Roppongi 3-chome, Minato-ku Tokyo106, Japan
The following paragraph does not apply to the United Kingdom or any other country where such provisionsare inconsistent with local law: INTERNATIONAL BUSINESS MACHINES CORPORATION PROVIDES THISPUBLICATION ″AS IS″ WITHOUT WARRANTY OF ANY KIND, EITHER EXPRESS OR IMPLIED, INCLUDING,BUT NOT LIMITED TO, THE IMPLIED WARRANTIES OR CONDITIONS OF NON-INFRINGEMENT,MERCHANTABILITY OR FITNESS FOR A PARTICULAR PURPOSE. Some states do not allow disclaimer ofexpress or implied warranties in certain transactions, therefore, this statement may not apply to you.
This information could include technical inaccuracies or typographical errors. Changes are periodically madeto the information herein; these changes will be incorporated in new editions of the publication. IBM maymake improvements and/or changes in the product(s) and/or the program(s) described in this publication at anytime without notice.
Any references in this information to non-IBM Web sites are provided for convenience only and do not in anymanner serve as an endorsement of those Web sites. The materials at those Web sites are not part of thematerials for this IBM product and use of those Web sites is at your own risk.
Licensees of this program who wish to have information about it for the purpose of enabling: (i) the exchangeof information between independently created programs and other programs (including this one) and (ii) themutual use of the information which has been exchanged, should contact:
Page 41 Rational Developer for i V7.5
IBM Software
Intellectual Property Dept. for WebS phere Software IBMCorporation3600 Steeles Ave. EastMarkham, OntarioCanada L3R 9Z7
Such information may be available, subject to appropriate terms and conditions, including in some cases, paymentof a fee.
The licensed program described in this documentation and all licensed material available for it are providedby IBM under terms of the IBM Customer Agreement, IBM International Program License Agreement or anyequivalent agreement between us.
Any performance data contained herein was determined in a controlled environment. Therefore, the resultsobtained in other operating environments may vary significantly. Some measurements may have been made ondevelopment-level systems and there is no guarantee that these measurements will be the same on generallyavailable systems. Furthermore, some measurements may have been estimated through extrapolation. Actual resultsmay vary. Users of this document should verify the applicable data for their specific environment.
Information concerning non-IBM products was obtained from the suppliers of those products, their publishedannouncements or other publicly available sources. IBM has not tested those products and cannot confirm theaccuracy of performance, compatibility or any other claims related to non-IBM products. Questions on thecapabilities of non-IBM products should be addressed to the suppliers of those products.
All statements regarding IBM’s future direction or intent are subject to change or withdrawal without notice,and represent goals and objectives only.
Copyright license
This information contains sample application programs in source language, which illustrates programmingtechniques on various operating platforms. You may copy, modify, and distribute these sample programs inany form without payment to IBM, for the purposes of developing, using, marketing or distributingapplication programs conforming to the application programming interface for the operating platform forwhich the sample programs are written. These examples have not been thoroughly tested under all conditions.IBM, therefore, cannot guarantee or imply reliability, serviceability, or function of these programs.
Each copy or any portion of these sample programs or any derivative work, must include a copyright notice asfollows:
© (your company name) (year). Portions of this code are derived from IBM Corp. Sample Programs. © CopyrightIBM Corp. 1992, 2009. All rights reserved
Trademarks and service marks
The following terms are trademarks or registered trademarks of International Business MachinesCorporation in the United States, other countries, or both.
● i5/OS
● IBM
● OS/400
● Rational● WebSphere
Microsoft, Windows, and the Windows logo are trademarks of Microsoft Corporation in the United States,
Lab 4 Page 42

IBM Software
other countries, or both.
Other company, product or service names may be trademarks or service marks of others.
Page 43 Rational Developer for i V7.5