rational use of high strength concrete in flat slab …
TRANSCRIPT

1
RATIONAL USE OF HIGH STRENGTH CONCRETE IN FLAT SLAB–
COLUMN CONNECTIONS UNDER SEISMIC LOADING
Micael Inácio, Brisid Isufi, Massimo Lapi, António Pinho Ramos
NOTE: This manuscript has been accepted for publication in ACI Structural Journal, Volume 117,
Issue 6. This unedited manuscript will undergo copyediting, typesetting, and review of the resulting
proof before it is published in its final form. The final form can be accessed through ACI's website:
https://www.concrete.org/publications/internationalconcreteabstractsportal.aspx?m=details&i=5172
8080
Cite as: Inácio, M., Isufi, B., Lapi, M., & Ramos, A. P. (2020). Rational Use of High-Strength
Concrete in Flat Slab-Column Connections under Seismic Loading. Structural Journal, 117(6), 297-
310.
ABSTRACT
High Strength Concrete (HSC) slab–column connections with relatively low concrete strengths
compared to today’s capabilities have been tested under seismic-type loading in the past. Herein,
the hybrid use of HSC with compressive strength around 120 MPa and Normal Strength Concrete
(NSC) is investigated through three reversed horizontal cyclic loading tests with different
geometries of the HSC region and a reference NSC specimen. The results show that HSC applied in
the vicinity of the column can significantly enhance the seismic performance of slab–column
connections. The best result in terms of drift capacity and economic use of HSC was achieved in the
case of full-depth HSC extended from the column’s face up to 2.5 times the effective depth. Drift
ratios up to 3.0% were achieved. A comparison with previous tests showed that the hybrid use of
HSC and NSC can achieve similar results to the provision of punching shear reinforcement.
Keywords: high strength concrete; punching; flat slab; cyclic loading; slab–column connection;
hybrid; flat plate; seismic loading;

2
INTRODUCTION
Flat slabs are widespread in buildings all over the world, including in seismic areas. Given their
abundance, developing solutions for an improved performance of flat slab–column connections
under gravity and seismic loading is of great interest. It has been shown that one of the most
efficient methods to enhance the punching shear capacity under gravity loading and the deformation
capacity under horizontal loading is the provision of punching shear reinforcement 1–6. Besides the
provision of punching shear reinforcement, successful attempts to use HSC as an alternative to
enhance the punching shear strength of flat slabs under gravity loading have also been reported in
the literature 7–9. Since the use of HSC is less labor intensive than installing punching shear
reinforcement, this solution can become an attractive alternative even for seismic loading conditions
if proven satisfactory.
A relatively small number of specimens with HSC have been tested under combined vertical and
seismic-type horizontal loading in the past 10–12. Emam et al 10 and Marzouk et al 11 reported tests on
specimens that had the same overall geometry and test setup, representing the hogging moment
region of isolated slab–column connections. These specimens were square, with a side dimension
1900 mm. The column’s cross section was square, with side dimension equal to 250 mm.
An enhancement of the behavior of specimens with HSC in Emam et al 10 was observed compared
to similar specimens with normal strength concrete. The enhancement was observed in terms of
deformation capacity (and ductility) as well as strength. During the tests, the specimens with HSC
were less cracked and the crack openings were smaller compared to the normal strength specimens.
The tests of Marzouk et al 11 indicated that high strength lightweight concrete can also be effective
in enhancing the ductility and strength of slab–column connections. Specimens with HSC
performed better, in that they reached a higher strength and deformation capacity compared to
normal strength and normal strength lightweight concrete specimens. The enhancement in drift
capacity was relatively small compared to lightweight normal strength specimens.

3
Seismic-type loading tests on HSC specimens were also reported in Smadi and Yasin 12, in which
the tests were conducted using a test setup and geometry (slab thickness, column dimensions etc.)
very similar to that of Marzouk et al 10,11, but with smaller overall dimensions (1500 mm square
side). The comparison of a HSC specimen with a similar one but with NSC revealed that the
ultimate rotation of the HSC specimen was significantly increased (by nearly 62%). Furthermore,
the failure mode changed from flexure-punching in the specimen with NSC to flexure in the
specimen with HSC.
The compressive concrete strength of the specimens tested under seismic-type loading conditions in
the aforementioned publications 10–12 was around 70 MPa. It is important to notice that such values
of concrete strength are significantly lower than what can be achieved nowadays by the concrete
industry 13. This is a natural consequence of the advancements in concrete production technology,
which have led to an ever-increasing threshold for the designation of concrete as “high strength”.
With the increase of concrete strength, however, its cost is also increased. Under these
circumstances, the purpose of this paper is to study the seismic behavior of hybrid slab–column
connections (i.e., with both HSC and NSC) and, starting from the promising results obtained by
Inácio 14 under vertical loading conditions, to test various configurations aiming at an
economization of use of HSC for seismic loading applications. To this end, the reversed horizontal
cyclic loading tests of three specimens with HSC and a reference specimen with NSC are described
and analyzed in detail in this paper.
For the purposes of this paper, HSC is considered a concrete without fibers (steel or any other type)
into the mix. The alternative, fiber-reinforced concrete (FRC) has been used in the past to enhance
the behavior of flat slab–column connections under seismic loading 12,15,16.
RESEARCH SIGNIFICANCE
Slab–column connections under seismic-type loading with HSC with compressive strength around
70 MPa have been tested in the past and promising results have been obtained. To the best of the

4
authors’ knowledge, however, the seismic behavior of slab–column connections with concrete
compressive strength around 120 MPa (which is achievable nowadays) has not been previously
studied experimentally. Furthermore, the economization of use of HSC is investigated in this paper
for the first time for seismic-type loading, based on the promising results obtained in the past for
gravity loading.
EXPERIMENTAL INVESTIGATION
Overview
The experimental campaign conducted at NOVA School of Science and Technology, Universidade
Nova de Lisboa (FCT/UNL) consisted in the combined vertical and reversed horizontal cyclic
loading of three flat slab specimens with HSC in the vicinity of the column. Specimen C-50,
reported in Almeida et al 17, is used in this paper as a reference specimen. Compared to the
specimens with HSC, specimen C-50 had the same nominal geometry, reinforcement and loading
conditions, but it was made entirely of NSC. The three specimens with HSC are named CHSC1,
CHSC2 and CHSC3. All four specimens (i.e., including the reference specimen C-50) had overall
dimensions 4.15 m × 1.85 m and a thickness of 150 mm.
A steel HEM120 column, designed to remain elastic throughout the test, was used for convenience.
The column’s base plate was square with side dimension equal to 250 mm. The total height of the
column (from below to above the slab) was 2 m (1 m above and below the slab). As such, the
specimens represent a roughly 2/3 scaled model of a real structure.
For all the specimens, the main flexural reinforcement consisted in Ø12 top bars spaced at 100 mm
in the vicinity of the column and 200 mm elsewhere (Fig. 1), resulting in a top flexural
reinforcement ratio of 1%. Uniformly spaced (at 100 mm) Ø10 bottom bars were used (Fig. 1). Two
bottom bars in each direction passed through the column’s core, thus serving as integrity
reinforcement that prevents the slab from falling on the laboratory floor in case of a punching shear
failure.

5
HSC was applied only to a limited region near the column to rationalize its use, as illustrated in Fig.
2. In specimen CHSC1, the HSC was applied only to a 700 mm side square and only to the bottom
50 mm of the slab. The idea of using the HSC only in a thin layer at the bottom of the slab arose
from the works of Kotsovos and Kotsovos18, Faria et al 19 and Mamede et al 20, in which it was
suggested that the compressive strength is more relevant in increasing the punching capacity than
the concrete tensile strength for vertical loading conditions. Later, Inácio 14 showed experimentally
that for slabs subjected to monotonic vertical loading, the use of HSC only in a thin layer at the
bottom of the slab provides almost the same punching strength as a slab entirely made of HSC.
In specimen CHSC2, HSC was used for the entire thickness of the slab in a square region with side
dimension 1150 mm. The full thickness of the slab was filled with HSC in specimen CHSC3 as
well, but the region with enhanced concrete properties was chosen smaller than in CHSC2 (850 mm
square side). The main experimental variable between these three hybrid specimens was the
geometry of the region with HSC.
The specimens were produced in a precast concrete facility to ensure high quality control. To ensure
the desired geometry of the HSC region in accordance with Fig. 2, a galvanized hexagonal steel net
was used as a formwork for the HSC, as shown in Fig. 3. The region with HSC was cast first. Soon
after, the NSC part was cast. The adopted construction method proved successful in providing a
finished product with monolithic connection between the two different concretes and with minimal
deviations from the intended geometry.
Materials
Portland cement type CEM I 52.5R was used to produce the HSC while the NSC was produced
with Portland cement CEM II/B-L 32.5N. Silica fume, in a quantity equal to 10% of the cement
weight, was added to increase the mechanical proprieties of the HSC, as suggested in the literature
21–24. For NSC, the water cement ratio was set equal to 58% while in the HSC it was kept equal to
28%. In the HSC, superplasticizer was also added to improve the workability. For the NSC, crushed
coarse limestone aggregate with fine sand were used, while crushed coarse basalt aggregates with
6
medium and fine sand were adopted for HSC. The maximum aggregate size was 13.9 mm for the
HSC and 13.2 for the NSC.
The concrete compressive (fc) and tensile splitting (fct,sp) strengths were determined on cylinders
150 × 300 mm, according to EN 12390-3 25 and EN 12390-6 26 respectively. The concrete modulus
of elasticity (Ec) was also determined on cylinders according to EN 12390-13 27. Characteristics of
concrete are listed in Table 1. The tests were performed on specimens of the same age as the
respective slab.
Reinforcing steel properties were determined according to EN 10002-1 28 by performing direct
tensile tests on bar samples. Characteristics of steel reinforcement are listed in Table 2, in which fy
is the yield stress, εy is the yield strain and Es is the modulus of elasticity of steel.
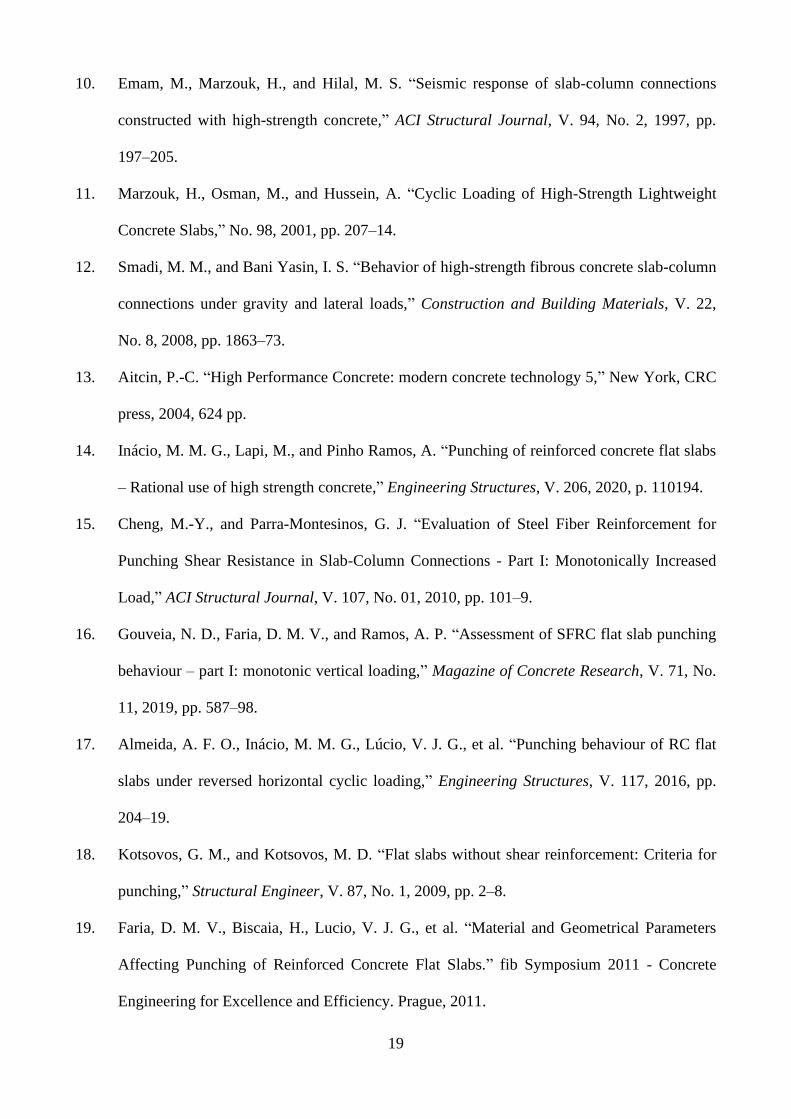
Test setup and loading protocol
The specimens were tested using the test setup developed at FCT/UNL, which is described in detail
in Almeida et al 17. The edges perpendicular to the direction of loading (the short edges) of the
specimens tested in this setup represent mid-span lines of a continuous flat slab frame. To ensure
conditions representative of mid-span lines, the test setup allows vertical displacements at the
opposite short edges and it ensures equal magnitude shear forces, bending moments and rotations at
these edges. Furthermore, the setup ensures mobility of the line of inflection location along the
longitudinal direction during horizontal cyclic loading. For vertical loads, the shear forces and
rotations at the opposite short edges are zero and the vertical displacements and the bending
moments are the same. For horizontal actions, the vertical displacements and shear forces are equal
in magnitude, but with opposite signs. The test setup marks a distinction with test setups commonly
used in the past, typically representing only the hogging moment region of the slab, because it
enables realistic conditions with the possibility of redistribution of internal forces. The test setup is
seen in action under horizontal loading conditions in Fig. 4a, b. A general view is given in Fig. 4d
and photos of the setup are shown in Fig. 5.

7
To guarantee equal shear forces and vertical displacements, a passive mechanical see-saw-like
system is used (Fig. 4a), allowing vertical displacements under gravity loading (Fig. 4c). When
horizontal displacements take place, the system reacts by applying shear forces at the short edges to
prevent the slab’s rigid body rotation. The balance system ensures that those forces are equal in
magnitude and opposite in direction. As the slab stiffness degrades, deformation due to the constant
vertical load increases. This ensures that the vertical load is driven to the column only 29.
To have positive bending moments at slab’s mid-span and equal rotations at the opposite edges, a
system consisting in a horizontal double pinned strut and two vertical elements is used (Fig. 4b).
For vertical loads, a positive moment of equal magnitude is introduced at both short edges (refer to
Fig. 4c). For horizontal action, the slab rotations are forced to be the same at the opposite edges.
The vertical load is applied through steel plates to the top slab surface in eight points to better
approximate a uniformly distributed load. It is intended to be kept constant throughout the
horizontal cyclic loading phase. To this end, a system of spreader beams and steel tendons as shown
in Fig. 4d is used. This system follows the slab horizontal deformations, therefore ensuring constant
gravity loads throughout the entire test. The load is applied using four hydraulic jacks connected to
a Load Maintainer machine.
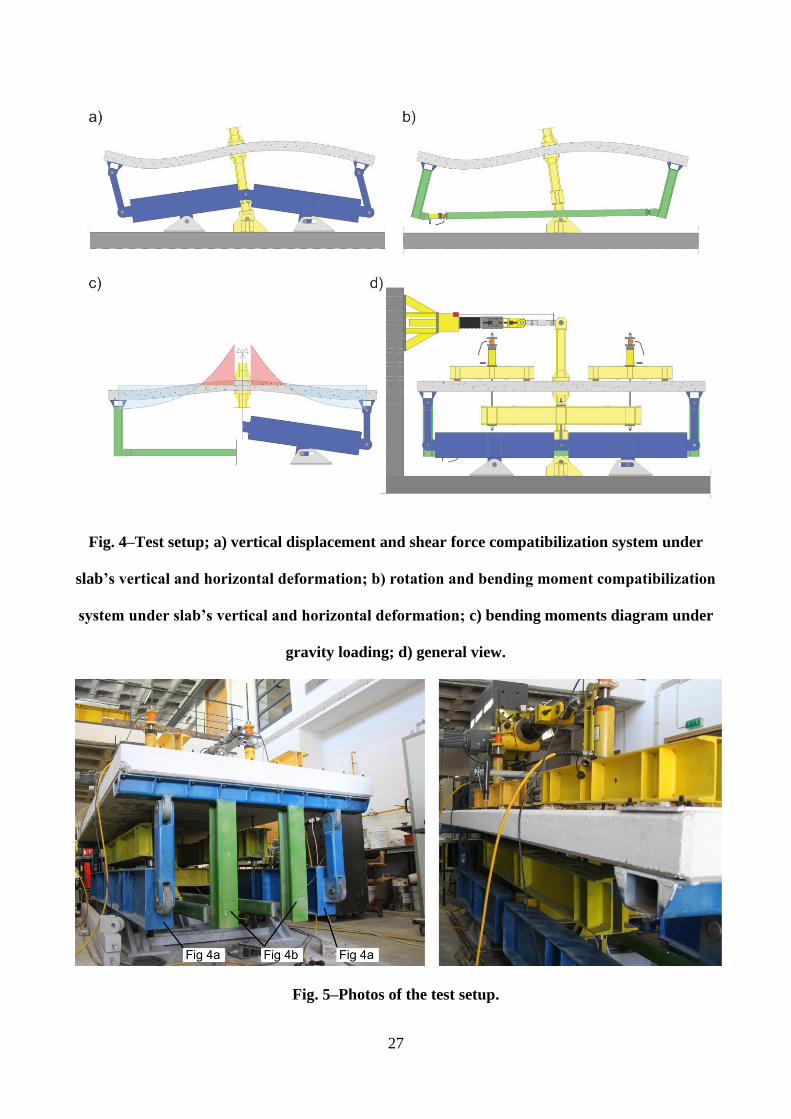
The loading protocol consisted in the application of the gravity load followed by imposed reversed
horizontal drifts as illustrated in Fig. 6. The gravity load was kept constant during the application of
the drifts. The concentric punching shear resistance of the specimens as if they were made entirely
of NSC, V0, was used as a reference value to determine the magnitude of gravity loads applied in
each specimen. The resistance V0 was calculated in accordance with Eurocode 2 30, with the
expression and results summarized in Table 3. In the calculation of V0, u0 is the perimeter of the
control section located at 2d from the face of the column, d is the effective depth, k = 1+ √(200/d) ≤
2.0, fc is the concrete strength and ρl is the geometric mean of the flexural reinforcement ratios in
the two main directions. The average effective depth d was measured before casting and the values
are presented in Table 3.

8
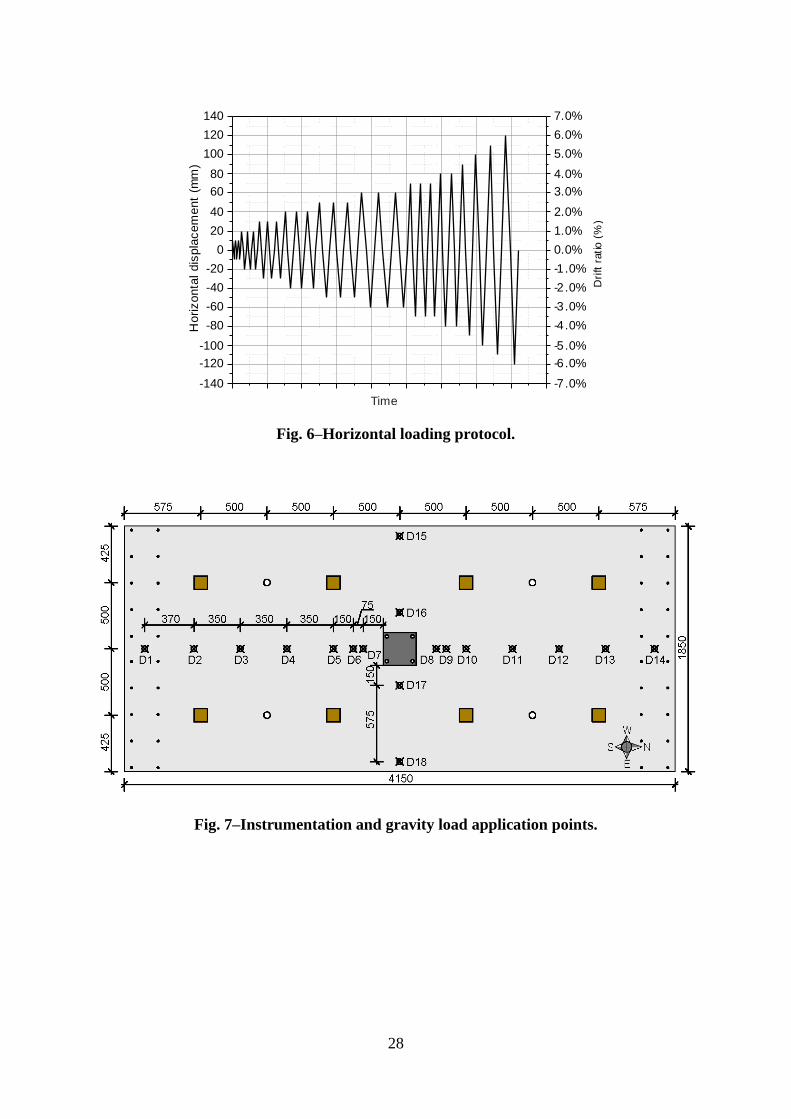
Instrumentation
Eighteen displacement transducers distributed along the two main axes of the specimen were
installed to record deflections during the test, as indicated in Fig. 7. Another displacement
transducer was installed at the level of the actuator to measure the horizontal displacements at the
top of the column (drift ratios can be calculated by dividing this horizontal displacement by the total
length of the column, 2 m).
Fig. 7 shows also the points in which the gravity load was applied. For each pair of gravity load
application points (for each spreader beam), a load cell measured the applied load at all times. The
actuator was also equipped with a load cell measuring the horizontal force. The unbalanced moment
acting on the slab–column connection can be obtained by multiplying the measured force with the
total length of the column.
In top bars, strain gauges were installed near the column, in eight locations in four bars, as shown in
Fig. 8 (refer also to Fig. 1 for orientation). In each measuring location, two strain gauges were
installed in diametrically opposed points.
EXPERIMENTAL RESULTS
Cracking and failure modes
The behavior of all the specimens was comparable during the gravity loading phase. Cracks parallel
to the faces of the column appeared first close to the column on the top surface of the slab, followed
by new parallel cracks further away from the column and radial cracks for higher levels of the
gravity load. The radial cracks reached the zero moments line (i.e., edges of the specimen in the
East-West direction, Fig. 1). Flexural cracks were also detected on the bottom surface at the sagging
moment region of the specimens (at simulated mid-spans).
The first horizontal cycles were characterized by comparable cracking patterns and developments
for all the specimens. It was noticed, however, that in specimens CHSC2 and CHSC3, cracks
initially extended more than in CHSC1.
9
With the increase of drifts, the existing cracks grew in length and opening. The first to deviate from
the group was specimen C-50 17, which failed in a brittle punching shear mode in the second cycle
with a target horizontal drift equal to 1.0%. In the following target drift level (1.5%), specimen
CHSC1 failed in punching after completing two cycles. The other specimens (CHSC2 and CHSC3)
continued to sustain higher drift ratios with a comparable behavior. For higher drifts, these two
specimens were fully cracked, and hogging moment cracks met with the sagging moment cracks.
Cracks opened and closed as a function of the direction of the applied drift in accordance with Fig.
6. The specimens CHSC2 and CHSC3 ultimately failed in punching, with a maximum sustained
horizontal drift of 3.0%.
For all the specimens, punching failure was sudden and with little notice, except for an observed
intrusion of the lower steel column stub into the slab in specimens that survived large drifts.
Nonetheless, the provided integrity reinforcement was sufficient to prevent the slab from falling on
the laboratory’s strong floor after punching, while continuing to carry the applied gravity load.
Saw-cuts of the specimens along the longitudinal (North–South) direction are shown in Fig. 9. For
each specimen, a complete view and a zoomed-in view in the region near the column is provided.
North side is on the right of the figure for all the specimens. Fig. 9 shows that the punching shear
failure cone is not perfectly symmetric. However, a typical punching shear failure surface is
observed in all the specimens. Due to the higher horizontal drift ratios at failure, the saw-cuts of
specimens with HSC through the entire thickness (CHSC2 and CHSC3) reveal a higher level of
damage and significantly open flexural cracks.
Force—displacement relationship
The force—displacement relationship curves are presented in Fig. 10. Compared to the reference
specimen (C-50 17), all the specimens with HSC exhibited an improved behavior. The reference
specimen survived target drift ratios of only 1.0%. The application of HSC in a thin layer only at the
bottom part of the slab in specimen CHSC1 led to an increased ultimate drift, equal to 1.5% (Fig.

10
10b). However, the capacity enhancement was more pronounced when the entire depth of the slab
was cast with HSC, as in case of specimens CHSC2 and CHSC3 (Fig. 10c, d).
Fig. 10 indicates that the maximum unbalanced moment transfer capacity (governed by flexure) of
the slab–column connections was reached in specimens CHSC2 and CHSC3, in which drifts from
2.0% to 3.0% were characterized by a small variation of the horizontal load. On the contrary, failure
occurred in specimens C-50 and CHSC1 while the horizontal load was still exhibiting an increasing
trend.
Table 4 summarizes the main experimental results, including the maximum horizontal force,
(Hmax), horizontal displacement at maximum force (Δm) as well as the ultimate drifts (dr,u). Table 4
confirms that specimens CHSC2 and CHSC3 indeed behaved very similarly, with comparable
maximum loads, displacements for maximum load and ultimate drift capacity. Referring to the
extent of the zone with HSC (refer to Fig. 2), the results indicate that the geometry used in CHSC3
is sufficient, because increasing the region cast with HSC in CHSC2 did not lead to any notable
improvement.
A further comparison of the specimens can be made by referring to Fig. 11, which shows that the
initial stiffness of all the specimens was comparable. Specimen CHSC1 continued to closely follow
the group of specimens with HSC but failed earlier than the other two. The plastic region of the
enveloping curves (i.e., for drift larger than around 2.0%) was similar for both specimen CHSC2
and CHSC3, but the horizontal load was slightly lower in the former.
Although the solution with HSC applied over a limited depth of the specimen exhibited good
performance under gravity loading 14, the same cannot be said for seismic-type loading. Specimen
CHSC1 that had HSC only in the bottom 50 mm did not exhaust the entire unbalanced moment
transfer capacity and failed before reaching the horizontal plateau observed in the other two
specimens with HSC. A likely explanation for this observed behavior is that cyclic loading enforces
sign reversal of the moment acting in the slab–column connection, resulting in the presence of
11
alternated tensile and compressive local stresses in the upper layers of the slab that render the
application of HSC on only the bottom part insufficient.
Equivalent viscous damping
Based on the force—displacement relationships for each specimen (Fig. 10), an equivalent viscous
damping ratio, ξeq, is calculated for each complete cycle as follows 31:
1 2
1 2
1
4
d deq
S S
E E
E E
= +
(1)
where Ed is the dissipated energy (area enclosed by the hysteresis loop) and ES is the elastic strain
energy (considering secant stiffness up to the maximum drift for each cycle), with the subscript 1
referring to positive cycles and subscript 2 for negative cycles. The results are plotted in Fig. 12.
Fig. 12 shows that there is a tendency to have increasing ξeq with the increment of drifts. This is a
natural consequence of the increase of damage in the specimens with the increment of drifts.
Referring to cycles with the same target drift, it is noticed that the first cycle is the one with a higher
equivalent viscous damping. This indicates that the majority of damage can be attributed to the
magnitude of the drift rather than to the number of repetitions of low-drift cycles. Comparing the
specimens in Fig. 12, it is concluded that the differences are relatively small from specimen to
specimen up to failure.
Strength and stiffness degradation
Strength degradation due to repeated cyclic loading can be observed in the envelope curves of Fig.
11 as well as the force – displacement curves of Fig. 10. The vertical drops in Fig. 11 represent
strength degradation due to repeated loading. The last drop represents failure. The strength
degradation increased progressively with the increase of the drifts. For the specimens that reached a
horizontal plateau in the force – displacement relationship (i.e. specimens CHSC2 and CHSC3), the
degradation of strength from the first to the third cycle within the same target drift was
approximately 10% after global yielding. For lower drifts the in-cycle degradation was lower, and
comparable with that of the other two specimens (C-50 and CHSC1) for the respective drifts.
12
Fig. 13 shows the secant stiffness of all the specimens as a function of the target drift ratio. Two
types of degradations can be distinguished in the figure: a degradation with the increase of the drifts
and a degradation for repeated loading, marked by the steps in the graph. At target drift ratio equal
to 1.0%, the reference specimen started to deviate from the other specimens, as already observed
from Fig. 11. This is also reflected in the secant stiffness in Fig. 13, where the values for C-50 are
lower than those for the specimens with HSC at 1% drift. The evolution of stiffness with the
increase of drifts was almost identical in the two specimens with HSC over the entire depth
(CHSC2 and CHSC3), even though the extent of the HSC region was different. Note that the graphs
are slightly shifted along the horizontal axis to improve readability.
Deflections
Deflection profiles were extracted from the readings of the displacement transducers installed on
top of the specimen (Fig. 7). The results for the longitudinal direction are shown in Fig. 14 for an
application of the horizontal load directed towards South. The figures are similar (symmetrical) for
a reversed direction of loading. The deflection profiles in Fig. 14 correspond to peak drifts of the
loading history of Fig. 6. For each target drift level, only the results for the first and third cycle are
shown.
Fig. 14 demonstrates that the deflections after the application of the gravity load were comparable
in all specimens. The application of horizontal drifts led to an increase of the deflections due to the
degradation of the stiffness of the slab. Comparable deflections for the same drift were observed in
all the specimens regardless of the geometry of the HSC region. The differences became apparent
only for large drifts, where CHSC3 deformed slightly more than CHSC2. Referring to the deflection
profiles corresponding to the same target drift ratio, it is observed that cycle repetitions caused an
increase of deflections. This increase of deflections shows the detrimental effect of lateral cyclic
loading on the bending stiffness of the slab.
The deflection profiles of Fig. 14 indicate also that the test setup worked as intended. It ensured
equal deflections and rotations at mid-span locations and it provided the conditions of a continuous

13
flat slab, i.e., with both hogging and sagging bending moment regions. To further analyze the
deflection profiles, the location of the inflection point throughout the test was estimated by fitting
the displacement transducer data into polynomial functions. The results are presented in Fig. 15,
where it is noticed that the inflection point was not fixed throughout the horizontal cyclic loading
test. At the end of the gravity loading phase it was close to the theoretical value of 22% of the span
(actual values in Fig. 15 are slightly larger, around 25% of the span). The location of the inflection
point follows the direction of the applied horizontal drifts. For the two specimens that reached high
drift ratios (CHSC2 and CHSC3), the inflection point reached the column, indicating the presence
of sagging bending moments in the slab in the vicinity of the column. When the inflection point
shifts towards mid-span, it does not surpass 28% of the span.
Longitudinal reinforcement strains
For strain gauge readings of specimen C-50, the reader is referred to Almeida et al 17, where it was
shown that the bar closest to the column started to yield for relatively low drifts, whereas the strain
in the other instrumented bars was well below yielding limit when punching shear failure occurred.
For the specimens with HSC, the strain gauge readings are presented in Fig. 16. The strains in Fig.
16 are shown only for the first excursion in each drift level of the loading history of Fig. 6. Also,
strains in Fig. 16 are shown only for the side of the slab under hogging moments due to the imposed
unbalanced moment. Strains on the symmetrical locations were always lower than the ones shown
in the figure. The strain values in Fig. 16 are obtained as the average of the two readings from the
strain gauges installed in each measurement location (Fig. 8). The measurement locations are
referenced in Fig. 16 using B (which stands for “bar”) followed by the bar number (counting starts
from the center of the slab) and the side on which the strain gauges are installed (N or S). For
example, location B5N refers to strain gauges installed on the north side of the slab at the fifth bar,
i.e. strain gauges 11 and 12 in Fig. 8.
No yielding was detected during the gravity loading phase. The magnitude of strains at the end of
gravity loading phase does not appear to be related to the geometry of the HSC region. In specimen

14
CHSC3, the strain in the bar closest to the column was close to yielding. Fig. 16 shows that strains
increase with the increase of lateral drifts, with bars closer to the column having higher strains.
Strain distribution becomes non-symmetrical for horizontal loading due to the acting unbalanced
moment in the slab–column connection. In specimens CHSC1 and CHSC3, yielding was detected in
all instrumented bars. In specimen CHSC2, yielding was detected in the bar closest to the column
but for the rest of the bars the strain gauges stopped working before recording yielding strains.
Given the similar behavior of CHSC2 with CHSC3, it is reasonable to expect that yielding of all the
instrumented bars has occurred in CHSC2 as well. The results are generally in agreement with
observations from the load – displacement curves (Fig. 10).
COMPARISON OF USING HSC WITH OTHER SEISMIC PERFORMANCE
ENHANCEMENT TECHNIQUES
A series of experiments conducted using the test setup of Fig. 4 have been published recently.
Gouveia et al 32 reported four reversed horizontal cyclic loading tests of specimens with steel fiber-
reinforced concrete (SFRC) in the vicinity of the column. The specimens differed by the fiber
content and type. Isufi et al 4 reported the tests conducted on five specimens, four of which
contained headed shear stud reinforcement. The main variables in Isufi et al 4 were the extent of the
shear-reinforced zone and the magnitude of the gravity load. Almeida et al 5 described the tests
conducted on four specimens with stirrups, with varying amount of punching shear reinforcement
and varying extent of the shear-reinforced zone. Post-installed bolts were tested as a strengthening
solution in Almeida et al 6.
Besides being tested on the same test setup, all the aforementioned specimens had the same nominal
geometry as well as flexural reinforcement. Furthermore, many of the specimens had comparable
applied vertical loads. Table 5 summarizes the main characteristics of a subset of such specimens,
chosen on the basis of the magnitude of the applied vertical load. The table contains the name of the
specimen, the method used to enhance its performance, the extent of the zone in which the

15
enhancement method is applied, the vertical load Vg, the maximum unbalanced moment Mmax and
the ultimate drift dr,u. Besides the small differences from specimen to specimen in the applied load,
Vg, the ratio between Vg and the concentric punching shear resistance V0 was approximately the
same for all the specimens presented in the table (Vg/V0 about 50%). As a consequence, concrete
strengths of specimens with approximately the same Vg were close to each other.
Table 5 shows that the performance of the specimens with HSC in the entire depth (specimens
CHSC2 and CHSC3) was comparable with that of similar specimens with conventional punching
shear reinforcement in terms of maximum unbalanced moment and ultimate drift ratio. For instance,
comparing CHSC2 with C-50 STR3 with stirrups, it is noticed that the ultimate drift capacity of
these two specimens with almost the same value of Vg was the same. C-50 STR3 had a low amount
of punching shear reinforcement. Other similar specimens, but with a higher amount of punching
shear reinforcement resisted higher drifts (C-SSR3 with studs and C-50 STR4 with stirrups).
Specimen CHSC3, which had a higher Vg compared to CHSC2, can be compared to C-SSR5b with
studs and C-50 STR1 and C-50 STR2 with stirrups. The same observation is made: the drift
capacity of the HSC specimen was comparable with that of a specimen with a low amount of
punching shear reinforcement (in this case, the drift capacity of CHSC3 was slightly higher than
that of the comparable specimen with a low amount of punching shear reinforcement, C-50 STR1).
Again, when the amount of punching shear reinforcement is increased, the drift capacity of the
shear-reinforced specimens exceeds that of the HSC specimen, or it is the same as in case of C-50
STR2. Nonetheless, in both cases (CHSC2 and CHSC3), the unbalanced moment transfer capacity
(Mmax) of the slab–column connection was comparable with the other specimens of Table 5 that
reached a horizontal plateau in the force--displacement relationship. In seismic loading conditions,
this indicates that the use of HSC in a limited region near the column has the advantage of
increasing the punching shear capacity without significantly modifying the flexural behavior of the
slab–column connection. The result is a ductile behavior similar to what is achieved by employing a
sufficient amount of punching shear reinforcement.

16
Comparing the HSC specimens with SFRC ones in Table 5, it is noticed that higher drift capacities
were achieved in the specimens with SFRC, except for the case of the specimen with the lowest
amount of fibers, F0.5_4D, in which the ultimate drift capacity was the same (3.0%). Table 5
shows also that the maximum unbalanced moment is higher in specimens with a higher amount of
fibers compared to all the other specimens, including those with HSC.
CONCLUSIONS
An experimental program consisting in the reversed horizontal cyclic loading test of three
specimens with HSC applied in the vicinity of the column was presented in this paper. The only
experimental variable was the geometry of the HSC region, aiming at economically feasible
solutions for practical use. The main conclusions are listed below:
- The performance of the specimens with HSC in the vicinity of the column was enhanced
compared to the reference specimen (made entirely of NSC). The drift capacity of the
specimens with HSC was increased 1.5 to 3.0 times compared to the reference specimen.
- Although very promising results were obtained in a previous experimental program during
the concentric monotonic test of a specimen with HSC applied only in the bottom 50 mm of
the slab in the vicinity of the column, the behavior of a similar specimen (CHSC1) under
horizontal loading was not nearly as satisfactory. The ultimate drift was increased (from
1.0% in the reference specimen to 1.5% in CHSC1), but the other specimens with a full
depth HSC region performed significantly better. The likely explanation for the small
increase in the drift capacity compared to the reference specimen is sign reversal of stresses
during cyclic loading. An economization of the HSC material by applying it in a limited
depth of the slab is therefore not recommended for seismic loading conditions until further
verification.
- Specimens with a full depth HSC region were able to exhaust the full unbalanced moment
transfer capacity of the slab–column connection, leading to a significantly improved

17
behavior (drifts up to 3.0%) and a more ductile response compared to the reference
specimen and specimen CHSC1.
- The behavior of the two specimens with a full depth HSC region but with different size
(CHSC2 and CHSC3) was very similar in all aspects (strength, deformation capacity, energy
dissipation etc.). This indicates that an economization of the HSC material can be sought in
terms of limiting the size in plan of the HSC region. The smaller region applied in CHSC3
was sufficient in providing a more ductile behavior and a significant drift capacity
enhancement compared to the reference specimen.
- Comparing the behavior of the HSC specimens presented in this paper with previously
published specimens with SFRC, studs and stirrups, it was shown that the application of
HSC in the flat slab in the vicinity of the column can have similar effects to the application
of conventional punching shear reinforcement or low amounts of fibers into SFRC.
Further research on the seismic behavior of slab – column connections with HSC is recommended.
The presented tests can form the basis for further experimental tests and numerical analyses aiming
at the development of analytical procedures applicable to general cases. Issues to be addressed
include the influence of slab thickness, gravity load and flexural reinforcement ratio in the optimum
geometry of the HSC region.
ACKNOWLEDGEMENTS
This work received support from the Fundação para a Ciência e Tecnologia – Ministério da Ciência,
Tecnologia e Ensino Superior through projects EXPL/ECM – EST/1371/2013 and PTDC/ECI-EST/
30511/2017 and scholarship number SFRH/BD/76242/2011. The authors are grateful to Concremat
for making the specimens, CIMPOR for providing the cement and Sika for providing
VISCOCRETE 20HE and SIKACRETE HD.

18
REFERENCES
1. Broms, C. E. “Flat Plates in Seismic Areas: Comparison of Shear Reinforcement Systems,”
ACI Structural Journal, V. 104, No. 6, 2007, pp. 712–21.
2. Lips, S., Ruiz, M. F., and Muttoni, A. “Experimental Investigation on Punching Strength and
Deformation Capacity of Shear-Reinforced Slabs,” ACI Structural Journal, V. 109, No. 6,
2012, pp. 889–900.
3. Ferreira, M. P., Melo, G. S., Regan, P. E., et al. “Punching of reinforced concrete flat slabs
with double-headed shear reinforcement,” ACI Structural Journal, V. 111, No. 2, 2014, pp.
363–74.
4. Isufi, B., Pinho Ramos, A., and Lúcio, V. “Reversed horizontal cyclic loading tests of flat
slab specimens with studs as shear reinforcement,” Structural Concrete, V. 20, No. 1, 2019,
pp. 330–47.
5. Almeida, A. F. O., Alcobia, B., Ornelas, M., et al. “Behaviour of reinforced-concrete flat
slabs with stirrups under reversed horizontal cyclic loading,” Magazine of Concrete
Research, V. 72, No. 7, 2020, pp. 339–56.
6. Almeida, A. F. O., Ramos, A. P., Lúcio, V., et al. “Behavior of RC flat slabs with shear bolts
under reversed horizontal cyclic loading,” Structural Concrete, V. 21, No. 2, 2020, pp. 501–
16.
7. Marzouk, H., and Hussein, A. “Experimental investigation on the behaviour of high-strength
concrete slabs,” ACI Structural Journal, No. September-october, 1991, pp. 701–13.
8. Ozden, S., Ersoy, U., and Ozturan, T. “Punching shear tests of normal- and high-strength
concrete flat plates,” Canadian Journal of Civil Engineering, V. 33, No. 11, 2006, pp. 1389–
400.
9. Inácio, M. M. G., Almeida, A. F. O., Faria, D. M. V., et al. “Punching of high strength
concrete flat slabs without shear reinforcement,” Engineering Structures, V. 103, 2015, pp.
275–84.
19
10. Emam, M., Marzouk, H., and Hilal, M. S. “Seismic response of slab-column connections
constructed with high-strength concrete,” ACI Structural Journal, V. 94, No. 2, 1997, pp.
197–205.
11. Marzouk, H., Osman, M., and Hussein, A. “Cyclic Loading of High-Strength Lightweight
Concrete Slabs,” No. 98, 2001, pp. 207–14.
12. Smadi, M. M., and Bani Yasin, I. S. “Behavior of high-strength fibrous concrete slab-column
connections under gravity and lateral loads,” Construction and Building Materials, V. 22,
No. 8, 2008, pp. 1863–73.
13. Aitcin, P.-C. “High Performance Concrete: modern concrete technology 5,” New York, CRC
press, 2004, 624 pp.
14. Inácio, M. M. G., Lapi, M., and Pinho Ramos, A. “Punching of reinforced concrete flat slabs
– Rational use of high strength concrete,” Engineering Structures, V. 206, 2020, p. 110194.
15. Cheng, M.-Y., and Parra-Montesinos, G. J. “Evaluation of Steel Fiber Reinforcement for
Punching Shear Resistance in Slab-Column Connections - Part I: Monotonically Increased
Load,” ACI Structural Journal, V. 107, No. 01, 2010, pp. 101–9.
16. Gouveia, N. D., Faria, D. M. V., and Ramos, A. P. “Assessment of SFRC flat slab punching
behaviour – part I: monotonic vertical loading,” Magazine of Concrete Research, V. 71, No.
11, 2019, pp. 587–98.
17. Almeida, A. F. O., Inácio, M. M. G., Lúcio, V. J. G., et al. “Punching behaviour of RC flat
slabs under reversed horizontal cyclic loading,” Engineering Structures, V. 117, 2016, pp.
204–19.
18. Kotsovos, G. M., and Kotsovos, M. D. “Flat slabs without shear reinforcement: Criteria for
punching,” Structural Engineer, V. 87, No. 1, 2009, pp. 2–8.
19. Faria, D. M. V., Biscaia, H., Lucio, V. J. G., et al. “Material and Geometrical Parameters
Affecting Punching of Reinforced Concrete Flat Slabs.” fib Symposium 2011 - Concrete
Engineering for Excellence and Efficiency. Prague, 2011.

20
20. Silva Mamede, N. F., Pinho Ramos, A., and Faria, D. M. V. “Experimental and parametric
3D nonlinear finite element analysis on punching of flat slabs with orthogonal
reinforcement,” Engineering Structures, V. 48, 2013, pp. 442–57.
21. Duval, R., and Kadri, E. H. “Influence of silica fume on the workability and the compressive
strength of high-performance concretes,” Cement and Concrete Research, V. 28, No. 4,
1998, pp. 533–47.
22. Igarashi, S. I., Watanabe, A., and Kawamura, M. “Evaluation of capillary pore size
characteristics in high-strength concrete at early ages,” Cement and Concrete Research, V.
35, No. 3, 2005, pp. 513–9.
23. Bhanja, S., and Sengupta, B. “Influence of silica fume on the tensile strength of concrete,”
Cement and Concrete Research, V. 35, No. 4, 2005, pp. 743–7.
24. Siddique, R. “Utilization of silica fume in concrete: Review of hardened properties,”
Resources, Conservation and Recycling, V. 55, No. 11, 2011, pp. 923–32.
25. CEN. “EN 12390-3 Testing hardened concrete Part 3: Compressive strength of test
specimens,” Bruxelles, 2001, 15 pp.
26. CEN. “EN 12390-6 Testing hardened concrete Part 6: Tensile splitting strength of test
specimens,” Bruxelles, 2000, 10 pp.
27. CEN. “EN 12390-13 Testing hardened concrete Part 13: Determination of secant modulus of
elasticity in compression,” Bruxelles, 2013, 16 pp.
28. CEN. “EN 10002-1 Metallic materials Tensile testing Part 1: method of test at ambient
temperature,” Bruxelles, 2001, 57 pp.
29. Ramos, A., Marreiros, R., Almeida, A., et al. “Punching of flat slabs under reversed
horizontal cyclic loading.” In: Ospina, C. E., Mitchell, D., Muttoni, A., eds. ACI Special
Publication, vol. 315. ACI, fib, 2017. pp. 253–72.
30. CEN. “EN 1992-1-1. Eurocode 2 — Design of concrete structures. Part 1-1: General rules
and rules for buildings,” 2004.

21
31. Hose, Y. D., and Seible, F. “Performance Evaluation Database for Concrete Bridge
Components and Systems under Simulated Seismic Loading. PEER Report No. 1999/11,”
San Diego, California, 1999, 114 pp.
32. Gouveia, N. D., Faria, D. M. V., and Ramos, A. P. “Assessment of SFRC flat slab punching
behaviour – part II: reversed horizontal cyclic loading,” Magazine of Concrete Research, V.
71, No. 1, 2019, pp. 26–42.

22
TABLES AND FIGURES
List of tables:
Table 1–Mechanical proprieties of concrete
Table 2–Mechanical proprieties of steel reinforcement
Table 3–Gravity load in each specimen
Table 4–Summary of main test results
Table 5–Summary of main characteristics of comparable specimens tested at FCT/UNL
List of figures:
Fig. 1–Overall geometry and reinforcement of the specimens (units: mm).
Fig. 2–Geometry of the HSC region in specimens (units: mm).
Fig. 3–Production of the specimens.
Fig. 4–Test setup; a) vertical displacement and shear force compatibilization system under slab’s
vertical and horizontal deformation; b) rotation and bending moment compatibilization system
under slab’s vertical and horizontal deformation; c) bending moments diagram under gravity
loading; d) general view.
Fig. 5–Photos of the test setup.
Fig. 6–Horizontal loading protocol.
Fig. 7–Instrumentation and gravity load application points.
Fig. 8–Instrumentation of top flexural reinforcement bars.
Fig. 9–Saw-cuts of the specimens.
Fig. 10–Force—displacement relationship for specimen: a) C-50; b) CHSC1; c) CHSC2 and d)
CHSC3.
Fig. 11–Envelope force—displacement curves for all specimens.
Fig. 12–Equivalent viscous damping; a) C-50; b) CHSC1; c) CHSC2; d) CHSC3.

23
Fig. 13–Stiffness degradation
Fig. 14–Deflection profiles in the longitudinal (North-South) direction.
Fig. 15–Location of the inflection point in the longitudinal direction of the specimens; a) C-50; b)
CHSC1; c) CHSC2; d) CHSC3.
Fig. 16–Strain gauge readings in the flexural reinforcement; a) CHSC1; b) CHSC2; c) CHSC3.
Table 1–Mechanical proprieties of concrete
Specimen
NSC HSC
fc (MPa) fct,sp (MPa) Ec (MPa) fc (MPa) fct,sp (MPa) Ec (MPa)
C50* 52.4 2.9 - - - -
CHSC1 61.6 4.1 35700 115.2 7.1 53700
CHSC2 45.9 3.5 37300 120.2 7.4 51400
CHSC3 48.9 -** 35300 123.6 8.2 52800
*Specimens investigated by Almeida et al. 17. ** Not available.
Table 2–Mechanical proprieties of steel reinforcement
Reinforcement
fy (MPa) εy (‰) Es (GPa)
Ø10 Ø12 Ø10 Ø12 Ø10 Ø12
535 526 2.7 2.6 198 200
Table 3–Gravity load in each specimen
Specimen d
(mm)
V0 = u0d 0.18k(100ρlfc)1/3
(kN)
Vg
(kN)
Vg/V0
(%)
C-50 17 118.4 391.0 203.4 52.0
CHSC1 118.1 411.3 221.6 53.9
CHSC2 117.5 370.5 199.7 53.9

24
CHSC3 118.4 382.1 212.9 55.7
Table 4–Summary of main test results
Specimen Vg (kN) Hmax (kN) Δm (mm) dr,u (%)
South North South North
C-50 17 203.4 37.4 -36.7 21.5 -20.0 1.0%
CHSC1 221.6 52.3 -49 30.3 -30.0 1.5%
CHSC2 199.7 55.8 -54.4 49.8 -50.0 3.0%
CHSC3 212.9 58.4 -56.7 49.9 -50.1 3.0%
Table 5–Summary of main characteristics of comparable specimens tested at FCT/UNL
Specimen Performance enhancement method Extent* Vg
(kN)
Mmax
(kNm)
dr,u
(%)
CHSC1 HSC, 1/3 of slab depth 1.9d 222 104.6 1.5
CHSC2 HSC, entire depth 3.8d 200 111.6 3.0
CHSC3 HSC, entire depth 2.5d 213 116.8 3.0
F0.5_4D 32 SFRC, 0.5% vol., type 4D 2.8d 196 119.0 3.0
F0.75_4D 32 SFRC, 0.75% vol., type 4D 2.8d 194 145.4 5.5
F1.0_4D 32 SFRC, 1.0% vol., type 4D 2.8d 208 133.3 >6.0
C-SSR3 4 Studs, 12Ø8 per perimeter 1.5d 196 120.8 4.0
C-SSR5b 4 Studs, 12Ø8 per perimeter 2.7d 214 117.8 5.5
C-50 STR1 5 Stirrups, 16Ø4.5 per perimeter 1.5d 210 99.0 2.5
C-50 STR2 5 Stirrups, 8Ø6+8Ø8 per perimeter 1.5d 216 104.0 3.0
C-50 STR3 5 Stirrups, 16Ø4.5 per perimeter 2.7d 202 118.6 3.0

25
C-50 STR4 5 Stirrups, 8Ø6+8Ø8 per perimeter 2.7d 196 116.8 4.0
* rounded value, measured from the face of the column
Fig. 1–Overall geometry and reinforcement of the specimens (units: mm).

26
Fig. 2–Geometry of the HSC region in specimens (units: mm).
Fig. 3–Production of the specimens.
27
Fig. 4–Test setup; a) vertical displacement and shear force compatibilization system under
slab’s vertical and horizontal deformation; b) rotation and bending moment compatibilization
system under slab’s vertical and horizontal deformation; c) bending moments diagram under
gravity loading; d) general view.
Fig. 5–Photos of the test setup.
28
-140
-120
-100
-80
-60
-40
-20
0
20
40
60
80
100
120
140
-7.0%
-6.0%
-5.0%
-4.0%
-3.0%
-2.0%
-1.0%
0.0%
1.0%
2.0%
3.0%
4.0%
5.0%
6.0%
7.0%
Dri
ft r
atio
(%
)
Horizo
nta
l dis
pla
cem
en
t (m
m)
Time
Fig. 6–Horizontal loading protocol.
Fig. 7–Instrumentation and gravity load application points.

29
Fig. 8–Instrumentation of top flexural reinforcement bars.
Fig. 9–Saw-cuts of the specimens.

30
-60
-40
-20
0
20
40
60
-80 -60 -40 -20 0 20 40 60 80-120
-80
-40
0
40
80
120-4.0 -3.0 -2.0 -1.0 0.0 1.0 2.0 3.0 4.0
Unba
lanced m
om
ent (k
Nm
)
Drift (%)H
ori
zonta
l fo
rce (
kN
)
Horizontal displacement (mm)
-60
-40
-20
0
20
40
60
-80 -60 -40 -20 0 20 40 60 80-120
-80
-40
0
40
80
120-4.0 -3.0 -2.0 -1.0 0.0 1.0 2.0 3.0 4.0
Unba
lanced m
om
ent (k
Nm
)
Drift (%)
Hori
zonta
l fo
rce (
kN
)
Horizontal displacement (mm) (a) (b)
-60
-40
-20
0
20
40
60
-80 -60 -40 -20 0 20 40 60 80-120
-80
-40
0
40
80
120-4.0 -3.0 -2.0 -1.0 0.0 1.0 2.0 3.0 4.0
U
nb
ala
nce
d m
om
en
t (k
Nm
)
Drift (%)
Ho
rizo
nta
l fo
rce
(kN
)
Horizontal displacement (mm)
-60
-40
-20
0
20
40
60
-80 -60 -40 -20 0 20 40 60 80-120
-80
-40
0
40
80
120-4.0 -3.0 -2.0 -1.0 0.0 1.0 2.0 3.0 4.0
U
nb
ala
nce
d m
om
en
t (k
Nm
)
Drift (%)
Ho
rizo
nta
l fo
rce
(kN
)
Horizontal displacement (mm) (c) (d)
Fig. 10–Force—displacement relationship for specimen: a) C-50; b) CHSC1; c) CHSC2 and d)
CHSC3.
-60
-40
-20
0
20
40
60
-80 -60 -40 -20 0 20 40 60 80-120
-80
-40
0
40
80
120-4.0 -3.0 -2.0 -1.0 0.0 1.0 2.0 3.0 4.0
C-50
CHSC1
CHSC2
CHSC3
Un
ba
lan
ce
d m
om
en
t (k
Nm
)
Drift (%)
Ho
rizo
nta
l fo
rce
(kN
)
Horizontal displacement (mm)
Fig. 11–Envelope force—displacement curves for all specimens.

31
0.0 0.5 1.0 1.5 2.0 2.5 3.0 3.50
5
10
15
20
1st cycle
2nd
cycle
3rd cycle
Vis
co
us d
am
pin
g (
%)
Drift (%)
0.0 0.5 1.0 1.5 2.0 2.5 3.0 3.50
5
10
15
20
1st cycle
2nd
cycle
3rd cycle
Vis
co
us d
am
pin
g (
%)
Drift (%)
(a) (b)
0.0 0.5 1.0 1.5 2.0 2.5 3.0 3.50
5
10
15
20
1st cycle
2nd
cycle
3rd cycle
Vis
co
us d
am
pin
g (
%)
Drift (%)
0.0 0.5 1.0 1.5 2.0 2.5 3.0 3.50
5
10
15
20
1st cycle
2nd
cycle
3rd cycle
Vis
co
us d
am
pin
g (
%)
Drift (%)
(c) (d)
Fig. 12–Equivalent viscous damping; a) C-50; b) CHSC1; c) CHSC2; d) CHSC3.
0.0 0.5 1.0 1.5 2.0 2.5 3.0 3.5 4.00
500
1000
1500
2000
2500
C-50
CHSC1
CHSC2
CHSC3
Se
ca
nt
stiff
ne
ss (
kN
/m)
Target drift ratio (%)
Fig. 13–Stiffness degradation

32
Fig. 14–Deflection profiles in the longitudinal (North-South) direction.

33
-0.50 -0.25 0.00 0.25 0.500
500
1000
1500
2000
2500
3000
Fraction of the span
Tim
e (
s)
1.0% drifts
0.5%
drifts
-0.50 -0.25 0.00 0.25 0.500
1000
2000
3000
4000
5000
6000
0.5%
1.0% drifts
Tim
e (
s)
1.5% drifts
Fraction of the span
(a) (b)
-0.50 -0.25 0.00 0.25 0.500
2000
4000
6000
8000
10000
12000
14000
16000
18000
Tim
e (
s)
Fraction of the span
0.5%
3.0% drifts
2.0%
1.5%
2.5%
1.0%
-0.50 -0.25 0.00 0.25 0.500
2000
4000
6000
8000
10000
12000
14000
16000
18000
20000
Tim
e (
s)
Fraction of the span
2.5%
drifts
3.0%
drifts
2.0%
1.5%
1.0%0.5%
(c) (d)
Fig. 15–Location of the inflection point in the longitudinal direction of the specimens; a) C-50;
b) CHSC1; c) CHSC2; d) CHSC3.

34
0%0 5% N.1 0% N.1 5% N.
0%0 5% S.1 0% S.1 5% S.
B1N B3N B5N B6N
B1S B3S B5S B6S
-1000
0
1000
2000
3000
4000
5000
6000
y
Str
ain
(×
10
)-6
-1000
0
1000
2000
3000
4000
5000
6000
y
Str
ain
(×
10
)-6
-1000
0
1000
2000
3000
4000
5000
6000
y
Str
ain
(×
10
)-6
W E
0.05m
0%0 5% S.1 0% S.1 5% S.2 0% S.2 5% S.3 0% S.
0%0 5% N.1 0% N.1 5% N.2 0% N.2 5% N.3 0% N.
-1000
0
1000
2000
3000
4000
5000
6000
y
Str
ain
(×
10
)-6
-1000
0
1000
2000
3000
4000
5000
6000
y
Str
ain
(×
10
)-6
W E
B1N B3N B5N B6N
B1S B3S B5S B6S
0.05m
0%0 5%S.1 0%S.1 5%S.2 0%S.2 5%S.3 0%S.
0%0 5%N.1 0%N.1 5%N.2 0%N.2 5%N.3 0%N.
W
-1000
0
1000
2000
3000
4000
5000
6000
y
Str
ain
(×
10
)-6
-1000
0
1000
2000
3000
4000
5000
6000
y
Str
ain
(×
10
)-6
E
B1N B3N B5N B6N
B1S B3S B5S B6S
0.05m
(a) (b) (c)
Fig. 16–Strain gauge readings in the flexural reinforcement; a) CHSC1; b) CHSC2; c)
CHSC3.