raven - annualreports.co.uk › hosteddata › annualreport... · raven industries financial...
TRANSCRIPT

RAVEN2008 ANNUAL REPORT for the fiscal year ended January 31

Raven continues to generate solid sales and profit growth in spite of difficult
market conditions. It was our eighth-consecutive year of record earnings
per share, with sales to the agricultural market reaching all-time highs. Our
earnings growth of 9% was respectable but not up to our stated goal of 15%.
Difficulties in our residential construction and related markets reduced
results for the year. We continue to generate strong profit margins and high
returns on invested capital. These are the metrics we believe demonstrate
Raven’s strength and reinforce the confidence we have in the future.
Inside this ReportFinancial Highlights. . . . . . . . . . . . . . . . . . . . . . . . . . . . . . . 1Letter to Shareholders. . . . . . . . . . . . . . . . . . . . . . . . . . . . 2Business Profile. . . . . . . . . . . . . . . . . . . . . . . . . . . . . . . . . 6Operations Review . . . . . . . . . . . . . . . . . . . . . . . . . . . . . . 811-Year Financial Summary. . . . . . . . . . . . . . . . . . . . . . . . 16Business Segment Performance . . . . . . . . . . . . . . . . . . . . 18Financial Review and Analysis. . . . . . . . . . . . . . . . . . . . . . 19Stock and Quarterly Performance . . . . . . . . . . . . . . . . . . . 30Management’s Report on Internal Control over Financial Reporting . . . . . . . . . . . . . . . . . . . . . . . . 31Financial Statements. . . . . . . . . . . . . . . . . . . . . . . . . . . . . 32Report of Independent Registered Public Accounting Firm . . . . . . . . . . . . . . . . . . . . . . . . . 43Directors and Executives . . . . . . . . . . . . . . . . . . . . . . . . . . 44Investor Information . . . . . . . . . . . . . . . . . Inside Back Cover
RAVEN INDUSTRIES �
FINANCIAL HIGHLIGHTSFINANCIAL HIGHLIGHTS
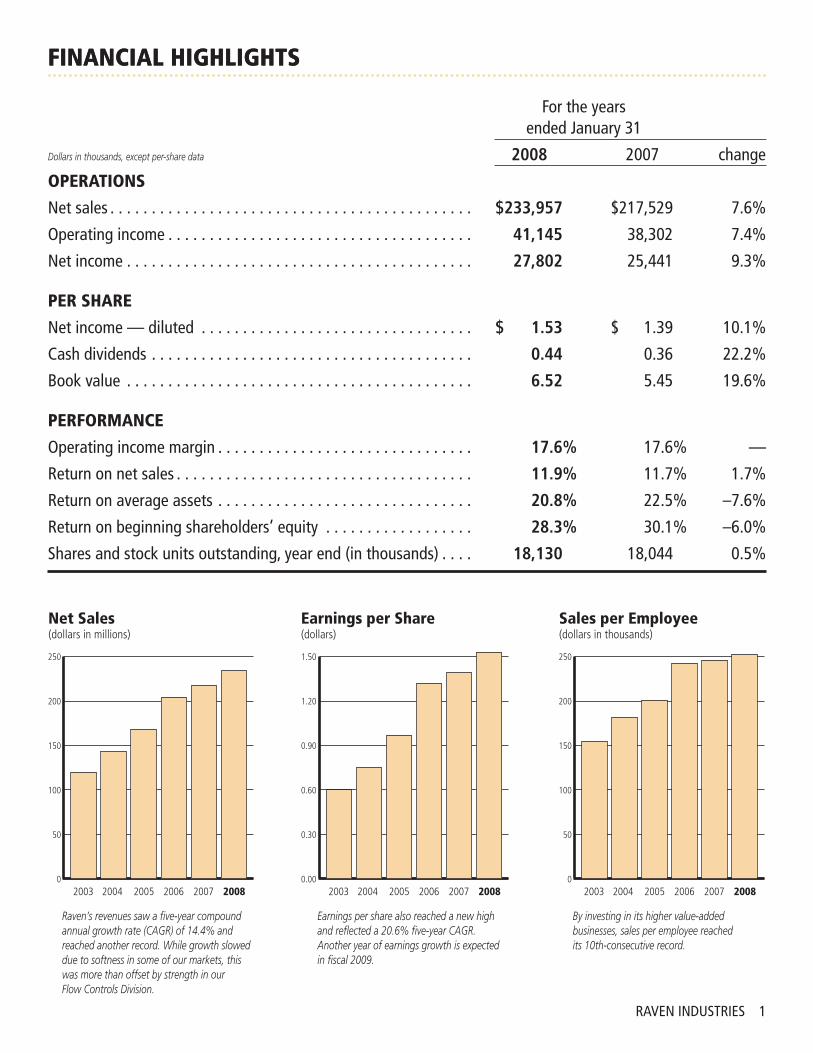
Raven’s revenues saw a five-year compound annual growth rate (CAGR) of 14.4% and reached another record. While growth slowed due to softness in some of our markets, this was more than offset by strength in our Flow Controls Division.
Net Sales(dollars in millions)
Earnings per Share(dollars)
Sales per Employee(dollars in thousands)
0
50
100
150
200
250
2003 2004 2005 2006 2007 2008
Earnings per share also reached a new high and reflected a 20.6% five-year CAGR. Another year of earnings growth is expected in fiscal 2009.
0.00
0.30
0.60
0.90
1.20
1.50
2003 2004 2005 2006 2007 2008
By investing in its higher value-added businesses, sales per employee reached its 10th-consecutive record.
0
50
100
150
200
250
2003 2004 2005 2006 2007 2008
For the years ended January 3�
Dollars in thousands, except per-share data 2008 2007 change
OPERATIONS
Net sales . . . . . . . . . . . . . . . . . . . . . . . . . . . . . . . . . . . . . . . . . . . . $233,957 $2�7,529 7 .6%
Operating income . . . . . . . . . . . . . . . . . . . . . . . . . . . . . . . . . . . . . 41,145 38,302 7 .4%
Net income . . . . . . . . . . . . . . . . . . . . . . . . . . . . . . . . . . . . . . . . . . 27,802 25,44� 9 .3%
PER SHARE
Net income — diluted . . . . . . . . . . . . . . . . . . . . . . . . . . . . . . . . . $ 1.53 $ � .39 �0 .�%
Cash dividends . . . . . . . . . . . . . . . . . . . . . . . . . . . . . . . . . . . . . . . 0.44 0 .36 22 .2%
Book value . . . . . . . . . . . . . . . . . . . . . . . . . . . . . . . . . . . . . . . . . . 6.52 5 .45 �9 .6%
PERFORMANCE
Operating income margin . . . . . . . . . . . . . . . . . . . . . . . . . . . . . . . 17.6% �7 .6% —
Return on net sales . . . . . . . . . . . . . . . . . . . . . . . . . . . . . . . . . . . . 11.9% �� .7% � .7%
Return on average assets . . . . . . . . . . . . . . . . . . . . . . . . . . . . . . . 20.8% 22 .5% –7 .6%
Return on beginning shareholders’ equity . . . . . . . . . . . . . . . . . . 28.3% 30 .�% –6 .0%
Shares and stock units outstanding, year end (in thousands) . . . . 18,130 �8,044 0 .5%

To Our Shareholders, Employees and Customers
2 2008 ANNUAL REPORT
Raven strengthened its financial condition and reported another year of record results. We faced some tough market conditions, especially in building construction, but made solid progress in improving product quality, developing new products and expanding distribution. Raven’s financial results were driven by the outstanding performance of its Flow Controls Division. Our company posted its eighth-consecutive year of record earnings per share, which have grown from $.31 to $1.53 during this time.
Results Reflect Solid Business ModelLast year’s results fell short of long-term goals for sales and profit growth, but demonstrated the strength and sustainability of Raven’s business model and the effectiveness of our diversi-fied business operations.
• Sales increased 8% to a record $234 million.
• Net income grew 9% to $27.8 million, also a record, while earnings per share rose 10%, to $1.53.
• The quarterly dividend per share increased 22%, our 21st-consecutive annual increase.
• Raven’s stock price had a roller-coaster ride during the year. After beginning the year at $28.43, it hit an all-time high of $45.85, before falling back to end the fiscal year at $30.02.
One Company – Four Strong BusinessesRaven has four terrific businesses that are leaders in their fields. Knowing that cheap labor is not a sustainable business strategy, we structured our operating units around innovation, quality, customer service and technical support.
We never stop evaluating our businesses to ensure they are sustainable and can provide the targeted returns on invested capital. Our strategy is to optimize core businesses and to dis-continue non-strategic product lines. For Raven to achieve its long-term profit growth goal of 15%, not every business seg-ment must deliver that level of growth. That’s a real advantage when one of our operations is caught in a market down-cycle, as was the case with the Engineered Films Division last year.
Ronald M. Moquist President & Chief Executive Officer

Strength and Drive
RAVEN INDUSTRIES 3
serving this market and strong brand recognition, are serving us well. The Flow Controls Division will be the main factor in Raven’s growth for the coming year.
Mixed Results for Electronic SystemsOur Electronic Systems Division (ESD) had a respectable year, with sales up 2% but operating income down 5%. ESD works with a small base of Fortune 500 companies and specializes in low-volume, high-mix contract electronics manufacturing that requires a high degree of engineering support and customer service. We build printed circuit boards and sub-assemblies for the avionics and aerospace industry, and these were strong markets last year. On the negative side, sales of one of our key products – electronic bed controls – were down 20%. We do not see that trend changing soon, because the downturn in new home construction and home improvements is nega-tively affecting this market.
One of our top accounts was recently acquired by a foreign company, which is taking its business to another manufacturer. The loss of this sales volume can’t be fully offset by short-term growth in our industrial and avionics accounts. Long-term, ESD will grow through a new strategy of developing and acquiring proprietary products in addition to increasing our base of contract manufacturing customers.
Turnaround Continues at AerostarOur Aerostar subsidiary increased sales by 18% and oper-ating income doubled, although on a very small profit base. We would have done better if not for government-directed delays in parachute shipments. Aerostar has finally turned the corner on its restructuring and is now focused on three major product areas:
• Aerostats, airships and high-altitude research balloons
• Military parachutes
• Specialty protective-wear for government agencies
Aerostar’s long-term future ultimately will be driven by our success in aerostats – for both military and commercial use. A new product we developed this past year – a tethered blimp equipped with electronic sensors and radio equipment and mounted on a large flat-bed trailer for mobility – can be used for border security, intelligence gathering, scientific experi-ments and emergency communication systems. This is a product with tremendous revenue potential. Aerostar’s backlog is double last year’s, pointing to a very strong year of sales and profit growth.
Engineered Films Faces Tough MarketThe Engineered Films Division (EFD) produces high-strength plastic sheeting for industrial, construction, geomembrane and agricultural applications. The past year was a difficult one for EFD, with sales down 7% and operating income off 25%. We knew that sales would suffer in comparison with the previous year, which had $10 million of disaster-relief tarp sales related to hurricane recovery efforts. Two other factors compounded the situation: rising material costs and the competitive pricing pressure in the construction market, which makes up 40% of EFD’s revenues. We don’t see any short-term relief.
Raw material costs, mainly polyethylene resins, began climbing in mid-2007. They continued to rise for the rest of the year, increasing from $.60 per pound to $.80 by year-end. In the past, we had the ability to pass those increases to our customers, but because of the weak marketplace, that was no longer possible. We don’t see this changing soon, and expect operating income in EFD will increase only modestly in the year ahead. As the construction market rebounds, pricing and margins will firm up.
In spite of those issues, I am more confident than ever that the manufacturing capacity and capability we added in the past 18 months will drive long-term profitable growth. Exciting new products – such as our multi-layer radon gas barrier for healthy-home construction – will lead the way, together with geomembrane products that serve a growing market for high-performance barrier films.
Record Performance at Flow ControlsThe Flow Controls Division (FCD) had an exceptional year. Sales were up 41% and operating income rose 89%. Farm cash receipts are at an all-time high, as demand for corn and soy-bean-based renewable fuels accelerates. However, growers’ net income is being moderated by high input costs related to fuel, fertilizer, seed, chemicals and insurance. These cost drivers work in Raven’s favor, as our precision control systems are designed to minimize input costs and maximize output and har-vest yield. One example is the high cost of nitrogen fertilizer, which is taking sales of our anhydrous ammonia application control systems to all-time highs.
FCD is certainly helped by a strong agricultural market, but our growth is also being driven by new products, expanding distri-bution and growth in international markets. International sales are currently 16% of the FCD total, with the potential to grow to a much higher level.
We are investing 6.6% of FCD sales into new product innova-tion and are building out the division as rapidly as we can. The breadth of our product offering, combined with 30 years of
To Our Shareholders, Employees and Customers
4 2008 ANNUAL REPORT
U.S.-based Manufacturing StrategyAll of Raven’s manufacturing is done in the United States, with the bulk of that in South Dakota. This strategy may seem outdated to some, but it actually contributes to our quality, customer service and profitability. We source raw materials and components on a global basis, but process and assemble them locally. We can do this because cheap labor is not our primary driver. We focus on innovation, technology, process control and trained personnel. At some point, we will develop off-shore manufacturing capability. But it won’t happen because we could not compete with our American labor base. It will be driven by a strategy to sell more products into targeted international markets.
Our Long-term Growth StrategyOur primary growth strategy is to drive profitable organic sales in high-margin, capital-efficient niche markets where we can be a leader. We avoid labor-intensive, commodity-type products. Our goal is to increase sales 12% and earnings 15% per year on average. We intend to achieve these targets by investing in new products and capabilities, building out distribution channels and expanding our geographic reach – especially in South America and Europe.
Acquisitions could play a role in our growth – but they won’t be significant. Acquisition candidates must fit within one of Raven’s four core business units, increase long-term share-holder value and be purchased at their intrinsic value or less. Not many targets meet those basic criteria, which is why we do so few acquisitions.
Every year brings changes and the need to adapt. We don’t fall in love with any of our businesses – it’s performance that counts. Yet some operations go through down-cycles, as is the case with Engineered Films. Some businesses take time to reach their potential, which happened with Aerostar. Some are going through a repositioning, as in Electronic Systems. Not every one of our four operations is going to perform at a high level every year, but together they have the strength and drive to achieve our long-term profit goals. That gives us a big advan-tage over single-product competitors who struggle when their markets are in recession.
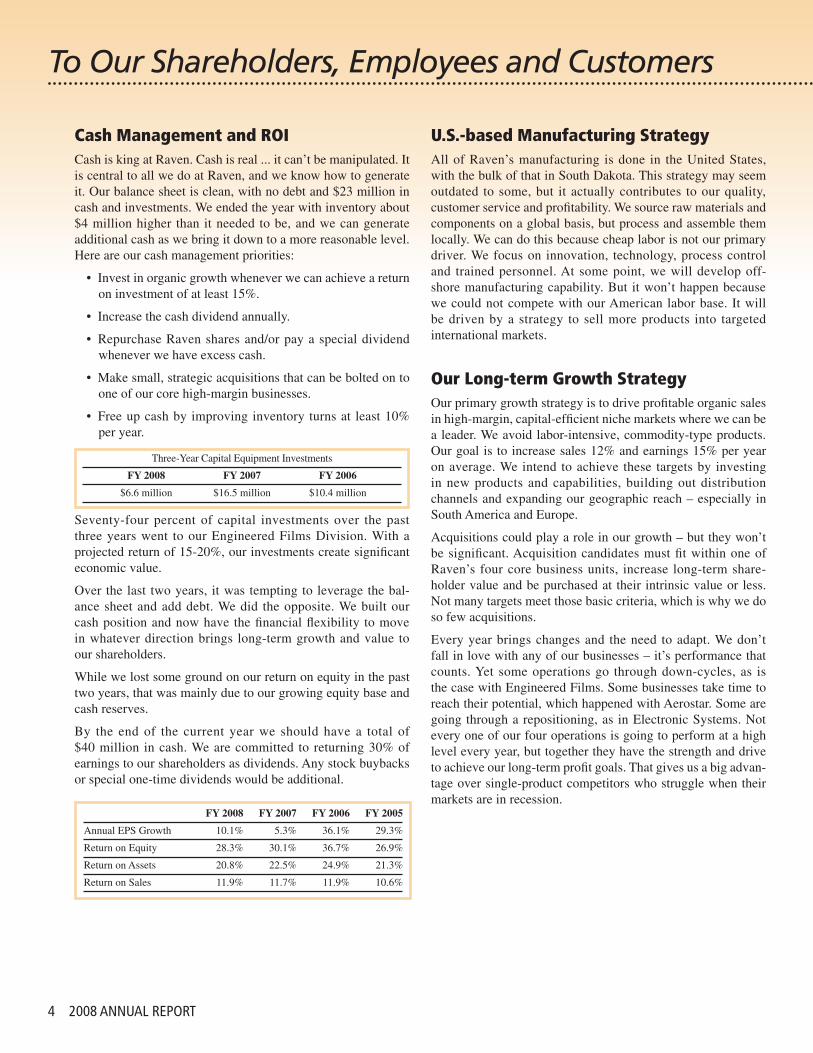
Cash Management and ROICash is king at Raven. Cash is real ... it can’t be manipulated. It is central to all we do at Raven, and we know how to generate it. Our balance sheet is clean, with no debt and $23 million in cash and investments. We ended the year with inventory about $4 million higher than it needed to be, and we can generate additional cash as we bring it down to a more reasonable level. Here are our cash management priorities:
• Invest in organic growth whenever we can achieve a return on investment of at least 15%.
• Increase the cash dividend annually.
• Repurchase Raven shares and/or pay a special dividend whenever we have excess cash.
• Make small, strategic acquisitions that can be bolted on to one of our core high-margin businesses.
• Free up cash by improving inventory turns at least 10% per year.
Three-Year Capital Equipment Investments
FY2008 FY2007 FY2006
$6.6 million $16.5 million $10.4 million
Seventy-four percent of capital investments over the past three years went to our Engineered Films Division. With a projected return of 15-20%, our investments create significant economic value.
Over the last two years, it was tempting to leverage the bal-ance sheet and add debt. We did the opposite. We built our cash position and now have the financial flexibility to move in whatever direction brings long-term growth and value to our shareholders.
While we lost some ground on our return on equity in the past two years, that was mainly due to our growing equity base and cash reserves.
By the end of the current year we should have a total of $40 million in cash. We are committed to returning 30% of earnings to our shareholders as dividends. Any stock buybacks or special one-time dividends would be additional.
FY2008 FY2007 FY2006 FY2005
Annual EPS Growth 10.1% 5.3% 36.1% 29.3%
Return on Equity 28.3% 30.1% 36.7% 26.9%
Return on Assets 20.8% 22.5% 24.9% 21.3%
Return on Sales 11.9% 11.7% 11.9% 10.6%

Strength and Drive
RAVEN INDUSTRIES 5
Strength and DriveEach day we have to earn the trust of shareholders, and nothing builds this like performance. Not every year will be great, but every year must instill a belief that we optimized the market situation handed to us – that we have a plan for success – and that we have the talent to execute that plan.
We were pleased to be named by Forbes as one of the top 200 Small Companies in America. In the past two years we have been listed at 85 and 68. That doesn’t happen without a superb group of employees who have the talent and drive to succeed. My thanks to all of them – and to you, our shareholders, for your continued support and confidence.
Ronald M. Moquist President & CEO
March 28, 2008
We continue to use tools such as Six Sigma and Lean Manufacturing to continuously improve quality, eliminate waste and reduce cycle times. Every year the goal is to improve productivity 6% and increase inventory turns. You can’t save your way to success, but neither can you grow profitably if margins are compressed by rising costs.
The Benefit of a Strong BoardI have had the opportunity to see and experience corporate governance and the role a strong board of directors can play. At a time when many boards defer their responsibilities to outside experts rather than exercise the experience, judgment and knowledge for which they were retained, the Raven board continues to provide strong oversight and guidance to our executives. Raven’s board challenges as well as supports and encourages management. Our directors never forget that their primary role is to oversee how the company serves the interests of shareholders and other stakeholders.
Raven executive team from left to right:
CFO Thomas Iacarella,
Executive VP of Flow Controls Daniel Rykhus,
President and CEO Ronald Moquist,
VP of Engineered Films James Groninger,
Aerostar President Mark West,
VP Administration Barbara Ohme,
VP of Electronic Systems David Bair

6 2008 ANNUAL REPORT
While Raven’s four operations serve different markets, they have these strong growth factors:
• Significant share in their niche markets, which supports profitable expansion
• A business model that avoids labor-intensive commodity products – and offshore competition
• Strong cash generation and continued reinvestment in new products and capacity
• A high level of customer service through a combination of up-front sales consultation, materials management, quality control and after-sales support
String reinforced plastic (polyethylene) sheeting: DURA-SKRIM®
Extruded polyethylene film that can be formulated and tailored to a customer’s specifications: RUFCO®
Barriers against weather and air: FORTRESS™Vapor retarders and gas barriers to prevent moisture from seeping through concrete slabs or walls: VaporBlock® underslab vapor retarder
•
•
••
Ag equipment guidance systems: Cruizer™ Spray equipment rate controllers: SCS Series™Precision ag product application, steering and data management systems: Viper™, Envizio Plus™Ag equipment boom management and applications systems: SmartBoom™, AccuBoom™, AutoBoom™Tractor steering systems: SmarTrax™, QuickTrax™Navigational guidance for professional ship pilots: Starlink™
•••
•
••
Contract manufacturing of low volume/high mix industrial products that stand up to harsh environments with great reliabilityRepair/warranty service management and product distributionHigh levels of engineering support and customer service
•
•
•
High-altitude scientific research balloonsHigh-altitude airships that reach near-space (60,000-80,000 feet) for communications, data relay, surveillanceTethered aerostats (blimps) for military, homeland security and scientific useMilitary parachutes Clothing to protect from exposure to biochemicals, fuels and fumes, extreme cold weather
••
•
••
Energy and geomembrane: oilfield pit liners, floating covers, remediation liners and covers, landfill caps, pond and canal liningsConstruction: temporary building enclosures, house wraps, disaster films, vapor retarders, gas barriers Manufactured housing: transit enclosures, house wraps Industrial: multilayer packaging films, lamination films, containment tubingAgriculture: temporary grain covers, silage bunker covers, poultry house ceilings, waste disposal liners
•
•
••
•
Domestic and international agricultural OEMs and sprayer manufacturersAgricultural equipment aftermarketMarine ship pilots
•
••
Primarily Fortune 500 industrial OEMs in North America Markets served by customers include industrial controls and instrumentation, aerospace/aviation, communication, defense
••
U .S . and foreign governmentsU .S . and international military forcesHomeland securityNASAScientific agencies and universities
•••••
Operating Unit Products or Services Markets/Product Uses
Engineered Films
Flow Controls
Electronic Systems
Aerostar International
Business Profile

RAVEN INDUSTRIES 7
Vertically integrated manufacturer: offering extruded blown film, lamination and conversionBroad product line including mono- to seven-layer co-extruded film and reinforced laminated sheeting, from .003 to .045 inches thick Superior target marketingISO 900�:2000 certification
•
•
••
Installed new equipment capable of manufacturing specialty multi-layer films for markets not previously servedMoved to a market-specific approach to salesNew product introductions: radon, methane and oxygen barrier films
•
••
Market leader for agricultural sprayer controlsLarge installed base of sprayer controls Strong brand recognition and distribution networkWide range of precision agricultural productsExcellent after-sale service
•••••
Introduced new products, including Cruizer™, Viper PRO™, Envizio PRO™Focus on international markets led to sales contribution of �6% Strengthened relationships with large OEMs that are integrating Raven’s products into their machine designs
•
•
•
Advanced manufacturing technologyFull-service provider, from engineering and manufacturing to customer serviceClose partnership with customers IPC certification to produce lead-free electronics assembliesISO 900�:2000 certification
••
••
•
Expanded lead-free manufacturing capabilitiesSignificantly improved on-time delivery rates through use of Six SigmaContinued to contribute good levels of cash flowIntroduced proprietary GPS-accessories product line
••
••
Began manufacturing military personnel parachutesSecured fuel handler coverall contractWon U .S . Navy survival suit contractSuccessful introduction of tethered aerostat with transport and support equipmentSecured contract for a high-altitude unmanned airship
••••
•
Sole source in U .S . for scientific research balloonsOver 50 years of experience in manufacturing stratospheric balloons Best technology for high-speed sewing and sealing of specialty films and fabrics
••
•
Competitive Strengths Milestones
Sales by Operating Unit Income by Operating Unit
Flow ControlsEngineered Films Electronic Systems Aerostar
2003 2004 2005 2006 2007 2008
Engineered Films Sales(dollars in millions)
$35.1$42.6
$58.7
$82.8$91.1
$84.8
2003 2004 2005 2006 2007 2008
Flow Controls Sales(dollars in millions)
$28.5$35.1
$40.7$47.5 $45.5
$64.3
2003 2004 2005 2006 2007 2008
Electronic Systems Sales(dollars in millions)
$38.6$44.3 $47.0
$56.2
$66.3 $67.6
2003 2004 2005 2006 2007 2008
Aerostar Sales(dollars in millions)
$17.4
$20.7 $21.7
$18.0
$14.7$17.3

RAVEN Engineered Films Division
8 2008 ANNUAL REPORT
“Engineered Films is the
industry innovator, and
this is what will bring us
growth and profitability.
We have looked at where
the business needs to be
in five years and made
many of the investments
in people, technology and
equipment that we’ll need
to get there.”James D. Groninger, Division Vice President and General Manager – Engineered Films Division
Strong Business ModelPlastics touch virtually everything in our lives, from packaging to storage and protection to finished goods. This makes it a huge market – and an excellent source of long-term growth for Raven.
We are vertically integrated. We handle the three key film produc-tion processes: 1) extrusion – creating up to seven-layer plastic sheeting from polyethylene pellets, 2) lamination and string reinforcement – enhancing the strength of extruded films, and 3) conversion – custom-izing the sheeting with special properties, such as coverage area, texture and print. As a result, our customers can gain access to a wide range of products through a single source. The combination of expanding our capacity with state-of-the-art equipment last year, and a production process that is ISO 9001:2000 certified, also qualifies us to serve more types of domestic markets than most of our competitors.
We have a strong research and development capability. Our experienced design team helps us create custom solu-tions for our customers. This group also develops variations of existing products – either adding more characteristics, or enhancing properties while reducing the thickness of the film. The result is products with different “levels” of performance that meet the needs of a wide range of customers. In addition, we have a world-class quality control lab that performs extensive product testing.

Strength and Drive
RAVEN INDUSTRIES 9
We have close relationships with our customers. They often come to us with new product ideas and leverage our R&D expertise. Customers can purchase time on our production lines to test their product ideas on the most technologically advanced equipment in the industry. They can have us create short runs of their products. We make the process as effortless as possible: going out of our way to communicate at every step, and provid-ing exceptional service and quick response times.
Sound MarketsTwo market-related factors depressed Engineered Films’ perfor-mance this past year. First, the level of disaster film sales in previous years was unsustainably high and could not be repeated. Second, a softening economy – particularly in residential construction – led competitors that traditionally concentrated in other film markets to enter some of ours with price discounting. But we remain in the right markets, which offer many opportuni-ties for growth.
Two of our important markets are energy and geomembranes. Energy continues to be fueled by record prices for oil, sparking increased drilling and the need for our containment liner products to help protect the environment.
While geomembranes are a mature market, we are pursuing new niche opportunities. One example is a geomembrane that is NSF (National Sanitation Foundation) certified. About 90% of the fish consumed in the U.S. are grown on farms – to which we now can supply pond liners. Another example is water conservation. In the Southwest, farmers want to line their irrigation canals with our geomembranes to ensure precious moisture is not lost into the soil – something that wasn’t a concern five years ago.
There are many industrial applications for our engineered films, including manufacturing or packaging operations. We are designing products that help farmers save money or increase productivity. While this can be a long sales cycle – because of the amount of testing involved – we are working with the right types of customers to generate long-term growth.
Drive to SucceedLast year, we made progress on our long-term growth initiatives. We expect this fiscal year will be an important one for us, as we take those initiatives to the next level.
The investment we made in expanding our capacity and adopting new technologies will allow us to reap three benefits. First, we plan to introduce a greater number of new products. One example is a house wrap with improved handling characteristics. We also expect to see sales from new gas barrier products that will protect people from harmful fumes from one or more of these sources: gasoline, diesel fuel, radon, and methane found in landfills.
Second, we’ll be more innovative. New manufacturing technol-ogy allows us to replicate the exact color and quality of products to customers year after year. It will help us use automation to improve productivity as well as the working conditions for our employees.
Third, we’ll be more flexible to meet market demand. We can quickly change our equipment from manufacturing one product to another. We also can alter the formulations of our products to meet the different levels of performance. One example is “down gauging” to create a thinner, lower cost, more “green” solution for the customer without sacrificing performance. And by running more products with thinner gauges, we are able to achieve higher throughput on our existing capacity – a source of incremental profit.
Since our customers want to deal with specialists, we aligned our sales force by end-use market rather than geographical terri-tories. The result is stronger relationships with these customers as well as those who specify our products, such as architects and engineers. We also gain deeper insights into our competition in each area. In addition, we’re doing a better job of sharing infor-mation among salespeople, so customers can quickly get answers even if their primary contact is not immediately available. We are continuing to build out our sales team. Our most recent addition is an agricultural product specialist.
Increased competition in some market niches, continued raw material price volatility, and a flat economy will make this a chal-lenging year. However, our combination of close relationships with customers, and new products – particularly house wraps, geomembranes and gas barriers – should lead Engineered Films to higher sales and profitability. n

�0 2008 ANNUAL REPORT
RAVEN Flow Controls Division
Strong Business ModelFlow Controls’ substantial increases in revenues and operating income last year were buoyed by a strong U.S. and international agricultural market. However, it was the operation’s business model that enabled it to grow faster than the industry.
We use proven technologies to create proprietary products. Flow Controls is known for developing products that solve ag production problems related to applying pesticides and nutrients. The operation takes technologies introduced in other markets, such as wireless communica-tions and global positioning systems (GPS), and creates breakthrough products for the agricultural market. This approach reduces development costs and shortens the new product cycle.
We have an effective approach to distribution. Working closely with distributors, we reach the aftermarket in the U.S. and key inter-national markets: Argentina, Australia, Brazil, Canada, Europe and South Africa. We make it easy for them to market our systems, by ensuring distributors are well trained, understand our products, and have support when they need it. This approach led to explosive growth last year. We also have strong relationships with important agricultural equipment manufacturers.
“Flow Controls is a
precision technology
supplier that serves the
ag market. We support
our OEM customers by
making their machines
more effective. And
we add value to the
aftermarket by increasing
the efficiency of a grower’s
existing equipment.”Daniel A. Rykhus, Executive Vice President and General Manager – Flow Controls Division

Strength and Drive
RAVEN INDUSTRIES ��
We create near- and long-term growth opportunities. Having a solid new product pipeline keeps our business strong. The process begins by reviewing our current suite of products. We look for opportunities to build on the technologies and distribution networks already in place. Last year, this led us to build out our steering and guidance lines. We also have an Advanced New Product Group that evaluates future trends – in technology as well as in agriculture – and uses this to direct our longer term investments.
Growing MarketsWe focus on the U.S. and select international markets for two reasons. First, they either are established markets that must maximize the available acreage, or they represent the fastest growing emerging markets. Second, growers in these areas have shown they want to adopt higher technology application practices. Several trends are driving the demand that we expect will keep agriculture growing at a brisk pace for at least the next three years.
Land use is changing. This is happening because of a greater emphasis on renewable fuels. More acres are being planted in corn, and more growers want to plant it continuously. To do this successfully, they have to closely monitor the amounts of chemi-cals, such as nitrogen and pesticides, and the areas where these are applied. Regulation also is increasing. Growers will need to have accurate records of the types of chemicals used, where and over what periods. Our Viper PRO™ computer tracks this data for each field and can send data wirelessly to a desktop or note-book computer for easy analysis and datalogging. In addition, we will be providing diagnostic services over the Internet to ensure maximum up-time.
Input costs, such as fertilizer and diesel fuel, are rising. Growers also are changing their cropping practices. They increasingly choose a no tillage approach, which preserves the land but requires more frequent spraying. Because growers operate their equipment with greater frequency, they want to do this as effi-ciently as possible, and avoid issues such as gaps or overspray.
One of the results will be more demand for products such as our new Cruizer™ guidance and steering system. This compact 3-D system is designed for growers who do not yet have a guidance system, allowing them to adopt the technology at half the price of similar products. The combination of our steering and guidance systems with AutoBoom™, which automatically adjusts boom height to ensure even spraying of an uneven field, helps reduce their costs while improving their accuracy.
Drive to SucceedOur first goal for this year is to further strengthen Flow Controls’ international expansion. We added a precision ag specialist in eastern Canada, where we had very little presence, and are developing a stronger network of dealers throughout the country. We also increased our support of the Australian market.
In addition, we established a relationship with a distributor in Ukraine and already are generating sales there. We also are reviewing our opportunities in Brazil.
Our ultimate objective is to increase international sales to more than 25% of total Flow Controls revenues from their current 16%, while continuing to expand our domestic revenues.
Our second goal for this year is to further refine our product line, to make us more competitive and improve profitability. This already resulted in a product that premiered in February. FarmPro™ is a dual-frequency RTK steering system we created with a partner, which provides steering accuracy within 2 centimeters. Its initial reception has been very positive. While we do not expect to match the record number of products introduced last year, we will continue a steady stream of refine-ments, and increase our commitment to advanced product development activities.
Our third goal is to wisely allocate our engineering resources. New product development, existing product improvement, and process change to support our production capacity are important engineering initiatives. These projects will improve our com-petitive position both in the U.S. and internationally. We also will review acquisition opportunities that represent a good strategic fit, giving us access to complementary products, engineering expertise, and effective distribution channels.
Flow Controls has grown by developing and controlling proprie-tary technologies that provide solutions to growers in this country and abroad. We will continue to make additions to our suite of products and improvements on our current offerings, increas-ing the value we offer to our OEM partners and those who use our systems. n

�2 2008 ANNUAL REPORT
RAVEN Electronic Systems Division
Strong Business ModelElectronic Systems takes an unusual approach to providing electronics manufacturing services. Seeking out short run, high product mix oppor-tunities, our goal is to be a true partner with a small number of select companies, giving them the personal attention they deserve. As a result, most of our sales increases come from growing with them.
We are an extension of our customers’ operations. Our engineers work with customers to design products that can be efficiently and cost-effectively produced. Our material management experts identify the right raw materials and vendors. Our quality control professionals design the right tests and discuss how to improve the results. Our customer value teams ensure customers have access to these and other resources, that scheduling is coordinated, and customers are satisfied. This is a true collaboration. And we handle repair and warranty service or product distribution as customers request it. Those who leverage our expertise see higher quality products at a lower cost. The longstanding customer relationships that result reinforce our competitive advantage.
We offer technologies customers may not have. One example is our ability to produce lead-free electronic assemblies. We are one of only about a dozen firms worldwide to be certified for this. In addition, our engineers can help customers convert from lead-based products, handling what can be a complex redesign process, so their engineers can focus on
“We have a vested interest
in making customers
more successful. We help
improve their design and
systems – as well as our
own – to create a seamless
supply chain. This puts
us in a great position to
anticipate their needs or
respond quickly. That’s
something they’ll never
get with an offshore
company.”David R. Bair, Division Vice President and General Manager – Electronic Systems Division

Strength and Drive
RAVEN INDUSTRIES �3
creating new products. We can provide the latest technology, handling surface-mount components the size of a flake of pepper. Many times older products are still in demand. Not everyone has the technology to make these products – but we do. For example, we can mount components using older through-hole technology.
We are committed to improving quality while removing costs. Six Sigma and Lean Manufacturing techniques are part of Electronic Systems’ culture. Last year, we worked with a customer to create a single communication channel that allowed us to improve on-time delivery from 52% to more than 90%. As these process improvements bring cost savings, we share some of this with customers. The rest is reinvested in strengthening our capabilities to better serve customers, while still provid-ing Electronic Systems with some of the strongest margins in its market.
Opportune MarketsOur diverse customer base reaches sizable markets. This increases the chances that softness in one area can be offset by sales in another niche or market.
Industrial controls and instrumentation is a good example. The bed frame controls market is dependent on residential housing. That market will be slow again this year. However, our business in commercial building controls for heating, ventilating and air conditioning actually benefits when older buildings are being maintained rather than replaced with new ones. We provide parts to keep older systems running, so our clients can focus on developing newer ones. And as the new systems age, we begin to support these.
According to our research, the aerospace/aviation industry is expected to grow more than 8% annually for the next several years. This is driven by higher demand for corporate planes, and the need to replace aging U.S. commercial jets as travel increases. We are benefiting from having a number of systems on aircraft – from environmental controls to landing gear to fuel tank monitoring.
Most of our work for defense and homeland security is in communications equipment. One reason we expect to see higher growth here is by serving the need for secure wireless systems that allow different military and government agencies to commu-nicate with each other.
Drive to SucceedLast year we made progress on most of our goals. Six Sigma, Lean Manufacturing and our first Tiger Team of employees, working together across department lines, allowed us to continue removing costs from our business while doing a better job of serving customers.
We strengthened our manufacturing capabilities by expanding circuit testing abilities and automated optical inspection – allow-ing us to identify and correct any problems earlier in the process. Just as important as the $1 million we spend annually on capi-tal equipment purchases is having the power and resources of Raven’s sizable organization behind us.
We did not make enough progress on inventory turns, which were flat with the prior year. This situation began to improve late in 2007, as we boosted one customer’s on-time delivery rate. Our goal is to reach 99% on-time delivery across our customer base. We have a number of projects underway and expect them to have a major impact on inventory turns.
This year will be a difficult one for us, because one of our customers was acquired and took their business to another provider. To offset this situation over the longer term, our goal is to add a new customer during the year. We seek clients that meet our criteria: 1) well-established companies, 2) the ability to begin with projects that create several million in revenues for us and grow from there, 3) a significant amount of engineering or schedule support, 4) a desire to work closely with us to align processes and improve the entire supply chain, and 5) a cultural fit that would lead to a successful long-term relationship.
We are working hard to return to our traditional level of 10% sales growth and solid earnings from operations by target-ing the right niches and the right customers. This allows us to continue making operational advances to better serve our customers while giving them the personal attention they deserve. Their long-term relationships with us mean we can move past early start-up related costs and into regular production. The combination provides the cash flow contribution that makes Electronic Systems a valuable part of Raven. n

�4 2008 ANNUAL REPORT
RAVEN Aerostar
Strong Business ModelAerostar serves four markets: parachutes, protective clothing, lighter than air research balloons and airships, and tethered aerostats. This focus arose from its expertise in product design engineering, efficient high-speed manufacturing, and effective quality control. Last year, Aerostar recom-mitted to accelerating its revenue and profitability.
We have a strong foundation in military parachutes and protective clothing. Aerostar has been successful in gaining contracts and follow-on work in these markets. While parachutes and protective clothing are a solid and sustainable business, their expansion is limited. We are using them as a platform to invest in areas with greater growth.
We have exciting opportunities in high-altitude products. In January 2008, three Aerostar stratospheric balloons helped NASA set a record – flying 13,000 pounds of scientific equipment for over 1,700 hours in Antarctica. Our experience in balloons and airships gives us the reputation as an industry leader. In addition, competition here is limited. We believe the potential size of these markets, combined with our good relationships with industry decision-makers and ability to cost-effectively execute programs, represents an opportunity for incredible growth.
“This is not the Aerostar
of five years ago. We
have identified our best
opportunities for growth,
and they are in the high
tech aerospace market.
We are using our stable
businesses to fund faster
growing opportunities
and expect to become
a major contributor to
Raven’s revenues and
profitability.”Mark L. West, President – Aerostar International, Inc.

Strength and Drive
RAVEN INDUSTRIES �5
Favorable MarketsParachutes used by the U.S. military were designed over 40 years ago, when soldiers and gear were considerably lighter. This has spurred a replacement cycle. The $14 million MC-6 U.S. Army parachute contract, which we began shipping in November 2007, is a two-year program. Follow-on contracts could last through 2010. We also expect to qualify for the five-year T-11 parachute contract for all U.S. paratroopers. The combination of these two programs could mean approximately $7 million in annual rev-enues to Aerostar over the next seven years.
In protective wear, last year we received a $6.5 million one-year contract for fuel handler coveralls. The first shipments were sent in December 2007. We are actively pursuing follow-on contracts. We also won a small but important contract for the Navy 86-P survival suit for pilots, which allowed us to enter this market.
We believe high-altitude airships offer great growth. As an emerging market, there are no estimates on its size. However, Army professionals have told us they are very excited about the capabilities that airships offer. This was supported by additional Congressional funding of over $5 million for the HiSentinel pro-gram, a joint project with Southwest Research Institute and the U.S. Air Force Research Lab. At its completion, this project will develop small near-space airships for tactical communications and surveillance.
Orders for high-altitude research balloons had declined over the last 25 years, representing $3-4 million in Aerostar annual revenues. However, NASA breathed new life into the market. This has led to its recently announced – and funded – program to explore the Van Allen Belt in 2010, which would involve 30 flights in a two-year period.
Tethered aerostats offer the greatest potential for near-term growth. They present an effective solution for the military’s need to quickly deploy an inexpensive unmanned surveillance or com-munication platform. Only one other company competes in this market, which is estimated at $125 million annually. Capturing even a portion of this represents an important gain for Aerostar.
Drive to SucceedOur performance last year was negatively affected by delays in shipping the MC-6 contract. However, we entered the current year with nearly 85% of our planned sales in place and are taking other steps to further improve performance.
We expect approximately $15 million in revenues from contracts for parachutes and protective gear. There are three goals for this business. First, we plan to deliver these products on time and to our customers’ specifications. Second, we will use our unmatched high-speed manufacturing process and insights from skilled employees to ensure these contracts are as profitable as possible.
Our third goal is securing future business. The time from winning a contract to starting shipments can be long and influenced by factors beyond our control. We are looking – and qualifying – for follow-on contracts to existing parachute and protective wear programs. We also are building relationships with other partners to help secure additional contracts.
In high-altitude airships, we are working to make our next test flight a success. The test should help confirm our ability to pro-duce a cost-effective solar powered stratospheric airship. The launch is expected to take place in our second quarter. We believe a successful flight could result in additional Congressional funds to support the high-altitude airship program, leading it to become a regular line item in the military budget.
For high-altitude research balloons, we plan to build on the inter-est shown by NASA. New science is developing that demands the use of balloons. With traditional flights lasting only two-to-four days, and our balloons capable of being airborne for more than 30 days, Aerostar is a leader in this market.
The tethered aerostat market offers much opportunity for growth. Our successful flight in October of Model TIF 25K illustrated Aerostar’s turnkey, easy-to-use mobile aerial platform, so the aerostat launched within hours of reaching the site. We offer five sizes of aerostats to meet a variety of needs. The lead time to manufacture an aerostat is approximately six months, so we will be particularly focused on contacting potential customers in the first half of this year.
Aerostar is more focused and is actively investing income from slower growing parachute and protective wear segments into fast-growing markets for high-altitude airships, research bal-loons and tethered aerostats. Our goal is to be a more meaningful contributor to Raven’s long-term growth and profitability. n

�6 2008 ANNUAL REPORT
ELEVEN-YEAR FINANCIAL SUMMARY For the years ended January 3�Dollars in thousands except per-share data 2008 2007 2006OPERATIONS FOR THE YEARNet sales Ongoing operations . . . . . . . . . . . . . . . . . . . . . . . . . . . . . . . . . . . . . . . . . . . . . $233,957 $2�7,529 $204,528 Sold businesses(a) . . . . . . . . . . . . . . . . . . . . . . . . . . . . . . . . . . . . . . . . . . . . . . . — — — Total . . . . . . . . . . . . . . . . . . . . . . . . . . . . . . . . . . . . . . . . . . . . . . . . . . . . . . . 233,957 2�7,529 204,528Gross profit . . . . . . . . . . . . . . . . . . . . . . . . . . . . . . . . . . . . . . . . . . . . . . . . . . . . . . 59,148 54,882 53,23�Operating income Ongoing operations . . . . . . . . . . . . . . . . . . . . . . . . . . . . . . . . . . . . . . . . . . . . . 41,145 38,302 37,284 Sold businesses(a) . . . . . . . . . . . . . . . . . . . . . . . . . . . . . . . . . . . . . . . . . . . . . . . — — — Total . . . . . . . . . . . . . . . . . . . . . . . . . . . . . . . . . . . . . . . . . . . . . . . . . . . . . . . 41,145 38,302 37,284Income before income taxes . . . . . . . . . . . . . . . . . . . . . . . . . . . . . . . . . . . . . . . . . 42,224 38,835 37,494Net income . . . . . . . . . . . . . . . . . . . . . . . . . . . . . . . . . . . . . . . . . . . . . . . . . . . . . . $ 27,802 $ 25,44� $ 24,262Net income as % of sales . . . . . . . . . . . . . . . . . . . . . . . . . . . . . . . . . . . . . . . . . . . 11.9% �� .7% �� .9%Net income as % of beginning equity . . . . . . . . . . . . . . . . . . . . . . . . . . . . . . . . . . 28.3% 30 .�% 36 .7%Cash dividends . . . . . . . . . . . . . . . . . . . . . . . . . . . . . . . . . . . . . . . . . . . . . . . . . . . $ 7,966 $ 6,507 $ 5,056FINANCIAL POSITIONCurrent assets . . . . . . . . . . . . . . . . . . . . . . . . . . . . . . . . . . . . . . . . . . . . . . . . . . . . $100,869 $ 73,2�9 $ 7�,345Current liabilities . . . . . . . . . . . . . . . . . . . . . . . . . . . . . . . . . . . . . . . . . . . . . . . . . . 22,108 �6,464 20,050Working capital . . . . . . . . . . . . . . . . . . . . . . . . . . . . . . . . . . . . . . . . . . . . . . . . . . . $ 78,761 $ 56,755 $ 5�,295Current ratio . . . . . . . . . . . . . . . . . . . . . . . . . . . . . . . . . . . . . . . . . . . . . . . . . . . . . 4.56 4 .45 3 .56Property, plant and equipment . . . . . . . . . . . . . . . . . . . . . . . . . . . . . . . . . . . . . . . $ 35,743 $ 36,264 $ 25,602Total assets . . . . . . . . . . . . . . . . . . . . . . . . . . . . . . . . . . . . . . . . . . . . . . . . . . . . . . 147,861 ��9,764 �06,�57Long-term debt, less current portion . . . . . . . . . . . . . . . . . . . . . . . . . . . . . . . . . . . — — 9Shareholders’ equity . . . . . . . . . . . . . . . . . . . . . . . . . . . . . . . . . . . . . . . . . . . . . . . $118,275 $ 98,268 $ 84,389Long-term debt / total capitalization . . . . . . . . . . . . . . . . . . . . . . . . . . . . . . . . . . . 0.0% 0 .0% 0 .0%Inventory turnover (CGS / year-end inventory) . . . . . . . . . . . . . . . . . . . . . . . . . . . 4.8 5 .8 5 .4CASH FLOWS PROVIDED BY (USED IN)Operating activities . . . . . . . . . . . . . . . . . . . . . . . . . . . . . . . . . . . . . . . . . . . . . . . . $ 27,151 $ 26,3�3 $ 2�,�89Investing activities . . . . . . . . . . . . . . . . . . . . . . . . . . . . . . . . . . . . . . . . . . . . . . . . (4,433) (�8,664) (��,435)Financing activities . . . . . . . . . . . . . . . . . . . . . . . . . . . . . . . . . . . . . . . . . . . . . . . . (8,270) (�0,277) (6,946)Increase (decrease) in cash and cash equivalents . . . . . . . . . . . . . . . . . . . . . . . . 14,489 (2,626) 2,790COMMON STOCK DATANet income per share — basic . . . . . . . . . . . . . . . . . . . . . . . . . . . . . . . . . . . . . . . $ 1.54 $ � .4� $ � .34Net income per share — diluted . . . . . . . . . . . . . . . . . . . . . . . . . . . . . . . . . . . . . . 1.53 � .39 � .32Cash dividends per share . . . . . . . . . . . . . . . . . . . . . . . . . . . . . . . . . . . . . . . . . . . 0.44 0 .36 0 .28Book value per share . . . . . . . . . . . . . . . . . . . . . . . . . . . . . . . . . . . . . . . . . . . . . . 6.52 5 .45 4 .67Stock price range during year High . . . . . . . . . . . . . . . . . . . . . . . . . . . . . . . . . . . . . . . . . . . . . . . . . . . . . . . . . $ 45.85 $ 42 .70 $ 33 .�5 Low . . . . . . . . . . . . . . . . . . . . . . . . . . . . . . . . . . . . . . . . . . . . . . . . . . . . . . . . . . 26.20 25 .46 �6 .54 Close . . . . . . . . . . . . . . . . . . . . . . . . . . . . . . . . . . . . . . . . . . . . . . . . . . . . . . . . . $ 30.02 $ 28 .43 $ 3� .60Shares and stock units outstanding, year end (in thousands) . . . . . . . . . . . . . . . . 18,130 �8,044 �8,072Number of shareholders, year end . . . . . . . . . . . . . . . . . . . . . . . . . . . . . . . . . . . . 8,700 8,992 9,263OTHER DATAPrice / earnings ratio . . . . . . . . . . . . . . . . . . . . . . . . . . . . . . . . . . . . . . . . . . . . . . . 19.6 20 .5 23 .9Average number of employees . . . . . . . . . . . . . . . . . . . . . . . . . . . . . . . . . . . . . . . 930 884 845Sales per employee . . . . . . . . . . . . . . . . . . . . . . . . . . . . . . . . . . . . . . . . . . . . . . . . $ 252 $ 246 $ 242Backlog . . . . . . . . . . . . . . . . . . . . . . . . . . . . . . . . . . . . . . . . . . . . . . . . . . . . . . . . . $ 66,628 $ 44,237 $ 43,6�9
All per-share, shares outstanding and market price data reflect the October 2004 two-for-one stock split, the January 2003 two-for-one stock split and the July 2001 three-for-two stock split. All other figures are as reported.
Price / earnings ratio is determined as closing stock price divided by net income per share — diluted.
Book value per share is computed by dividing total shareholders’ equity by the number of common shares and stock units outstanding.
(a) In fiscal 2003, 2001, and 2000, the company sold its Beta Raven Industrial Controls, Plastic Tank, and Glasstite businesses, respectively.

RAVEN INDUSTRIES �7
2005 2004 2003 2002 200� 2000 �999 �998
$�68,086 $�42,727 $��9,589 $��2,0�8 $��3,360 $�07,862 $�08,408 $�04,489 — — �,3�4 6,497 �9,498 42,523 46,798 47,679 �68,086 �42,727 �20,903 ��8,5�5 �32,858 �50,385 �55,206 �52,�68 43,200 33,759 27,5�5 23,85� 2�,�23 24,2�7 24,44� 24,929
27,862 2�,98� �6,86� �3,788 7,4�7(c) 7,97� 8,220 9,555 — (355) 204 (6�3) 3,33�(d) 2,606(e) �,453 �,007 27,862 2�,626 �7,065 �3,�75 �0,748 �0,577 9,673 �0,562 27,955 2�,7�6 �7,254 �3,565 �0,924 �0,503 9,649 �2,540(f)
$ �7,89� $ �3,836 $ ��,�85 $ 8,847 $ 6,4��(c)(d) $ 6,762(e) $ 6,�82 $ 8,062 �0 .6% 9 .7% 9 .3% 7 .5% 4 .8% 4 .5% 4 .0% 5 .3% 26 .9% 23 .8% 2� .5% �8 .4% �� .8% �0 .9% �0 .0% �4 .2% $ �5,298(b) $ 3,075 $ 2,563 $ 2,37� $ 2,399 $ 2,895 $ 2,944 $ 2,709
$ 6�,592 $ 55,7�0 $ 49,35� $ 45,308 $ 5�,8�7 $ 55,37� $ 60,279 $ 57,285 20,950 ��,895 �3,�67 �3,8�0 �3,935 �4,702 �5,�28 �7,8�6 $ 40,642 $ 43,8�5 $ 36,�84 $ 3�,498 $ 37,882 $ 40,669 $ 45,�5� $ 39,469 2 .94 4 .68 3 .75 3 .28 3 .72 3 .77 3 .98 3 .22 $ �9,964 $ �5,950 $ �6,455 $ �4,059 $ ��,647 $ �5,068 $ �9,563 $ �9,8�7 88,509 79,508 72,8�6 67,836 65,656 74,047 83,657 82,066 — 57 �5� 280 2,0�3 3,024 4,572 �,�28 $ 66,082 $ 66,47� $ 58,236 $ 52,032 $ 47,989 $ 54,5�9 $ 62,293 $ 6�,563 0 .0% 0 .�% 0 .3% 0 .5% 4 .0% 5 .3% 6 .8% � .8% 5 .4 6 .5 4 .4 5 .0 5 .9 5 .2 4 .9 4 .8
$ �8,87� $ �9,732 $ �2,735 $ �8,496 $ 9,44� $ �0,375 $ 8,326 $ 9,274 (7,63�) (4,352) (9,�66) (�3,�52) 9,752 6,323 (3,�27) (4,979) (�9,063) (6,�55) (5,830) (8,539) (�4,227) (�6,326) (2,7�4) (4,884) (7,823) 9,225 (2,26�) (3,�95) 4,966 372 2,485 (589)
$ 0 .99 $ 0 .77 $ 0 .6� $ 0 .48 $ 0 .3� $ 0 .26 $ 0 .22 $ 0 .28 0 .97 0 .75 0 .60 0 .47 0 .3� 0 .26 0 .22 0 .28 0 .85(b) 0 .�7 0 .�4 0 .�3 0 .�2 0 .�� 0 .�0 0 .09 3 .67 3 .68 3 .2� 2 .82 2 .53 2 .32 2 .2� 2 .�3
$ 26 .94 $ �5 .23 $ 9 .20 $ 5 .88 $ 3 .48 $ 3 .04 $ 3 .79 $ 4 .29 �3 .08 7 .56 4 .38 3 .02 � .88 2 .25 2 .54 3 .27 $ �8 .38 $ �4 .�� $ 7 .9� $ 5 .64 $ 3 .04 $ 2 .40 $ 2 .67 $ 3 .77 �7,999 �8,04� �8,�33 �8,424 �8,956 23,496 28,�64 28,944 6,269 3,560 2,78� 2,387 2,460 2,749 3,0�4 3,22�
�8 .9 �8 .8 �3 .2 �2 .� 9 .8 9 .2 �2 .4 �3 .7 835 787 784 858 �,082 �,369 �,507 �,573 $ 20� $ �8� $ �54 $ �38 $ �23 $ ��0 $ �03 $ 97 $ 43,646 $ 47,�20 $ 42,826 $ 33,834 $ 38,239 $ 44,935 $ 47,43� $ 47,�54
(b) Includes a special dividend of $.625 per share that was paid in fiscal 2005.
(c) Includes $2.6 million of business repositioning charges, net of gains on plant sales, primarily in Electronic Systems and Aerostar.
(d) Includes the $3.1 million pretax gain ($1.4 million net of tax) on the sale of the company’s Plastic Tank Division.
(e) Includes the $1.2 million pretax gain ($764,000 net of tax) on the sale of assets of the company’s Glasstite subsidiary.
(f) Includes the $1.8 million pretax gain ($1.2 million net of tax) on the sale of an investment in an affiliate.
�8 2008 ANNUAL REPORT
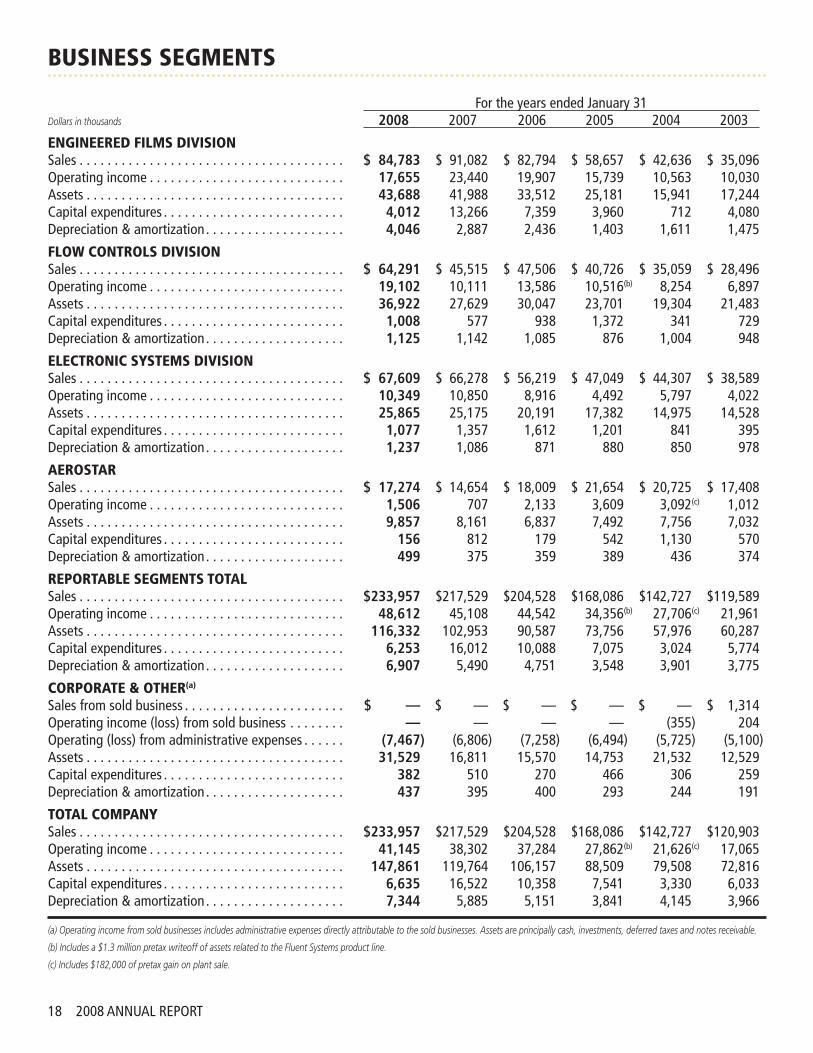
BUSINESS SEGMENTS
For the years ended January 3�Dollars in thousands 2008 2007 2006 2005 2004 2003
ENGINEERED FILMS DIVISIONSales . . . . . . . . . . . . . . . . . . . . . . . . . . . . . . . . . . . . . . $ 84,783 $ 9�,082 $ 82,794 $ 58,657 $ 42,636 $ 35,096Operating income . . . . . . . . . . . . . . . . . . . . . . . . . . . . 17,655 23,440 �9,907 �5,739 �0,563 �0,030Assets . . . . . . . . . . . . . . . . . . . . . . . . . . . . . . . . . . . . . 43,688 4�,988 33,5�2 25,�8� �5,94� �7,244Capital expenditures . . . . . . . . . . . . . . . . . . . . . . . . . . 4,012 �3,266 7,359 3,960 7�2 4,080Depreciation & amortization . . . . . . . . . . . . . . . . . . . . 4,046 2,887 2,436 �,403 �,6�� �,475
FLOW CONTROLS DIVISIONSales . . . . . . . . . . . . . . . . . . . . . . . . . . . . . . . . . . . . . . $ 64,291 $ 45,5�5 $ 47,506 $ 40,726 $ 35,059 $ 28,496Operating income . . . . . . . . . . . . . . . . . . . . . . . . . . . . 19,102 �0,��� �3,586 �0,5�6(b) 8,254 6,897Assets . . . . . . . . . . . . . . . . . . . . . . . . . . . . . . . . . . . . . 36,922 27,629 30,047 23,70� �9,304 2�,483Capital expenditures . . . . . . . . . . . . . . . . . . . . . . . . . . 1,008 577 938 �,372 34� 729Depreciation & amortization . . . . . . . . . . . . . . . . . . . . 1,125 �,�42 �,085 876 �,004 948
ELECTRONIC SYSTEMS DIVISIONSales . . . . . . . . . . . . . . . . . . . . . . . . . . . . . . . . . . . . . . $ 67,609 $ 66,278 $ 56,2�9 $ 47,049 $ 44,307 $ 38,589Operating income . . . . . . . . . . . . . . . . . . . . . . . . . . . . 10,349 �0,850 8,9�6 4,492 5,797 4,022Assets . . . . . . . . . . . . . . . . . . . . . . . . . . . . . . . . . . . . . 25,865 25,�75 20,�9� �7,382 �4,975 �4,528Capital expenditures . . . . . . . . . . . . . . . . . . . . . . . . . . 1,077 �,357 �,6�2 �,20� 84� 395Depreciation & amortization . . . . . . . . . . . . . . . . . . . . 1,237 �,086 87� 880 850 978
AEROSTARSales . . . . . . . . . . . . . . . . . . . . . . . . . . . . . . . . . . . . . . $ 17,274 $ �4,654 $ �8,009 $ 2�,654 $ 20,725 $ �7,408Operating income . . . . . . . . . . . . . . . . . . . . . . . . . . . . 1,506 707 2,�33 3,609 3,092(c) �,0�2Assets . . . . . . . . . . . . . . . . . . . . . . . . . . . . . . . . . . . . . 9,857 8,�6� 6,837 7,492 7,756 7,032Capital expenditures . . . . . . . . . . . . . . . . . . . . . . . . . . 156 8�2 �79 542 �,�30 570Depreciation & amortization . . . . . . . . . . . . . . . . . . . . 499 375 359 389 436 374
REPORTABLE SEGMENTS TOTALSales . . . . . . . . . . . . . . . . . . . . . . . . . . . . . . . . . . . . . . $233,957 $2�7,529 $204,528 $�68,086 $�42,727 $��9,589Operating income . . . . . . . . . . . . . . . . . . . . . . . . . . . . 48,612 45,�08 44,542 34,356(b) 27,706(c) 2�,96�Assets . . . . . . . . . . . . . . . . . . . . . . . . . . . . . . . . . . . . . 116,332 �02,953 90,587 73,756 57,976 60,287Capital expenditures . . . . . . . . . . . . . . . . . . . . . . . . . . 6,253 �6,0�2 �0,088 7,075 3,024 5,774Depreciation & amortization . . . . . . . . . . . . . . . . . . . . 6,907 5,490 4,75� 3,548 3,90� 3,775
CORPORATE & OTHER(a)
Sales from sold business . . . . . . . . . . . . . . . . . . . . . . . $ — $ — $ — $ — $ — $ �,3�4Operating income (loss) from sold business . . . . . . . . — — — — (355) 204Operating (loss) from administrative expenses . . . . . . (7,467) (6,806) (7,258) (6,494) (5,725) (5,�00)Assets . . . . . . . . . . . . . . . . . . . . . . . . . . . . . . . . . . . . . 31,529 �6,8�� �5,570 �4,753 2�,532 �2,529Capital expenditures . . . . . . . . . . . . . . . . . . . . . . . . . . 382 5�0 270 466 306 259Depreciation & amortization . . . . . . . . . . . . . . . . . . . . 437 395 400 293 244 �9�
TOTAL COMPANYSales . . . . . . . . . . . . . . . . . . . . . . . . . . . . . . . . . . . . . . $233,957 $2�7,529 $204,528 $�68,086 $�42,727 $�20,903Operating income . . . . . . . . . . . . . . . . . . . . . . . . . . . . 41,145 38,302 37,284 27,862(b) 2�,626(c) �7,065Assets . . . . . . . . . . . . . . . . . . . . . . . . . . . . . . . . . . . . . 147,861 ��9,764 �06,�57 88,509 79,508 72,8�6Capital expenditures . . . . . . . . . . . . . . . . . . . . . . . . . . 6,635 �6,522 �0,358 7,54� 3,330 6,033Depreciation & amortization . . . . . . . . . . . . . . . . . . . . 7,344 5,885 5,�5� 3,84� 4,�45 3,966
(a) Operating income from sold businesses includes administrative expenses directly attributable to the sold businesses. Assets are principally cash, investments, deferred taxes and notes receivable.
(b) Includes a $1.3 million pretax writeoff of assets related to the Fluent Systems product line.
(c) Includes $182,000 of pretax gain on plant sale.

RAVEN INDUSTRIES �9
FINANCIAL REVIEW AND ANALYSIS
Comparative Results of Operations For the years ended January 3� 2008 2007 2006 % % % % % % Dollars in thousands, except per-share data sales change sales change sales changeNet sales . . . . . . . . . . . . . . . . . . . . . . . . . . . . . . . . . . . . $233,957 + 7.6 $2�7,529 +6 .4 $204,528 +2� .7Gross profit . . . . . . . . . . . . . . . . . . . . . . . . . . . . . . . . . . 59,148 25.3 + 7.8 54,882 25 .2 +3 .� 53,23� 26 .0 +23 .2Operating expenses . . . . . . . . . . . . . . . . . . . . . . . . . . . 18,003 7.7 + 8.6 �6,580 7 .6 +4 .5 �5,947 7 .8 +�2 .9Operating income . . . . . . . . . . . . . . . . . . . . . . . . . . . . . 41,145 17.6 + 7.4 38,302 �7 .6 +2 .7 37,284 �8 .2 +33 .8Income before income taxes . . . . . . . . . . . . . . . . . . . . . 42,224 18.0 + 8.7 38,835 �7 .9 +3 .6 37,494 �8 .3 +34 .�Income taxes . . . . . . . . . . . . . . . . . . . . . . . . . . . . . . . . . 14,422 6.2 + 7.7 �3,394 6 .2 +� .2 �3,232 6 .5 +3� .5Net income . . . . . . . . . . . . . . . . . . . . . . . . . . . . . . . . . . $ 27,802 11.9 + 9.3 $ 25,44� �� .7 +4 .9 $ 24,262 �� .9 +35 .6Net income per share – diluted . . . . . . . . . . . . . . . . . . . $ 1.53 +10.1 $ � .39 +5 .3 $ � .32 +36 .�Effective income tax rate . . . . . . . . . . . . . . . . . . . . . . . 34.2% – 0.9 34 .5% –2 .3 35 .3% – � .9
Executive Summary
Raven Industries, Inc. is an industrial manufacturer providing a variety of products to customers in the industrial, agricultural, construction and military/aerospace markets, primarily in North America. It operates four business segments: Engineered Films, Flow Controls, Electronic Systems and Aerostar.
Fiscal 2008 was another record-breaking year for the company, which reported $27.8 million in net income and $1.53 of earnings per diluted share. Net income increased $2.4 million, or 9.3%, over last year’s $25.4 million, while earnings per diluted share rose 14 cents from one year ago. Fiscal year net sales climbed to $234.0 million, exceeding fiscal 2007 by $16.4 million, or 7.6%. Sales and profit increases were driven by a strong performance from the company’s Flow Controls segment.
In fiscal 2008, Raven raised its quarterly dividend from 9 cents per share to 11 cents per share, representing the 21st-consecutive annual increase. Fiscal 2008 capital spending was $6.6 million, down significantly from the $16.5 million spent one year earlier. In fiscal 2007 and 2006, the company made significant capital investments in its Engineered Films segment, adding extrusion capacity and manufacturing capabilities. Management expects that fiscal 2009 capital spending will be in the $8 million range.
The following discussion highlights the consolidated operating results. Operating results are more fully explained in the segment discussions that appear after this.
Fiscal 2008 versus Fiscal 2007
Consolidated net sales for fiscal 2008 of $234.0 million were $16.4 million, or 7.6%, higher than last year. Flow Controls was the main driver of the annual revenue growth and, combined with revenue increases for Electronic Systems and Aerostar, offset lower Engineered Films sales. An improved agricultural economy which increased product demand and the introduction of new products grew Flow Controls sales by $18.8 million, to $64.3 million. Electronic Systems net sales of $67.6 million were $1.3 million higher than fiscal 2007, with deliveries of aviation and secure communication electronics increasing over last year. Aerostar fiscal 2008 net sales of $17.3 million improved $2.6 million over one year earlier, due mainly to higher research balloon and parachute sales activity. Engineered Films net sales of $84.8 million were $6.3 million lower than fiscal 2007, which included $9.9 million in disaster film shipments that did not recur in fiscal 2008.
Fiscal 2008 operating income of $41.1 million increased $2.8 million, or 7.4%, as compared with $38.3 million for fiscal 2007. A strong profit performance in Flow Controls, together with increased Aerostar operating income, offset lower Engineered Films and Electronic Systems results. Flow Controls improved profits by $9.0 million from fiscal 2007, leveraging higher sales volume on the existing manufacturing cost base to reach $19.1 million in operating income. Aerostar reported operating income of $1.5 million for fiscal 2008, more than double the $707,000 posted one year earlier. This was due mainly to higher research balloon profits and improved results on the MC-6 Army parachute contract. Engineered Films operating income of $17.7 million was down $5.8 million from one year ago, reflecting a lower sales level, increased raw material costs, and higher depreciation expense. Electronic Systems operating income of $10.3 million fell short of last fiscal year due primarily to a less favorable product mix, decreasing $501,000 on slightly higher sales volume.

20 2008 ANNUAL REPORT
FINANCIAL REVIEW AND ANALYSIS (continued)
Fiscal 2007 versus Fiscal 2006
Fiscal 2007 net sales of $217.5 million exceeded the prior year by $13.0 million, or 6.4%. Engineered Films and Electronic Systems posted record net sales for the fiscal year ended January 31, 2007, while Flow Controls and Aerostar fell short of fiscal 2006 revenue levels. Engineered Films net sales reached $91.1 million, an $8.3 million improvement over fiscal 2006, with increased demand for pit liners used in oil and gas fields, along with higher construction film sales, resulting in 10.0% revenue growth. Electronic Systems net sales climbed to $66.3 million, a $10.1 million increase over fiscal 2006. Higher product demand from the segment’s largest customer accounted for most of fiscal 2007’s revenue increase. Flow Controls net sales of $45.5 million for the fiscal year ended January 31, 2007, were behind the prior year by $2.0 million. There was a fair amount of uncertainty in the agricultural economy during that year and customer buying decisions were delayed. Lower parachute product deliveries accounted for the fiscal 2007 revenue decrease for Aerostar, as net sales of $14.7 million represented a $3.4 million decline from fiscal 2006.
For the year ended January 31, 2007, operating income rose 2.7% to $38.3 million, an increase of $1.0 million compared with $37.3 million reported for fiscal 2006. Strong performances from Engineered Films and Electronic Systems were partially offset by lower operating income for Flow Controls and Aerostar. Higher sales and favorable raw material pricing contributed to Engineered Films’ improved operating income, which increased $3.5 million to reach $23.4 million. Fiscal 2007 Electronic Systems operating income of $10.9 million grew $1.9 million, due mainly to higher sales and better operational execution on existing customer contracts. Flow Controls fiscal 2007 operating income of $10.1 million represented a decrease of $3.5 million in contrast to one year earlier. Lower sales volume on relatively fixed costs negatively affected this segment’s profit for the year ended January 31, 2007. With the lack of parachute product shipments during fiscal 2007, Aerostar reported a decrease in operating income of $1.4 million, falling to $707,000.
Prospects
Management expects another year of record sales and profits in fiscal 2009, with continuing demand for Flow Controls precision agriculture products leading revenue and income growth. Aerostar is anticipating its turnaround to continue in fiscal 2009, as full-year deliveries under the government protective wear and MC-6 parachute contracts are expected to increase revenue and operating income for the segment. With the additional capabilities and capacity of the new extrusion equipment placed into service during fiscal 2008, Engineered Films continues to position itself for future revenue and profit growth and is expected to post higher sales and operating income in fiscal 2009. The company anticipates lower Electronic Systems sales and profits in fiscal 2009, due to the loss of an important customer and weak demand for consumer bed controls.
Performance Measures
Raven seeks to enhance shareholder value by delivering high returns on sales and invested capital. Fiscal 2008 net income was 11.9% of net sales, matching the company’s fiscal 2006 record. Net income as a percent of average assets was 20.8% as compared to 22.5% in fiscal 2007. As a percent of beginning equity, fiscal 2008 net income was 28.3%, down from fiscal 2007’s 30.1%.
2008 2007 2006 2005 2004 2003Net income as % of Net sales . . . . . . . . . . . . . . . . . . . . . . . . . . . . . . . . . . . . . . . . . . . . . . . . . . . . . . . . 11.9% �� .7% �� .9% �0 .6% 9 .7% 9 .3% Average assets . . . . . . . . . . . . . . . . . . . . . . . . . . . . . . . . . . . . . . . . . . . . . . . . . . . 20.8% 22 .5% 24 .9% 2� .3% �8 .2% �5 .9% Beginning equity . . . . . . . . . . . . . . . . . . . . . . . . . . . . . . . . . . . . . . . . . . . . . . . . . 28.3% 30 .�% 36 .7% 26 .9% 23 .8% 2� .5%

RAVEN INDUSTRIES 2�
Segment Analysis
Net Sales and Operating Income by Segment 2008 2007 2006 % % % Dollars in thousands amount change amount change amount changeNet SalesEngineered Films . . . . . . . . . . . . . . . . . . . . . . . . . . . . . . . . . . . . . . . . $ 84,783 – 6.9 $ 9�,082 +�0 .0 $ 82,794 +4� .�Flow Controls . . . . . . . . . . . . . . . . . . . . . . . . . . . . . . . . . . . . . . . . . . 64,291 +41.3 45,5�5 – 4 .2 47,506 +�6 .6Electronic Systems . . . . . . . . . . . . . . . . . . . . . . . . . . . . . . . . . . . . . . 67,609 + 2.0 66,278 +�7 .9 56,2�9 +�9 .5Aerostar . . . . . . . . . . . . . . . . . . . . . . . . . . . . . . . . . . . . . . . . . . . . . . 17,274 +17.9 �4,654 –�8 .6 �8,009 –�6 .8Total . . . . . . . . . . . . . . . . . . . . . . . . . . . . . . . . . . . . . . . . . . . . . . . . . $233,957 + 7.6 $2�7,529 + 6 .4 $204,528 +2� .7
2008 2007 2006
% % % amount sales amount sales amount salesOperating IncomeEngineered Films . . . . . . . . . . . . . . . . . . . . . . . . . . . . . . . . . . . . . . . . $ 17,655 20.8 $ 23,440 25 .7 $ �9,907 24 .0Flow Controls . . . . . . . . . . . . . . . . . . . . . . . . . . . . . . . . . . . . . . . . . . 19,102 29.7 �0,��� 22 .2 �3,586 28 .6Electronic Systems . . . . . . . . . . . . . . . . . . . . . . . . . . . . . . . . . . . . . . 10,349 15.3 �0,850 �6 .4 8,9�6 �5 .9Aerostar . . . . . . . . . . . . . . . . . . . . . . . . . . . . . . . . . . . . . . . . . . . . . . 1,506 8.7 707 4 .8 2,�33 �� .8Corporate expenses . . . . . . . . . . . . . . . . . . . . . . . . . . . . . . . . . . . . . (7,467) (6,806) (7,258)Total . . . . . . . . . . . . . . . . . . . . . . . . . . . . . . . . . . . . . . . . . . . . . . . . . $ 41,145 17.6 $ 38,302 �7 .6 $ 37,284 �8 .2
Engineered Films
Engineered Films produces rugged reinforced plastic sheeting for industrial, construction, manufactured housing and agricultural applications.
Engineered Films — Comparative Results of Operations 2008 2007 2006 % % % % % % Dollars in thousands sales change sales change sales changeNet sales . . . . . . . . . . . . . . $84,783 – 6.9 $9�,082 +�0 .0 $82,794 +4� .�Gross profit . . . . . . . . . . . . 21,040 24.8 –21.5 26,803 29 .4 +�7 .5 22,8�8 27 .6 +24 .�Selling expenses . . . . . . . . 3,385 4.0 + 0.7 3,363 3 .7 +�5 .5 2,9�� 3 .5 + 9 .7Operating income . . . . . . . 17,655 20.8 –24.7 23,440 25 .7 +�7 .7 �9,907 24 .0 +26 .5
Fiscal 2008 versus Fiscal 2007
Net sales of $84.8 million for the year ended January 31, 2008, were $6.3 million, or 6.9%, behind the $91.1 million mark posted one year ago. Lower disaster film shipments of $9.9 million and a decrease in industrial market revenue were partially offset by higher sales of pit liners used in the energy sector and an increase in underslab vapor barrier deliveries. Increased drilling activity due to high oil and gas prices throughout the year accounted for the sales improvement in the energy market, while higher market share and industry growth boosted vapor barrier revenue. In the past, the segment has been able to pass through raw material cost increases in the form of higher selling prices. However, competitive pricing pressures in the construction market did not allow for this type of adjustment in fiscal 2008. Despite higher raw material costs in fiscal 2008, selling prices were down approximately 3% from fiscal 2007 because of lower product pricing.
Fiscal 2008 operating income of $17.7 million fell behind the prior year by $5.8 million, or 24.7%. In addition, gross profit as a percent of sales dropped from 29.4% to 24.8%. For the quarter ended January 31, 2008, operating income of $3.4 million was down $914,000, or 21.2%, compared with one year earlier. Profits and margins have been negatively affected by a more competitive pricing environment, as higher input costs have not equated to increased selling prices due to excess film capacity in the marketplace. Besides higher raw material costs, the segment also experienced increased depreciation expense and start-up costs associated with the new extruders placed into service during the first and second quarters of fiscal 2008. Fiscal 2008 selling expenses of $3.4 million were even with last year, reflecting lower personnel costs offset by increased product development expense.
2006 2007 2008 2006 2007 2008
ENGINEERED FILMS Operating Net Sales Income (dollars in millions) (dollars in millions)
$82.8$91.1
$84.8$19.9
$23.4
$17.7
22 2008 ANNUAL REPORT
FINANCIAL REVIEW AND ANALYSIS (continued)
Fiscal 2007 versus Fiscal 2006
Fiscal 2007 net sales of $91.1 million grew 10.0%, or $8.3 million, from $82.8 million reported for fiscal 2006. Sales of pit lining and construction films posted significant revenue growth for fiscal 2007, but were partially offset with decreased sales activity in the manufactured housing and disaster film markets. Fiscal 2007 disaster film sales totaled $9.9 million versus $11.4 million one year earlier. Selling price adjustments positively affected the fiscal 2007 sales level. The amount of sales attributable to higher product pricing (and not due to an increase in volume) was estimated to be about 8% of total fiscal 2007 reported sales.
Operating income in fiscal 2007 climbed to $23.4 million, up $3.5 million, or 17.7%. Gross profit as a percentage of net sales increased from 27.6% in fiscal 2006 to 29.4%. Higher sales and favorable resin costs contributed to the profit growth and higher margin percentage. A rise in fiscal 2007 selling expenses partially offset the positive impact of the segment’s higher sales level and favorable material costs. Fiscal 2007 selling expenses exceeded the prior year because of higher personnel costs and an increased trade show presence to support the segment’s expanded product offerings and manufacturing capabilities.
Prospects
Engineered Films is expected to generate double-digit sales growth in the upcoming year. However, operating income is not anticipated to grow at the same pace, as the current pricing environment is expected to continue into fiscal 2009. Management believes that the recent investments in extrusion capacity will allow this segment to expand its product offerings and open new markets, but notes that it generally takes two-to-three years to fully utilize new extrusion capacity. The degree of the continuing downturn in construction activity and the opportunity to sell disaster film in fiscal 2009 represent significant risk and upside, respectively, to the current outlook.
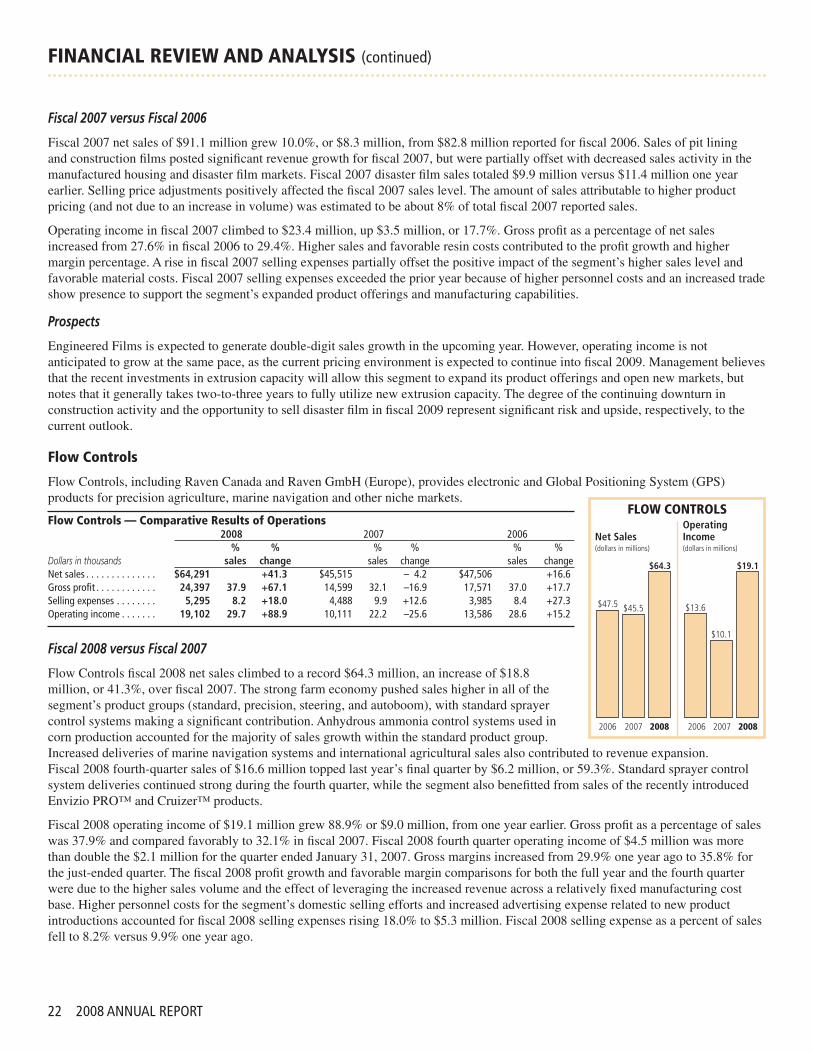
Flow Controls
Flow Controls, including Raven Canada and Raven GmbH (Europe), provides electronic and Global Positioning System (GPS) products for precision agriculture, marine navigation and other niche markets.
Flow Controls — Comparative Results of Operations 2008 2007 2006 % % % % % % Dollars in thousands sales change sales change sales changeNet sales . . . . . . . . . . . . . . $64,291 +41.3 $45,5�5 – 4 .2 $47,506 +�6 .6Gross profit . . . . . . . . . . . . 24,397 37.9 +67.1 �4,599 32 .� –�6 .9 �7,57� 37 .0 +�7 .7Selling expenses . . . . . . . . 5,295 8.2 +18.0 4,488 9 .9 +�2 .6 3,985 8 .4 +27 .3Operating income . . . . . . . 19,102 29.7 +88.9 �0,��� 22 .2 –25 .6 �3,586 28 .6 +�5 .2
Fiscal 2008 versus Fiscal 2007
Flow Controls fiscal 2008 net sales climbed to a record $64.3 million, an increase of $18.8 million, or 41.3%, over fiscal 2007. The strong farm economy pushed sales higher in all of the segment’s product groups (standard, precision, steering, and autoboom), with standard sprayer control systems making a significant contribution. Anhydrous ammonia control systems used in corn production accounted for the majority of sales growth within the standard product group. Increased deliveries of marine navigation systems and international agricultural sales also contributed to revenue expansion. Fiscal 2008 fourth-quarter sales of $16.6 million topped last year’s final quarter by $6.2 million, or 59.3%. Standard sprayer control system deliveries continued strong during the fourth quarter, while the segment also benefitted from sales of the recently introduced Envizio PRO™ and Cruizer™ products.
Fiscal 2008 operating income of $19.1 million grew 88.9% or $9.0 million, from one year earlier. Gross profit as a percentage of sales was 37.9% and compared favorably to 32.1% in fiscal 2007. Fiscal 2008 fourth quarter operating income of $4.5 million was more than double the $2.1 million for the quarter ended January 31, 2007. Gross margins increased from 29.9% one year ago to 35.8% for the just-ended quarter. The fiscal 2008 profit growth and favorable margin comparisons for both the full year and the fourth quarter were due to the higher sales volume and the effect of leveraging the increased revenue across a relatively fixed manufacturing cost base. Higher personnel costs for the segment’s domestic selling efforts and increased advertising expense related to new product introductions accounted for fiscal 2008 selling expenses rising 18.0% to $5.3 million. Fiscal 2008 selling expense as a percent of sales fell to 8.2% versus 9.9% one year ago.
2006 2007 2008 2006 2007 2008
FLOW CONTROLS Operating Net Sales Income (dollars in millions) (dollars in millions)
$47.5 $45.5
$64.3
$13.6
$10.1
$19.1
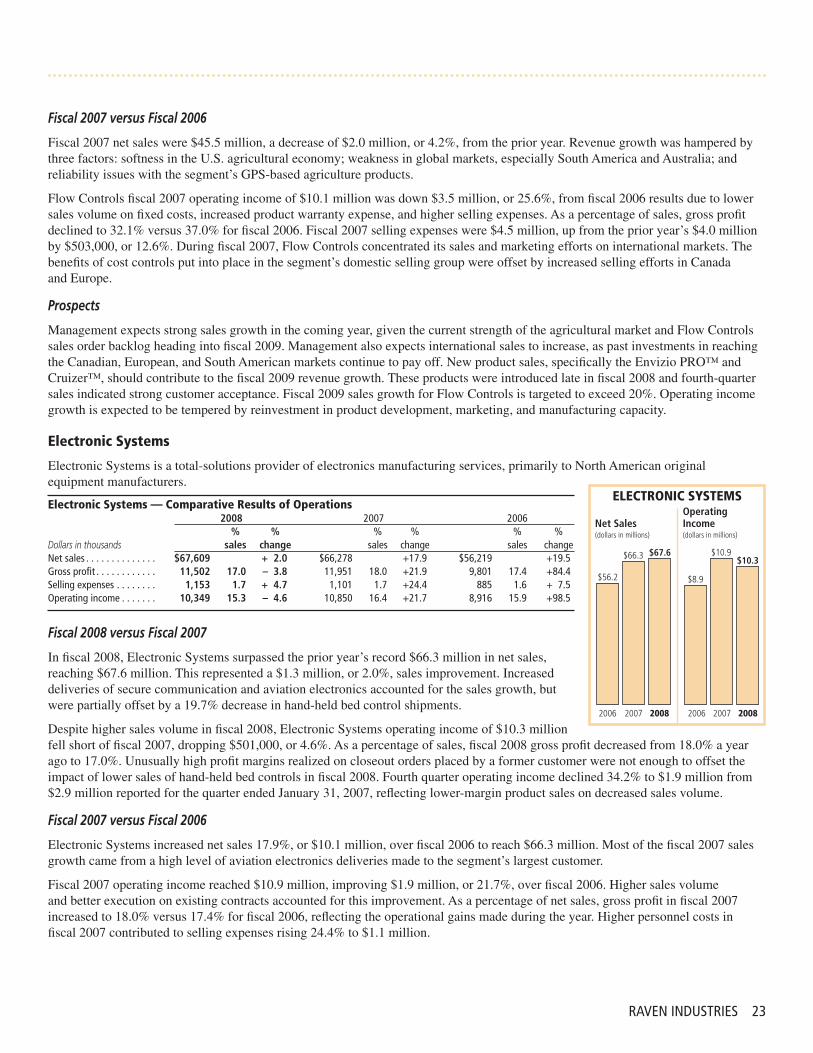
RAVEN INDUSTRIES 23
Fiscal 2007 versus Fiscal 2006
Fiscal 2007 net sales were $45.5 million, a decrease of $2.0 million, or 4.2%, from the prior year. Revenue growth was hampered by three factors: softness in the U.S. agricultural economy; weakness in global markets, especially South America and Australia; and reliability issues with the segment’s GPS-based agriculture products.
Flow Controls fiscal 2007 operating income of $10.1 million was down $3.5 million, or 25.6%, from fiscal 2006 results due to lower sales volume on fixed costs, increased product warranty expense, and higher selling expenses. As a percentage of sales, gross profit declined to 32.1% versus 37.0% for fiscal 2006. Fiscal 2007 selling expenses were $4.5 million, up from the prior year’s $4.0 million by $503,000, or 12.6%. During fiscal 2007, Flow Controls concentrated its sales and marketing efforts on international markets. The benefits of cost controls put into place in the segment’s domestic selling group were offset by increased selling efforts in Canada and Europe.
Prospects
Management expects strong sales growth in the coming year, given the current strength of the agricultural market and Flow Controls sales order backlog heading into fiscal 2009. Management also expects international sales to increase, as past investments in reaching the Canadian, European, and South American markets continue to pay off. New product sales, specifically the Envizio PRO™ and Cruizer™, should contribute to the fiscal 2009 revenue growth. These products were introduced late in fiscal 2008 and fourth-quarter sales indicated strong customer acceptance. Fiscal 2009 sales growth for Flow Controls is targeted to exceed 20%. Operating income growth is expected to be tempered by reinvestment in product development, marketing, and manufacturing capacity.
Electronic Systems
Electronic Systems is a total-solutions provider of electronics manufacturing services, primarily to North American original equipment manufacturers.
Electronic Systems — Comparative Results of Operations 2008 2007 2006 % % % % % % Dollars in thousands sales change sales change sales changeNet sales . . . . . . . . . . . . . . $67,609 + 2.0 $66,278 +�7 .9 $56,2�9 +�9 .5Gross profit . . . . . . . . . . . . 11,502 17.0 – 3.8 ��,95� �8 .0 +2� .9 9,80� �7 .4 +84 .4Selling expenses . . . . . . . . 1,153 1.7 + 4.7 �,�0� � .7 +24 .4 885 � .6 + 7 .5Operating income . . . . . . . 10,349 15.3 – 4.6 �0,850 �6 .4 +2� .7 8,9�6 �5 .9 +98 .5
Fiscal 2008 versus Fiscal 2007
In fiscal 2008, Electronic Systems surpassed the prior year’s record $66.3 million in net sales, reaching $67.6 million. This represented a $1.3 million, or 2.0%, sales improvement. Increased deliveries of secure communication and aviation electronics accounted for the sales growth, but were partially offset by a 19.7% decrease in hand-held bed control shipments.
Despite higher sales volume in fiscal 2008, Electronic Systems operating income of $10.3 million fell short of fiscal 2007, dropping $501,000, or 4.6%. As a percentage of sales, fiscal 2008 gross profit decreased from 18.0% a year ago to 17.0%. Unusually high profit margins realized on closeout orders placed by a former customer were not enough to offset the impact of lower sales of hand-held bed controls in fiscal 2008. Fourth quarter operating income declined 34.2% to $1.9 million from $2.9 million reported for the quarter ended January 31, 2007, reflecting lower-margin product sales on decreased sales volume.
Fiscal 2007 versus Fiscal 2006
Electronic Systems increased net sales 17.9%, or $10.1 million, over fiscal 2006 to reach $66.3 million. Most of the fiscal 2007 sales growth came from a high level of aviation electronics deliveries made to the segment’s largest customer.
Fiscal 2007 operating income reached $10.9 million, improving $1.9 million, or 21.7%, over fiscal 2006. Higher sales volume and better execution on existing contracts accounted for this improvement. As a percentage of net sales, gross profit in fiscal 2007 increased to 18.0% versus 17.4% for fiscal 2006, reflecting the operational gains made during the year. Higher personnel costs in fiscal 2007 contributed to selling expenses rising 24.4% to $1.1 million.
2006 2007 2008 2006 2007 2008
ELECTRONIC SYSTEMS Operating Net Sales Income (dollars in millions) (dollars in millions)
$56.2
$66.3 $67.6
$8.9
$10.9$10.3

24 2008 ANNUAL REPORT
FINANCIAL REVIEW AND ANALYSIS (continued)
Prospects
Management anticipates fiscal 2009 net sales to be down less than 10% when compared with fiscal 2008. The loss of approximately $7 million of business, resulting from a customer being acquired and moving its manufacturing to another supplier, will be difficult to replace. The slowdown in demand for hand-held bed controls is also expected to continue into fiscal 2009. These revenue downturns are expected to be partially offset by additional sales of secure communication and aviation electronics. Margins are expected to decrease due to unfavorable product mix and the impact of fixed costs on a lower revenue base. Electronic Systems operating income is expected to decline significantly in the first quarter of fiscal 2009, leading to lower full-year operating income.
Aerostar
The Aerostar segment manufactures military parachutes, protective wear, custom-shaped inflatable products, and high-altitude balloons for public and commercial research.
Aerostar — Comparative Results of Operations 2008 2007 2006 % % % % % % Dollars in thousands sales change sales change sales changeNet sales . . . . . . . . . . . . . . $17,274 + 17.9 $�4,654 –�8 .6 $�8,009 –�6 .8Gross profit . . . . . . . . . . . . 2,209 12.8 + 44.5 �,529 �0 .4 –49 .7 3,04� �6 .9 –33 .4Selling expenses . . . . . . . . 703 4.1 – 14.5 822 5 .6 – 9 .5 908 5 .0 – 4 .9Operating income . . . . . . . 1,506 8.7 +113.0 707 4 .8 –66 .9 2,�33 �� .8 –40 .9
Fiscal 2008 versus Fiscal 2007
Fiscal 2008 net sales of $17.3 million increased $2.6 million, or 17.9%, from fiscal 2007. Higher research balloon and parachute sales accounted for the growth. Fiscal 2008 research balloon sales activity included more international deliveries. In addition, shipments began under the segment’s $14 million MC-6 parachute contract in the fourth quarter of fiscal 2008, with $2.1 million of parachute revenue recorded in that quarter.
Operating income more than doubled in fiscal 2008, hitting $1.5 million versus $707,000 one year earlier, with gross profit margins improving from last year’s 10.4% to 12.8%. Higher research balloon profits due to increased volume and improved results on the parachute contract contributed to operating income growth in fiscal 2008. Fiscal 2008 selling expenses of $703,000 declined $119,000, or 14.5%, compared with one year earlier. There were no expenses incurred during the current year for hot-air balloon selling efforts, reflecting the decision to exit this business in fiscal 2007.
Fiscal 2007 versus Fiscal 2006
Aerostar’s fiscal 2007 net sales of $14.7 million were $3.4 million, or 18.6%, lower than in fiscal 2006. Higher sales of commercial inflatable products during fiscal 2007 were offset by lower parachute product deliveries and a decline in research balloon revenue.
Fiscal 2007 operating income of $707,000 decreased $1.4 million from fiscal 2006. The lack of parachute business and a decrease in research balloon profits were the main factors in the operating income decline. Under-utilized plant capacity caused the fiscal 2007 gross margin to drop 6.5 percentage points, decreasing to 10.4%. Selling expenses of $822,000 were down 9.5%, as cost controls were put into place at the beginning of fiscal 2007.
Prospects
Management expected fiscal 2008 to be a stronger turnaround year for Aerostar, but as government-related design issues delayed deliveries on the MC-6 parachute contract until the fourth quarter, fiscal 2008 operating results did not fulfill expectations. During fiscal 2008, Aerostar received an add-on to the MC-6 Army parachute contract for another $7.3 million, bringing the total parachute contract order to more than $14 million. Start-up costs under the contract were incurred during fiscal 2008, and as a result, Aerostar should be well-positioned to take advantage of full production during fiscal 2009. Shipments are expected to accelerate rapidly, with Aerostar in a position to more than redouble its operating income in the coming year. Fiscal 2009 sales are targeted to increase approximately 45%, due mainly to higher parachute revenues.
2006 2007 2008 2006 2007 2008
AEROSTAR Operating Net Sales Income (dollars in millions) (dollars in millions)
$18.0
$14.7
$17.3 $2.1
$0.7
$1.5
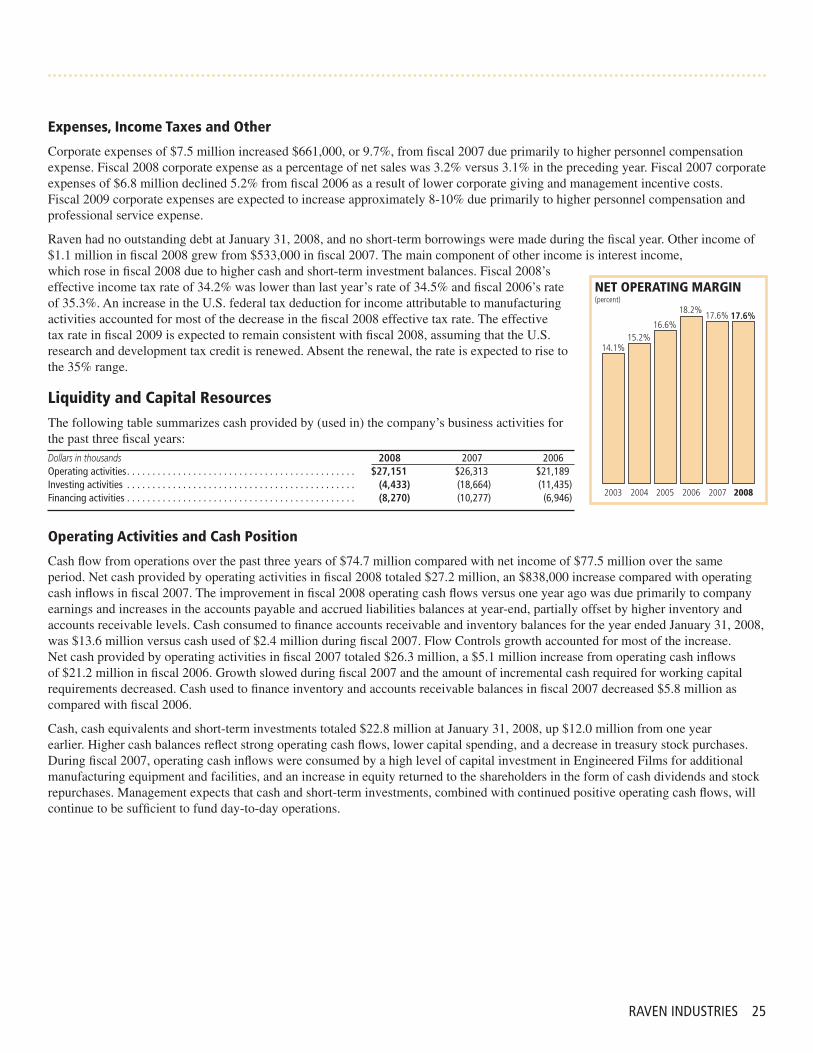
RAVEN INDUSTRIES 25
Expenses, Income Taxes and Other
Corporate expenses of $7.5 million increased $661,000, or 9.7%, from fiscal 2007 due primarily to higher personnel compensation expense. Fiscal 2008 corporate expense as a percentage of net sales was 3.2% versus 3.1% in the preceding year. Fiscal 2007 corporate expenses of $6.8 million declined 5.2% from fiscal 2006 as a result of lower corporate giving and management incentive costs. Fiscal 2009 corporate expenses are expected to increase approximately 8-10% due primarily to higher personnel compensation and professional service expense.
Raven had no outstanding debt at January 31, 2008, and no short-term borrowings were made during the fiscal year. Other income of $1.1 million in fiscal 2008 grew from $533,000 in fiscal 2007. The main component of other income is interest income, which rose in fiscal 2008 due to higher cash and short-term investment balances. Fiscal 2008’s effective income tax rate of 34.2% was lower than last year’s rate of 34.5% and fiscal 2006’s rate of 35.3%. An increase in the U.S. federal tax deduction for income attributable to manufacturing activities accounted for most of the decrease in the fiscal 2008 effective tax rate. The effective tax rate in fiscal 2009 is expected to remain consistent with fiscal 2008, assuming that the U.S. research and development tax credit is renewed. Absent the renewal, the rate is expected to rise to the 35% range.
Liquidity and Capital Resources
The following table summarizes cash provided by (used in) the company’s business activities for the past three fiscal years:
Dollars in thousands 2008 2007 2006Operating activities . . . . . . . . . . . . . . . . . . . . . . . . . . . . . . . . . . . . . . . . . . . . . $27,151 $26,3�3 $2�,�89Investing activities . . . . . . . . . . . . . . . . . . . . . . . . . . . . . . . . . . . . . . . . . . . . . (4,433) (�8,664) (��,435)Financing activities . . . . . . . . . . . . . . . . . . . . . . . . . . . . . . . . . . . . . . . . . . . . . (8,270) (�0,277) (6,946)
Operating Activities and Cash Position
Cash flow from operations over the past three years of $74.7 million compared with net income of $77.5 million over the same period. Net cash provided by operating activities in fiscal 2008 totaled $27.2 million, an $838,000 increase compared with operating cash inflows in fiscal 2007. The improvement in fiscal 2008 operating cash flows versus one year ago was due primarily to company earnings and increases in the accounts payable and accrued liabilities balances at year-end, partially offset by higher inventory and accounts receivable levels. Cash consumed to finance accounts receivable and inventory balances for the year ended January 31, 2008, was $13.6 million versus cash used of $2.4 million during fiscal 2007. Flow Controls growth accounted for most of the increase. Net cash provided by operating activities in fiscal 2007 totaled $26.3 million, a $5.1 million increase from operating cash inflows of $21.2 million in fiscal 2006. Growth slowed during fiscal 2007 and the amount of incremental cash required for working capital requirements decreased. Cash used to finance inventory and accounts receivable balances in fiscal 2007 decreased $5.8 million as compared with fiscal 2006.
Cash, cash equivalents and short-term investments totaled $22.8 million at January 31, 2008, up $12.0 million from one year earlier. Higher cash balances reflect strong operating cash flows, lower capital spending, and a decrease in treasury stock purchases. During fiscal 2007, operating cash inflows were consumed by a high level of capital investment in Engineered Films for additional manufacturing equipment and facilities, and an increase in equity returned to the shareholders in the form of cash dividends and stock repurchases. Management expects that cash and short-term investments, combined with continued positive operating cash flows, will continue to be sufficient to fund day-to-day operations.
2003 2004 2005 2006 2007 2008
NET OPERATING MARGIN(percent)
14.1%15.2%
16.6%
18.2%17.6% 17.6%

26 2008 ANNUAL REPORT
FINANCIAL REVIEW AND ANALYSIS (continued)
Investing Activities
Net cash used in investing activities in fiscal 2008 totaled $4.4 million versus $18.7 million in fiscal 2007. Fiscal 2008 capital expenditures of $6.6 million decreased $9.9 million from the prior year’s $16.5 million, when $13.3 million was invested in Engineered Films for additional manufacturing capacity and facilities. At the end of fiscal 2008, $2.5 million of short-term investments matured, were converted to cash, and are being reinvested in the first quarter of fiscal 2009. Net cash used in investing activities in fiscal 2007 totaled $18.7 million, up from $11.4 million in fiscal 2006. Besides the significant amount of capital expenditures made, fiscal 2007 investing activities also included placing an additional $2.0 million of cash into short-term investments.
Financing Activities
Net cash used in financing activities in fiscal 2008 of $8.3 million decreased $2.0 million from the $10.3 million consumed in fiscal 2007. No short-term borrowings were required during fiscal 2008. The company’s main financing activities continue to be the payment of dividends and
the repurchase of company stock. In fiscal 2008, Raven increased its quarterly dividend on a per-share basis for the 21st-consecutive year, with quarterly dividend payments of 11 cents per share increasing 22.2% from the prior year. Treasury share purchases totaled $592,000 during fiscal 2008 and were $3.6 million lower than the prior year. In fiscal 2008, 20,150 shares were purchased at an average share price of $29.42. Net cash used in financing activities in fiscal 2007 of $10.3 million grew $3.3 million from the $6.9 million used in fiscal 2006. The increase in cash used in financing activities during fiscal 2007 was due mainly to a 28.7% rise in dividend payments and $2.5 million more of treasury stock purchases.
Off-balance Sheet Arrangements and Contractual Obligations
As of January 31, 2008, the company is obligated to make cash payments in connection with its non-cancelable operating leases for facilities and equipment and unconditional purchase obligations, primarily for raw materials, in the amounts listed below. The company has no off-balance sheet debt or other unrecorded obligations other than the items noted in the following table. In addition to the commitments noted there, standby letters of credit totaling $1.2 million have been issued, primarily to support self-insured workers compensation bonding requirements. In the event the bank chooses not to renew the company’s line of credit, the letters of credit would cease and alternative methods of support for the insurance obligations would be necessary, would be more expensive, and would require additional cash outlays. Management believes the chances of this are remote. A summary of the obligations and commitments at January 31, 2008, and for the next five years is shown below.
More Less than �-3 3-5 than Dollars in thousands Total � year years years 5 yearsContractual Obligations:Line of credit(a) . . . . . . . . . . . . . . . . . . . . . . . . . . . . . . . . . . . . . . . . . . $ — $ — $ — $ — $ —Operating leases . . . . . . . . . . . . . . . . . . . . . . . . . . . . . . . . . . . . . . . . . 427 �73 254 — —Postretirement benefit obligation . . . . . . . . . . . . . . . . . . . . . . . . . . . . 5,447 20� 464 548 4,234Unconditional purchase obligations . . . . . . . . . . . . . . . . . . . . . . . . . . 38,3�8 38,3�8 — — —Uncertain tax positions(b) . . . . . . . . . . . . . . . . . . . . . . . . . . . . . . . . . . . — — — — — $44,�92 $38,692 $7�8 $548 $4,234
(a) $8.0 million line bears interest at 5.00% as of January 31, 2008, and expires July 2008. The line of credit is reduced by outstanding letters of credit totaling $1.2 million.
(b) The total liability for uncertain tax positions under FIN 48 at January 31, 2008, was $2.2 million. The company is not able to reasonably estimate the timing of future payments relating to non-current tax benefits.
2003 2004 2005 2006 2007 2008
RETURN ON AVERAGE ASSETS(percent)
15.9%
18.2%
21.3%
24.9%
22.5%20.8%
2003 2004 2005 2006 2007 2008
CASH FLOWS FROM OPERATIONS(dollars in millions)
$12.7
$19.7 $18.9
$21.2
$26.3$27.2

RAVEN INDUSTRIES 27
Capital Requirements
Raven maintains an excellent financial condition and capacity for growth. Management continues to look for opportunities to expand its core businesses through acquisitions or internal growth. The company has the capacity to secure additional financing and will do so if the appropriate strategic opportunity presents itself. Capital expenditures for fiscal 2009 are expected to be in the $8 million range. The company intends to return approximately 30% of its earnings to shareholders in the form of quarterly dividends. Stock repurchases are anticipated to continue as a way to return additional cash to shareholders and increase balance sheet leverage. Cash generated from operations and the availability of cash under existing credit facilities should be sufficient to fund these initiatives. If stock repurchase or investment opportunities do not materialize and cash balances continue to build, management intends to pay a special dividend by the end of fiscal 2009.
Critical Accounting Policies and New Accounting Standards
Critical Accounting Policies
Critical accounting policies are those that require the application of judgment when valuing assets and liabilities on the company’s balance sheet. These policies are discussed below, because a fluctuation in actual results versus expected results could materially affect operating results, and because the policies require significant judgments and estimates to be made. Accounting related to these policies is initially based on best estimates at the time of original entry in the accounting records. Adjustments are periodically recorded when the company’s actual experience differs from the expected experience underlying the estimates. These adjustments could be material if experience were to change significantly in a short period of time. The company does not enter into derivatives or other financial instruments for trading or speculative purposes. However, Raven has used derivative financial instruments to manage the economic impact of fluctuations in currency exchange rates on transactions that are denominated in currency other than its functional currency, which is the U.S. dollar. The use of these financial instruments had no material effect on the company’s financial condition, results of operations or cash flows.
Inventories
Raven’s most significant accounting judgment is determining inventory value at the lower of cost or market. The company estimates inventory valuation each quarter. Typically, when a product reaches the end of its lifecycle, inventory value declines slowly or the product has alternative uses. Management uses its manufacturing resources planning data to help determine if inventory is slow-moving or has become obsolete due to an engineering change. The company closely reviews items that have balances in excess of the prior year’s requirements or that have been dropped from production requirements. Despite these reviews, technological or strategic decisions made by management or the company’s customers may result in unexpected excess material. In Electronic Systems, the company typically has recourse to customers for obsolete or excess material. When Electronic Systems customers authorize inventory purchases, especially with long lead-time items, they are required to take delivery of unused material or compensate the company accordingly. In every operating unit of the company, management must manage obsolete inventory risk. The accounting judgment ultimately made is an evaluation of the success that management will have in controlling inventory risk and mitigating the impact of obsolescence when it does occur.

28 2008 ANNUAL REPORT
FINANCIAL REVIEW AND ANALYSIS (continued)
Warranty
Estimated warranty liability costs are based on historical warranty costs and average time elapsed between purchases and returns for each business segment. Warranty issues that are unusual in nature are accrued for individually.
Allowance for Doubtful Accounts
Determining the level of the allowance for doubtful accounts requires management’s best estimate of the amount of probable credit losses based on historical writeoff experience by segment, and an estimate of the collectibility of any known problem accounts. Factors that are considered beyond historical experience include the length of time the receivables are outstanding, the current business climate, and the customer’s current financial condition.
Revenue Recognition
The company recognizes and records revenue when products are shipped because there is persuasive evidence of an arrangement, the sales price is determinable, collectibility is reasonably assured, and delivery has occurred. Estimated returns, sales allowances or warranty charges are recognized upon shipment of a product. The company sells directly to customers or distributors that incur the expense and commitment for any post-sale obligations beyond stated warranty terms.
Self-insurance Reserves
Raven purchases insurance with deductibles for product liability; general insurance, including aviation product liability; and workers’ compensation. Third-party insurance is carried for what is believed to be the major portion of potential exposure. The company has established accruals for potential uninsured claims, including estimated costs and legal fees. Management considers these accruals adequate, although a substantial change in the number and/or severity of claims would result in materially different amounts.
Goodwill and Long-lived Assets
Management periodically assesses goodwill and other long-lived assets for impairment, or more frequently if events or changes in circumstances indicate that an asset might be impaired, using fair value measurement techniques. For goodwill, Raven performs impairment reviews annually by reporting units, which are the company’s reportable segments. The one exception is Aerostar’s high-altitude research balloon operation, which is evaluated independently from Aerostar’s other operations. Estimates of fair value are primarily determined using discounted cash flows, market comparisons and recent transactions. These valuation methodologies use significant estimates and assumptions, which include projected future cash flows, including timing and the risks inherent in future cash flows, perpetual growth rates, and determination of appropriate market comparables.
Uncertain Tax Positions
Accounting for tax positions requires judgments, including estimating reserves for uncertainties associated with the interpretation of income tax laws and regulations, and the resolution of tax positions with tax authorities after discussions and negotiations. The ultimate outcome of these matters could result in material favorable or unfavorable adjustments to the consolidated financial statements.
2003 2004 2005 2006 2007 2008
BOOK VALUE PER SHARE(dollars)
$3.21$3.68 $3.67
$4.67
$5.45
$6.52

RAVEN INDUSTRIES 29
New Accounting Standards
In September 2006, the Financial Accounting Standards Board (FASB) issued SFAS No. 157, Fair Value Measurement. The standard provides guidance for using fair value to measure assets and liabilities. SFAS No. 157 clarifies the principle that fair value should be based on the assumptions market participants would use when pricing an asset or liability and establishes a fair value hierarchy that prioritizes the information used to develop those assumptions. Under the standard, fair value measurements would be separately disclosed by level within the fair value hierarchy. The statement is effective as of the beginning of the company’s 2009 fiscal year. The company does not expect the implementation of SFAS No. 157 to have a material impact on its consolidated results of operations, financial condition or cash flows.
In February 2007, the FASB issued SFAS No. 159, The Fair Value Option for Financial Assets and Financial Liabilities. SFAS No. 159 permits companies to choose to measure many financial instruments and certain other items at fair value. SFAS No. 159 is effective for the beginning of the company’s 2009 fiscal year. The company does not expect the provisions of SFAS No. 159 to have a material impact on its consolidated results of operations, financial condition, or cash flows.
In December 2007, the FASB issued SFAS No. 141(R), Business Combinations. SFAS No. 141(R) requires an entity to recognize the assets acquired, liabilities assumed, contractual contingencies, and contingent consideration at their fair value on the acquisition date. It also requires acquisition-related costs to be expensed as incurred, restructuring costs to generally be expensed in periods subsequent to the acquisition date, and changes in accounting for deferred tax asset valuation allowances and acquired income tax uncertainties after the measurement period to impact income tax expense. The adoption of SFAS No. 141(R) will change the company’s accounting treatment for business combinations on a prospective basis beginning February 1, 2009.
In December 2007, the FASB issued SFAS No. 160, Noncontrolling Interests in Consolidated Financial Statements. SFAS No. 160 changes the accounting and reporting for minority interests, which will be characterized as non-controlling interests and classified as a component of equity. The adoption of SFAS No. 160 is effective on a prospective basis beginning February 1, 2009. The company does not expect the provisions of SFAS No. 160 to have a material impact on its consolidated results of operations, financial condition, or cash flows.
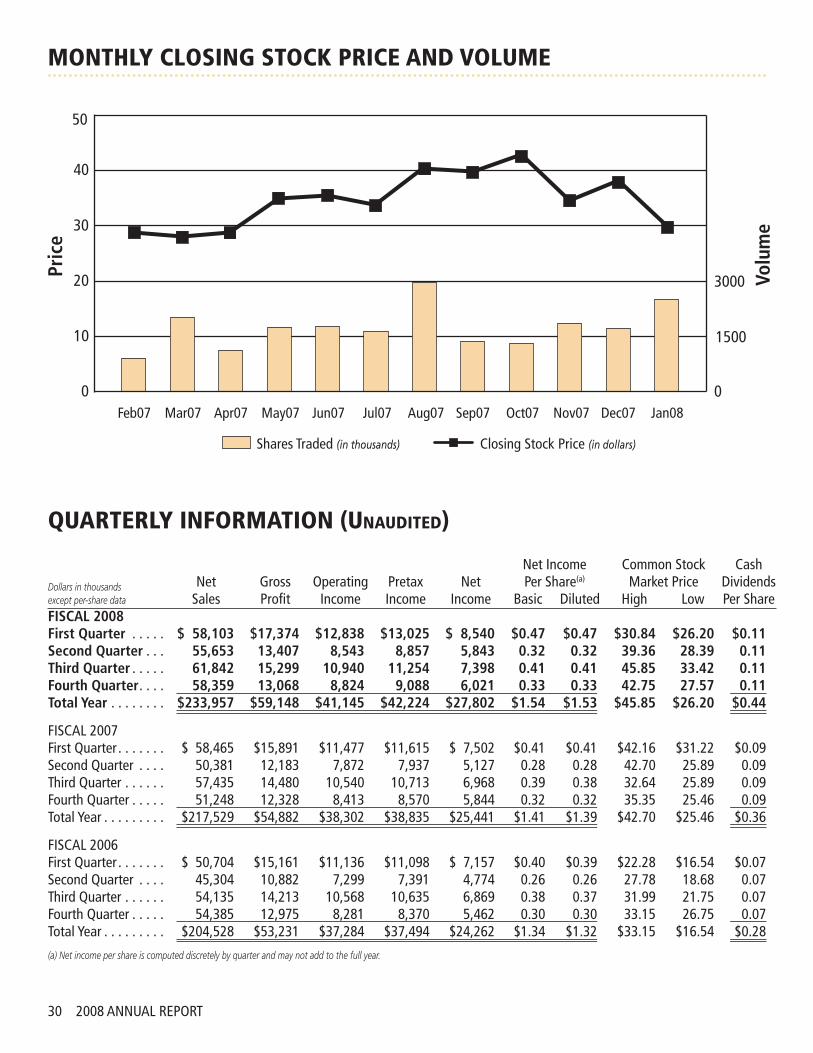
30 2008 ANNUAL REPORT
MONTHLY CLOSING STOCK PRICE AND VOLUME
QUARTERLY INFORMATION (Unaudited)
Net Income Common Stock Cash Dollars in thousands Net Gross Operating Pretax Net Per Share(a) Market Price Dividendsexcept per-share data Sales Profit Income Income Income Basic Diluted High Low Per ShareFISCAL 2008First Quarter . . . . . $ 58,103 $17,374 $12,838 $13,025 $ 8,540 $0.47 $0.47 $30.84 $26.20 $0.11Second Quarter . . . 55,653 13,407 8,543 8,857 5,843 0.32 0.32 39.36 28.39 0.11Third Quarter . . . . . 61,842 15,299 10,940 11,254 7,398 0.41 0.41 45.85 33.42 0.11Fourth Quarter . . . . 58,359 13,068 8,824 9,088 6,021 0.33 0.33 42.75 27.57 0.11Total Year . . . . . . . . $233,957 $59,148 $41,145 $42,224 $27,802 $1.54 $1.53 $45.85 $26.20 $0.44
FISCAL 2007First Quarter . . . . . . . $ 58,465 $�5,89� $��,477 $��,6�5 $ 7,502 $0 .4� $0 .4� $42 .�6 $3� .22 $0 .09Second Quarter . . . . 50,38� �2,�83 7,872 7,937 5,�27 0 .28 0 .28 42 .70 25 .89 0 .09Third Quarter . . . . . . 57,435 �4,480 �0,540 �0,7�3 6,968 0 .39 0 .38 32 .64 25 .89 0 .09Fourth Quarter . . . . . 5�,248 �2,328 8,4�3 8,570 5,844 0 .32 0 .32 35 .35 25 .46 0 .09Total Year . . . . . . . . . $2�7,529 $54,882 $38,302 $38,835 $25,44� $� .4� $� .39 $42 .70 $25 .46 $0 .36
FISCAL 2006First Quarter . . . . . . . $ 50,704 $�5,�6� $��,�36 $��,098 $ 7,�57 $0 .40 $0 .39 $22 .28 $�6 .54 $0 .07Second Quarter . . . . 45,304 �0,882 7,299 7,39� 4,774 0 .26 0 .26 27 .78 �8 .68 0 .07Third Quarter . . . . . . 54,�35 �4,2�3 �0,568 �0,635 6,869 0 .38 0 .37 3� .99 2� .75 0 .07Fourth Quarter . . . . . 54,385 �2,975 8,28� 8,370 5,462 0 .30 0 .30 33 .�5 26 .75 0 .07Total Year . . . . . . . . . $204,528 $53,23� $37,284 $37,494 $24,262 $� .34 $� .32 $33 .�5 $�6 .54 $0 .28
(a) Net income per share is computed discretely by quarter and may not add to the full year.
0
�500
3000
0
�0
20
30
40
50
Feb07 Mar07 Apr07 May07 Jun07 Jul07 Aug07 Sep07 Oct07 Nov07 Dec07 Jan08
Shares Traded (in thousands) Closing Stock Price (in dollars)
Pric
e
Volu
me

RAVEN INDUSTRIES 3�
MANAGEMENT’S REPORT ON INTERNAL CONTROL OVER FINANCIAL REPORTING
Our management is responsible for establishing and maintaining effective internal control over financial reporting as defined in Rule 13a-15(f) of the Securities Exchange Act of 1934. Our internal control over financial reporting is a process designed to provide reasonable assurance regarding the reliability of financial reporting and the preparation of financial statements for external purposes in accordance with generally accepted accounting principles. Our internal control over financial reporting includes those policies and procedures that (i) pertain to the maintenance of records that, in reasonable detail, accurately and fairly reflect the transactions and dispositions of our assets; (ii) provide reasonable assurance that transactions are recorded as necessary to permit preparation of financial statements in accordance with generally accepted accounting principles, and that our receipts and expenditures are being made only in accordance with authorizations of our management and directors; and (iii) provide reasonable assurance regarding prevention or timely detection of unauthorized acquisition, use, or disposition of our assets that could have a material effect on the financial statements.
Because of its inherent limitations, internal control over financial reporting may not prevent or detect misstatements. Also, projections of any evaluation of effectiveness to future periods are subject to the risk that controls may become inadequate because of changes in conditions, or that the degree of compliance with the policies or procedures may deteriorate.
Management has assessed our internal control over financial reporting in relation to criteria described in Internal Control — Integrated Framework, issued by the Committee of Sponsoring Organizations of the Treadway Commission. Based on this assessment using those criteria, we concluded that, as of January 31, 2008, our internal control over financial reporting was effective.
The effectiveness of our internal control over financial reporting as of January 31, 2008, has been audited by PricewaterhouseCoopers LLP, an independent registered public accounting firm, as stated in their report, which appears on page 43 of this Annual Report.
Ronald M. Moquist Thomas Iacarella President & Chief Executive Officer Vice President & Chief Financial Officer
March 20, 2008

32 2008 ANNUAL REPORT
CONSOLIDATED BALANCE SHEETS
As of January 3�Dollars in thousands, except share data 2008 2007 2006ASSETSCurrent assets Cash and cash equivalents . . . . . . . . . . . . . . . . . . . . . . . . . . . . . . . . . $ 21,272 $ 6,783 $ 9,409 Short-term investments . . . . . . . . . . . . . . . . . . . . . . . . . . . . . . . . . . . . 1,500 4,000 2,000 Accounts receivable, net . . . . . . . . . . . . . . . . . . . . . . . . . . . . . . . . . . . 36,538 3�,336 29,290 Inventories, net . . . . . . . . . . . . . . . . . . . . . . . . . . . . . . . . . . . . . . . . . . 36,529 28,07� 27,8�9 Deferred income taxes . . . . . . . . . . . . . . . . . . . . . . . . . . . . . . . . . . . . 2,075 �,76� �,746 Other current assets . . . . . . . . . . . . . . . . . . . . . . . . . . . . . . . . . . . . . . 2,955 �,268 �,08� Total current assets . . . . . . . . . . . . . . . . . . . . . . . . . . . . . . . . . . . . . 100,869 73,2�9 7�,345
Property, plant and equipment, net . . . . . . . . . . . . . . . . . . . . . . . . . . . . . 35,743 36,264 25,602Goodwill . . . . . . . . . . . . . . . . . . . . . . . . . . . . . . . . . . . . . . . . . . . . . . . . . 6,902 6,604 6,40�Other assets, net . . . . . . . . . . . . . . . . . . . . . . . . . . . . . . . . . . . . . . . . . . . 4,347 3,677 2,809Total assets . . . . . . . . . . . . . . . . . . . . . . . . . . . . . . . . . . . . . . . . . . . . . . $147,861 $��9,764 $�06,�57
LIABILITIES AND SHAREHOLDERS’ EQUITYCurrent liabilities Accounts payable . . . . . . . . . . . . . . . . . . . . . . . . . . . . . . . . . . . . . . . . $ 8,374 $ 6,093 $ 8,�79 Accrued liabilities . . . . . . . . . . . . . . . . . . . . . . . . . . . . . . . . . . . . . . . . 12,804 9,579 ��,�54 Customer advances . . . . . . . . . . . . . . . . . . . . . . . . . . . . . . . . . . . . . . . 930 792 7�7 Total current liabilities . . . . . . . . . . . . . . . . . . . . . . . . . . . . . . . . . . 22,108 �6,464 20,050
Other liabilities . . . . . . . . . . . . . . . . . . . . . . . . . . . . . . . . . . . . . . . . . . . . 7,478 5,032 �,7�8Commitments and contingencies Shareholders’ equity . . . . . . . . . . . . . . . . . . . . . . . . . . . . . . . . . . . . . . . . 118,275 98,268 84,389 Common shares, par value $� .00 per share Authorized — �00,000,000 Outstanding — 2008: �8,�20,5�3; 2007: �8,039,223 2006: �8,072,369Total liabilities and shareholders’ equity . . . . . . . . . . . . . . . . . . . . . $147,861 $��9,764 $�06,�57
The accompanying notes are an integral part of the consolidated financial statements.

RAVEN INDUSTRIES 33
CONSOLIDATED STATEMENTS OF INCOME
For the years ended January 3�Dollars in thousands, except per-share data 2008 2007 2006Net sales . . . . . . . . . . . . . . . . . . . . . . . . . . . . . . . . . . . . . . . . . . . . . . . . $233,957 $2�7,529 $204,528
Cost of goods sold . . . . . . . . . . . . . . . . . . . . . . . . . . . . . . . . . . . . . . . . 174,809 �62,647 �5�,297
Gross profit . . . . . . . . . . . . . . . . . . . . . . . . . . . . . . . . . . . . . . . . . . . . 59,148 54,882 53,23�
Selling, general and administrative expenses . . . . . . . . . . . . . . . . . . . . 18,003 �6,580 �5,947
Operating income . . . . . . . . . . . . . . . . . . . . . . . . . . . . . . . . . . . . . . . 41,145 38,302 37,284
Interest income and other, net . . . . . . . . . . . . . . . . . . . . . . . . . . . . . . . (1,079) (533) (2�0)
Income before income taxes . . . . . . . . . . . . . . . . . . . . . . . . . . . . . . . 42,224 38,835 37,494
Income taxes . . . . . . . . . . . . . . . . . . . . . . . . . . . . . . . . . . . . . . . . . . . . . 14,422 �3,394 �3,232
Net income . . . . . . . . . . . . . . . . . . . . . . . . . . . . . . . . . . . . . . . . . . . . $ 27,802 $ 25,44� $ 24,262
Net income per common share: — Basic . . . . . . . . . . . . . . . . . . . . . . . . . . . . . . . . . . . . . . . . . . . . . . $ 1.54 $ � .4� $ � .34 — Diluted . . . . . . . . . . . . . . . . . . . . . . . . . . . . . . . . . . . . . . . . . . . . . $ 1.53 $ � .39 $ � .32
The accompanying notes are an integral part of the consolidated financial statements.

34 2008 ANNUAL REPORT
CONSOLIDATED STATEMENTS OF SHAREHOLDERS’ EQUITY AND COMPREHENSIVE INCOME
Accumulated other $� Par comprehensive common Paid-in Treasury stock Retained incomeDollars in thousands, except per-share data stock capital Shares Cost earnings (loss) TotalBalance January 3�, 2005 . . . . . . . . . . . $ 32,053 $ 765 (�4,053,386) $ (4�,700) $ 74,964 $ — $ 66,082
Net income . . . . . . . . . . . . . . . . . . . . — — — — 24,262 — 24,262 Foreign currency translation . . . . . . . — — — — — �3 �3 Total comprehensive income . . . . . . . 24,275 Cash dividends ($ .28 per share) . . . . — — — — (5,056) — (5,056) Purchase of stock . . . . . . . . . . . . . . . — — (67,800) (�,689) — — (�,689) Stock surrendered upon exercise of stock options . . . . . . . . . . . . . . (27) (689) — — — — (7�6) Employees’ stock options exercised . �68 4�0 — — — — 578 Share-based compensation . . . . . . . . — 485 — — — — 485 Tax benefit from exercise of stock options . . . . . . . . . . . . . . . . — 430 — — — — 430Balance January 3�, 2006 . . . . . . . . . . . 32,�94 �,40� (�4,�2�,�86) (43,389) 94,�70 �3 84,389
Net income . . . . . . . . . . . . . . . . . . . . — — — — 25,44� — 25,44� Foreign currency translation . . . . . . . — — — — — (2�) (2�) Total comprehensive income . . . . . . . 25,420 Adoption of SFAS No . �58, net of tax . . . . . . . . . . . . . . . . . . . — — — — — (�,885) (�,885) Dividends ($ .36 per share) . . . . . . . . — � — — (6,508) — (6,507) Purchase of stock . . . . . . . . . . . . . . . — — (�46,247) (4,20�) — — (4,20�) Stock surrendered upon exercise of stock options . . . . . . . . . . . . . . (28) (854) — — — — (882) Employees’ stock options exercised . �4� 7�8 — — — — 859 Share-based compensation . . . . . . . . — 605 — — — — 605 Tax benefit from exercise of stock options . . . . . . . . . . . . . . . . — 470 — — — — 470Balance January 3�, 2007 . . . . . . . . . . . 32,307 2,34� (�4,267,433) (47,590) ��3,�03 (�,893) 98,268
Net income . . . . . . . . . . . . . . . . . . . . — — — — 27,802 — 27,802 Postretirement benefits, net of $84 income tax . . . . . . . . . . . . . . . — — — — — �56 �56 Foreign currency translation . . . . . . . — — — — — �3� �3� Total comprehensive income . . . . . . . 28,089 Adoption of FIN 48 . . . . . . . . . . . . . . — — — — (7�6) — (7�6) Dividends ($ .44 per share) . . . . . . . . — 4 — — (7,970) — (7,966) Purchase of stock . . . . . . . . . . . . . . . — — (20,�50) (592) — — (592) Stock surrendered upon exercise of stock options . . . . . . . . . . . . . . (47) (�,462) — — — — (�,509) Employees’ stock options exercised . �48 �,�70 — — — — �,3�8 Share-based compensation . . . . . . . . — 904 — — — — 904 Tax benefit from exercise of stock options . . . . . . . . . . . . . . . . — 479 — — — — 479Balance January 31, 2008 . . . . . . . . . $32,408 $3,436 (14,287,583) $(48,182) $132,219 $(1,606) $118,275
The accompanying notes are an integral part of the consolidated financial statements.

RAVEN INDUSTRIES 35
CONSOLIDATED STATEMENTS OF CASH FLOWS
For the years ended January 3�Dollars in thousands 2008 2007 2006Cash flows from operating activities: Net income . . . . . . . . . . . . . . . . . . . . . . . . . . . . . . . . . . . . . . . . . . . . . . . . . . . $27,802 $25,44� $24,262 Adjustments to reconcile net income to net cash provided by operating activities: Depreciation . . . . . . . . . . . . . . . . . . . . . . . . . . . . . . . . . . . . . . . . . . . . . . . . 6,944 5,445 4,684 Amortization of intangible assets . . . . . . . . . . . . . . . . . . . . . . . . . . . . . . . . 400 440 467 Provision for losses on accounts receivable, net of recoveries . . . . . . . . . . 91 40 78 Deferred income taxes . . . . . . . . . . . . . . . . . . . . . . . . . . . . . . . . . . . . . . . . (779) (293) (809) Share-based compensation expense . . . . . . . . . . . . . . . . . . . . . . . . . . . . . . 904 605 485 Change in operating assets and liabilities, net of effects from acquisition and disposition of businesses and assets . . . . . . . . . . . . . . . . . . . . . . . . (8,187) (5,380) (8,086) Other operating activities, net . . . . . . . . . . . . . . . . . . . . . . . . . . . . . . . . . . (24) �5 �08 Net cash provided by operating activities . . . . . . . . . . . . . . . . . . . . . . . . . . . . 27,151 26,3�3 2�,�89
Cash flows from investing activities: Capital expenditures . . . . . . . . . . . . . . . . . . . . . . . . . . . . . . . . . . . . . . . . . . . . (6,635) (�6,522) (�0,358) Purchase of short-term investments . . . . . . . . . . . . . . . . . . . . . . . . . . . . . . . . (3,100) (6,000) (4,500) Sale of short-term investments . . . . . . . . . . . . . . . . . . . . . . . . . . . . . . . . . . . . 5,600 4,000 5,500 Acquisition of business . . . . . . . . . . . . . . . . . . . . . . . . . . . . . . . . . . . . . . . . . (269) (203) (2,828) Sale of unconsolidated affiliate . . . . . . . . . . . . . . . . . . . . . . . . . . . . . . . . . . . . — — 650 Other investing activities, net . . . . . . . . . . . . . . . . . . . . . . . . . . . . . . . . . . . . . (29) 6� �0� Net cash used in investing activities . . . . . . . . . . . . . . . . . . . . . . . . . . . . . . . . (4,433) (�8,664) (��,435)
Cash flows from financing activities: Proceeds from borrowing under line of credit . . . . . . . . . . . . . . . . . . . . . . . . . — — 4,500 Repayment of borrowing under line of credit . . . . . . . . . . . . . . . . . . . . . . . . . — — (4,500) Dividends paid . . . . . . . . . . . . . . . . . . . . . . . . . . . . . . . . . . . . . . . . . . . . . . . . (7,966) (6,507) (5,056) Purchases of treasury stock . . . . . . . . . . . . . . . . . . . . . . . . . . . . . . . . . . . . . . (592) (4,20�) (�,689) Excess tax benefit on stock option exercises . . . . . . . . . . . . . . . . . . . . . . . . . 479 470 — Other financing activities, net . . . . . . . . . . . . . . . . . . . . . . . . . . . . . . . . . . . . . (191) (39) (20�) Net cash used in financing activities . . . . . . . . . . . . . . . . . . . . . . . . . . . . . . . . (8,270) (�0,277) (6,946)
Effect of exchange rate changes on cash . . . . . . . . . . . . . . . . . . . . . . . . . . . . 41 2 (�8)
Net increase (decrease) in cash and cash equivalents . . . . . . . . . . . . . . . . . . . . . 14,489 (2,626) 2,790Cash and cash equivalents at beginning of year . . . . . . . . . . . . . . . . . . . . . . . . . 6,783 9,409 6,6�9Cash and cash equivalents at end of year . . . . . . . . . . . . . . . . . . . . . . . . . . . . . . $21,272 $ 6,783 $ 9,409
The accompanying notes are an integral part of the consolidated financial statements.
36 2008 ANNUAL REPORT
NOTES TO FINANCIAL STATEMENTS
Note 1. Summary of Significant Accounting Policies
BASIS OF PRESENTATION AND PRINCIPLES OF CONSOLIDATIONThe consolidated financial statements include the accounts of Raven Industries, Inc. and its wholly owned subsidiaries (the company). The company is an industrial manufacturer provid-ing a variety of products to customers within the industrial, agricultural, construction and military/aerospace markets primarily in North America. The company operates three divisions (Flow Controls, Engineered Films and Electronic Systems) in addition to three wholly owned subsidiaries: Aerostar International, Inc. (Aerostar); Raven Industries Canada, Inc. (Raven Canada); and Raven Industries GmbH (Raven GmbH). All significant intercompany balances and transactions have been eliminated in consolidation.
USE OF ESTIMATESThe preparation of the company’s financial statements in conformity with accounting principles generally accepted in the United States of America requires management to make certain estimates and assumptions that affect the reported amounts of assets and liabilities as of the date of the financial statements and the reported amounts of revenues and expenses during the reporting periods. Actual results could differ from these estimates.
FOREIGN CURRENCYThe company’s subsidiaries that operate outside the United States use their local currency as the functional currency. The functional currency is translated into U.S. dollars for balance sheet accounts using the period-end exchange rates, and aver-age exchange rates for the statement of income. Adjustments resulting from financial statement translations are included as cumulative translation adjustments in accumulated other comprehensive income (loss) within shareholders’ equity. Foreign currency transaction gains or losses are recognized in the period incurred and are included in interest income and other, net in the Consolidated Statements of Income.
CASH AND CASH EQUIVALENTSThe company considers all highly liquid debt instruments with original maturities of three months or less to be cash equivalents. Cash and cash equivalent balances are principally concentrated in checking, money market and sweep accounts with Wells Fargo Bank, N.A. and Wells Fargo Brokerage Services, LLC.
SHORT-TERM INVESTMENTSThe company has invested in certificates of deposit with rates ranging from 3.50% to 5.00%. The investments have varying maturity dates, all of which are less than 12 months from the balance sheet date.
ACCOUNTS RECEIVABLE AND ALLOWANCE FOR DOUBTFUL ACCOUNTSTrade accounts receivable are recorded at the invoiced amount and do not bear interest. The allowance for doubtful
accounts is the company’s best estimate of the amount of probable credit losses based on historical writeoff experience by segment and an estimate of the collectibility of any known problem accounts.
INVENTORY VALUATIONInventories are stated at the lower of cost or market, with cost determined on the first-in, first-out basis. Market value encom-passes consideration of all business factors including price, contract terms and usefulness.
PROPERTY, PLANT AND EQUIPMENTProperty, plant and equipment are stated at cost and are depreciated over the estimated useful lives of the assets using accelerated methods. The estimated useful lives used for computing depreciation are as follows:Building and improvements . . . . . . . . . . . . . . . . . . . . . . . . . . . . . . �5 - 39 yearsManufacturing equipment by segment Flow Controls . . . . . . . . . . . . . . . . . . . . . . . . . . . . . . . . . . . . . . . 3 - 5 years Engineered Films . . . . . . . . . . . . . . . . . . . . . . . . . . . . . . . . . . . . . 5 - �2 years Electronic Systems . . . . . . . . . . . . . . . . . . . . . . . . . . . . . . . . . . . 3 - 5 years Aerostar . . . . . . . . . . . . . . . . . . . . . . . . . . . . . . . . . . . . . . . . . . . 3 - 5 yearsFurniture, fixtures, office equipment and other . . . . . . . . . . . . . . . . 3 - 7 years
Maintenance and repairs are charged to expense in the year incurred and renewals and betterments are capitalized. The cost and related accumulated depreciation of assets sold or disposed of are removed from the accounts, and the resulting gain or loss is reflected in operations.
INTANGIBLE ASSETSIntangible assets, primarily comprised of technologies acquired through acquisition, are recorded at cost and are presented net of accumulated amortization. Amortization is computed on a straight-line basis over estimated useful lives ranging from 3 to 20 years. The straight-line method of amortization reflects an appropriate allocation of the cost of the intangible assets to earnings in each reporting period.
GOODWILLThe company recognizes the excess cost of an acquired entity over the net amount assigned to assets acquired and liabilities assumed as goodwill. Goodwill is tested for impairment on an annual basis during the fourth quarter, and between annual tests whenever there is an impairment indicated. Impairment tests of goodwill are performed at the reporting unit level. Fair values are estimated based on discounted cash flows and are compared with the corresponding carrying value of the report-ing unit. If the fair value of the reporting unit is less than the carrying amount, the amount of the impairment loss must be measured and then recognized to the extent the carrying value exceeds the implied fair value.
LONG-LIVED ASSETSThe company periodically assesses the recoverability of long-lived and intangible assets using fair value measurement techniques. An impairment loss is recognized when the carry-ing amount of an asset exceeds the estimated undiscounted

RAVEN INDUSTRIES 37
cash flows used in determining the fair value of the assets. The amount of the impairment loss to be recorded is calculated by the excess of the asset’s carrying value over its fair value. Fair value is generally determined using a discounted cash flow analysis.
INSURANCE OBLIGATIONSThe company employs insurance policies covering work-ers’ compensation and general liability costs. Liabilities are accrued related to claims filed and estimates for claims incurred but not reported. To the extent these obligations will be reimbursed by insurance, the expected insurance policy benefit is included as a component of other current assets.
CONTINGENCIESThe company is involved as a defendant in lawsuits, claims or disputes arising in the normal course of business. An estimate of the loss on these matters is charged to operations when it is probable that an asset has been impaired or a liability has been incurred, and the amount of the loss can be reasonably estimated. The settlement of such claims cannot be determined at this time; however, management believes that any liability resulting from these claims will be substantially mitigated by insurance coverage. Accordingly, management does not believe that the ultimate outcome of these matters will be significant to its results of operations, financial position or cash flows.
REVENUE RECOGNITIONThe company recognizes revenue upon shipment of products because there is persuasive evidence of an arrangement, the sales price is determinable, collectibility is reason-ably assured, and delivery has occurred. The company sells directly to customers or distributors who incur the expense and commitment for any post-sale obligations beyond stated warranty terms. Estimated returns, sales allowances or warranty charges are recognized upon shipment of a product. Shipping and handling costs are classified as a component of cost of goods sold.
WARRANTIESAccruals necessary for product warranties are estimated based upon historical warranty costs and average time elapsed between purchases and returns for each division. Additional accruals are made for any significant, discrete warranty issues.
RESEARCH AND DEVELOPMENTResearch and development expenditures of $4.4 million in fiscal 2008, $2.6 million in fiscal 2007, and $2.5 million in fiscal 2006 were charged to cost of goods sold in the year incurred. Expenditures are principally composed of labor and material costs.
SHARE-BASED COMPENSATIONIn fiscal 2003, the company began recording compensation expense related to its share-based compensation plans using the fair value method permitted by SFAS No. 123, Accounting for Stock-Based Compensation. On February 1, 2006, the
company adopted SFAS No. 123(R), Share-Based Payment. SFAS No. 123(R) requires that the cash retained as a result of the tax deductibility of employee share-based awards be presented as a component of cash flows from financing activities in the consolidated statement of cash flows. In prior periods, the company reported these amounts as a component of cash flows from operating activities. The adoption of SFAS No. 123(R) has had no other effect on consolidated results of operations, financial condition, or cash flows.
INCOME TAXESDeferred income taxes reflect temporary differences between assets and liabilities reported on the company’s balance sheet and their tax bases. These differences are measured using enacted tax laws and statutory tax rates applicable to the peri-ods when the temporary differences will affect taxable income. Deferred tax assets are reduced by a valuation allowance to reflect realizable value, when necessary. Judgmental reserves are maintained for uncertain tax positions.
NEW ACCOUNTING STANDARDSIn September 2006, the Financial Accounting Standards Board (FASB) issued SFAS No. 157, Fair Value Measurement. The standard provides guidance for using fair value to measure assets and liabilities. SFAS No. 157 clarifies the principle that fair value should be based on the assumptions market participants would use when pricing an asset or liability and establishes a fair value hierarchy that prioritizes the informa-tion used to develop those assumptions. Under the standard, fair value measurements would be separately disclosed by level within the fair value hierarchy. The statement is effective as of the beginning of the company’s 2009 fiscal year. The company does not expect the implementation of SFAS No. 157 to have a material impact on its consolidated results of operations, financial condition or cash flows.
In February 2007, the FASB issued SFAS No. 159, The Fair Value Option for Financial Assets and Financial Liabilities. SFAS No. 159 permits companies to choose to measure many financial instruments and certain other items at fair value. SFAS No. 159 is effective for the beginning of the company’s 2009 fiscal year. The company does not expect the provisions of SFAS No. 159 to have a material impact on its consolidated results of operations, financial condition, or cash flows.
In December 2007, the FASB issued SFAS No. 141(R), Business Combinations. SFAS No. 141(R) requires an entity to recognize the assets acquired, liabilities assumed, contrac-tual contingencies, and contingent consideration at their fair value on the acquisition date. It also requires acquisition-related costs to be expensed as incurred, restructuring costs to generally be expensed in periods subsequent to the acquisition date, and changes in accounting for deferred tax asset valua-tion allowances and acquired income tax uncertainties after the measurement period to impact income tax expense. The adoption of SFAS No. 141(R) will change the company’s accounting treatment for business combinations on a prospec-tive basis beginning February 1, 2009.

38 2008 ANNUAL REPORT
NOTES TO FINANCIAL STATEMENTS (continued)
In December 2007, the FASB issued SFAS No. 160, Noncontrolling Interests in Consolidated Financial Statements. SFAS No. 160 changes the accounting and reporting for minority interests, which will be characterized as non-controlling interests and classified as a component of equity. The adoption of SFAS No. 160 is effective on a prospective basis beginning February 1, 2009. The company does not expect the provisions of SFAS No. 160 to have a material impact on its consolidated results of operations, finan-cial condition, or cash flows.
Note 2. Selected Balance Sheet InformationFollowing are the components of selected balance sheet items: As of January 3�Dollars in thousands 2008 2007 2006Accounts receivable, net:Trade accounts . . . . . . . . . . . . . . . . . . . . . . . $36,831 $3�,594 $29,547Allowance for doubtful accounts . . . . . . . . . (293) (258) (257)
$36,538 $3�,336 $29,290
Inventories, net:Finished goods . . . . . . . . . . . . . . . . . . . . . . . $ 4,975 $ 3,750 $ 3,504In process . . . . . . . . . . . . . . . . . . . . . . . . . . . 3,631 2,6�2 3,652Materials . . . . . . . . . . . . . . . . . . . . . . . . . . . . 27,923 2�,709 20,663
$36,529 $28,07� $27,8�9
Other current assets:Insurance policy benefit . . . . . . . . . . . . . . . . $ 2,549 $ 65� $ 747Prepaid expenses and other . . . . . . . . . . . . . 406 6�7 334
$ 2,955 $ �,268 $ �,08�
Property, plant and equipment, net:Land . . . . . . . . . . . . . . . . . . . . . . . . . . . . . . . $ 1,227 $ �,227 $ �,084Buildings and improvements . . . . . . . . . . . . . 21,523 2�,494 �6,662Machinery and equipment . . . . . . . . . . . . . . 57,563 52,552 43,256Accumulated depreciation . . . . . . . . . . . . . . (44,570) (39,009) (35,400)
$35,743 $36,264 $25,602
Other assets, net:Amortizable assets: Purchased technology . . . . . . . . . . . . . . . . $ 2,300 $ 3,380 $ 3,380 Other intangibles . . . . . . . . . . . . . . . . . . . 1,172 �,305 �,265 Accumulated amortization . . . . . . . . . . . . (1,740) (2,729) (2,300)
1,732 �,956 2,345Deferred income taxes . . . . . . . . . . . . . . . . . 2,540 �,607 3�8Other, net . . . . . . . . . . . . . . . . . . . . . . . . . . . 75 ��4 �46
$ 4,347 $ 3,677 $ 2,809
Accrued liabilities:Salaries and benefits . . . . . . . . . . . . . . . . . . . $ 2,109 $ �,722 $ 2,�67Vacation . . . . . . . . . . . . . . . . . . . . . . . . . . . . 2,415 2,2�2 2,��940�(k) contributions . . . . . . . . . . . . . . . . . . . 1,184 �,�09 �,049Insurance obligations . . . . . . . . . . . . . . . . . . 4,010 �,743 �,632Income taxes . . . . . . . . . . . . . . . . . . . . . . . . . — 265 808Profit sharing . . . . . . . . . . . . . . . . . . . . . . . . 490 553 �,�68Warranty . . . . . . . . . . . . . . . . . . . . . . . . . . . . 684 397 569Other . . . . . . . . . . . . . . . . . . . . . . . . . . . . . . . 1,912 �,578 �,642
$12,804 $ 9,579 $��,�54
Other liabilities:Long-term debt . . . . . . . . . . . . . . . . . . . . . . . $ — $ — $ 9Postretirement benefits . . . . . . . . . . . . . . . . . 5,246 5,032 �,709Uncertain tax positions . . . . . . . . . . . . . . . . . 2,232 — —
$ 7,478 $ 5,032 $ �,7�8
Note 3. Supplemental Cash Flow Information For the years ended January 3�Dollars in thousands 2008 2007 2006Changes in operating assets and liabilities, net of effects from acquisition and disposition of businesses and assets: Accounts receivable . . . . . . . . . . . . . . . $ (5,216) $ (2,097) $ (3,82�) Inventories . . . . . . . . . . . . . . . . . . . . . . (8,403) (262) (4,356) Prepaid expenses and other assets . . . . 218 (284) (�03) Accounts payable . . . . . . . . . . . . . . . . . 2,437 (�,770) (2,688) Accrued and other liabilities . . . . . . . . . 2,648 (�,045) 3,02� Customer advances . . . . . . . . . . . . . . . . 129 78 (�39)
$ (8,187) $ (5,380) $ (8,086)
Cash paid during the year for: Income taxes . . . . . . . . . . . . . . . . . . . . $14,068 $�3,759 $�2,806
Note 4. Montgomery Industries AcquisitionOn February 17, 2005, the company acquired substantially all of the assets of Montgomery Industries, Inc., a privately held Canadian corporation, for $2.7 million in cash plus the assumption of certain liabilities and a quarterly payment of 6 percent on future sales of Montgomery products up to a maximum payment of $1.825 million. Montgomery developed and sold an automatic boom height control system under the name “Autoboom™” for agricultural sprayers designed to successfully maintain optimum boom height in uneven terrain without compromising the speed with which the sprayer can be operated. Of the purchase price, $289,000 was allocated to current assets; $82,000 was allocated to property, plant and equipment; $2.560 million was allocated to amortizable intangible assets (amortized over approximately seven years); $539,000 to current liabilities assumed; and $285,000 to goodwill, which is deductible for tax purposes.
For the years ended January 31, 2008, 2007, and 2006, the earn-out on the sales of Montgomery products was $298,000, $203,000, and $183,000, respectively, which was recorded as an increase in goodwill.
The operation is a component of the Flow Controls segment. The results of operations for the acquired business have been included in the consolidated financial statements since the date of acquisition. Pro forma earnings are not presented due to the immateriality of the effect of the acquisition to the company’s consolidated operations.

RAVEN INDUSTRIES 39
Note 5. Goodwill and Other Intangibles
GoodwillThe changes in the carrying amount of goodwill by reporting segment are shown below: Flow Engineered Electronic Dollars in thousands Controls Films Systems Aerostar Total
Balance at January 3�, 2005 . . . . $ 4,940 $96 $ 433 $ 464 $ 5,933 Goodwill acquired during the year . . . . . . . . . . . . . . . . . . 285 — — — 285 Acquisition earn-outs . . . . . . . �83 — — — �83Balance at January 3�, 2006 . . . . 5,408 96 433 464 6,40� Acquisition earn-outs . . . . . . . 203 — — — 203Balance at January 3�, 2007 . . . . 5,6�� 96 433 464 6,604 Acquisition earn-outs . . . . . . . 298 — — — 298Balance at January 31, 2008 . . $5,909 $96 $433 $464 $6,902
Intangible AssetsEstimated future amortization expense based on the current carrying value of amortizable intangible assets for fiscal periods 2009 through 2013 is $398,000, $389,000, $357,000, $351,000, and $22,000, respectively. The company wrote-off $1.1 million of fully amortized intangible assets in fiscal 2008.
Note 6. Employee Retirement BenefitsThe company has a 401(k) plan covering substantially all employees and contributed 3% of qualified payroll. The company’s contribution expense was $1,020,000, $935,000, and $892,000 for fiscal 2008, 2007 and 2006, respectively.
In addition, the company provides postretirement medical and other benefits to senior executive officers and senior managers. There are no assets held for the plans and any obligations are covered through the company’s operating cash and invest-ments. The company accounts for these benefits in accordance with SFAS No. 106, Accounting for Postretirement Benefits Other Than Pensions. At January 31, 2007, the company adopted SFAS No. 158, Employers’ Accounting for Defined Pension and Other Postretirement Plans. This statement requires the company to fully recognize the liability for its postretirement benefits through changes in accumulated other comprehensive income.
The incremental effect of applying SFAS No. 158 on the following balance sheet items as of January 31, 2007, was as follows: Impact of SFAS No . �58Dollars in thousands Before Adjustment AfterNon-current deferred tax assets . . . . . . . . . $ 592 $ �,0�5 $ �,607Total assets . . . . . . . . . . . . . . . . . . . . . . . . . ��8,749 �,0�5 ��9,764Other liabilities . . . . . . . . . . . . . . . . . . . . . . 2,�32 2,900 5,032Accumulated other comprehensive income (loss) . . . . . . . . . . . . . . . . . . . . . . (8) (�,885) (�,893)Total shareholders’ equity . . . . . . . . . . . . . . �00,�53 (�,885) 98,268
The accumulated benefit obligation for these benefits is shown below: For the years ended January 3�Dollars in thousands 2008 2007 2006Benefit obligation at beginning of year . . . . . . . . $5,213 $4,928 $2,722Service cost . . . . . . . . . . . . . . . . . . . . . . . . . . . . . 90 84 80Interest cost . . . . . . . . . . . . . . . . . . . . . . . . . . . . . 307 278 259Actuarial (gain) loss . . . . . . . . . . . . . . . . . . . . . . . (2) 89 2,0�4Total recognized in net and other comprehensive income . . . . . . . . . . . . . . . . . . 395Retiree benefits paid . . . . . . . . . . . . . . . . . . . . . . (161) (�66) (�47)Benefit obligation at end of year . . . . . . . . . . . . . 5,447 5,2�3 4,928Less: unrecognized actuarial losses . . . . . . . . . . . — — (3,045)Ending liability balance . . . . . . . . . . . . . . . . . . . . $5,447 $5,2�3 $�,883
The liability and expense reflected in the balance sheet and income statement were as follows: For the years ended January 3�Dollars in thousands 2008 2007 2006Beginning liability balance . . . . . . . . . . . . . . . . . . $5,213 $�,883 $�,447Employer expense . . . . . . . . . . . . . . . . . . . . . . . . 635 596 583Other comprehensive income . . . . . . . . . . . . . . . . (240) — —Total recognized in net and other comprehensive income . . . . . . . . . . . . . . . . . . 395Initial effect of adopting SFAS No . �58 . . . . . . . . . — 2,900 —Retiree benefits paid . . . . . . . . . . . . . . . . . . . . . . (161) (�66) (�47)Ending liability balance . . . . . . . . . . . . . . . . . . . . 5,447 5,2�3 �,883Current portion . . . . . . . . . . . . . . . . . . . . . . . . . . (201) (�8�) (�74)Long-term portion . . . . . . . . . . . . . . . . . . . . . . . . $5,246 $5,032 $�,709
Assumptions used:Discount rate . . . . . . . . . . . . . . . . . . . . . . . . . . . . 6.75% 6 .00% 5 .75%Wage inflation rate . . . . . . . . . . . . . . . . . . . . . . . 4.00% 4 .00% 4 .00%
The discount rate is based on matching rates of return on high-quality fixed-income investments with the timing and amount of expected benefit payments. No material fluctuations in retiree benefit payments are expected in future years.
The assumed health care cost trend rate for fiscal 2008 was 10.38% as compared to 9.64% and 9.39% assumed for fiscal 2007 and 2006. The impact of a one-percentage-point change in assumed health care rates would not be significant to the company’s income statement and would affect the ending liability balance by approximately $900,000. The rate to which the fiscal 2008 health care cost trend rate is assumed to decline is 5.25%, which is the ultimate trend rate. The fiscal year that the rate reaches the ultimate trend rate is expected to be fiscal 2028.
Note 7. WarrantiesChanges in the warranty accrual were as follows: As of January 3�Dollars in thousands 2008 2007 2006Beginning balance . . . . . . . . . . . . . . . . . . . . . . . $ 397 $ 569 $ 452Accrual for warranties . . . . . . . . . . . . . . . . . . . . . 1,390 �,3�7 958Settlements made (in cash or in kind) . . . . . . . . . (1,103) (�,489) (84�)Ending balance . . . . . . . . . . . . . . . . . . . . . . . . . . $ 684 $ 397 $ 569

40 2008 ANNUAL REPORT
NOTES TO FINANCIAL STATEMENTS (continued)
Note 8. Income TaxesThe reconciliation of income tax computed at the federal statutory rate to the company’s effective income tax rate was as follows: For the years ended January 3�Dollars in thousands 2008 2007 2006Tax at U .S . federal statutory rate . . . . . . . . . . . . . . . 35.0% 35 .0% 35 .0%State and local income taxes, net of U .S . federal benefit . . . . . . . . . . . . . . . . . . 1.5 � .� � .�Tax benefit on qualified production activities . . . . . . (2.1) (� .0) (� .0)Tax credit for research activities . . . . . . . . . . . . . . . . (0.7) (0 .5) (0 .�)Other, net . . . . . . . . . . . . . . . . . . . . . . . . . . . . . . . . . 0.5 (0 .�) 0 .3
34.2% 34 .5% 35 .3%
Significant components of the company’s income tax provision were as follows: For the years ended January 3�Dollars in thousands 2008 2007 2006Income taxes:Currently payable . . . . . . . . . . . . . . . . . . . . . $15,201 $�3,687 $�4,04�Deferred . . . . . . . . . . . . . . . . . . . . . . . . . . . . (779) (293) (809)
$14,422 $�3,394 $�3,232
Deferred Tax AssetsDeferred income taxes reflect the net effects of temporary differences between the carrying amounts of assets and liabili-ties for financial reporting purposes and the amounts used for income tax purposes. Significant components of the company’s deferred tax assets and liabilities were as follows: As of January 3�Dollars in thousands 2008 2007 2006Current deferred tax assets: Accounts receivable . . . . . . . . . . . . . . . . . . . . . $ 105 $ 9� $ 88 Inventories . . . . . . . . . . . . . . . . . . . . . . . . . . . . 215 2�2 220 Accrued vacation . . . . . . . . . . . . . . . . . . . . . . . . 781 7�� 680 Insurance obligations . . . . . . . . . . . . . . . . . . . . 456 357 282 Other accrued liabilities . . . . . . . . . . . . . . . . . . 518 390 476
2,075 �,76� �,746Non-current deferred tax assets (liabilities): Postretirement and other employee benefits . . 1,836 �,758 598 Depreciation and amortization . . . . . . . . . . . . . (478) (405) (439) Net operating loss carryforward(a) . . . . . . . . . . . 123 82 — Uncertain tax positions . . . . . . . . . . . . . . . . . . . 741 — — Other . . . . . . . . . . . . . . . . . . . . . . . . . . . . . . . . . 318 �72 �59
2,540 �,607 3�8Net deferred tax asset . . . . . . . . . . . . . . . . . . . . . . $4,615 $3,368 $2,064
(a) The company’s Canadian operation incurred a $317,000 net operating loss that if unused will begin to expire in 2017.
Uncertain Tax PositionsEffective February 1, 2007, the company adopted the provisions of FASB Interpretation No. 48, Accounting for Uncertainty in Income Taxes (FIN 48). Upon adoption of FIN 48 the company recorded a net $716,000 increase in the liability for unrecognized tax benefits, which was recorded as a reduction to the February 1, 2007 beginning retained earn-ings balance. As of the adoption date, the company had gross unrecognized tax benefits of $1.3 million ($1.6 million includ-
ing interest and penalties). The following table summarizes the activity related to the gross unrecognized tax benefits (exclud-ing interest and penalties) for the year ended January 31, 2008:Dollars in thousandsBalance as of February �, 2007 . . . . . . . . . . . . . . . . . . . . . . . . . . . . . . . . . $�,328Increases related to current year tax positions . . . . . . . . . . . . . . . . . . . . . . 465Balance as of January 3�, 2008 . . . . . . . . . . . . . . . . . . . . . . . . . . . . . . . . . $�,793
During the fiscal year ended January 31, 2008, there were no increases, decreases or settlements of uncertain tax posi-tions related to prior years. The company does not expect any significant change in the amount of unrecognized tax benefits in the next fiscal year.
The total unrecognized tax benefits that, if recognized, would affect the company’s effective tax rate were $1.2 million and $0.9 million as of January 31, 2008 and February 1, 2007, respectively.
The company recognizes interest and penalties accrued related to unrecognized tax benefits in income tax expense. At January 31, 2008 and February 1, 2007, accrued interest and penalties were $439,000 and $264,000, respectively.
The company files tax returns, including returns for its subsidiaries, with various federal, state, and local jurisdictions. Uncertain tax positions are related to tax years that remain subject to examination. The company’s fiscal 2004 through 2007 U.S. tax returns remain subject to examination by federal tax authorities, and the company’s fiscal 2003 through 2007 state and local tax returns remain subject to examination by state and local authorities.
Note 9. Financing ArrangementsThe company has an uncollateralized credit agreement provid-ing a line of credit of $8.0 million with a maturity date of July 1, 2008, bearing interest at 1.00% under the prime rate. Letters of credit totaling $1.2 million have been issued under the line, primarily to support self-insured workers’ compensation bonding requirements. No borrowings were outstanding as of January 31, 2008, 2007 or 2006, and $6.8 million was avail-able at January 31, 2008. The weighted-average interest rate for borrowing under the short-term credit line in fiscal 2006 was 5.63%. There were no borrowings under the credit line in fiscal years 2008 or 2007.
Wells Fargo Bank, N.A. provides the company’s line of credit and holds the company’s cash and cash equivalents. One member of the company’s board of directors is also on the board of directors of Wells Fargo & Co., the parent company of Wells Fargo Bank, N.A.
The company leases certain vehicles, equipment and facili-ties under operating leases. Total rent and lease expense was $268,000, $351,000, and $381,000 in fiscal 2008, 2007 and 2006, respectively. Future minimum lease payments under non-cancelable operating leases for fiscal periods 2009 to 2011 are $173,000, $139,000, and $115,000, respectively, with all leases scheduled to expire by fiscal 2011.

RAVEN INDUSTRIES 4�
Note 10. Share-based CompensationAt January 31, 2008, the company had two share-based compensation plans, which are described below. The compen-sation cost for these plans was $904,000, $605,000, and $485,000 in fiscal 2008, 2007, and 2006, respectively. The related income tax benefit recorded in the income statement was $154,000, $110,000, and $58,000 for fiscal 2008, 2007, and 2006, respectively. Compensation cost capitalized as part of inventory at January 31, 2008, 2007, and 2006, was $54,000, $40,000 and $63,000, respectively.
2000 Stock Option and Compensation PlanThe company’s 2000 Stock Option and Compensation Plan, approved by the shareholders, is administered by the Personnel and Compensation Committee of the Board of Directors and allows for either incentive or non-qualified options with terms not to exceed 10 years. There are 438,125 shares of the company’s common stock reserved for future option grants under the plan at January 31, 2008. Options are granted with exercise prices not less than market value at the date of grant. The stock options vest over a four-year period and expire after five years. Options contain retirement and change in control provisions that may accelerate the vesting period. The fair value of each option grant is estimated on the date of grant using the Black-Scholes option pricing model. The company uses historical data to estimate option exercise and employee termination within the valuation model.
The fair value of each option grant is estimated on the date of grant using the Black-Scholes option pricing model with the following weighted average assumptions by grant year. For the years ended January 3� 2008 2007 2006Risk-free interest rate . . . . . . . . . . . . . . . . . . . 3.07% 4 .45% 4 .36%Expected dividend yield . . . . . . . . . . . . . . . . . 1.28% � .29% 0 .90%Expected volatility factor . . . . . . . . . . . . . . . . 40.62% 38 .97% 39 .25%Expected option term (in years) . . . . . . . . . . . 4.25 4 .25 4 .25Weighted average grant date fair value . . . . . $11.45 $ 9 .5� $�0 .90
Information regarding option activity for the year ended January 31, 2008 is as follows: Weighted average Weighted Aggregate remaining average intrinsic contractual Number exercise value term of options price (in 000s) (years)Outstanding at beginning of year . . . . . . . 447,050 $18.89Granted . . . . . . . . . . . . . . . . . 75,400 34.50Exercised . . . . . . . . . . . . . . . . (147,769) 8.91Forfeited . . . . . . . . . . . . . . . . (1,650) 26.94Outstanding at end of year . . . . . . . . . . . . 373,031 $25.96 $�,926 2 .80
Options exercisable at end of year . . . . . . . . . . 182,250 $21.16 $�,652 � .78
The intrinsic value of a stock award is the amount by which the fair value of the underlying stock exceeds the exercise price of the award. The total intrinsic value of options exer-cised was $3.5 million, $3.7 million and $3.6 million during the years ended January 31, 2008, 2007 and 2006, respec-tively. As of January 31, 2008, the total compensation cost for non-vested awards not yet recognized in the company’s statements of income was $1.4 million, net of the effect of estimated forfeitures. This amount is expected to be recog-nized over a weighted average period of 2.56 years.
Deferred Stock Compensation Plan for DirectorsOn May 23, 2006, the company’s stockholders approved the Deferred Stock Compensation Plan for Directors of Raven Industries, Inc. Under the plan, a stock unit is the right to receive one share of the company’s common stock as deferred compensation, to be distributed from an account established in the name of the non-employee director by the company. Stock units have the same value as a share of common stock but cannot be sold. Stock units are a component of the company’s equity. The plan reserves 50,000 common shares for the conversion of stock units into common stock after direc-tors retire from the Board. The plan is administered by the Governance Committee of the Board of Directors.
Stock units granted under this plan vest immediately and are expensed at the date of grant. Stock units are also accumulated if a director elects to defer the annual retainer paid for board service. When dividends are paid on the company’s common shares, stock units are added to the directors’ balances and a corresponding amount is removed from retained earnings. The intrinsic value of a stock unit is the fair value of the underly-ing shares.
Information regarding outstanding stock units for the year ended January 31, 2008, is as follows: Weighted Number average of units priceOutstanding at beginning of year . . . . . . . . . . . . . . . . . . . 4,828 $28 .43Granted . . . . . . . . . . . . . . . . . . . . . . . . . . . . . . . . . . . . . . . 3,846 36 .40Deferred retainers . . . . . . . . . . . . . . . . . . . . . . . . . . . . . . . �,099 36 .40Dividends . . . . . . . . . . . . . . . . . . . . . . . . . . . . . . . . . . . . . . �05 35 .79Converted into common shares . . . . . . . . . . . . . . . . . . . . . — —Outstanding at end of year . . . . . . . . . . . . . . . . . . . . . . . . 9,878 $30 .02
Note 11. Net Income Per ShareBasic net income per share is computed by dividing net income by the weighted-average common shares and stock units outstanding. Diluted net income per share is computed by dividing net income by the weighted-average common and common equivalent shares outstanding (which includes the shares issuable upon exercise of employee stock options net of shares assumed purchased with the option proceeds) and stock units outstanding. Certain outstanding options were excluded from the diluted net income per-share calculations because their effect would have been anti-dilutive, as their
42 2008 ANNUAL REPORT
NOTES TO FINANCIAL STATEMENTS (continued)
exercise prices were greater than the average market price of the company’s common stock during those periods. For fiscal 2008, 2007, and 2006, 90,338, 96,075, and 19,125 options, respectively, were excluded from the diluted net income per-share calculation. Details of the computation are presented below. For the years ended January 3� 2008 2007 2006Numerator: Net income (in thousands) . . . . . . $ 27,802 $ 25,44� $ 24,262
Denominator: Weighted average common shares outstanding . . . . . . . . . 18,099,600 �8,082,606 �8,055,439 Weighted average stock units outstanding . . . . . . . . . . . 8,580 3,602 — Denominator for basic calculation . . . . . . . 18,108,180 �8,086,208 �8,055,439
Weighted average common shares outstanding . . . . . . . . . 18,099,600 �8,082,606 �8,055,439 Weighted average stock units outstanding . . . . . . . . . . . 8,580 3,602 — Dilutive impact of stock options . 95,883 �86,705 259,�04 Denominator for diluted calculation . . . . . . 18,204,063 �8,272,9�3 �8,3�4,543
Net income per share – basic . . . . $ 1.54 $ � .4� $ � .34 Net income per share – diluted . . $ 1.53 $ � .39 $ � .32
Note 12. Business Segments and Major Customer InformationThe company’s reportable segments are defined by their common technologies, production processes and invento-ries. These segments reflect the organization of the company into the three Raven divisions, each with a Divisional Vice President, and its Aerostar subsidiary.
Engineered Films produces rugged reinforced plastic sheeting for industrial, construction, manufactured housing and agri-culture applications. Flow Controls, including Raven Canada and Raven GmbH, provides electronic and Global Positioning System (GPS) products for the precision agriculture, marine navigation and other niche markets. Electronic Systems is a total-solutions provider of electronics manufacturing services. Aerostar manufactures military parachutes, protective wear, custom-shaped inflatable products and high-altitude balloons for government and commercial research.
The company measures the performance of its segments based on their operating income exclusive of administrative and general expenses. The accounting policies of the operating segments are the same as those described in Note 1, Summary of Significant Accounting Policies. Other income, interest expense and income taxes are not allocated to individual operating segments, and assets not identifiable to an individual segment are included as corporate assets. Segment information is reported consistent with the company’s management report-ing structure as required by SFAS No. 131, Disclosures about Segments of an Enterprise and Related Information.
Business segment information is as follows: For the years ended January 3�Dollars in thousands 2008 2007 2006ENGINEERED FILMS DIVISIONSales . . . . . . . . . . . . . . . . . . . . . . . . . . . . $ 84,783 $ 9�,082 $ 82,794Operating income . . . . . . . . . . . . . . . . . . 17,655 23,440 �9,907Assets . . . . . . . . . . . . . . . . . . . . . . . . . . . 43,688 4�,988 33,5�2Capital expenditures . . . . . . . . . . . . . . . . 4,012 �3,266 7,359Depreciation & amortization . . . . . . . . . . 4,046 2,887 2,436FLOW CONTROLS DIVISIONSales . . . . . . . . . . . . . . . . . . . . . . . . . . . . $ 64,291 $ 45,5�5 $ 47,506Operating income . . . . . . . . . . . . . . . . . . 19,102 �0,��� �3,586Assets . . . . . . . . . . . . . . . . . . . . . . . . . . . 36,922 27,629 30,047Capital expenditures . . . . . . . . . . . . . . . . 1,008 577 938Depreciation & amortization . . . . . . . . . . 1,125 �,�42 �,085ELECTRONIC SYSTEMS DIVISIONSales . . . . . . . . . . . . . . . . . . . . . . . . . . . . $ 67,609 $ 66,278 $ 56,2�9Operating income . . . . . . . . . . . . . . . . . . 10,349 �0,850 8,9�6Assets . . . . . . . . . . . . . . . . . . . . . . . . . . . 25,865 25,�75 20,�9�Capital expenditures . . . . . . . . . . . . . . . . 1,077 �,357 �,6�2Depreciation & amortization . . . . . . . . . . 1,237 �,086 87�AEROSTARSales . . . . . . . . . . . . . . . . . . . . . . . . . . . . $ 17,274 $ �4,654 $ �8,009Operating income . . . . . . . . . . . . . . . . . . 1,506 707 2,�33Assets . . . . . . . . . . . . . . . . . . . . . . . . . . . 9,857 8,�6� 6,837Capital expenditures . . . . . . . . . . . . . . . . 156 8�2 �79Depreciation & amortization . . . . . . . . . . 499 375 359REPORTABLE SEGMENTS TOTALSales . . . . . . . . . . . . . . . . . . . . . . . . . . . . $233,957 $2�7,529 $204,528Operating income . . . . . . . . . . . . . . . . . . 48,612 45,�08 44,542Assets . . . . . . . . . . . . . . . . . . . . . . . . . . . 116,332 �02,953 90,587Capital expenditures . . . . . . . . . . . . . . . . 6,253 �6,0�2 �0,088Depreciation & amortization . . . . . . . . . . 6,907 5,490 4,75�CORPORATE & OTHER(a)
Operating (loss) from administrative expenses . . . . . . . . . . . $ (7,467) $ (6,806) $ (7,258)Assets . . . . . . . . . . . . . . . . . . . . . . . . . . . 31,529 �6,8�� �5,570Capital expenditures . . . . . . . . . . . . . . . . 382 5�0 270Depreciation & amortization . . . . . . . . . . 437 395 400TOTAL COMPANYSales . . . . . . . . . . . . . . . . . . . . . . . . . . . . $233,957 $2�7,529 $204,528Operating income . . . . . . . . . . . . . . . . . . 41,145 38,302 37,284Assets . . . . . . . . . . . . . . . . . . . . . . . . . . . 147,861 ��9,764 �06,�57Capital expenditures . . . . . . . . . . . . . . . . 6,635 �6,522 �0,358Depreciation & amortization . . . . . . . . . . 7,344 5,885 5,�5�(a) Assets are principally cash, investments, deferred taxes and notes receivable.
Sales to a customer of the Electronic Systems segment accounted for 11% and 10% of consolidated sales in fiscal 2008 and 2007, respectively, and 14% of the company’s consolidated accounts receivable at January 31, 2008 and January 31, 2007. No customer accounted for more than 10% of the company’s consolidated sales or accounts receivable in fiscal 2006.
Sales to countries outside the United States, primarily to Canada, were as follows: For the years ended January 3�Dollars in thousands 2008 2007 2006Flow Controls . . . . . . . . . . . . . . . . . . . . . . . . . . $10,100 $ 7,�00 $ 6,700Engineered Films . . . . . . . . . . . . . . . . . . . . . . . 1,800 2,000 �,300Electronic Systems . . . . . . . . . . . . . . . . . . . . . . 6,900 8,700 8,000Aerostar . . . . . . . . . . . . . . . . . . . . . . . . . . . . . . 1,300 900 800Total foreign sales . . . . . . . . . . . . . . . . . . . . . . $20,100 $�8,700 $�6,800
Note 13. Quarterly Information (Unaudited)The company’s quarterly information is presented on page 30.

RAVEN INDUSTRIES 43
REPORT OF INDEPENDENT REGISTERED PUBLIC ACCOUNTING FIRM
TotheBoardofDirectorsandShareholdersofRavenIndustries,Inc.:
In our opinion, the accompanying consolidated balance sheets and the related consolidated statements of income, shareholders’ equity and comprehensive income and cash flows present fairly, in all material respects, the financial position of Raven Industries, Inc. and its subsidiaries at January 31, 2008, 2007 and 2006, and the results of their operations and their cash flows for each of the three years in the period ended January 31, 2008 in conformity with accounting principles generally accepted in the United States of America. Also in our opinion, the Company maintained, in all material respects, effective internal control over financial reporting as of January 31, 2008 based on criteria established in Internal Control — Integrated Framework issued by the Committee of Sponsoring Organizations of the Treadway Commission (COSO). The Company’s management is responsible for these financial statements, for maintaining effective internal control over financial reporting and for its assessment of the effectiveness of internal control over financial reporting, appearing on page 31 of the 2008 Annual Report to Shareholders in Management’s Report on Internal Control over Financial Reporting. Our responsibility is to express opinions on these financial statements and on the Company’s internal control over financial reporting based on our integrated audits. We conducted our audits in accordance with the standards of the Public Company Accounting Oversight Board (United States). Those standards require that we plan and perform the audits to obtain reasonable assurance about whether the financial statements are free of material misstatement and whether effective internal control over financial reporting was maintained in all material respects. Our audits of the financial statements included examining, on a test basis, evidence supporting the amounts and disclosures in the financial statements, assessing the accounting principles used and significant estimates made by management, and evaluating the overall financial statement presentation. Our audit of internal control over financial reporting included obtaining an understanding of internal control over financial reporting, assessing the risk that a material weakness exists, and testing and evaluating the design and operating effectiveness of internal control based on the assessed risk. Our audits also included performing such other procedures as we considered necessary in the circumstances. We believe that our audits provide a reasonable basis for our opinions.
As described in Note 6 to the consolidated financial statements, effective January 31, 2007, the Company adopted the provisions of Financial Accounting Standards Board (FASB) Statement No. 158, Employers’ Accounting for Defined Benefit Pension and Other Postretirement Plans. As described in Note 8 to the consolidated financial statements, effective February 1, 2007, the Company adopted the provisions of FASB Interpretation No. 48 (FIN 48), Accounting for Uncertainty in Income Taxes.
A company’s internal control over financial reporting is a process designed to provide reasonable assurance regarding the reliability of financial reporting and the preparation of financial statements for external purposes in accordance with generally accepted accounting principles. A company’s internal control over financial reporting includes those policies and procedures that (i) pertain to the maintenance of records that, in reasonable detail, accurately and fairly reflect the transactions and dispositions of the assets of the company; (ii) provide reasonable assurance that transactions are recorded as necessary to permit preparation of financial statements in accordance with generally accepted accounting principles, and that receipts and expenditures of the company are being made only in accordance with authorizations of management and directors of the company; and (iii) provide reasonable assurance regarding prevention or timely detection of unauthorized acquisition, use, or disposition of the company’s assets that could have a material effect on the financial statements.
Because of its inherent limitations, internal control over financial reporting may not prevent or detect misstatements. Also, projections of any evaluation of effectiveness to future periods are subject to the risk that controls may become inadequate because of changes in conditions, or that the degree of compliance with the policies or procedures may deteriorate.
PricewaterhouseCoopers LLP Minneapolis, Minnesota
March 20, 2008
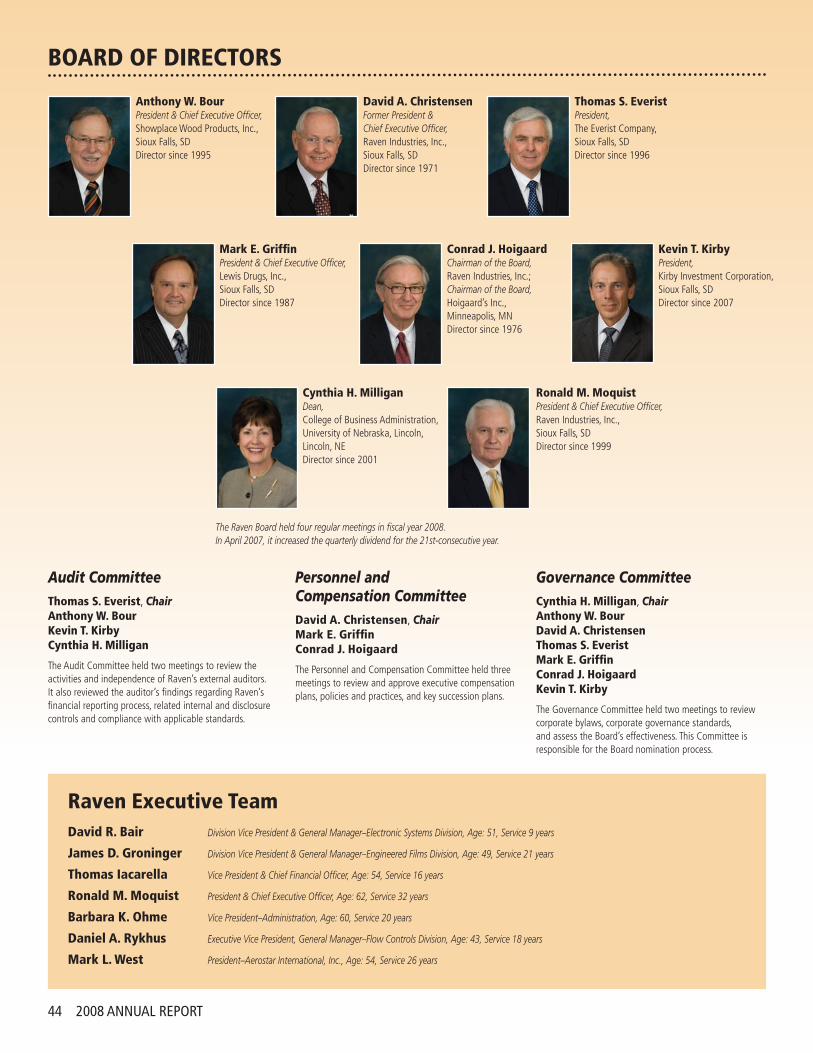
44 2008 ANNUAL REPORT
FINANCIAL HIGHLIGHTSBOARD OF DIRECTORS
Anthony W. BourPresident & Chief Executive Officer,Showplace Wood Products, Inc., Sioux Falls, SD Director since 1995
David A. Christensen Former President & Chief Executive Officer,Raven Industries, Inc., Sioux Falls, SD Director since 1971
Thomas S. EveristPresident,The Everist Company, Sioux Falls, SD Director since 1996
Mark E. GriffinPresident & Chief Executive Officer,Lewis Drugs, Inc., Sioux Falls, SD Director since 1987
Conrad J. HoigaardChairman of the Board,Raven Industries, Inc.; Chairman of the Board, Hoigaard’s Inc., Minneapolis, MN Director since 1976
Cynthia H. MilliganDean,College of Business Administration, University of Nebraska, Lincoln, Lincoln, NE Director since 2001
Ronald M. MoquistPresident & Chief Executive Officer,Raven Industries, Inc., Sioux Falls, SD Director since 1999
The Raven Board held four regular meetings in fiscal year 2008. In April 2007, it increased the quarterly dividend for the 21st-consecutive year.
Raven Executive Team David R. Bair Division Vice President & General Manager–Electronic Systems Division, Age: 51, Service 9 years
James D. Groninger Division Vice President & General Manager–Engineered Films Division, Age: 49, Service 21 years
Thomas Iacarella Vice President & Chief Financial Officer, Age: 54, Service 16 years
Ronald M. Moquist President & Chief Executive Officer, Age: 62, Service 32 years
Barbara K. Ohme Vice President–Administration, Age: 60, Service 20 years
Daniel A. Rykhus Executive Vice President, General Manager–Flow Controls Division, Age: 43, Service 18 years
Mark L. West President–Aerostar International, Inc., Age: 54, Service 26 years
Audit CommitteeThomas S. Everist, Chair Anthony W. Bour Kevin T. Kirby Cynthia H. Milligan
The Audit Committee held two meetings to review the activities and independence of Raven’s external auditors. It also reviewed the auditor’s findings regarding Raven’s financial reporting process, related internal and disclosure controls and compliance with applicable standards.
Personnel and Compensation CommitteeDavid A. Christensen, Chair Mark E. Griffin Conrad J. Hoigaard
The Personnel and Compensation Committee held three meetings to review and approve executive compensation plans, policies and practices, and key succession plans.
Governance CommitteeCynthia H. Milligan, Chair Anthony W. Bour David A. Christensen Thomas S. Everist Mark E. Griffin Conrad J. Hoigaard Kevin T. Kirby
The Governance Committee held two meetings to review corporate bylaws, corporate governance standards, and assess the Board’s effectiveness. This Committee is responsible for the Board nomination process.
Kevin T. KirbyPresident,Kirby Investment Corporation, Sioux Falls, SD Director since 2007

Desig
n: C
reat
ive D
esig
n Bo
ard,
Chi
cago
, IL
Annual Meeting May 21, 2008, 9:00 a.m. Ramkota Hotel and Conference Center 3200 W. Maple Avenue Sioux Falls, SD
Dividend Reinvestment Plan Raven Industries, Inc. sponsors a Dividend Reinvestment Plan so shareholders can purchase additional Raven common stock without paying any brokerage commission or fees. For more information on how you can take advantage of this plan, contact your broker, our stock transfer agent or write to our Investor Relations Department.
Dividend Policy Our policy is to return about 30% of the company’s earnings to shareholders as a dividend. Each year our board of directors reviews Raven’s dividend. Fiscal 2008 represented the 21st-consecutive year we raised our annual dividend: a 22% increase to 44 cents per share.
Raven Web Site www.ravenind.com
Stock Quotations Listed on the Nasdaq NGS Stock Market—RAVN
Independent Registered Public Accounting Firm PricewaterhouseCoopers LLP Minneapolis, MN
Stock Transfer Agent & Registrar Wells Fargo Bank, N.A. 161 N. Concord Exchange P.O. Box 64854 South St. Paul, MN 55164-0854 Phone: 1-800-468-9716
Form 10-K Upon written request, Raven Industries, Inc.’s Form 10-K for the fiscal year ended January 31, 2008, which has been filed with the Securities and Exchange Commission, is available free of charge.
Affirmative Action Plan Raven Industries, Inc. and Aerostar International, Inc. are Equal Employment Opportunity Employers with approved affirmative action plans.
Direct inquires to: Raven Industries, Inc. Attention: Investor Relations P.O. Box 5107 Sioux Falls, SD 57117-5107 Phone: 605-336-2750
INVESTOR INFORMATION
Delivering Long-term Shareholder Value
If an investor purchased $100 of Raven stock on January 31, 2003, held it for the next five years and reinvested the dividends, its value would have increased to $419.77. This was a significant premium over the same investment in the S&P 1500 Industrial Index, which would have been worth $227.10, or in the Russell 2000 Index, which would have grown to $203.82.0
100
200
300
400
500
Total Return IndexBase Year = 100
Jan 2003 Jan 2004 Jan 2005 Jan 2006 Jan 2007 Jan 2008
Raven Industries Inc SP1500 Industrial Machinery Russell 2000 Index
FORWARD-LOOKING STATEMENTSThis annual report contains “forward-looking statements” within the meaning of Section 27A of the Securities Act of 1933, as amended, and Section 21E of the Securities Exchange Act of 1934, as amended, including statements regarding the expectations, beliefs, intentions or strategies regarding the future. Without limiting the foregoing, the words “anticipates,” “believes,” “expects,” “intends,” “may,” “plans” and similar expressions are intended to identify forward-looking statements. The company intends that all forward-looking statements be subject to the safe harbor provisions of the Private Securities Litigation Reform Act. Although management believes that the expectations reflected in forward-looking statements are based on reasonable assumptions, there is no assurance these assumptions are correct or that these expectations will be achieved. Assumptions involve important risks and uncertainties that could significantly affect results in the future. These risks and uncertainties include, but are not limited to, those relating to weather conditions, which could affect some of the company’s primary markets, such as agriculture and construction; or changes in competition, raw material availability, technology or relationships with the company’s largest customers — any of which could adversely affect any of the company’s product lines, as well as other risks described in Raven’s 10-K under Item 1A. This list is not exhaustive, and the company does not have an obligation to revise any forward-looking statements to reflect events or circumstances after the date these statements are made.
RAVENRaven Industries P.O. Box 5107 Sioux Falls, SD 57117-5107
www.ravenind.com