raven russia limited · 1 raven russia limited 2016 interim report contents page highlights 2...
TRANSCRIPT

2016 Interim Report
RAVEN RUSSIA LIMITED


1
RAVEN RUSSIA LIMITED 2016 INTERIM REPORT
CONTENTS PAGE
Highlights 2
Chairman’s Message 3
Chief Executive’s Review 4
Corporate Governance 6
Independent Review Report 8
Condensed Unaudited Group Income Statement 9
Condensed Unaudited Group Statement of Comprehensive Income 10
Condensed Unaudited Group Balance Sheet 11
Condensed Unaudited Group Statement of Changes in Equity 12
Condensed Unaudited Group Cash Flow Statement 13
Notes to the Condensed Unaudited Group Financial Statements 14
RAVEN RUSSIA LIMITED INTERIM RESULTS FOR THE SIX MONTHS ENDED 30 JUNE 2016

2
RAVEN RUSSIA LIMITED 2016 INTERIM REPORT
HIGHLIGHTS
• IFRS earnings after tax $8.8 million (30 June 2015: loss of $20.6 million);• Underlying earnings after tax $31.5 million (30 June 2015: $34.5 million);• Basic underlying earnings per share 4.8 cents (30 June 2015: 5.0 cents);• Adjusted diluted net asset value per share 70 cents (31 December 2015: 70 cents);• Investment portfolio stable at 82% let;• Issue of new convertible preference shares completed on 7 July 2016 raising £109 million;• Cash balance today of $331 million; and• Proposed distribution of 0.5p by way of tender offer buy back of 1 in 80 shares at 40p.
Glyn Hirsch CEO said, “We are getting used to the new business conditions and the market is adapting and stabilising too. With our considerably strengthened balance sheet we feel well placed for the next phase for the Group.”
Financial Summary
Income Statement for the 6 months ended: 30 June 2016 30 June 2015
Net rental and Related Income ($m) 77.0 95.5
Revaluation deficit ($m) (8.5) (50.8)
IFRS Earnings / (Loss) after tax ($m) 8.8 (20.6)
Underlying Earnings after tax ($m) 31.5 34.5
IFRS Basic EPS (cents) 1.4 (3.0)
Underlying Basic EPS (cents) 4.8 5.0
Distribution per share (pence) 0.5 1.0
Balance Sheet at: 30 June 2016 31 December 2015
Investment property Market Value ($m) 1,352 1,357
Adjusted diluted NAV per share (cents) 70 70
IFRS diluted NAV per share (cents) 72 70
Letting Summary
The completed logistics portfolio of 1.5 million sqm is 82% let. The table below shows the maturity profile at the period end and how that has changed in the six months to 30 June 2016.
Maturities, ‘000 sqm 2016 2017 2018 2019 2020-2027 Total
Maturity profile at 1 January 2016 228 210 131 225 429 1,223
Renegotiated and extended (82) (25) 0 (12) 0 (119)
Effect of renegotiations 0 45 33 11 30 119
Vacated / terminated (78) (6) (3) 0 0 (87)
New lettings 7 3 34 12 29 85
Maturity profile at 30 June 2016 75 227 195 236 488 1,221
In addition, 25,000sqm of pre let agreements (“PLAs”) and letters of intent (“LOIs”) had been signed at 30 June 2016.
3
RAVEN RUSSIA LIMITED 2016 INTERIM REPORT
CHAIRMAN’S MESSAGEI am pleased to say that since my last message in March this year there has been a period of relative stability in the Russian market and we have been busy taking some positive steps to recover lost ground.
Business models have adapted to the new market fundamentals following the various macro economic events of the past two years and investment decisions are coming back onto the agenda. Our occupancy levels have stabilised at 82% and we have active discussions on vacant space on most of our projects. Similarly, property valuations have remained relatively flat over the six months with a small deficit of $8.5 million at 30 June 2016 (deficit of $257 million in 12 months to 31 December 2015).
New leases are Rouble denominated and as a result we will continue to have a drop off in US Dollar denominated income as existing US Dollar pegged leases mature. But we now have greater clarity on where that may lead us. The underlying tenant base is strong with the weaker covenants having now vacated and the integrity of our leases, where tested in various court and arbitration procedures, has proved robust.
Following the release of our 2015 Annual Report and with the spectre of a continuing reduction in our net operating income as leases re-align with current market rental levels it became obvious that we should restructure our balance sheet to counter the effects. In a very short window and thanks to the foresight of Anton, our Deputy Chairman, Glyn, our CEO and a supportive shareholder base, we raised £109 million through the issue of new convertible preference shares in early July. This has allowed us to start the process of changing the weighting of our secured, amortising debt, reducing it to levels that meet ongoing covenant requirements, extending the maturity periods and significantly reducing the annual amortisation exposure. The effect of this should begin to be seen in 2017, when our cash break even point will fall to a level commensurate with our reduced net operating income.
We still have significant cash resources over and above the new fund raising and following this strengthening of our balance sheet we will look to start rebuilding our top line as acquisition or development opportunities arise.
Although it is our intention to distribute the equivalent of 0.5p per ordinary share (30 June 2015: 1p per ordinary share) by way of a tender offer buy back of 1 in 80 shares at 40p per share, we remain cognisant of how quickly external events can impact on our market and will continue with caution, albeit with a stronger balance sheet.
Richard JewsonChairman29 August 2016

4
RAVEN RUSSIA LIMITED 2016 INTERIM REPORT
CHIEF EXECUTIVE’S REVIEWResults
Results for the first six months of the year have met our expectations. Our net operating and related income continues to reduce to a level commensurate with current market rents, $77 million for the half year compared to $95.5 million in the six months to 30 June 2015.
Underlying earnings after tax for the period remain healthy, given the reduced income, at $31.5 million (30 June 2015: $34.5 million). This is driven mainly by foreign exchange profits through the income statement and reduced administrative expenses.
Administrative expenses benefitted from a recovery in the bad debt charge (a credit of $0.7million in the period compared to a charge of $2.5 million in 2015) and reduced discretionary employee bonuses. The latter is offset by an increased charge for share based payments and other long term incentives following the approval of the new incentive scheme at the AGM on 15 June 2016.
Basic underlying earnings per share are 4.8 cents (30 June 2015: 5.0 cents).
IFRS earnings after tax recovered to $8.8 million (30 June 2015: loss of $20.6 million) with property values remaining relatively stable, generating an unrealised loss on revaluation of $8.5 million in the half year (30 June 2015: loss of $50.8 million).
Fully diluted adjusted net asset value per share remained at 70 cents (31 December 2015: 70 cents). Cash balances at 30 June 2016 were $183 million (31 December 2015: $202 million) increasing to $331 million today following the issue of new convertible preference shares in July.
Occupancy levels have remained at 82% over the period (31 December 2015: 82%). At 30 June 2016, 73% of our let warehouse space had US Dollar denominated leases with an average warehouse rental level of $124 per sqm and a weighted average term to maturity of 3.4 years. Rouble denominated or capped leases account for 27% of our let space with an average warehouse rent of Roubles 5,000 per sqm and a weighted average term to maturity of 2 years. Rouble leases have an average minimum annual indexation of 7%.
The majority of 2016 lease maturities have now been dealt with. This has resulted in 78,000sqm of vacancies in the first six months with a further 62,000sqm of space expected to be vacated in the second half of the year. Letting interest has picked up significantly since the year end and 85,000sqm of vacant space had been re let by 30 June 2016 with a further 25,000sqm of pre let agreements and letters of intent signed.
Financing
On 7 July 2016 the Company completed the placing of new convertible preference shares, raising £109 million at a subscription price of £1 per share. The convertible preference shares have a 10 year term, a cumulative preference dividend of 6.5p per annum and are redeemable on maturity at £1.35. The holders have the right to convert to ordinary shares at the equivalent to approximately 55p per ordinary share (subject to certain adjustments) prior to maturity. The shares were listed on the Channel Islands Securities Exchange and trade on the SETSqx platform of the London Stock Exchange.
This fund raising allows us to restructure our balance sheet by reducing secured, amortising debt facilities, extend the terms of that debt and reduce our annual amortisation. We have agreed terms on 7 of our facilities and expect to pre pay $100 million of debt on these facilities by the end of the current quarter. The two largest near term maturities of $232 million will be extended to 2021 as part of this exercise.
We have commenced discussion on the majority of the remaining facilities to extend terms and reduce amortisation and these are progressing positively. We hope to have all formal arrangements in place on these by the end of the year.
As explained in note 9 to the interim financial statements, a cash sweep mechanism continues on the facility secured on the office block in St Petersburg.

5
RAVEN RUSSIA LIMITED 2016 INTERIM REPORT
Foreign exchange
Foreign exchange movements in the period have been positive, profit in the income statement of $10.3 million being a factor of the Sterling functional currency of the holding company and its US Dollar cash reserves. Weak Sterling also gave a boost to reserves, reducing the US Dollar value of our Sterling preference shares.
Cash flow
Cash flows in the period show the effect of reduced operating income, dropping $19.9 million to $49.9 million compared to the previous year. Debt amortisation, interest and preference share coupon totalled $76.2 million (30 June 2015: $71.9 million). Distributions to ordinary shareholders for the period were $5.8 million (30 June 2015: $32 million). We did benefit by the sale of ordinary shares held by an Employee Benefit Trust (“EBT”), raising $14.7 million but this is simply a timing difference as the majority of those funds were then used by the EBT in subscribing for new convertible preference shares in early July. Cash outflows for the period before foreign exchange movements were $21.2 million.
Tender offer
The investment world is desperately short of income and despite the issues we have faced our portfolio still generated a healthy operating profit.
Although far from the 6p we have achieved historically, we propose a distribution of the equivalent of 0.5p per ordinary share by way of tender offer buy back of 1 in 80 shares at 40p (30 June 2015: 1p by way of an offer of 1 in 47 shares at 47p).
The distribution demonstrates the resilience of our business and our commitment to providing income for our shareholders.
Outlook
It may not be the bottom of the market but it certainly feels as though things have stopped deteriorating.
We are getting used to the new business conditions and the market is adapting and stabilising too. With our considerably strengthened balance sheet we feel well placed for the next phase for the Group. Significant progress has been made in restructuring our bank loans and we are actively engaged in finding attractive income producing acquisitions which will further enhance cash flow and returns.
In the short to medium term, the stabilising Russian economy may have a positive impact. Inflation is generally forecast to fall to around 5% and interest rates below 7% in the next few years.
What price a warehouse currently yielding 12% in Roubles with annual indexed increases in that scenario? Something to look forward to I hope, as well as the upside potential of any future strengthening of the Rouble against the Dollar.
Glyn HirschChief Executive Officer29 August 2016
CHIEF EXECUTIVE’S REVIEW

6
RAVEN RUSSIA LIMITED 2016 INTERIM REPORT
CORPORATE GOVERNANCEPrincipal risks and uncertainties
Internal controls and an effective risk management regime are integral to the Group’s continued operation. The assessment of risks faced by the Group is set out in the Risk Report on pages 35 to 38 of the Group’s 2015 Annual Report. The principal risks and uncertainties to which the Group is subject have remained consistent with those at the 2015 year end.
A summary of the principal risks and uncertainties are as follows:
Financial Risks
Oil Price and Foreign Exchange The current oil price and Rouble/US Dollar exchange rate levels remain or deteriorate further in the long term, reducing the Group’s US Dollar denominated earnings.
Bank Financing and Costs Reduced access to funding and potential increases in funding costs hinders the Group’s ability to refinance maturing facilities. Reduced income and asset values driven by a weak Rouble increases the risk of covenant breaches.
Russian Domestic Risk
Legal and Taxation Frameworks The Russian legal and taxation frameworks are still developing with large volumes of new legislation being open to interpretation and abuse.
Personnel Risks
Key personnel The risk of failing to retain key personnel has increased with the downturn in the Russian market. A new incentive scheme was presented to shareholders and approved at the AGM on 15 June 2016.
Political Risk
Ukraine The situation in Ukraine escalates resulting in increased isolation of Russia from international markets and increased sanctions which exacerbate the slow down in the Russian economy.
Going concern
The financial position of the Group, its cash flows, liquidity and borrowings are described in the Chief Executive’s Review and the accompanying financial statements and related notes. During the period the Group had, and continues to hold, substantial cash and short term deposits and is generating underlying profits. Since the half year, additional funds have been raised through the issue of new convertible preference shares. As a consequence, the Directors believe the Group is well placed to manage its business risks.
After making enquiries and examining major areas that could give rise to significant financial exposure, the Board has a reasonable expectation that the Company and the Group have adequate resources to continue its operations for the foreseeable future. Accordingly, the Group continues to adopt the going concern basis in the preparation of the accompanying interim financial statements.

7
RAVEN RUSSIA LIMITED 2016 INTERIM REPORT
Directors’ Responsibility Statement
The Board confirms to the best of its knowledge:
The condensed financial statements have been prepared in accordance with IAS 34 as adopted by the European Union, and that the half year report includes a fair review of the information required by DTR 4.2.7R and DTR 4.2.8R.
The names and functions of the Directors of Raven Russia Limited are disclosed in the 2015 Annual Report of the Group.
This responsibility statement was approved by the Board of Directors on the 29 August 2016 and is signed on its behalf by
Mark Sinclair Colin SmithChief Financial Officer Chief Operating Officer
CORPORATE GOVERNANCE

8
RAVEN RUSSIA LIMITED 2016 INTERIM REPORT
INDEPENDENT REVIEW REPORT TO RAVEN RUSSIA LIMITEDWe have been engaged by the Company to review the condensed set of financial statements in the Interim Results financial report for the six months ended 30 June 2016 which comprises the Condensed Unaudited Group Income Statement, the Condensed Unaudited Group Statement of Comprehensive Income, the Condensed Unaudited Group Statement of Changes in Equity, the Condensed Unaudited Group Balance Sheet, the Condensed Unaudited Group Cash Flow Statement and the related notes 1 to 18. We have read the other information contained in the Interim Results report and considered whether it contains any apparent misstatements or material inconsistencies with the information in the condensed set of financial statements.
This report is made solely to the company in accordance with guidance contained in International Standard on Review Engagements 2410 (UK and Ireland) ‘Review of Interim Financial Information Performed by the Independent Auditor of the Entity’ issued by the Auditing Practices Board. To the fullest extent permitted by law, we do not accept or assume responsibility to anyone other than the company, for our work, for this report, or for the conclusions we have formed.
Directors’ Responsibilities
The Interim Results financial report is the responsibility of, and has been approved by, the directors. The directors are responsible for preparing the Interim Results financial report in accordance with the Disclosure and Transparency Rules of the United Kingdom’s Financial Conduct Authority.
As disclosed in note 1, the annual financial statements of the Group are prepared in accordance with IFRSs as adopted by the European Union. The condensed set of financial statements included in this half-yearly financial report has been prepared in accordance with International Accounting Standard 34, ‘Interim Financial Reporting’, as adopted by the European Union.
Our Responsibility
Our responsibility is to express to the Company a conclusion on the condensed set of financial statements in the Interim Results report based on our review.
Scope of Review
We conducted our review in accordance with International Standard on Review Engagements 2410 (UK and Ireland) ‘Review of Interim Financial Information Performed by the Independent Auditor of the Entity’ issued by the Auditing Practices Board for use in the United Kingdom.
A review of interim financial information consists of making enquiries, primarily of persons responsible for financial and accounting matters, and applying analytical and other review procedures. A review is substantially less in scope than an audit conducted in accordance with International Standards on Auditing (UK and Ireland) and consequently does not enable us to obtain assurance that we would become aware of all significant matters that might be identified in an audit. Accordingly, we do not express an audit opinion.
Conclusion
Based on our review, nothing has come to our attention that causes us to believe that the condensed set of financial statements in the Interim Results report for the six months ended 30 June 2016 is not prepared, in all material respects, in accordance with International Accounting Standard 34 as adopted by the European Union and the Disclosure and Transparency Rules of the United Kingdom’s Financial Conduct Authority.
Ernst & Young LLPLondon29 August 2016

9
RAVEN RUSSIA LIMITED 2016 INTERIM REPORT
CONDENSED UNAUDITED GROUP INCOME STATEMENT
The total column of this statement represents the Group’s Income Statement, prepared in accordance with IFRS as adopted by the EU. The “underlying earnings” and “capital and other” columns are both supplied as supplementary information permitted by IFRS as adopted by the EU. Further details of the allocation of items between the supplementary columns are given in note 5.
All items in the above statement derive from continuing operations.
All income is attributable to the equity holders of the parent company. There are no non-controlling interests.
The accompanying notes are an integral part of this statement.
For the six months ended 30 June 2016
Six months ended 30 June 2016 Six months ended 30 June 2015 Underlying Capital Underlying Capital earnings and other Total earnings and other Total Notes $’000 $’000 $’000 $’000 $’000 $’000
Gross revenue 2 97,705 – 97,705 118,289 – 118,289
Property operating expenditure and cost of sales (20,701) – (20,701) (22,838) – (22,838)
Net rental and related income 2 77,004 – 77,004 95,451 – 95,451
Administrative expenses 3 (10,471) (544) (11,015) (17,567) (17) (17,584)
Share-based payments and other long term incentives 15e (2,231) (4,669) (6,900) – (3,280) (3,280)
Foreign currency profits 10,283 – 10,283 1,974 – 1,974
Operating expenditure (2,419) (5,213) (7,632) (15,593) (3,297) (18,890)
Share of profits of joint ventures 697 – 697 717 – 717
Operating profit / (loss) before profits and losses on investment property 75,282 (5,213) 70,069 80,575 (3,297) 77,278
Unrealised loss on revaluation of investment property 6 – (6,534) (6,534) – (51,901) (51,901)
Unrealised (loss) / profit on revaluation of investment property under construction 7 – (1,931) (1,931) – 1,128 1,128
Operating profit / (loss) 2 75,282 (13,678) 61,604 80,575 (54,070) 26,505
Finance income 4 1,405 1,776 3,181 1,636 1,965 3,601
Finance expense 4 (41,944) (6,326) (48,270) (42,280) (5,904) (48,184)
Profit / (loss) before tax 34,743 (18,228) 16,515 39,931 (58,009) (18,078)
Tax (3,252) (4,495) (7,747) (5,448) 2,919 (2,529)
Profit / (loss) for the period 31,491 (22,723) 8,768 34,483 (55,090) (20,607)
Earnings per share: 5Basic (cents) 1.35 (3.01)Diluted (cents) 1.34 (3.01)
Underlying earnings per share: 5Basic (cents) 4.84 5.04Diluted (cents) 4.76 4.90

10
RAVEN RUSSIA LIMITED 2016 INTERIM REPORT
CONDENSED UNAUDITED GROUP STATEMENT OF COMPREHENSIVE INCOMEFor the six months ended 30 June 2016
Six months Six months ended ended 30 June 30 June 2016 2015 $’000 $’000
Profit / (loss) for the period 8,768 (20,607)
Other comprehensive income, net of tax Items to be reclassified to profit or loss in subsequent periods: Foreign currency translation on consolidation 4,499 (953)
Total comprehensive income for the period, net of tax 13,267 (21,560)
All income is attributable to the equity holders of the parent company. There are no non-controlling interests.
The accompanying notes are an integral part of this statement.
11
RAVEN RUSSIA LIMITED 2016 INTERIM REPORT
The accompanying notes are an integral part of this statement.
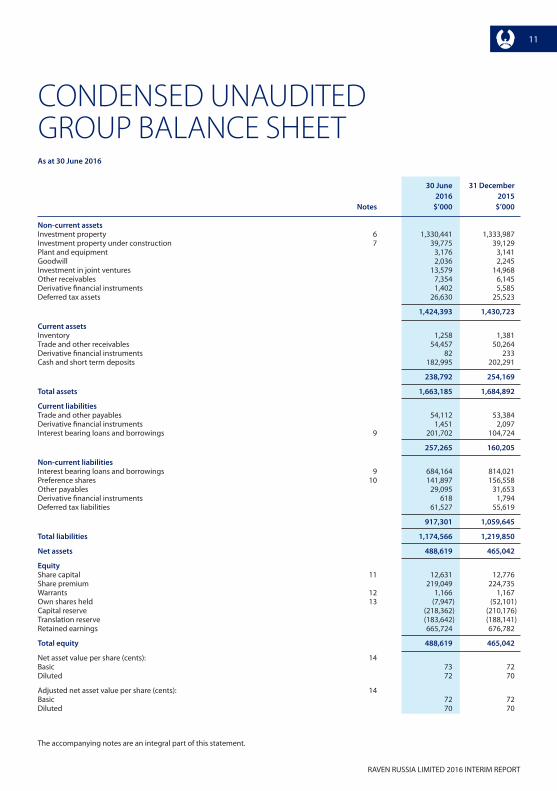
CONDENSED UNAUDITED GROUP BALANCE SHEETAs at 30 June 2016
30 June 31 December 2016 2015 Notes $’000 $’000
Non-current assetsInvestment property 6 1,330,441 1,333,987Investment property under construction 7 39,775 39,129Plant and equipment 3,176 3,141Goodwill 2,036 2,245Investment in joint ventures 13,579 14,968Other receivables 7,354 6,145Derivative financial instruments 1,402 5,585Deferred tax assets 26,630 25,523
1,424,393 1,430,723
Current assetsInventory 1,258 1,381Trade and other receivables 54,457 50,264Derivative financial instruments 82 233Cash and short term deposits 182,995 202,291
238,792 254,169
Total assets 1,663,185 1,684,892
Current liabilitiesTrade and other payables 54,112 53,384Derivative financial instruments 1,451 2,097Interest bearing loans and borrowings 9 201,702 104,724
257,265 160,205
Non-current liabilitiesInterest bearing loans and borrowings 9 684,164 814,021Preference shares 10 141,897 156,558Other payables 29,095 31,653Derivative financial instruments 618 1,794Deferred tax liabilities 61,527 55,619
917,301 1,059,645
Total liabilities 1,174,566 1,219,850
Net assets 488,619 465,042
EquityShare capital 11 12,631 12,776Share premium 219,049 224,735Warrants 12 1,166 1,167Own shares held 13 (7,947) (52,101)Capital reserve (218,362) (210,176)Translation reserve (183,642) (188,141)Retained earnings 665,724 676,782
Total equity 488,619 465,042
Net asset value per share (cents): 14Basic 73 72Diluted 72 70
Adjusted net asset value per share (cents): 14Basic 72 72Diluted 70 70

12
RAVEN RUSSIA LIMITED 2016 INTERIM REPORT
CONDENSED UNAUDITED GROUP STATEMENT OF CHANGES IN EQUITY
The accompanying notes are an integral part of this statement.
Own Share Share Shares Capital Translation Retained Capital Premium Warrants Held Reserve Reserve Earnings Total Notes $’000 $’000 $’000 $’000 $’000 $’000 $’000 $’000
At 1 January 2015 13,623 267,992 1,195 (63,649) 16,597 (186,388) 647,919 697,289
Loss for the period – – – – – – (20,607) (20,607)
Other comprehensive income – – – – – (953) – (953)
Total comprehensive income for the period – – – – – (953) (20,607) (21,560)
Warrants exercised 1 15 (2) – – – – 14
Own shares acquired - – – (76) – – – (76)
Ordinary shares cancelled (626) (32,660) – 2,746 – – – (30,540)
Own shares allocated – – – 7,056 – – (8,424) (1,368)
Share-based payments 15e – – – – – – 3,280 3,280
Transfer in respect of capital losses – – – – (44,852) – 44,852 –
At 30 June 2015 12,998 235,347 1,193 (53,923) (28,255) (187,341) 667,020 647,039
At 1 January 2016 12,776 224,735 1,167 (52,101) (210,176) (188,141) 676,782 465,042
Profit for the period – – – – – – 8,768 8,768
Other comprehensive income – – – – – 4,499 – 4,499
Total comprehensive income for the period – – – – – 4,499 8,768 13,267
Warrants exercised 11 / 12 – 5 (1) – – – – 4
Ordinary shares cancelled 11 / 13 (145) (5,691) – 48 – – – (5,788)
Own shares disposed 13 – – – 43,161 – – (28,505) 14,656
Own shares allocated 13 – – – 945 – – (1,003) (58)
Share-based payments 15e – – – – – – 1,496 1,496
Transfer in respect of capital losses – – – – (8,186) – 8,186 –
At 30 June 2016 12,631 219,049 1,166 (7,947) (218,362) (183,642) 665,724 488,619
For the six months ended 30 June 2016

13
RAVEN RUSSIA LIMITED 2016 INTERIM REPORT
CONDENSED UNAUDITED GROUP CASH FLOW STATEMENTFor the six months ended 30 June 2016
The accompanying notes are an integral part of this statement.
Six months Six months ended ended 30 June 30 June 2016 2015 Notes $’000 $’000
Cash flows from operating activitiesProfit / (loss) before tax 16,515 (18,078)
Adjustments for:Depreciation 3 544 946Provision for bad debts 3 (712) 2,486Share of profits of joint ventures (697) (717)Finance income 4 (3,181) (3,601)Finance expense 4 48,270 48,184Loss on revaluation of investment property 6 6,534 51,901Loss / (profit) on revaluation of investment property under construction 7 1,931 (1,128)Foreign exchange profits (10,283) (1,974)Share-based payments and other long term incentives 15e 4,669 3,280
63,590 81,299
Increase in operating receivables (2,571) (436)Increase in other operating current assets (2) (16)Decrease in operating payables (8,644) (9,269)
52,373 71,578
Receipts from joint ventures 694 1,349Tax paid (3,186) (3,194)
Net cash generated from operating activities 49,881 69,733
Cash flows from investing activitiesPayment for investment property and investment property under construction (4,369) (12,260)Refunds of VAT on construction 172 5,058Release of restricted cash – 25,392Purchase of plant and equipment (294) (531)Loans repaid 227 290Interest received 1,405 1,636
Net cash (used in) / generated from investing activities (2,859) 19,585
Cash flows from financing activitiesProceeds from long term borrowings – 65,944Repayment of long term borrowings (33,698) (28,006)Bank borrowing costs paid (34,639) (34,934)Exercise of warrants 4 14Ordinary shares purchased (5,846) (31,984)Ordinary shares disposed 14,656 –Dividends paid on preference shares (7,906) (8,938)Purchase of preference shares (780) –Settlement of derivative financial instruments – (3,999)Premium paid for derivative financial instruments – (855)
Net cash used in financing activities (68,209) (42,758)
Net (decrease) / increase in cash and cash equivalents (21,187) 46,560
Opening cash and cash equivalents 202,291 171,383Effect of foreign exchange rate changes 1,891 2,969
Closing cash and cash equivalents 182,995 220,912

14
RAVEN RUSSIA LIMITED 2016 INTERIM REPORT
NOTES TO THE CONDENSED UNAUDITED GROUP FINANCIAL STATEMENTS1. Basis of accounting
Basis of preparation
The condensed unaudited financial statements have been prepared using accounting policies consistent with International Financial Reporting Standards adopted for use in the European Union (“IFRS”) and have been prepared in accordance with International Accounting Standard 34 “Interim Financial Reporting”.
The condensed financial statements do not include all the information and disclosures required in annual financial statements and should be read in conjunction with the Group’s financial statements for the year ended 31 December 2015.
Significant accounting policies
The accounting policies adopted in the preparation of the condensed financial statements are consistent with those followed in the preparation of the Group’s financial statements for the year ended 31 December 2015.
The Group has adopted new and amended IFRS and IFRIC interpretations as of 1 January 2016, which did not have any effect on the financial performance, financial position or disclosures in the financial statements of the Group.
The Group has not adopted early any standard, interpretation or amendment that has been issued but is not yet effective.
Going concern
The financial position of the Group, its cash flows, liquidity position and borrowings are described in the Chief Executive’s Review and the notes to these interim financial statements. After making appropriate enquiries and examining sensitivities that could give rise to financial exposure, the Board has a reasonable expectation that the Group has adequate resources to continue operations for the foreseeable future. Accordingly, the Group continues to adopt the going concern basis in the preparation of these interim financial statements.
2. Segmental information
The Group has three operating segments, which are managed and report independently to the Board of Directors. These comprise:
Property investment - acquire, develop and lease commercial property in Russia;
Roslogistics - provision of warehousing, transport, customs brokerage and related services in Russia; and
Raven Mount - sale of residential property in the UK.
For the six months ended 30 June 2016

15
RAVEN RUSSIA LIMITED 2016 INTERIM REPORT
NOTES TO THE CONDENSED UNAUDITED GROUP FINANCIAL STATEMENTS
(a) Segmental information for the six months ended and as at 30 June 2016
For the six months ended 30 June 2016 Property Raven Segment Central Investment Roslogistics Mount Total Overhead Total $’000 $’000 $’000 $’000 $’000 $’000
Gross revenue 89,614 7,910 181 97,705 – 97,705
Operating costs / cost of sales (17,306) (3,398) 3 (20,701) – (20,701)
Net operating income 72,308 4,512 184 77,004 – 77,004
Administrative expenses
Running general and administration expenses (5,763) (660) (620) (7,043) (3,428) (10,471)
Depreciation (424) (120) – (544) – (544)
Share-based payments and other long term incentives (2,447) – – (2,447) (4,453) (6,900)
Foreign currency profits 10,276 7 – 10,283 – 10,283
73,950 3,739 (436) 77,253 (7,881) 69,372
Unrealised loss on revaluation of investment property (6,534) – – (6,534) – (6,534)
Unrealised loss on revaluation of investment property under construction (1,931) – – (1,931) – (1,931)
Share of profits of joint ventures – – 697 697 – 697
Segment profit / (loss) 65,485 3,739 261 69,485 (7,881) 61,604
Finance income 3,181
Finance expense (48,270)
Profit before tax 16,515
As at 30 June 2016 Property Raven Investment Roslogistics Mount Total $’000 $’000 $’000 $’000
Assets
Investment property 1,330,441 – – 1,330,441
Investment property under construction 39,775 – – 39,775
Investment in joint ventures – – 13,579 13,579
Inventory – – 1,258 1,258
Cash and short term deposits 177,947 1,378 3,670 182,995
Segment assets 1,548,163 1,378 18,507 1,568,048
Other non-current assets 40,598
Other current assets 54,539
Total assets 1,663,185
Segment liabilities
Interest bearing loans and borrowings 885,866 – – 885,866
Capital expenditure
Payments for investment property and investment property under construction 4,369 – – 4,369

16
RAVEN RUSSIA LIMITED 2016 INTERIM REPORT
NOTES TO THE CONDENSED UNAUDITED GROUP FINANCIAL STATEMENTS
(b) Segmental information for the six months ended 30 June 2015
Property Raven Segment Central Investment Roslogistics Mount Total Overhead Total $’000 $’000 $’000 $’000 $’000 $’000
Gross revenue 109,905 7,699 685 118,289 – 118,289
Operating costs / cost of sales (19,876) (2,928) (34) (22,838) – (22,838)
Net operating income 90,029 4,771 651 95,451 – 95,451
Administrative expenses
Running general and administration expenses (13,781) (699) (601) (15,081) (2,486) (17,567)
Other acquisition / abortive project costs 929 – – 929 – 929
Depreciation (812) (132) (2) (946) – (946)
Share-based payments and other long term incentives (1,979) – – (1,979) (1,301) (3,280)
Foreign currency profits 1,797 177 – 1,974 – 1,974
76,183 4,117 48 80,348 (3,787) 76,561
Unrealised loss on revaluation of investment property (51,901) – – (51,901) – (51,901)
Unrealised profit on revaluation of investment property under construction 1,128 – – 1,128 – 1,128
Share of profits of joint ventures – – 717 717 717
Segment profit / (loss) 25,410 4,117 765 30,292 (3,787) 26,505
Finance income 3,601
Finance expense (48,184)
Loss before tax (18,078)
(c) Segmental information as at 31 December 2015
Property Raven Investment Roslogistics Mount Total $’000 $’000 $’000 $’000
Assets
Investment property 1,333,987 – – 1,333,987
Investment property under construction 39,129 – – 39,129
Investment in joint ventures – – 14,968 14,968
Inventory – – 1,381 1,381
Cash and short term deposits 196,861 691 4,739 202,291
Segment assets 1,569,977 691 21,088 1,591,756
Other non-current assets 42,639
Other current assets 50,497
Total assets 1,684,892
Segment liabilities
Interest bearing loans and borrowings 918,745 – – 918,745
Capital expenditure
Payments for investment property under construction 20,028 – – 20,028

NOTES TO THE CONDENSED UNAUDITED GROUP FINANCIAL STATEMENTS17
RAVEN RUSSIA LIMITED 2016 INTERIM REPORT
3. Administrative expenses Six months Six months ended ended 30 June 30 June 2016 2015 $’000 $’000
Employment costs 5,521 9,154
Directors’ remuneration 1,788 1,760
Bad debts (712) 2,486
Office running costs and insurance 1,691 2,139
Travel costs 799 901
Auditors’ remuneration 335 343
Abortive project costs – (929)
Legal and professional 754 560
Depreciation 544 946
Registrar costs and other administrative expenses 295 224
11,015 17,584
4. Finance income and expense Six months Six months ended ended 30 June 30 June 2016 2015 $’000 $’000
Finance income
Total interest income on financial assets not at fair value through profit or loss
Income from cash and short term deposits 1,405 1,636
Other finance income
Change in fair value of open interest rate derivative financial instruments 177 557
Change in fair value of foreign currency embedded derivatives 1,599 1,408
Finance income 3,181 3,601
Finance expense
Interest expense on loans and borrowings measured at amortised cost 35,378 35,085
Interest expense on preference shares 8,759 9,278
Total interest expense on financial liabilities not at fair value through profit or loss 44,137 44,363
Change in fair value of open forward currency derivative financial instruments 1,676 848
Change in fair value of open interest rate derivative financial instruments 2,457 2,973
Finance expense 48,270 48,184

NOTES TO THE CONDENSED UNAUDITED GROUP FINANCIAL STATEMENTS18
RAVEN RUSSIA LIMITED 2016 INTERIM REPORT
5. Earnings measures
In addition to reporting IFRS earnings the Group adopts the European Public Real Estate Association (“EPRA”) earnings measure, as set out in their Best Practice Policy Recommendations document issued in December 2014 and also reports its own underlying earnings measure.
EPRA earnings
The EPRA earnings measure excludes investment property revaluations and gains or losses on disposal of investment property, intangible asset movements, gains and losses on derivative financial instruments and related taxation.
Underlying earnings
Underlying earnings consist of the EPRA earnings measure, with additional group adjustments. Adjustments include share-based payments and other long term incentives, the accretion of premiums payable on redemption of preference shares, material non-recurring items, depreciation and amortisation of loan origination costs.
The calculation of basic and diluted earnings per share is based on the following data: Six months Six months ended ended 30 June 30 June 2016 2015 $’000 $’000
Earnings
Earnings for the purposes of basic and diluted earnings per share being the profit / (loss) for the period prepared under IFRS 8,768 (20,607)
Adjustments to arrive at EPRA earnings:
Unrealised loss on revaluation of investment property 6,534 51,901
Unrealised loss / (profit) on revaluation of investment property under construction 1,931 (1,128)
Change in fair value of open forward currency derivative financial instruments 1,676 848
Change in fair value of open interest rate derivative financial instruments 2,280 2,416
Change in fair value of foreign currency embedded derivatives (1,599) (1,408)
Movement on deferred tax thereon 2,033 (3,054)
EPRA earnings 21,623 28,968
Abortive project costs – (929)
Share-based payments and other long term incentives 4,669 3,280
Premium on redemption of preference shares and amortisation of issue costs 278 317
Depreciation 544 946
Amortisation of loan origination costs 1,915 1,766
Tax charge on unrealised foreign exchange movements in loans 2,462 135
Underlying earnings 31,491 34,483
NOTES TO THE CONDENSED UNAUDITED GROUP FINANCIAL STATEMENTS19
RAVEN RUSSIA LIMITED 2016 INTERIM REPORT
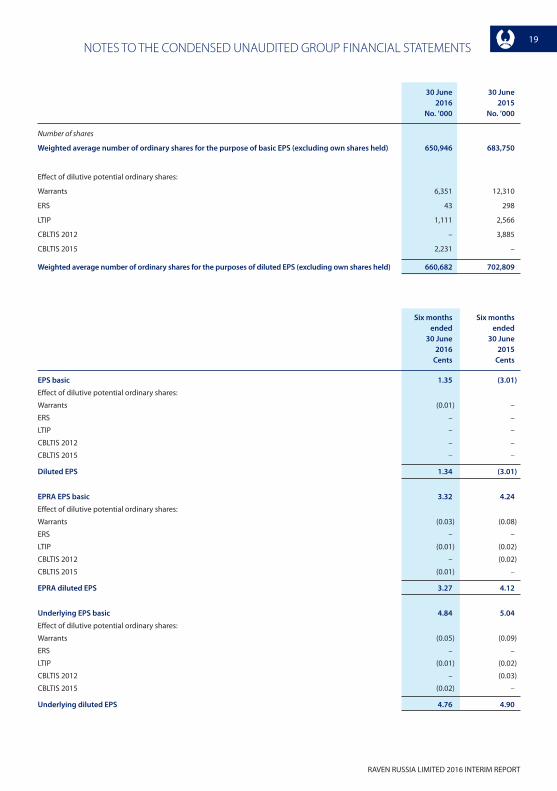
30 June 30 June 2016 2015 No. ’000 No. ’000
Number of shares
Weighted average number of ordinary shares for the purpose of basic EPS (excluding own shares held) 650,946 683,750
Effect of dilutive potential ordinary shares:
Warrants 6,351 12,310
ERS 43 298
LTIP 1,111 2,566
CBLTIS 2012 – 3,885
CBLTIS 2015 2,231 –
Weighted average number of ordinary shares for the purposes of diluted EPS (excluding own shares held) 660,682 702,809
Six months Six months ended ended 30 June 30 June 2016 2015 Cents Cents
EPS basic 1.35 (3.01)
Effect of dilutive potential ordinary shares:
Warrants (0.01) –
ERS – –
LTIP – –
CBLTIS 2012 – –
CBLTIS 2015 – –
Diluted EPS 1.34 (3.01)
EPRA EPS basic 3.32 4.24
Effect of dilutive potential ordinary shares:
Warrants (0.03) (0.08)
ERS – –
LTIP (0.01) (0.02)
CBLTIS 2012 – (0.02)
CBLTIS 2015 (0.01) –
EPRA diluted EPS 3.27 4.12
Underlying EPS basic 4.84 5.04
Effect of dilutive potential ordinary shares:
Warrants (0.05) (0.09)
ERS – –
LTIP (0.01) (0.02)
CBLTIS 2012 – (0.03)
CBLTIS 2015 (0.02) –
Underlying diluted EPS 4.76 4.90

NOTES TO THE CONDENSED UNAUDITED GROUP FINANCIAL STATEMENTS20
RAVEN RUSSIA LIMITED 2016 INTERIM REPORT
6. Investment propertyAsset class Logistics Logistics Logistics Office Location Moscow St Petersburg Regions St Petersburg Fair value hierarchy* Level 3 Level 3 Level 3 Level 3 Total $’000 $’000 $’000 $’000 $’000
Market value at 1 January 2016 1,043,952 139,106 148,649 25,140 1,356,847
Property improvements and movement in completion provisions 3,174 203 54 (85) 3,346
Unrealised (loss) / profit on revaluation (1,943) (2,279) (3,882) 151 (7,953)
Market value at 30 June 2016 1,045,183 137,030 144,821 25,206 1,352,240
Tenant incentives and contracted rent uplift balances (16,305) (5,320) (1,176) (371) (23,172)
Head lease obligations 1,373 – – – 1,373
Carrying value at 30 June 2016 1,030,251 131,710 143,645 24,835 1,330,441
Revaluation movement in the period ended 30 June 2016
Gross revaluation (1,943) (2,279) (3,882) 151 (7,953)
Effect of tenant incentives and contracted rent uplift balances 242 12 142 1,023 1,419
Revaluation reported in the Income Statement (1,701) (2,267) (3,740) 1,174 (6,534)
Asset class Logistics Logistics Logistics Office Location Moscow St Petersburg Regions St Petersburg Fair value hierarchy* Level 3 Level 3 Level 3 Level 3 Total $’000 $’000 $’000 $’000 $’000
Market value at 1 January 2015 1,222,101 170,074 191,576 28,852 1,612,603
Property improvements and movement in completion provisions (2,768) (1,194) 114 (266) (4,114)
Unrealised loss on revaluation (175,381) (29,774) (43,041) (3,446) (251,642)
Market value at 31 December 2015 1,043,952 139,106 148,649 25,140 1,356,847
Tenant incentives and contracted rent uplift balances (16,547) (5,332) (1,318) (1,394) (24,591)
Head lease obligations 1,731 – – – 1,731
Carrying value at 31 December 2015 1,029,136 133,774 147,331 23,746 1,333,987
*Classified in accordance with the fair value hierarchy. There were no transfers between fair value hierarchy in 2015 or 2016.
At 30 June 2016 the Group has pledged investment property with a value of $1,340 million (31 December 2015: $1,348 million) to secure banking facilities granted to the Group (note 9).

NOTES TO THE CONDENSED UNAUDITED GROUP FINANCIAL STATEMENTS21
RAVEN RUSSIA LIMITED 2016 INTERIM REPORT
7. Investment property under construction
Asset class Assets under construction Land BankLocation Moscow Regions St Petersburg Regions Fair value hierarchy* Level 3 Level 3 Sub-total Level 3 Level 3 Sub-total Total $’000 $’000 $’000 $’000 $’000 $’000 $’000
Market value at 1 January 2016 27,700 7,300 35,000 413 2,714 3,127 38,127
Costs incurred 124 12 136 474 160 634 770
Effect of foreign exchange rate changes 1,181 714 1,895 54 395 449 2,344
Unrealised loss on revaluation (1,305) (626) (1,931) – – – (1,931)
Market value at 30 June 2016 27,700 7,400 35,100 941 3,269 4,210 39,310
Head lease obligations 465 – 465 – – – 465
Carrying value at 30 June 2016 28,165 7,400 35,565 941 3,269 4,210 39,775
Asset class Assets under construction Land BankLocation Moscow Regions St Petersburg Regions Fair value hierarchy* Level 3 Level 3 Sub-total Level 3 Level 3 Sub-total Total $’000 $’000 $’000 $’000 $’000 $’000 $’000
Market value at 1 January 2015 34,000 9,500 43,500 – 3,216 3,216 46,716
Costs incurred 789 – 789 413 283 696 1,485
Effect of foreign exchange rate changes (2,369) (1,570) (3,939) – (785) (785) (4,724)
Unrealised loss on revaluation (4,720) (630) (5,350) – – – (5,350)
Market value at 31 December 2015 27,700 7,300 35,000 413 2,714 3,127 38,127
Head lease obligations 1,002 – 1,002 – – – 1,002
Carrying value at 31 December 2015 28,702 7,300 36,002 413 2,714 3,127 39,129
*Classified in accordance with the fair value hierarchy
Six months Six months ended ended 30 June 30 June 2016 2015 $’000 $’000
Revaluation movement in the period
Unrealised (loss) / profit on revaluation of assets carried at external valuations (1,931) 1,128
Unrealised loss on revaluation of assets carried at directors’ valuation – –
(1,931) 1,128
No borrowing costs were capitalised in the period (31 December 2015: $nil).
At 30 June 2016 the Group has pledged investment property under construction with a value of $35.1 million (31 December 2015: $35.0 million) to secure banking facilities granted to the Group (note 9).

NOTES TO THE CONDENSED UNAUDITED GROUP FINANCIAL STATEMENTS22
RAVEN RUSSIA LIMITED 2016 INTERIM REPORT
8. Valuation assumptions and key inputs
Class of property Carrying amount Range
30 June 31 December Valuation Input 30 June 31 December 2016 2015 Technique 2016 2015 $’000 $’000
Completed investment property
Moscow - Logistics 1,030,251 1,029,136 Income Long term ERV per sqm capitalisation for existing tenants $90 to $110 $90 to $110
Short term ERV per sqm for vacant space Rub4,300 Rub4,500
Initial yield 2.18% to 15.1% 11.2% to 14.9%
Equivalent yield 10.9% to 12.5% 10.8% to 12.7%
Vacancy rate 6% to 77% 13.9% to 100.0%
Passing rent per sqm $70 to $158 $62 to $158
Passing rent per sqm Rub3,500 to Rub4,500 to Rub6,744 Rub6,300
St Petersburg - Logistics 131,710 133,774 Income Long term ERV per sqm capitalisation for existing tenants $75 $75
Short term ERV per sqm for vacant space Rub3,800 Rub4,000
Initial yield 12.3% to 13.5% 13.3% to 14.1%
Equivalent yield 12.3% to 12.6% 12.7% to 13.3%
Vacancy rate 2% to 19% 11.7% to 40.0%
Passing rent per sqm $105 to $136 $80 to $133
Passing rent per sqm Rub3,500 to Rub3,060 to Rub4,968 Rub4,600
Regional - Logistics 143,645 147,331 Income Long term ERV per sqm capitalisation for existing tenants $74 $75
Short term ERV per sqm for vacant space Rub3,800 Rub4,000
Initial yield 12.9% to 13.9% 12.2% to 13.1%
Equivalent yield 12.5% 12.7%
Vacancy rate 17% to 21% 13.0% to 21.0%
Passing rent per sqm $101 to $129 $101 to $128
Passing rent per sqm Rub3,900 to Rub3,060 to Rub6,547 Rub4,600
St Petersburg - Office 24,835 23,746 Income ERV per sqm $235 $235
capitalisation Initial yield 17.9% 15.8%
Equivalent yield 13.0% 13.0%
Vacancy rate 0% 0%
Passing rent per sqm $293 $294

NOTES TO THE CONDENSED UNAUDITED GROUP FINANCIAL STATEMENTS23
RAVEN RUSSIA LIMITED 2016 INTERIM REPORT
Carrying amount Range
Investment property 30 June 31 December Valuation Input 30 June 31 December under construction 2016 2015 technique 2016 2015 $’000 $’000
Moscow - Logistics 28,165 28,702 Comparable Value per ha ($m) $0.30 - $0.62 $0.29 - $0.61
Regional - Logistics 7,400 7,300 Comparable Value per ha ($m) $0.29 $0.29
In preparing their valuations at 30 June 2016, JLL have again made reference to the uncertainty caused in the market by the low oil price, weak Rouble and continuing sanctions. This was the case at 31 December 2015 and the impact of this on the valuation process is set out more fully in note 13 of the 2015 Annual Report.
Range
30 June 31 December Other key information Description 2016 2015
Moscow - Logistics Land plot ratio 34% - 65% 31% - 65%
Age of building 1 to 12 years 1 to 11 years
Outstanding costs ($’000) 5,873 6,931
St Petersburg - Logistics Land plot ratio 51% - 57% 51% - 57%
Age of building 2 to 8 years 1 to 7 years
Outstanding costs ($’000) 1,092 743
Regional - Logistics Land plot ratio 48% - 61% 48% - 61%
Age of building 7 years 6 years
Outstanding costs ($’000) 487 81
St Petersburg - Office Land plot ratio 320% 320%
Age of building 10 years 9 years
Outstanding costs ($’000) – 53
9. Interest bearing loans and borrowings 30 June 31 December 2016 2015 $’000 $’000
Loans due for settlement within 12 months 201,702 104,724
Loans due for settlement after 12 months 684,164 814,021
885,866 918,745
The Group’s borrowings have the following maturity profile:
On demand or within one year 201,702 104,724
In the second year 158,597 162,222
In the third to fifth years 411,371 527,861
After five years 114,196 123,938
885,866 918,745
The amounts above include unamortised loan origination costs of $9.7 million (31 December 2015: $11.3 million) and interest accruals of $1.6 million (31 December 2015: $2.3 million).

NOTES TO THE CONDENSED UNAUDITED GROUP FINANCIAL STATEMENTS24
The principal terms of the Group’s interest bearing loans and borrowings on a weighted average basis are summarised below:
Interest Maturity As at 30 June 2016 Rate (years) $’000
Secured on investment property and investment property under construction 7.1% 3.5 864,616
Unsecured facility of the Company 8.6% 4.2 21,250
885,866
As at 31 December 2015
Secured on investment property and investment property under construction 7.2% 4.0 894,995
Unsecured facility of the Company 8.5% 4.7 23,750
918,745
The interest rates shown above are the weighted average cost, including US LIBOR, as at the Balance Sheet dates.
As previously disclosed, the facility secured on the office block in St Petersburg continued to be in technical breach of its debt service covenant ratio and thus the cash sweep has also continued. In accordance with accounting standards, the amount outstanding of $32 million has been included in loans due for settlement within 12 months.
RAVEN RUSSIA LIMITED 2016 INTERIM REPORT
10. Preference shares 30 June 31 December 2016 2015 $’000 $’000
Authorised share capital:
400,000,000 preference shares of 1p each 5,981 5,981
30 June 31 December 2016 2015 $’000 $’000
Issued share capital:
At 1 January 156,558 164,300
Purchased in the period / year (780) –
Premium on redemption of preference shares and amortisation of issue costs 278 614
Scrip dividends 335 643
Effect of foreign exchange rate changes (14,494) (8,999)
At 30 June / 31 December 141,897 156,558
30 June 31 December 2016 2015 Number Number
Issued share capital:
At 1 January 98,328,017 98,012,427
Purchased in the period / year (450,000) –
Scrip dividends 202,877 315,590
At 30 June / 31 December 98,080,894 98,328,017
Shares in issue 98,567,943 98,365,066
Held by the Company’s Employee Benefit Trusts (487,049) (37,049)
At 30 June / 31 December 98,080,894 98,328,017

NOTES TO THE CONDENSED UNAUDITED GROUP FINANCIAL STATEMENTS25
RAVEN RUSSIA LIMITED 2016 INTERIM REPORT
11. Share capital 30 June 31 December 2016 2015 $’000 $’000
Authorised share capital:
1,500,000,000 ordinary shares of 1p each 27,469 27,469
30 June 31 December 2016 2015 $’000 $’000
Issued share capital:
At 1 January 12,776 13,623
Issued in the period / year for cash on warrant exercises – 7
Repurchased and cancelled in the period / year (145) (854)
At 30 June / 31 December 12,631 12,776
30 June 31 December 2016 2015 Number Number
Issued share capital:
At 1 January 682,560,376 737,598,353
Issued in the period / year for cash on warrant exercises 12,165 457,589
Repurchased and cancelled in the period / year (10,236,175) (55,495,566)
At 30 June / 31 December 672,336,366 682,560,376
Of the authorised ordinary share capital at 30 June 2016, 25.0 million (31 December 2015: 25.0 million) ordinary shares are reserved for warrants.
Details of own shares held are given in note 13.

NOTES TO THE CONDENSED UNAUDITED GROUP FINANCIAL STATEMENTS26
RAVEN RUSSIA LIMITED 2016 INTERIM REPORT
12. Warrants 30 June 31 December 2016 2015 $’000 $’000
At 1 January 1,167 1,195
Exercised in the period / year (1) (28)
At 30 June / 31 December 1,166 1,167
30 June 31 December 2016 2015 Number Number
At 1 January 25,008,823 25,466,412
Exercised in the period / year (12,165) (457,589)
At 30 June / 31 December 24,996,658 25,008,823
13. Own shares held 30 June 31 December 2016 2015 $’000 $’000
At 1 January (52,101) (63,649)
Acquisition – (76)
Disposal 43,161 –
Cancelled 48 3,692
Allocation to satisfy ERS options exercised (note 15a) 68 258
Allocation to satisfy LTIP options exercised (note 15a) – 901
Allocation to satisfy CBLTIS 2012 awards vesting (note 15b) – 6,773
Allocation to satisfy CBLTIS 2015 awards vesting (note 15c) 877 –
At 30 June / 31 December (7,947) (52,101)
30 June 31 December 2016 2015 Number Number
At 1 January 38,456,594 49,048,873
Acquisition – 98,040
Disposal (30,937,631) –
Cancelled (40,047) (3,395,130)
Allocation to satisfy ERS options exercised (note 15a) (62,755) (237,146)
Allocation to satisfy LTIP options exercised (note 15a) – (828,515)
Allocation to satisfy CBLTIS 2012 awards vesting (note 15b) – (6,229,528)
Allocation to satisfy CBLTIS 2015 awards vesting (note 15c) (729,608) –
At 30 June / 31 December 6,686,553 38,456,594
Allocations are transfers by the Company’s Employee Benefit Trusts to satisfy ERS and LTIP options exercised in the period and the vesting of CBLTIS 2012 and CBLTIS 2015 awards. The amounts shown for share movements are net of the Trustees’ participation in tender offers during the period from grant to exercise. Details of outstanding ERS and LTIP options, which are vested but unexercised, are given in note 15a.

NOTES TO THE CONDENSED UNAUDITED GROUP FINANCIAL STATEMENTS27
RAVEN RUSSIA LIMITED 2016 INTERIM REPORT
14. Net asset value per share 30 June 31 December 2016 2015 $’000 $’000
Net asset value 488,619 465,042
Goodwill (2,036) (2,245)
Goodwill in joint venture (4,656) (5,134)
Unrealised foreign exchange (profits) / losses on preference shares (9,538) 4,956
Excess liabilities over assets on non-recourse secured debt 7,050 –
Fair value of interest rate derivative financial instruments (10) (2,289)
Fair value of embedded derivatives 1,633 3,231
Fair value of foreign exchange derivative financial instruments (1,038) (2,869)
Adjusted net asset value 480,024 460,692
Assuming exercise of potential ordinary shares
– Warrants (note 12) 8,354 9,215
– ERS (note 15) – –
– LTIP (note 15) 1,461 1,611
– CBLTIS 2015 (note 15) – –
Adjusted fully diluted net asset value 489,839 471,518
30 June 31 December 2016 2015
Number of ordinary shares (note 11) 672,336,366 682,560,376
Less own shares held (note 13) (6,686,553) (38,456,594)
665,649,813 644,103,782
Assuming exercise of all potential ordinary shares
– Warrants (note 12) 24,996,658 25,008,823
– ERS (note 15) – 75,000
– LTIP (note 15) 4,372,973 4,372,973
– CBLTIS 2015 (note 15) – 2,993,670
Number of ordinary shares assuming exercise of all potential ordinary shares 695,019,444 676,554,248
30 June 31 December 2016 2015 Cents Cents
Net asset value per share 73 72
Diluted net asset value per share 72 70
Adjusted net asset value per share 72 72
Adjusted diluted net asset value per share 70 70
Where the quantum of non-recourse secured debt exceeds the value of the relevant assets upon which it is secured, the excess will be added back to arrive at the Group’s adjusted net asset value. This is to reflect that the Group does not have an obligation to make good this shortfall to the relevant lender.

NOTES TO THE CONDENSED UNAUDITED GROUP FINANCIAL STATEMENTS28
RAVEN RUSSIA LIMITED 2016 INTERIM REPORT
15. Share-based payments and other long term incentives
Six months ended 30 June 2016 Six months ended 30 June 2015 Weighted Weighted average average (a) Movements in Executive No. of exercise No. of exercise
Share Option Schemes options price options price
Outstanding at the beginning of the period 4,447,973 25p 5,708,784 24p
Exercised during the period
– ERS (75,000) 0p (75,000) 0p
– LTIP – 25p (200,000) 25p
Outstanding at the end of the period 4,372,973 25p 5,433,784 24p
Represented by
– ERS – 250,000
– LTIP 4,372,973 5,183,784
4,372,973 5,433,784
Exercisable at the end of the period 4,372,973 25p 5,433,784 24p
Six months Six months ended ended 30 June 30 June 2016 2015 (b) Movements in Combined Bonus and Long Term No. of No. of
Incentive Scheme 2012 Awards (“CBLTIS 2012”) award shares award shares
Awards of Ordinary shares:
Outstanding at the beginning of the period – 7,401,158
– Vested during the period – (7,401,158)
Outstanding at the end of the period – –
Six months Six months ended ended 30 June 30 June 2016 2015 (c) Movements in Combined Bonus and Long Term No. of No. of
Incentive Scheme 2015 Awards (“CBLTIS 2015”) award shares award shares
Awards of Ordinary shares:
Outstanding at the beginning of the period 34,800,000 –
– Granted during the period – 34,800,000
– Waived during the period (20,900,625) –
– Vested during the period (791,435) –
– Lapsed during the period (6,207,940) –
– Cancelled during the period (6,900,000) –
Outstanding at the end of the period – 34,800,000

NOTES TO THE CONDENSED UNAUDITED GROUP FINANCIAL STATEMENTS29
RAVEN RUSSIA LIMITED 2016 INTERIM REPORT
(d) 2016 Retention Scheme Awards
During the period the Group terminated the CBLTIS 2015 and the Company’s shareholders approved the introduction of the 2016 Retention Scheme. Awards under the scheme have been made to the executive directors of the Company and two senior managers of the Group. The awards entitle the participants to three equal payments each equivalent to 150% of their basic salary. The first instalment was payable upon approval of the scheme and the second and third instalments will be payable on 31 December 2017 and 31 March 2019. The sole condition for each instalment being paid is the continuing employment of the participant at the relevant payment date.
Participants will receive payment of an instalment in a combination of the Company’s listed securities and cash. The number of listed securities to be issued to satisfy such payments will be calculated with reference to the average price of the relevant security prior to the payment date. On 13 July 2016 an employment benefit trust of the Company transferred 2,148,375 convertible preference shares (see note 18) to participants of the scheme in satisfaction of the first instalment. It is intended that convertible preference shares held by an employment benefit trust will also be used to satisfy the proportion of the second and third instalments that are to be settled in listed securities.
Six months Six months ended ended 30 June 30 June 2016 2015 (e) Income statement charge for the period $’000 $’000
CBLTIS 2015 1,496 3,320
CBLTIS 2012 – (40)
2016 Retention Scheme 5,404 –
6,900 3,280
To be satisfied by allocation of:
Ordinary shares (IFRS 2 expense) 1,496 3,280
Convertible preference shares (IFRS 2 expense) 3,173 –
Cash 2,231 –
6,900 3,280
16. Ordinary dividends
The Company did not declare a final dividend for the year ended 31 December 2015 (2014: none) and instead implemented a tender offer buy back for ordinary shares on the basis of 1 in every 40 shares held and a tender price of 40 pence per share, the equivalent of a final dividend of 1 pence per share. (2014: 1 in every 15 shares at 52p per share the equivalent of 3.5p per share).

NOTES TO THE CONDENSED UNAUDITED GROUP FINANCIAL STATEMENTS30
RAVEN RUSSIA LIMITED 2016 INTERIM REPORT
17. Financial instruments
Set out below is a comparison of the carrying amounts and fair value of the Group’s financial instruments as at the balance sheet date:
30 June 2016 31 December 2015 Carrying Fair Carrying Fair Value Value Value Value $’000 $’000 $’000 $’000
Non-current assets
Loans receivable 349 296 606 567
Security deposits 4,000 4,000 2,391 2,391
Derivative financial instruments 1,402 1,402 5,585 5,585
Current assets
Trade receivables 41,471 41,471 38,683 38,683
Security deposits 2,393 2,393 2,041 2,041
Other current receivables 264 264 202 202
Derivative financial instruments 82 82 233 233
Cash and short term deposits 182,995 182,995 202,291 202,291
Non-current liabilities
Interest bearing loans and borrowings 684,164 549,314 814,021 623,340
Preference shares 141,897 166,024 156,558 184,705
Derivative financial instruments 618 618 1,794 1,794
Rent deposits 27,264 20,775 28,932 21,999
Other payables 1,831 1,831 2,721 2,721
Current liabilities
Interest bearing loans and borrowings 201,702 201,702 104,724 104,724
Derivative financial instruments 1,451 1,451 2,097 2,097
Rent deposits 8,324 8,324 6,827 6,827
Other payables 8,029 8,029 6,090 6,090
NOTES TO THE CONDENSED UNAUDITED GROUP FINANCIAL STATEMENTS31
RAVEN RUSSIA LIMITED 2016 INTERIM REPORT
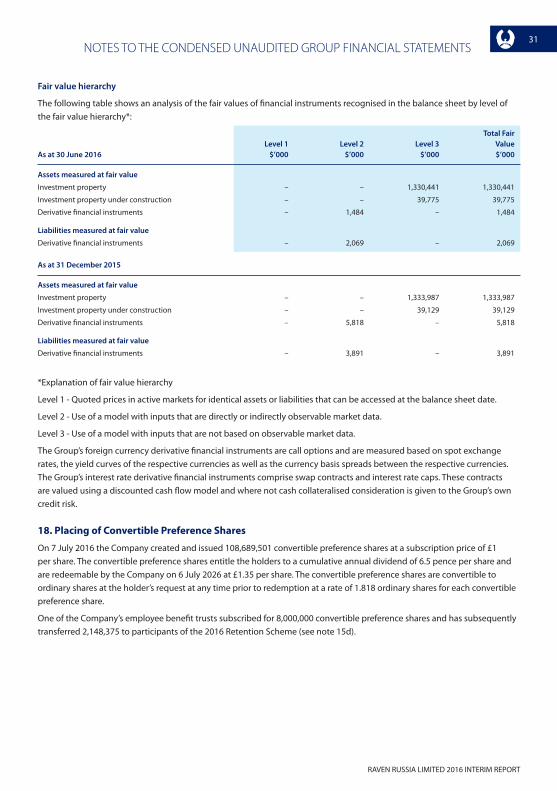
Fair value hierarchy
The following table shows an analysis of the fair values of financial instruments recognised in the balance sheet by level of the fair value hierarchy*:
Total Fair Level 1 Level 2 Level 3 ValueAs at 30 June 2016 $’000 $’000 $’000 $’000
Assets measured at fair value
Investment property – – 1,330,441 1,330,441
Investment property under construction – – 39,775 39,775
Derivative financial instruments – 1,484 – 1,484
Liabilities measured at fair value
Derivative financial instruments – 2,069 – 2,069
As at 31 December 2015
Assets measured at fair value
Investment property – – 1,333,987 1,333,987
Investment property under construction – – 39,129 39,129
Derivative financial instruments – 5,818 – 5,818
Liabilities measured at fair value
Derivative financial instruments – 3,891 – 3,891
*Explanation of fair value hierarchy
Level 1 - Quoted prices in active markets for identical assets or liabilities that can be accessed at the balance sheet date.
Level 2 - Use of a model with inputs that are directly or indirectly observable market data.
Level 3 - Use of a model with inputs that are not based on observable market data.
The Group’s foreign currency derivative financial instruments are call options and are measured based on spot exchange rates, the yield curves of the respective currencies as well as the currency basis spreads between the respective currencies. The Group’s interest rate derivative financial instruments comprise swap contracts and interest rate caps. These contracts are valued using a discounted cash flow model and where not cash collateralised consideration is given to the Group’s own credit risk.
18. Placing of Convertible Preference Shares
On 7 July 2016 the Company created and issued 108,689,501 convertible preference shares at a subscription price of £1 per share. The convertible preference shares entitle the holders to a cumulative annual dividend of 6.5 pence per share and are redeemable by the Company on 6 July 2026 at £1.35 per share. The convertible preference shares are convertible to ordinary shares at the holder’s request at any time prior to redemption at a rate of 1.818 ordinary shares for each convertible preference share.
One of the Company’s employee benefit trusts subscribed for 8,000,000 convertible preference shares and has subsequently transferred 2,148,375 to participants of the 2016 Retention Scheme (see note 15d).
NOTES TO THE CONDENSED UNAUDITED GROUP FINANCIAL STATEMENTS32
RAVEN RUSSIA LIMITED 2016 INTERIM REPORT
ENQUIRIESRaven Russia Limited Tel: + 44 (0) 1481 712955
Anton Bilton Glyn Hirsch
Novella Communications Tel: +44 (0) 203 151 7008
Tim RobertsonToby Andrews
N+1 Singer Tel: +44 (0) 20 7496 3000
Corporate Finance - James Maxwell / Liz YongSales - Alan Geeves / James Waterlow
Barclays Bank Plc Tel: +44 (0) 20 7623 2323
Tom Boardman / Tom Macdonald
Ravenscroft Tel: +44 (0) 1481 729100
David McGall


www.ravenrussia.com
Registered OfficeP.O. Box 522, Second Floor, La Vieille Cour, La Plaiderie, St. Peter Port, Guernsey, GY1 6EH
RAVEN RUSSIA LIMITED