raw camera dpcm compression performance...
TRANSCRIPT

RAW camera DPCM compression performance analysis
Katherine Bouman, Vikas Ramachandra, Kalin Atanassov, Mickey Aleksic and Sergio R. GomaQualcomm Incorporated.
ABSTRACT
The MIPI standard has adopted DPCM compression for RAW data images streamed from mobile cameras.This DPCM is line based and uses either a simple 1 or 2 pixel predictor. Due to its simplicity, the 1-pixelDPCM predictor has been almost exclusively used in the industry and is of interest of our investigation. Theimportance of evaluating image quality deterioration due to DPCM compression is further stressed by the factthat often DPCM compression/decompression is used repeatedly along the image processing pipeline to savememory buffers. In this paper, we analyze the DPCM compression performance as MTF degradation. Since itis well known that MIPI DPCM predictor is difference dependent and an edge is the most challenging structure,we use edges with varying level difference. The MTF is estimated by using a slanted edge according to I3Astandard.1 Slanted edges with different differentials can be generated by using Siemens star images that arebinarized to two levels. The edge level differences are chosen such that they will produce the largest DPCMquantization error (edge difference falls between two quantization levels). DPCM compression introduces errorsof different magnitudes and signs based on the pixel differences. As expected, those errors cause high pass orlow pass degradation of the edge. In this study we passed edges with different level differences through 1-pixelDPCM compressor and computed the MTF responses. An eye diagram plot of the MTFs over a range of edgedifferences presents a useful methodology for evaluating the severity and consistency of a DPCM compressionscheme. The latter becomes increasingly important as fixed or adaptive tone mapping is introduced later in theimage processing pipeline.
Keywords: MIPI, DPCM, RAW, compression, MTF
1. INTRODUCTION
The MIPI standard has adopted DPCM compression for images streamed from mobile cameras.2 This DPCM isline based and uses either a simple 1 or 2 pixel predictor. Here, we analyze the performance of the simple 1-pixelDPCM quantizer. This scheme uses one previous pixel to predict the present pixel, in combination with a M-Nbit quantizer. If used on raw image data (e.g. with a GRBG Bayer pattern) we have Xpred(n) = Xdecoded(n−2).An example of a simple DPCM encoder and decoder3 is shown in Fig. 1 .
Figure 1. A simple DPCM encoder/ decoder block diagram.
Qualcomm Inc., 5775 Morehouse Drive, San Diego CA 92121.
Image Quality and System Performance VIII, edited by Susan P. Farnand, Frans Gaykema, Proc. of SPIE-IS&T ElectronicImaging, SPIE Vol. 7867, 78670N · © 2011 SPIE-IS&T · CCC code: 0277-786X/11/$18 · doi: 10.1117/12.872637
SPIE-IS&T/ Vol. 7867 78670N-1
Downloaded From: http://proceedings.spiedigitallibrary.org/ on 11/28/2012 Terms of Use: http://spiedl.org/terms
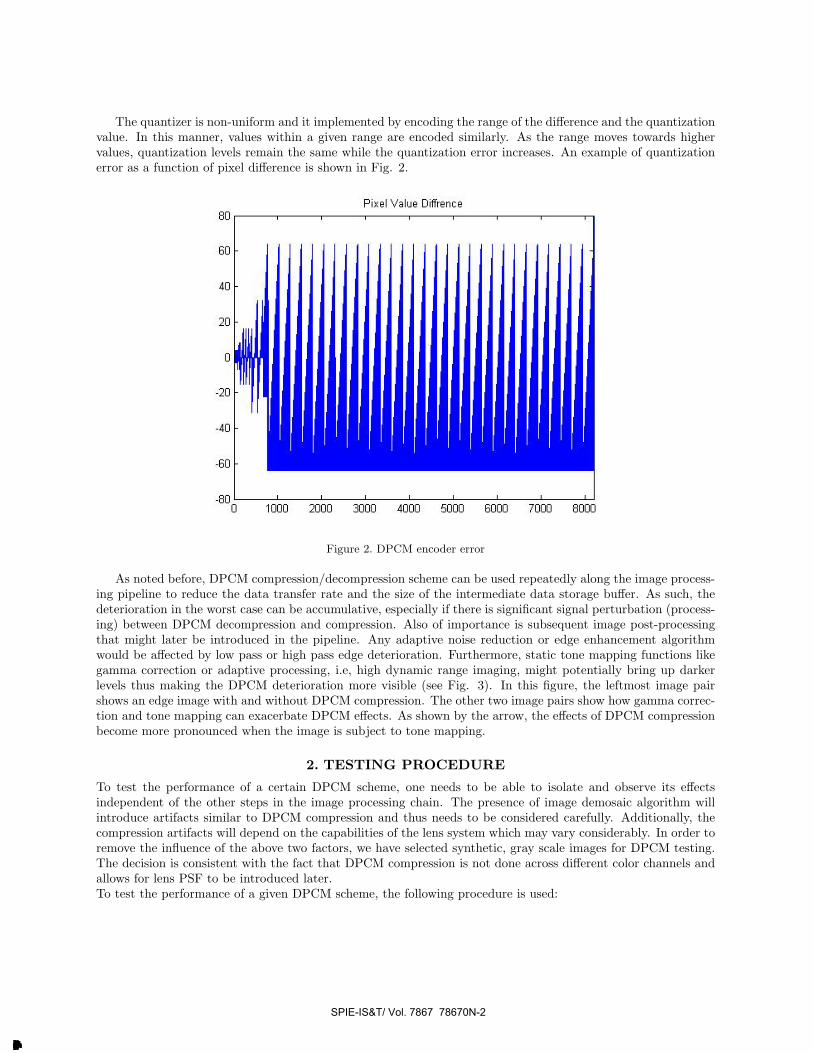
The quantizer is non-uniform and it implemented by encoding the range of the difference and the quantizationvalue. In this manner, values within a given range are encoded similarly. As the range moves towards highervalues, quantization levels remain the same while the quantization error increases. An example of quantizationerror as a function of pixel difference is shown in Fig. 2.
Figure 2. DPCM encoder error
As noted before, DPCM compression/decompression scheme can be used repeatedly along the image process-ing pipeline to reduce the data transfer rate and the size of the intermediate data storage buffer. As such, thedeterioration in the worst case can be accumulative, especially if there is significant signal perturbation (process-ing) between DPCM decompression and compression. Also of importance is subsequent image post-processingthat might later be introduced in the pipeline. Any adaptive noise reduction or edge enhancement algorithmwould be affected by low pass or high pass edge deterioration. Furthermore, static tone mapping functions likegamma correction or adaptive processing, i.e, high dynamic range imaging, might potentially bring up darkerlevels thus making the DPCM deterioration more visible (see Fig. 3). In this figure, the leftmost image pairshows an edge image with and without DPCM compression. The other two image pairs show how gamma correc-tion and tone mapping can exacerbate DPCM effects. As shown by the arrow, the effects of DPCM compressionbecome more pronounced when the image is subject to tone mapping.
2. TESTING PROCEDURE
To test the performance of a certain DPCM scheme, one needs to be able to isolate and observe its effectsindependent of the other steps in the image processing chain. The presence of image demosaic algorithm willintroduce artifacts similar to DPCM compression and thus needs to be considered carefully. Additionally, thecompression artifacts will depend on the capabilities of the lens system which may vary considerably. In order toremove the influence of the above two factors, we have selected synthetic, gray scale images for DPCM testing.The decision is consistent with the fact that DPCM compression is not done across different color channels andallows for lens PSF to be introduced later.To test the performance of a given DPCM scheme, the following procedure is used:
SPIE-IS&T/ Vol. 7867 78670N-2
Downloaded From: http://proceedings.spiedigitallibrary.org/ on 11/28/2012 Terms of Use: http://spiedl.org/terms

Figure 3. Effect of DPCM on other image processing steps: Left and right image pairs show original image on the leftand processed image on the right.
• Siemens star images are generated and binarized to black and white (2 level) images ∗
• Black and white values (low and high levels) are then adjusted to produce a certain level difference (thelower level does not affect DPCM compression, thus it is selected to be zero).
• The level differences are selected based on the following.
– They span the input range of the quantizer, i.e., 2M levels.
– They are just below and over (as bit granularity allows) the mid-point that is between any two adjacentquantization levels †
• Compress the image using the compression scheme under evaluation
• Select an edge with an appropriate slant and compute MTF using I3A standard
• Overlay the MTF for different edge differences to produce the eye diagram
The test procedure is as illustrated in Fig. 4.
3. RESULTS
In this section, we compare the slanted edge MTF response of a cropped region of a DPCM compressed Starimage to that of the corresponding region in the original image. The MTF response is the frequency response ofthe derivative of the cropped edge image region. For an ideal edge whose derivative is the impulse function, theMTF is a horizontal line. For real image edges, the MTF is flat for a large section of the frequency range andhas a slow roll-off. This MTF response is further affected by DPCM compression. For light to dark (intensity)transitions, we have plotted the MTF for transitions from 21 to 0 and 150 to 0. For dark to light transitions,we have plotted the MTF for 0 to 24 and 0 to 208. It is clear from Fig. 5 that the DPCM scheme introduceserrors which results in a noticeable degradation of the MTF response curves. An interesting observation is thatthe degradation can either be high pass or low pass in nature. The amount of degradation is indicated by thedeviation of the MTF of the DPCM compressed image (shown in blue) from the MTF of the original edge image(shown in red). Fig. 6 through Fig. 9 show the MTF response functions for DPCM compression of differentlevel transitions (from low to high as well as high to low) as compared to the MTF response of the originalimage(in black) for the three M-N compression schemes considered (12-6 bit, 10-8 bit and 8-6 bit compression).Different amounts of MTF degradation are introduced by DPCM for different pixel intensity difference values.
∗The usage of Siemens star is not critical but useful to evaluate the consistency of the methodology†The level difference selection is not necessary (brute force approach could have produce similar results) but useful to
reduce the amount of data to visualize/display.
SPIE-IS&T/ Vol. 7867 78670N-3
Downloaded From: http://proceedings.spiedigitallibrary.org/ on 11/28/2012 Terms of Use: http://spiedl.org/terms
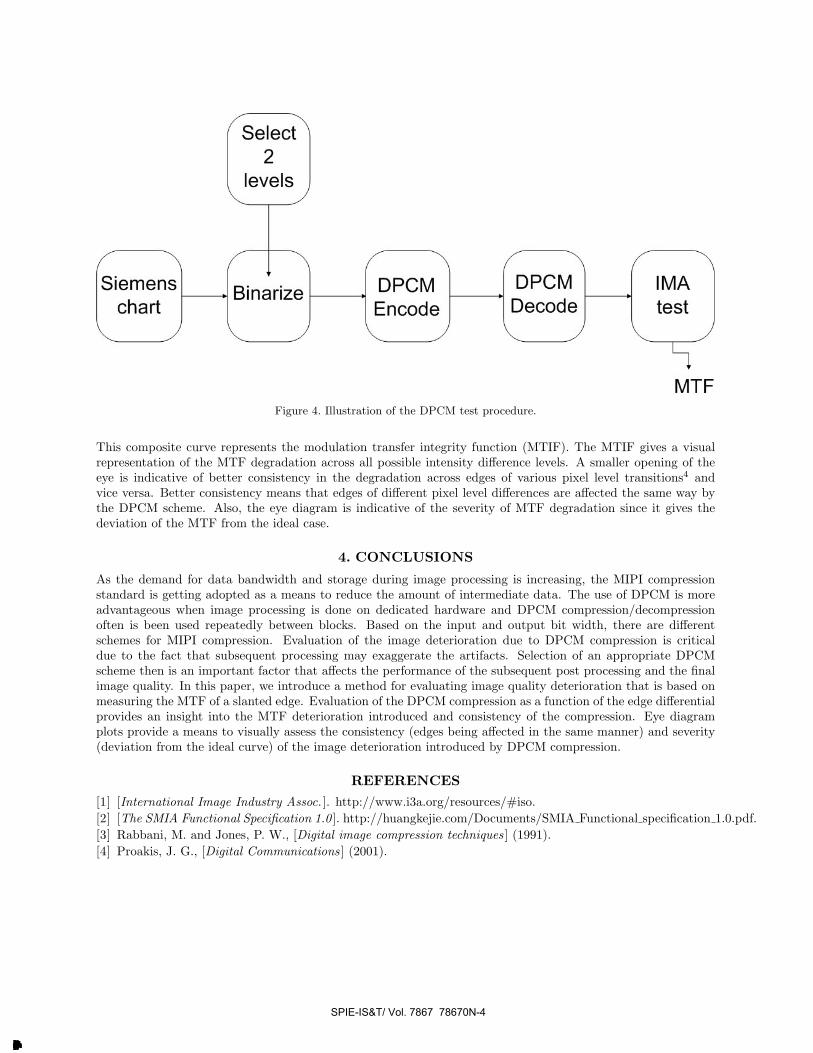
Figure 4. Illustration of the DPCM test procedure.
This composite curve represents the modulation transfer integrity function (MTIF). The MTIF gives a visualrepresentation of the MTF degradation across all possible intensity difference levels. A smaller opening of theeye is indicative of better consistency in the degradation across edges of various pixel level transitions4 andvice versa. Better consistency means that edges of different pixel level differences are affected the same way bythe DPCM scheme. Also, the eye diagram is indicative of the severity of MTF degradation since it gives thedeviation of the MTF from the ideal case.
4. CONCLUSIONS
As the demand for data bandwidth and storage during image processing is increasing, the MIPI compressionstandard is getting adopted as a means to reduce the amount of intermediate data. The use of DPCM is moreadvantageous when image processing is done on dedicated hardware and DPCM compression/decompressionoften is been used repeatedly between blocks. Based on the input and output bit width, there are differentschemes for MIPI compression. Evaluation of the image deterioration due to DPCM compression is criticaldue to the fact that subsequent processing may exaggerate the artifacts. Selection of an appropriate DPCMscheme then is an important factor that affects the performance of the subsequent post processing and the finalimage quality. In this paper, we introduce a method for evaluating image quality deterioration that is based onmeasuring the MTF of a slanted edge. Evaluation of the DPCM compression as a function of the edge differentialprovides an insight into the MTF deterioration introduced and consistency of the compression. Eye diagramplots provide a means to visually assess the consistency (edges being affected in the same manner) and severity(deviation from the ideal curve) of the image deterioration introduced by DPCM compression.
REFERENCES
[1] [International Image Industry Assoc. ]. http://www.i3a.org/resources/#iso.
[2] [The SMIA Functional Specification 1.0 ]. http://huangkejie.com/Documents/SMIA Functional specification 1.0.pdf.
[3] Rabbani, M. and Jones, P. W., [Digital image compression techniques ] (1991).
[4] Proakis, J. G., [Digital Communications ] (2001).
SPIE-IS&T/ Vol. 7867 78670N-4
Downloaded From: http://proceedings.spiedigitallibrary.org/ on 11/28/2012 Terms of Use: http://spiedl.org/terms
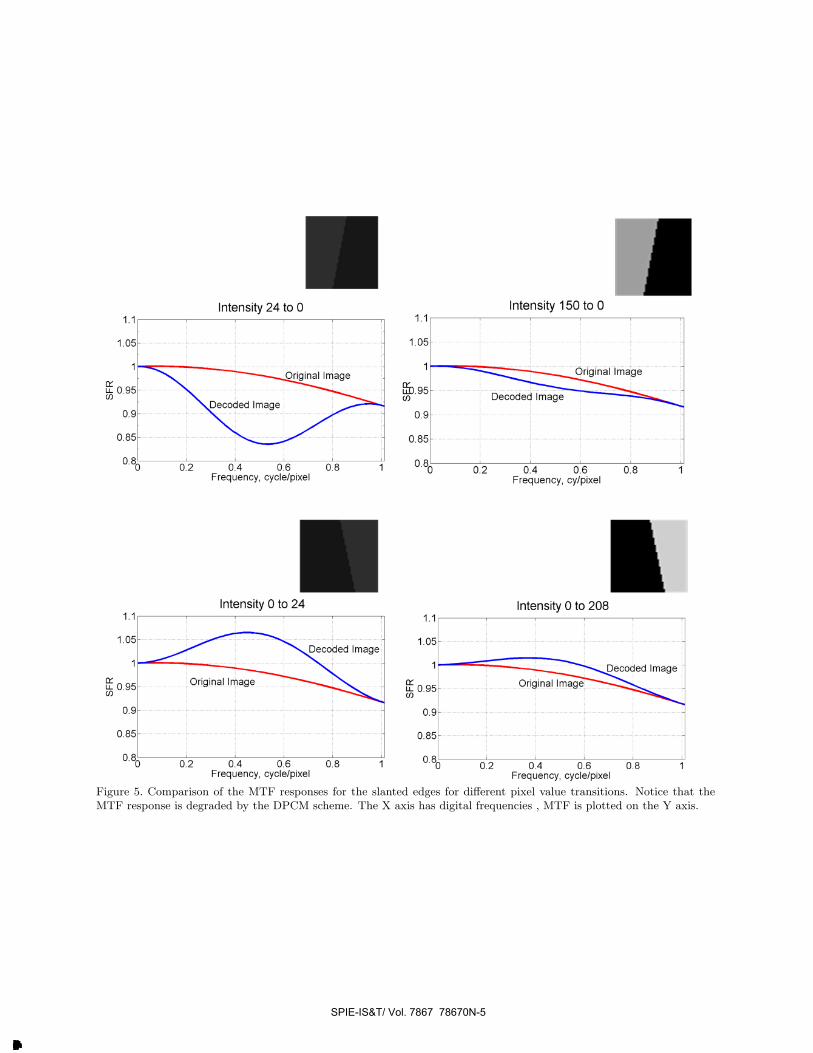
Figure 5. Comparison of the MTF responses for the slanted edges for different pixel value transitions. Notice that theMTF response is degraded by the DPCM scheme. The X axis has digital frequencies , MTF is plotted on the Y axis.
SPIE-IS&T/ Vol. 7867 78670N-5
Downloaded From: http://proceedings.spiedigitallibrary.org/ on 11/28/2012 Terms of Use: http://spiedl.org/terms
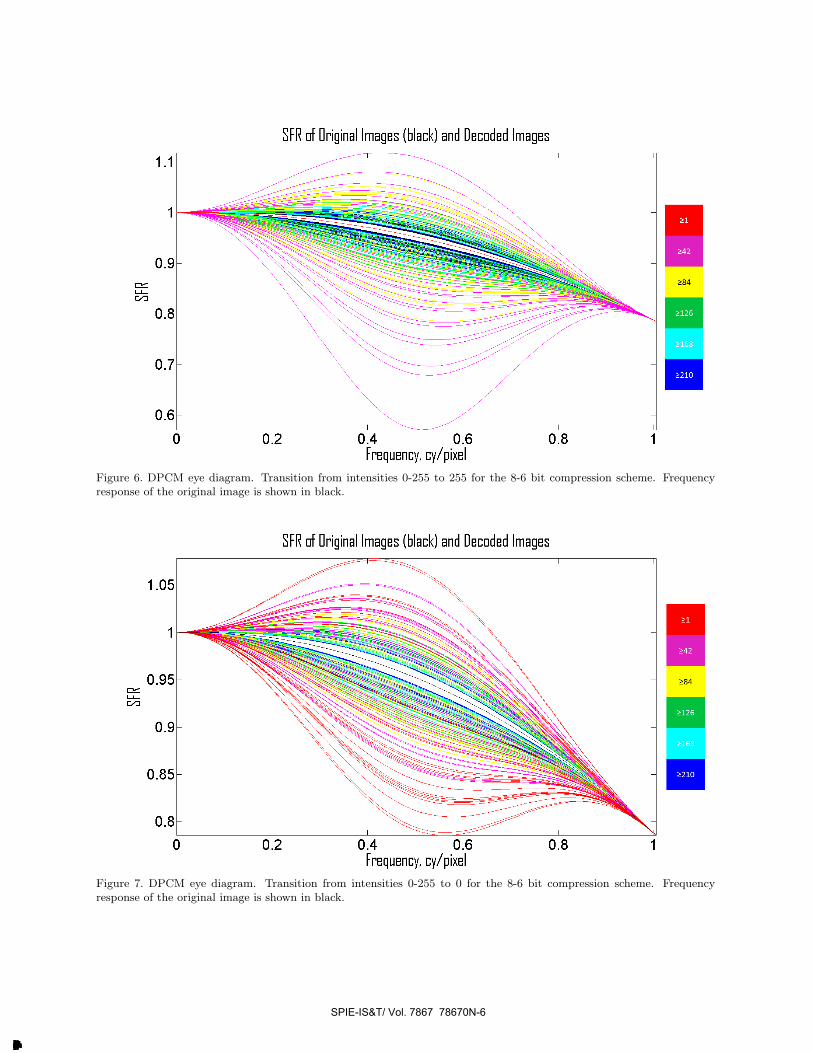
Figure 6. DPCM eye diagram. Transition from intensities 0-255 to 255 for the 8-6 bit compression scheme. Frequencyresponse of the original image is shown in black.
Figure 7. DPCM eye diagram. Transition from intensities 0-255 to 0 for the 8-6 bit compression scheme. Frequencyresponse of the original image is shown in black.
SPIE-IS&T/ Vol. 7867 78670N-6
Downloaded From: http://proceedings.spiedigitallibrary.org/ on 11/28/2012 Terms of Use: http://spiedl.org/terms
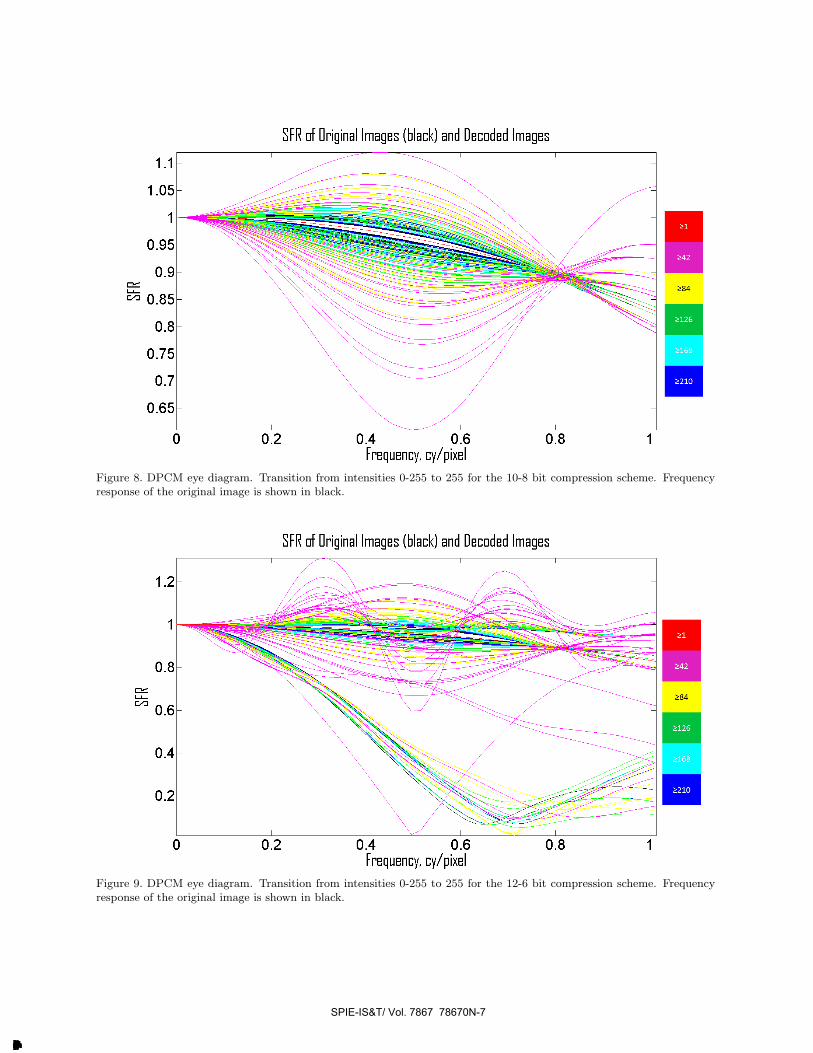
Figure 8. DPCM eye diagram. Transition from intensities 0-255 to 255 for the 10-8 bit compression scheme. Frequencyresponse of the original image is shown in black.
Figure 9. DPCM eye diagram. Transition from intensities 0-255 to 255 for the 12-6 bit compression scheme. Frequencyresponse of the original image is shown in black.
SPIE-IS&T/ Vol. 7867 78670N-7
Downloaded From: http://proceedings.spiedigitallibrary.org/ on 11/28/2012 Terms of Use: http://spiedl.org/terms