rayovac corporation 2003 annual report proud past … · rayovac corporation 2003 annual report p...
TRANSCRIPT

Proud PastPowerful Future
R a y o v a c C o r p o r a t i o n
2003 Annual Report

R a y o v a c C o r p o r a t i o n
2003 Annual Report
P R O U D
P A S T
P O W E R F U L
F U T U R E
Rayovac Corporation is a global consumer products
company with a diverse portfolio of world-class brands, including Rayovac,
Varta and Remington. With operations on six continents and more than
5,000 employees, Rayovac is one of the largest battery, lighting and personal
grooming products companies in the world.
The Company holds many leading market positions including: world leader in
hearing aid batteries; top selling rechargeable battery brand in North America
and Europe; and number one selling brand of men’s and women’s foil electric
razors in North America. Rayovac markets its products in more than 100
countries and counts nine of the world’s top 10 retailers as its customers.
Rayovac trades on the New York Stock Exchange under symbol ROV.
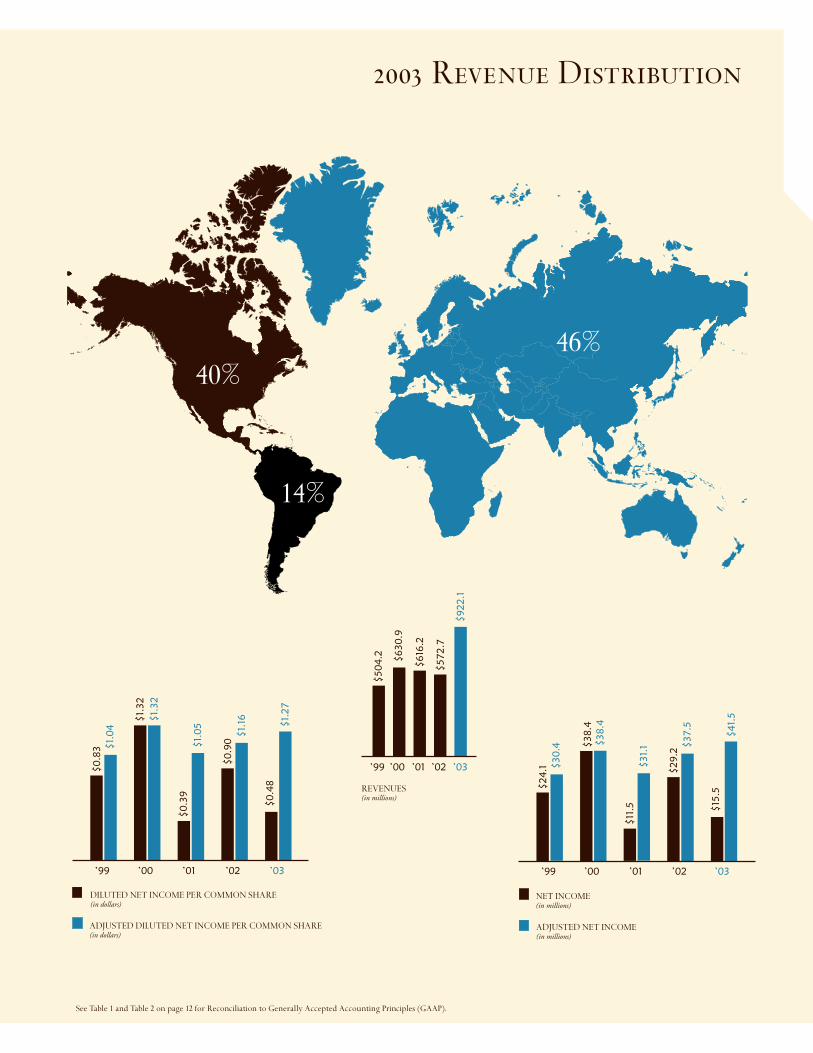
2003 Revenue Distribution
’02
$41.
5
$37.5
$31.
1$38.4
$30
.4
$15
.5
$29.2
$11
.5
$38.4
$24.1
’03’01’00
ADJUSTED NET INCOME(in millions)
’99
NET INCOME (in millions)
’02
$1.
27
$1.
16
$1.
05
$1.
32
$1.
04
$0
.48
$0
.90
$0
.39
$1.
32
$0
.83
’03’01’00
ADJUSTED DILUTED NET INCOME PER COMMON SHARE(in dollars)
DILUTED NET INCOME PER COMMON SHARE(in dollars)
’99
’02
$616
.2
$630
.9
$50
4.2
REVENUES (in millions)
’03’01’00’99
$922.1
$572.7
40%
14%
46%
See Table 1 and Table 2 on page 12 for Reconciliation to Generally Accepted Accounting Principles (GAAP).

Page 2/3
R a y o v a c C o r p o r a t i o n
2003 Annual Report
RAYOVAC’S GROWING
ARRAY OF WORLD-CLASS
CONSUMER PRODUCTS
ENSURES THAT RAYOVAC
WILL CONTINUE TO MEET
THE NEEDS OF TODAY’S
CONSUMERS.
Diverse Product Line

To Our Shareholders Over the last several years, Rayovac Corporation has aggressively
pursued its goal to become a technology-focused, market-driven, global battery company.
In fiscal 2003, our efforts paid off abundantly. We not only achieved our long-held objective,
but we set our sights on a bold new mission: to become a leading global consumer products
enterprise. During the past year, we engaged in a number of strategic measures geared to
help us realize our ambitious new vision. We:
• Completed the integration of the consumer battery business of Varta AG, which
we acquired in October 2002, by restructuring our global business and creating new
organizational efficiencies.
• Developed and launched a successful new U.S. alkaline battery retail strategy to
differentiate Rayovac from our competitors, while underscoring our traditional
value position with retailers and consumers.
• Reinforced our reputation for innovation by introducing a revolutionary new
round-cell rechargeable battery system that secures our position as the industry’s
technology leader.
• Acquired Remington Products Company, a leading designer and distributor of
battery-powered electric shavers and accessories, grooming products, and personal
care appliances. This acquisition diversified our product line and enhanced our
status with our customers as a global supplier. We financed the transaction through
an attractive and successful high-yield bond offering, an indication that investors
recognize the strength of our growing enterprise and our ability to generate cash.
These collective efforts provided us with a broader product portfolio, solidified our position
with global retail customers, enhanced our worldwide supply capabilities, fortified our
reputation for innovation and provided us with an expanded portfolio of powerful global
brands. They also positioned us to assume an exciting new place among some of the leading
consumer products companies in the world.
Transforming to a Global Consumer Products Company Rayovac’s largest retail
customers are expanding around the world and are seeking to partner with suppliers who
can serve their global needs. To respond to these demands, Rayovac has moved strategically
to make acquisitions, including Varta’s consumer battery business. Our October 2002
acquisition of Varta immediately positioned us as one of the largest consumer battery
and lighting companies in the world and the number two battery company in Europe.

Page 4/5
It also broadened our product portfolio and provided us with a European manufacturing
and distribution infrastructure, thereby increasing our ability to serve our global
retail customers.
Our next step was to capitalize on our newly expanded global presence by diversifying
our product line. Rayovac’s history is as a manufacturer and marketer of battery and
lighting products. By acquiring Remington Products Company at the close of fiscal 2003,
we significantly broadened our product mix. The addition of Remington electric shavers,
grooming and other personal care products was an important first move toward meeting
our product diversification goals.
Remington, a highly respected global brand, is an ideal complement to the Rayovac and
Varta brands. Remington also shares with Rayovac and Varta an outstanding record of
growth and a commitment to innovation, quality and value. Through this acquisition, we
have enhanced our ability to leverage our global distribution system and customer base.
We have decreased our reliance on a single product and industry. Moreover, we have
propelled Rayovac into new channels and new markets with new competitors, thereby
providing access to a range of growth opportunities.
Meeting the Challenges of Integration Rayovac has repeatedly demonstrated its
success in integrating acquisitions. In 1999, we expanded our global presence through
the integration of ROV Ltd., a Latin American battery company. In fiscal 2003, we
demonstrated our expertise once again with the highly successful integration of the
Varta consumer battery business, a move that has generated significant cost synergies
at lower costs than originally anticipated.
During the year, we also implemented a series of restructuring initiatives that maximized
operating efficiencies and merged the Rayovac and Varta businesses around the world
into three fully integrated regional business units: North America, Latin America and
Europe/Rest of World. By combining each company’s strengths, we streamlined our
business, reduced our combined operating costs by more than $40 million, and offered
our customers enhanced service. We also continued to invest in our implementation of
the SAP enterprise system in order to support the operation of our global business. This
involved upgrading to the current production release of the software and installing the
package in some remaining countries where it was not yet operating.
Our acquisition of Varta and the accompanying restructuring had a dramatic impact on
our year-over-year financial results. Fiscal 2003 sales increased to $922.1 million, compared
R a y o v a c C o r p o r a t i o n
2003 Annual Report

REMINGTON’S NEW
PRODUCT PIPELINE WILL
ALLOW RAYOVAC TO
SERVE THE NEEDS OF A
GROWING SHAVING
AND GROOMING MARKET
FOR YEARS TO COME.
New Product Pipeline
®MD
North America Latin America Europe/Rest of World
2004 Projection
Rayovac/Varta/Remington
2003 Remington2003 Rayovac/Varta
70%
30%
50%
40%
10%
46%
14%
40%
Revenue Distribution by Region

Page 6/7
R a y o v a c C o r p o r a t i o n
2003 Annual Report
A Global Industry Player
RAYOVAC’S ACQUISITION
OF VARTA’S CONSUMER
BATTERY BUSINESS HAS
TRANSFORMED THE
COMPANY INTO A
GLOBAL PLAYER IN THE
RAPIDLY EXPANDING
BATTERY INDUSTRY.

with $572.7 million in fiscal 2002. Diluted earnings per share was $0.48. However, adjusted
diluted earnings per share, excluding certain charges as detailed in Table 1 on page 12,
rose to $1.27.
We are currently applying the same proven management disciplines and principles that
we used in integrating Varta to our newest acquisition, Remington. We are driving sales
through our global distribution network and customer base, and we are creating new
efficiencies by integrating our supply chain, back-office operations, product development
and information systems functions. We expect these efforts to generate significant savings by
fiscal 2005, creating a more efficient and capable organization that will compete effectively
on a global scale.
Executing an Aggressive New Retail Strategy During the past year, we also focused
on addressing the challenges in our North American battery business. We responded
to increased promotional and pricing competition in the alkaline battery category by
launching an exciting new retail strategy aimed at reestablishing our value positioning
in the market.
This strategy, unique to the battery industry, offers “50% More” batteries in AA and AAA
sizes, at roughly the same retail price points as the smaller package sizes offered by major
competitors. Rayovac’s value proposition of “More Power for Your Money!” was well
received by North American retailers, who welcomed the new package configuration on
their shelves. To support the strategy, we launched a comprehensive marketing effort,
including a new targeted television campaign. Consumer reaction has been positive, and
we expect sales growth in our North American alkaline business in fiscal 2004.
Reaffirming Our Reputation for Innovation Rayovac has developed a reputation
as a technology leader by continually providing consumers with new or improved,
technologically advanced products to meet their portable power needs. In 1994, we
introduced rechargeable alkaline batteries to the U.S. market. In 2001, we launched the first
portable charger that charged high-capacity Nickel Metal Hydride (NiMH) batteries in one
hour or less. In the summer of 2003, we took speed charging to a higher level with the
introduction of the revolutionary new In-Cell Charge Control (I-C3) rechargeable NiMH
battery system of batteries and chargers. This breakthrough in NiMH technology offers
performance and convenience advantages over existing rechargeable and disposable battery
systems. An I-C3 battery will charge in an unprecedented 15 minutes or less and up to 1,000
times. The battery also lasts up to four times longer than alkaline batteries in digital cameras.

Page 8/9
Since its introduction, the new I-C3 rechargeable system has generated favorable press
coverage from several leading trade and consumer technology publications. The system
was chosen by the editors of Popular Science to receive their “Best of What’s New in 2003”
award, one of only 100 products that are chosen for this honor. American Photo named
the system “Editor’s Choice for Fastest Charger” and positive stories about the system
have appeared in PC World, U.S. News and World Report, Popular Photography, The New York Times
and others. More importantly, retailers and consumers have embraced the system for its
compelling convenience, power and value.
Building Our Business with World-Class Brands As a result of our acquisitions,
Rayovac has assembled a portfolio of powerful brands that are well recognized and highly
regarded by consumers around the world. Together Rayovac, Varta and Remington
represent more than 350 years of branding—giving us a considerable advantage in the
consumer products marketplace where brand recognition and trust is crucial to success.
We intend to continue to grow our business and leverage our global distribution and
customer base by adding more leading brands to our product mix. We will continue to
seek appropriate acquisition candidates like Varta and Remington—market-share
leaders with innovative products, excellent growth, attractive profit margins and proven
capabilities in product development and marketing. We are confident that we will be able
to continue to identify and acquire the best opportunities and integrate them in a way that
yields maximum value for our shareholders.
Implementing Our Proven Strategy for Future Growth We set and met a high
operating standard in 2003, and we expect to reap the benefits of our efforts in 2004 and
beyond. As always, we will concentrate on executing our proven business strategy to
globalize and diversify our organization; leverage and strengthen our brand portfolio;
expand our worldwide distribution capabilities; generate growth through innovative
product technology, product design and marketing; drive efficiencies and reduce costs;
and pursue strategic acquisitions. Execution of this strategy will allow us to grow both
revenue and earnings over the long term, creating increased shareholder value.
Proud Past, Powerful Future At Rayovac, we are firmly committed to building on our
past investments as a solid foundation for our Company’s future growth. What’s more, we
believe that we have the fundamental strengths that will enable us to do so in a highly
effective way. We are a market leader in several product areas, including batteries, lighting
products and electric shavers. Our distribution network is global, and our relationships
R a y o v a c C o r p o r a t i o n
2003 Annual Report

Power and Value
RAYOVAC’S BATTERY AND
LIGHTING PRODUCTS
DELIVER OUTSTANDING
PERFORMANCE FOR
CONSUMERS AT
ATTRACTIVE VALUE PRICES.

Page 10/11
Left–David A. Jones
Right–Kent J. Hussey
RAYOVAC’S POWERFUL
BRANDS PROVIDE NEW
OPPORTUNITIES TO DRIVE
INCREASED SALES AND
EARNINGS, AS WELL AS THE
ABILITY TO MARKET AND
DISTRIBUTE MORE PRODUCTS
TO MORE CUSTOMERS IN
MORE PLACES IN THE WORLD
THAN EVER BEFORE.
A Powerful Team
“Our greatest strength is our growing portfolio of world-class
brands that pave the way for our further expansion as a
technology-focused, market-driven, global consumer
products company.”
R a y o v a c C o r p o r a t i o n
2003 Annual Report

with global retailers are expanding. We have a proven history of successful acquisitions, as
well as the ability to generate cost savings and significant cash flow. Our management team
brings years of experience from leading companies around the world. And we have the best
and the brightest people—creative and dedicated employees who bring their individual
skills and talents to every function at Rayovac, from product innovation to customer
service to marketing to manufacturing.
Our greatest strength, however, is in our growing portfolio of world-class brands that pave
the way for our further expansion as a technology-focused, market-driven, global consumer
products company. Rayovac’s powerful brands, combined with our other strengths, provide
us with brighter growth prospects, new opportunities to drive increased sales and earnings,
and a substantial new ability to market and distribute more products to more customers
in more places in the world than ever before.
We’re proud of our long and successful history. We pledge to continue to build on that
solid foundation by making the sound business decisions that will propel our Company
forward. We believe we are poised for even greater success well beyond the global consumer
battery marketplace. By staying focused on the keys to our past success—technological
innovation, top-quality products and people, strategic acquisitions, product diversification
and customer service—we are confident that we will have a rewarding future. As
shareholders in Rayovac, we will settle for nothing less.
David A. JonesChairman and Chief Executive Officer
Kent J. HusseyPresident and Chief Operating Officer
1.
4.
7. 8.
5.
2. 3.
6.
9.
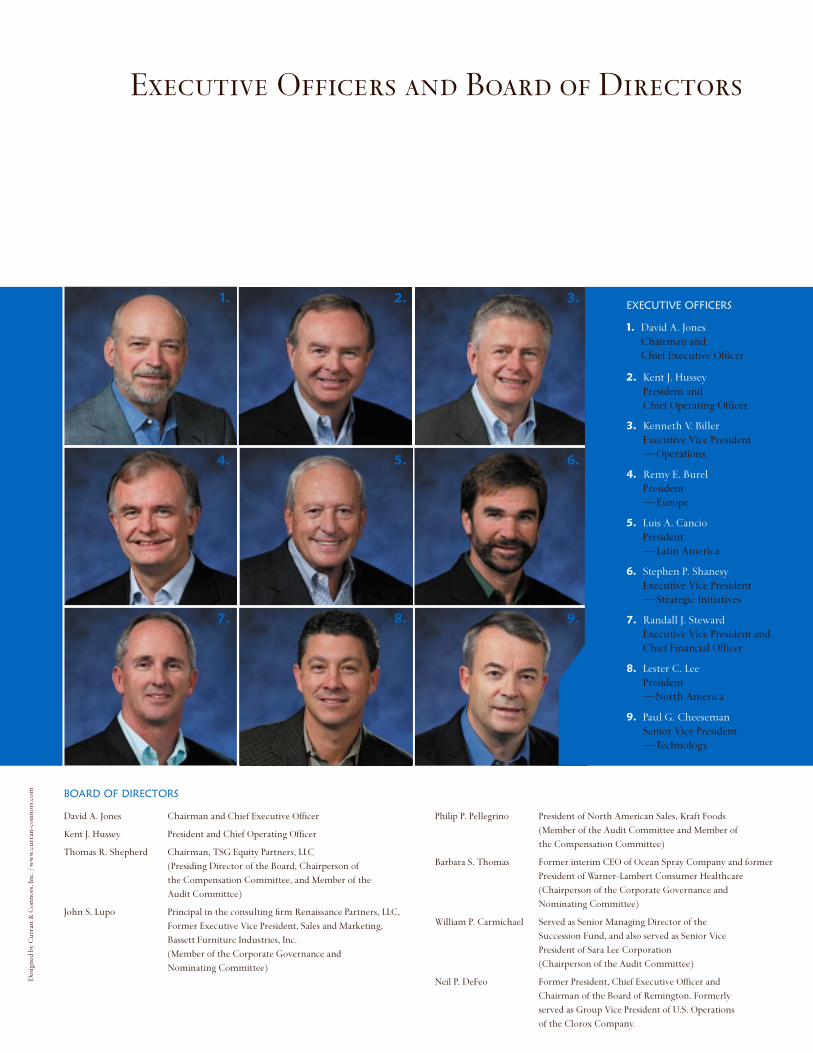
Executive Officers and Board of Directors
EXECUTIVE OFFICERS
1. David A. Jones Chairman and Chief Executive Officer
2. Kent J. Hussey President and Chief Operating Officer
3. Kenneth V. Biller Executive Vice President— Operations
4. Remy E. Burel President— Europe
5. Luis A. Cancio President— Latin America
6. Stephen P. Shanesy Executive Vice President— Strategic Initiatives
7. Randall J. Steward Executive Vice President and Chief Financial Officer
8. Lester C. Lee President —North America
9. Paul G. Cheeseman Senior Vice President—Technology
BOARD OF DIRECTORS
David A. Jones Chairman and Chief Executive Officer
Kent J. Hussey President and Chief Operating Officer
Thomas R. Shepherd Chairman, TSG Equity Partners, LLC (Presiding Director of the Board, Chairperson of the Compensation Committee, and Member of the Audit Committee)
John S. Lupo Principal in the consulting firm Renaissance Partners, LLC,Former Executive Vice President, Sales and Marketing, Bassett Furniture Industries, Inc. (Member of the Corporate Governance and Nominating Committee)
Philip P. Pellegrino President of North American Sales, Kraft Foods (Member of the Audit Committee and Member of the Compensation Committee)
Barbara S. Thomas Former interim CEO of Ocean Spray Company and formerPresident of Warner-Lambert Consumer Healthcare (Chairperson of the Corporate Governance and Nominating Committee)
William P. Carmichael Served as Senior Managing Director of the Succession Fund, and also served as Senior Vice President of Sara Lee Corporation (Chairperson of the Audit Committee)
Neil P. DeFeo Former President, Chief Executive Officer and Chairman of the Board of Remington. Formerly served as Group Vice President of U.S. Operations of the Clorox Company.
Des
igne
d by
Cur
ran
& C
onno
rs, I
nc. /
ww
w.c
urra
n-co
nnor
s.com

Page 12/13
The Company believes adjusting for unusual items in the Company’s results provides useful information regarding the Company’s
ability to service its indebtedness and facilitates investors’ and analysts’ ability to evaluate the Company’s operations excluding these
unusual items. However, the following factors should be considered in evaluating such measures: Adjusted Net Income and other
related adjusted financial measures (i) should not be considered in isolation, (ii) are not measures of performance calculated in
accordance with generally accepted accounting principles (“GAAP”), (iii) should not be construed as alternatives or substitutes for
income from operations, net income or cash flows from operating activities in analyzing the Company’s operating performance,
financial position or cash flows (in each case, as determined in accordance with GAAP) and (iv) should not be used as indicators of
the Company’s operating performance or measures of its liquidity. Additionally, because all companies do not calculate Adjusted
Net Income and related adjusted financial measures in a uniform fashion, the calculations presented herein may not be comparable
to other similarly titled measures of other companies.
All information in millions, except per-share amountsTable 1—Adjusted Diluted Net Income Per ShareImpact of Unusual Items within the Statement of Operations: 1999 2000 2001 2002 2003
Diluted Net Income Per Share (3) $0.83 $1.32 $0.39 $0.90 $0.48Unusual ItemsUnusual items within gross profit and operating expenses, net of tax (1), (2) 0.21 — 0.48 0.26 0.73Non-operating expense, net of tax (4) — — 0.18 — 0.06
Adjusted diluted net income per share $1.04 $1.32 $1.05 $1.16 $1.27
Table 2—Adjusted Net IncomeImpact of Unusual Items within the Statement of Operations: 1999 2000 2001 2002 2003
Net income (3) $24.1 $38.4 $11.5 $29.2 $15.5Unusual ItemsUnusual items within gross profit and operating expenses, net of tax (1), (2) 6.3 — 14.2 8.3 24.1Non-operating expense, net of tax (4) — — 5.4 — 1.9
Adjusted net income $30.4 $38.4 $31.1 $37.5 $41.5
(1) The Company recorded Restructuring and related charges within gross profit and operating expenses during fiscal 1999, 2001, 2002, and 2003 reflecting: (i) the rationalization of uneconomic manufacturing, packaging, and distribution processes, (ii) the realignment of manufacturing capacities, and (iii) restructuring of the Company’s administrative functions. In fiscal 2003, the Company recorded retailer markdown costs of $6.2 million, as a reduction to net sales, as part of the introduction of the Company’s new alkaline product line packaging. Please see Footnote 15 in the Notes to Consolidated Financial Statements and the Management’sDiscussion and Analysis for more information.
(2) In fiscal 2002, the Company recognized a bad debt reserve of $12.0 million, net of recoveries, attributable to the bankruptcy filing of a key customer.(3) In fiscal 2002, the Company adopted the provisions of Statement of Financial Accounting Standards No. 142, Goodwill and Other Intangible Assets, which requires that
goodwill and intangible assets with indefinite useful lives no longer be amortized. See also Footnote 2(x) and Footnote 5 in the Notes to Consolidated FinancialStatements and the Management’s Discussion and Analysis for more information.
(4) The Company recorded non-operating expenses in fiscal 2001 and fiscal 2003 relating to the premium on the repurchase of or redemption of the Company’s seniorterm notes and write-off of debt issuance costs. See Footnote 6 in the Notes to Consolidated Financial Statements and the Management’s Discussion and Analysis formore information.
Financial Table of ContentsRayovac Corporation and Subsidiaries
Selected Financial Data page 13
Management’s Discussion and Analysis of Financial Condition and Results of Operations page 15
Consolidated Balance Sheets page 29
Consolidated Statements of Income page 30
Consolidated Statements of Shareholders’ Equity page 31
Consolidated Statements of Cash Flows page 32
Notes to Consolidated Financial Statements page 33
Management’s Statement of Responsibility for Financial Statements page 64
Independent Auditors’ Report page 65
Market for Registrant’s Common Equity and Related Stockholder Matters page 66
Reconciliation to Generally Accepted Accounting Principles (GAAP)Rayovac Corporation and Subsidiaries

The following selected historical financial data is derived from our audited consolidated financial statements. Only the most recent
three fiscal years’ audited statements are included elsewhere in this Annual Report. The following selected financial data should be
read in conjunction with our consolidated financial statements and notes thereto and the information contained in “Management’s
Discussion and Analysis of Financial Condition and Results of Operations” included elsewhere herein.
Fiscal Year Ended September 30,
(In millions, except per share data) 1999 (4) 2000 2001 (5) 2002 (6) 2003 (7) (8)
Statement of Operations Data:
Net sales (1) $504.2 $630.9 $616.2 $572.7 $ 922.1
Gross profit (1) 198.2 259.4 232.9 237.4 351.5
Income from operations (2) 53.6 89.3 54.4 63.0 59.6
Income before income taxes (3) 37.6 58.0 17.5 45.7 23.0
Net income 24.1 38.4 11.5 29.2 15.5
Restructuring and related charges—cost of goods sold $ 1.3 $ — $ 22.1 $ 1.2 $ 21.1
Restructuring and related charges—operating expenses 8.1 — 0.2 — 11.5
Non-operating expense (3) — — 8.6 — 3.1
Interest expense $ 16.3 $ 30.6 $ 27.2 $ 16.0 $ 37.2
Per Share Data:
Net income per common share:
Basic $ 0.88 $ 1.39 $ 0.40 $ 0.92 $ 0.49
Diluted 0.83 1.32 0.39 0.90 0.48
Average shares outstanding:
Basic 27.5 27.5 28.7 31.8 31.8
Diluted 29.2 29.1 29.7 32.4 32.6
Cash Flow and Related Data:
Net cash provided by operating activities $ 13.3 $ 32.8 $ 18.0 $ 66.8 $ 76.2
Capital expenditures 24.1 19.0 19.7 15.6 26.1
Depreciation and amortization (excluding amortization of
debt issuance costs) (2) 13.5 20.0 21.1 19.0 31.6
Balance Sheet Data (at period end):
Cash and cash equivalents $ 11.1 $ 9.8 $ 11.4 $ 9.9 $ 107.8
Working capital (9) 104.4 104.7 158.5 140.5 269.8
Total assets (1) 513.1 549.6 566.5 533.2 1,576.5
Total long-term debt, net of current maturities 307.4 272.8 233.5 188.5 870.5
Total debt 330.3 317.6 258.0 201.9 943.4
Total shareholders’ equity 46.5 80.7 157.6 174.8 202.0
Selected Financial DataRayovac Corporation and Subsidiaries
(1) Certain reclassifications have been made to reflect the adoption of EITF 01-09 (which codified certain provisions of EITF 00-14, 00-22 and 00-25) for periods prior to adoption in fiscal 2002. EITF 01-09 addresses the recognition, measurement and income statement classification of various types of sales incentives, either as a reductionto revenue or as an expense. Concurrent with the adoption of EITF 00-25, we reclassified certain accrued trade incentives as a contra receivable versus our previous presentation as a component of accounts payable.
(2) Pursuant to FASB Statement No. 142, Goodwill and Other Intangible Assets, we ceased amortizing goodwill on October 1, 2001. Upon initial application of Statement No. 142,we reassessed the useful lives of its intangible assets and deemed only the trade name to have an indefinite useful life because it is expected to generate cash flowsindefinitely. Based on this, we ceased amortizing the trade name on October 1, 2001. Goodwill and tradename amortization expense for 1999, 2000 and 2001 included in depreciation and amortization in income from operations are as follows:
(In millions) 1999 2000 2001
Goodwill amortization $0.8 $1.2 $1.1Trade name amortization 0.4 2.3 2.3
$1.2 $3.5 $3.4
(3) The FASB issued Statement No. 145, which addresses, among other things, the income statement presentation of gains and losses related to debt extinguishments,requiring such expenses to no longer be treated as extraordinary items, unless the items meet the definition of extraordinary per APB Opinion No. 30. We adopted this statement on October 1, 2002. As a result, we recorded non-operating expenses within income before income taxes as follows during the fiscal years endedSeptember 30, 2001 and 2003:
In fiscal 2001, a non-operating expense of $8.6 million was recorded for the premium on the repurchase of $65.0 million of our senior subordinated notes and relatedwrite-off of unamortized debt issuance costs in connection with a primary offering of our common stock in June 2001.
In fiscal 2003, a non-operating expense of $3.1 million was recorded for the write-off of unamortized debt issuance costs associated with the replacement of our previouscredit facility in October 2002.
(4) Fiscal 1999 includes restructuring and related charges—cost of goods sold of $1.3 million, and restructuring and related charges—operating expenses of $8.1 million.
(5) Fiscal 2001 includes restructuring and related charges—cost of goods sold of $22.1 million, and restructuring and related charges—operating expenses of $0.2 million.Fiscal 2001 also includes a non-operating expense of $8.6 million discussed in (3) above. See Notes 15 and 2(x), respectively, in the Notes to Consolidated FinancialStatements included in this Annual Report for further discussion.
(6) Fiscal 2002 includes restructuring and related charges—cost of goods sold of $1.2 million. See Note 15 in the Notes to Consolidated Financial Statements included inthis Annual Report for further discussion.
(7) Fiscal 2003 includes a net sales reduction of $6.2 million related to North American retailer inventory repricing programs associated with the launch of our compre-hensive new alkaline pricing program announced in 2003. These programs were launched in response to Duracell’s price reduction in the U.S. market on certain AAand AAA batteries.
Fiscal 2003 includes restructuring and related charges—cost of goods sold of $21.1 million, and restructuring and related charges—operating expenses of $11.5 million.Fiscal 2003 also includes a non-operating expense of $3.1 million discussed in (3) above. See Notes 15 and 2(x), respectively, in the Notes to Consolidated FinancialStatements included in this Annual Report for further discussion.
(8) Fiscal 2003 selected financial data is impacted by two acquisitions completed during the fiscal year. The VARTA acquisition was completed on October 1, 2002 and theRemington acquisition was completed on September 30, 2003.
(9) Working capital is defined as current assets less current liabilities.
Selected Financial DataRayovac Corporation and Subsidiaries
Page 14/15
The following is management’s discussion of the financial results, liquidity, and other key items related to our performance. This
section should be read in conjunction with the “Selected Financial Data” and our Consolidated Financial Statements and related
notes in the “Financial Statements” section of this Annual Report. Certain prior year amounts have been reclassified to conform
to current year presentation. All references to 2001, 2002, and 2003 refer to fiscal year periods ended September 30, 2001, 2002, and
2003, respectively.
INTRODUCTIONOn October 1, 2002, we acquired substantially all of the consumer battery business of VARTA AG. The acquisition consisted of the
purchase of all of VARTA AG’s consumer battery subsidiaries and business outside of Germany, excluding Brazil, and a controlling
ownership and management interest in a new joint venture entity that will operate the VARTA AG consumer battery business in
Germany. The residual interest in the joint venture is held by VARTA AG. With the acquisition of VARTA, we became a truly global
battery manufacturer and marketer and acquired additional low-cost manufacturing capacity and battery technology.
In addition, on September 30, 2003, we acquired all of the equity interests of Remington Products Company, L.L.C. Remington is a
leading consumer products company focusing on the development and marketing of personal care products. Remington designs and
distributes electric shavers and accessories, grooming products, hair care appliances and other small electrical consumer products.
The acquisition of Remington allowed us to become a diversified consumer products company no longer solely focused on the
battery and lighting product markets. Remington was attractive due to its position as a strong branded company, its new product
pipeline and its use of distribution channels similar to those employed by Rayovac in the United States.
Following the acquisitions of VARTA and Remington, we are a global branded consumer products company with leading market
positions in our two major product categories: consumer batteries and electric personal care products. We are a leading worldwide
manufacturer and marketer of alkaline and zinc carbon batteries. We are also the leading worldwide manufacturer and marketer of
hearing aid batteries, a leading worldwide designer and marketer of rechargeable batteries and a leading marketer of battery-powered
lighting products. With the acquisition of Remington, we are also a leading designer and marketer of electric shavers and accessories,
electric grooming products and hair care appliances. Our products are sold on a global basis in over 100 countries through a variety
of channels, including mass merchandisers, home centers and hardware stores, consumer electronics stores, warehouse clubs, food,
drug and convenience stores, department stores, hearing aid professionals, industrial distributors and original equipment manufac-
turers (“OEMs”). We enjoy strong name recognition in our markets under the Rayovac, VARTA and Remington brands, each of
which has been in existence for more than 80 years.
Our financial performance is influenced by a number of factors including: general economic conditions and trends in consumer
markets; our overall product line mix, including sales prices and gross margins which vary by product line; and our general com-
petitive position, especially as impacted by our competitors’ promotional activities and pricing strategies. These influencing factors
played significant roles in our financial results during fiscal 2001, 2002 and 2003.
We manage our business based upon three geographic regions. The regions are as follows: North America, which includes the United
States and Canada; Latin America, which includes Mexico, Central America, South America and the Caribbean; and Europe/Rest of
World (“Europe/ROW”), which includes continental Europe, the United Kingdom, and all other countries in which we do business.
Our Consolidated Results of Operations for the twelve months ended September 30, 2003 do not include the impacts of the
Remington acquisition, as the transaction occurred on the close of business on September 30, 2003. Our Consolidated Balance
Sheet, as of September 30, 2003, and Consolidated Statement of Cash Flows for the year then ended do incorporate the impacts
of the Remington transaction.
Cost Reduction Initiatives We continually seek to improve our operational efficiencies, match our manufacturing capacity
and product costs to market demand and better utilize our manufacturing resources. Since the beginning of fiscal 2001, we have
undertaken various initiatives to reduce manufacturing, operating and other costs. We believe that we can continue to drive down
our cost of goods manufactured with continued focus on cost reduction initiatives.
Fiscal 2001. In fiscal 2001, we closed our Wonewoc, Wisconsin plant and now source lighting products previously made at this plant
from third party suppliers. With this closure, we now outsource all of our lighting products. In addition, we outsourced certain
manufacturing operations at our Fennimore, Wisconsin plant to accommodate the installation of a new high speed AA-size alkaline
battery line and discontinued inefficient packaging operations.
Management’s Discussion and Analysis of Financial Condition and Results of OperationsRayovac Corporation and Subsidiaries
Also in fiscal 2001, we closed our zinc carbon battery plants in Tegucigalpa, Honduras and rationalized our manufacturing and
distribution processes in our Mexico City, Mexico manufacturing facilities and in our European operations by discontinuing or
outsourcing uneconomic product lines or production processes, including the outsourcing of zinc carbon rod manufacturing, and
by changing uneconomical modes of distribution.
Finally, in fiscal 2001, we engaged in an organizational restructuring in North America and Latin America. As part of this initiative,
sales and marketing functions were eliminated and/or consolidated. These cost reduction initiatives reduced our global workforce
by approximately 570 employees.
Fiscal 2002. In fiscal 2002, we closed our Santo Domingo, Dominican Republic manufacturing facility and transferred production
of zinc carbon batteries to our Guatemala City, Guatemala manufacturing facility. We also outsourced a portion of our zinc carbon
battery production previously manufactured at our Mexico City, Mexico facility.
The impact of the fiscal 2001 and fiscal 2002 cost reduction initiatives on our operations is described below under the heading “Fiscal
Year Ended September 30, 2002 Compared to Fiscal Year Ended September 30, 2001—Restructuring and Related Charges.”
Fiscal 2003. In October 2002, in conjunction with the acquisition of the VARTA consumer battery business described above, we
announced a series of initiatives designed to position our consumer battery business for future growth opportunities and to opti-
mize the combined global resources of Rayovac and VARTA. These initiatives, which are expected to provide significant benefits to
the combined organization, include the renegotiation of certain sourcing arrangements, the elimination of duplicate costs in our
consumer battery business and the consolidation of sales and marketing functions.
In October 2002, we closed our Mexico City, Mexico manufacturing facility. With the closure of the Mexico City, Mexico plant,
the plants in Guatemala City, Guatemala, Breitenbach, France, and Manizales, Colombia became our remaining zinc carbon manu-
facturing plants. The consolidation of our zinc carbon capacity within Latin America is consistent with the global market trend
away from zinc carbon toward alkaline batteries, and is intended to allow us to more closely match our manufacturing capacity
to anticipated market demands.
We also announced the closure of operations at our Madison, Wisconsin packaging center and Middleton, Wisconsin distribution
center in October 2002. These facilities were closed during fiscal 2003 and their operations were combined into a new leased complex
in Dixon, Illinois. Transition to the new facility was completed in June 2003. We anticipate that the relocation to the new leased
packaging and distribution center will result in operational changes that are intended to reduce freight and inventory handling costs.
We expect that all geographies will benefit from decreased costs and expenses resulting from the VARTA initiatives. These initiatives
are anticipated to create long-term opportunities for procurement savings resulting from renegotiated raw material and finished
good sourcing arrangements and lower operating costs as duplicative administrative support and sales and marketing functions are
consolidated and overlapping functions are eliminated.
The benefits of the VARTA initiatives are expected to positively impact future gross profit and operating margins, but were partially
offset during fiscal 2003 and in the near-term by exit and integration costs, including employee termination benefits and asset impair-
ments associated with the elimination of duplicative functions, an increase in interest expense associated with the acquisition, and
increased exposure to foreign currency movements reflecting our expanded global presence. In addition, the acquisition of the
VARTA consumer battery business is expected to negatively impact our effective tax rate, as we estimate a larger percentage of our
income will be generated in higher tax jurisdictions.
Annual savings associated with the VARTA initiatives are projected to be in the range of $40–45 million when fully realized by
the end of fiscal 2005. Costs associated with certain cost reduction initiatives are discussed in Note 15, Restructuring and Related
Charges, to our Notes to Consolidated Financial Statements.
The impact of the fiscal 2003 cost reduction initiatives on our operations is described below under the heading “Fiscal Year Ended
September 30, 2003 Compared to Fiscal Year Ended September 30, 2002—Restructuring and Related Charges.”
Management’s Discussion and Analysis of Financial Condition and Results of OperationsRayovac Corporation and Subsidiaries
Page 16/17

In conjunction with the acquisition of the Remington business, we identified annual savings opportunities of approximately $23.5
million when fully realized, which we currently expect by 2006. These savings are primarily related to purchasing, supply chain
management, manufacturing and back office functions. We estimate we will incur total costs (cash and non-cash) of approximately
$35.0 million over the next two years to achieve these savings. Integration activities are currently underway and savings and cost
estimates will be further refined during fiscal 2004. We expect the North America and Europe/ROW geographies to benefit from
decreased costs and expenses resulting from these Remington initiatives to optimize the combined resources of Rayovac and
Remington.
Meeting Consumer Needs through Technology and Development We continue to focus our efforts on meeting con-
sumer needs for portable power, personal care, and lighting products through new product development and technology innovations.
Prior to the Remington acquisition, we announced improvements and new developments in our rechargeable, alkaline, hearing
aid, and lighting products product lines.
During fiscal 2001, we introduced a one-hour charger for nickel metal hydride (NiMH) batteries, and began selling higher perform-
ing NiMH batteries. In fiscal 2002, we announced the development of a revolutionary rechargeable NiMH battery system capable
of recharging batteries in as little as 15 minutes which was introduced in the retail market during fiscal 2003. These technological
advancements provide consumers with portable, rechargeable power as the use of digital cameras and other high drain devices
continues to grow.
In fiscal 2002, we launched our new, more powerful Rayovac Maximum Plus alkaline batteries, with bold new graphics. Also during
fiscal 2001 and fiscal 2002, we increased the performance of our hearing aid batteries, and launched innovative packaging allowing
consumers to more easily dispense the hearing aid batteries. In Europe during fiscal 2003, we launched our High Energy� alkaline
batteries and upgraded our graphic designs for our MaxiTech� and LongLife� batteries, all marketed under the VARTA brand name.
Finally, we rejuvenated our lighting products product line through a series of new product launches designed to reach unique
markets within the mass and retail channels.
During fiscal 2003, we introduced to the United States marketplace a comprehensive pricing strategy for our alkaline battery product
portfolio. We simplified the battery buying decision process for consumers by offering fifty percent more of our AA and AAA batter-
ies for the same price as the competition. We believe this “fifty percent more” strategy will help redefine the value position of our
Maximum Plus� alkaline products. This strategy will also match up with the consumer trend of buying larger pack size of batteries.
Research and development efforts at Remington allow us to maintain our unique manufacturing process in cutting systems for
shavers. Remington is continuously pursuing new innovations for its line of shavers including foil improvements and new cutting
and trimmer configurations. Remington also devotes resources to the development of new technologies for its other products.
During fiscal 2003 and prior to the acquisition, Remington introduced the Remington Titanium� line of men’s MicroScreen� and
MicroFlex� shavers, a line of personal grooming products that utilize titanium-coated blades and trimmers.
We believe that our products are well poised to meet the portable power, lighting and electric personal care needs of consumers.
We will continue to focus on identifying new technologies necessary to meet consumer and retailer needs within the marketplace.
Competitive Landscape The alkaline battery business is highly competitive on a global scale. Within North America, Europe
and Latin America, there are four primary branded providers of alkaline batteries and a few local manufacturers within each geo-
graphic region. The alkaline marketplace has seen changes in recent years related to product line segmentation, with attempts to
segment the category into high-performance, regular and value positions, combined with the introduction of private label batteries
at certain retailers. In addition, market participants continue to engage in high levels of promotional and pricing activities to gain
market share. In the United States in 2003, Duracell, one of our competitors, announced they were lowering the prices of their
alkaline batteries. This action, in conjunction with our and Energizer’s responses, is expected to have a short-term impact on the
overall United States battery category growth.
Within Latin America, poor economic conditions have dramatically impacted battery sales especially within the zinc carbon product
line. Zinc carbon batteries continue to be the largest share of the battery market in Latin America in unit terms. In North America
and Europe, the majority of consumers purchase alkaline batteries.
Management’s Discussion and Analysis of Financial Condition and Results of OperationsRayovac Corporation and Subsidiaries

Within North America and Europe, the rechargeable battery business has experienced dramatic changes over the past three years.
Primary rechargeable alkaline sales have declined over this period with a shift towards rechargeable batteries, such as NiMH, which
are higher performing in high drain devices. Our development of a one-hour charger and an innovative 15-minute rechargeable
battery technology help us maintain the number one market position within the rechargeable category in the United States, as
estimated by management.
Within the hearing aid battery category, we continue to hold the number one global market position based on management estimates.
We believe that our close relationship with hearing aid manufacturers and other customers, as well as our product performance
improvements and packaging innovations, position us for continued success in this category.
Seasonal Product Sales Our quarterly results are impacted by our seasonal sales. Sales during the first and fourth fiscal quarters
of the year are generally higher than other quarters due to the impact of the December holiday season. The seasonality of our sales
during the last three fiscal years is as follows:Percentage of Annual Sales
Fiscal Year Ended September 30,
Fiscal Quarter Ended 2001 2002 2003
December 27% 28% 28%
March 22% 21% 22%
June 24% 24% 23%
September 27% 27% 27%
Remington also experiences seasonal sales. During calendar 2002, Remington’s sales for the quarters ended March 31, June 30,
September 30, and December 31 were 15%, 19%, 22%, and 44%, respectively. We anticipate our sales for the fiscal quarter ending
in December will be a larger portion of our annual sales going forward.
Fiscal Year Ended September 30, 2003 Compared to Fiscal Year Ended September 30, 2002
Highlights of consolidated operating results
Year over year historical comparisons are influenced by our October 1, 2002 acquisition of substantially all of the consumer battery
business of VARTA AG, which is included in our current year but not prior year results. See Note 16, Acquisitions and Divestitures,
of Notes to the Consolidated Financial Statements for additional information regarding the VARTA acquisition. The acquisition
of Remington, had no effect on fiscal 2003 operating results, as the transaction was completed after the close of business on
September 30, 2003.
Net Sales. Our net sales increased $349.4 million to $922.1 million in fiscal 2003 from $572.7 million the previous year. The sales
increase is attributable to the VARTA acquisition partially offset by sales decreases in the North America segment.
Operating Income. Our income from operations decreased $3.4 million to $59.6 million in fiscal 2003 from $63.0 million the
previous year. The decrease was primarily attributable to $32.6 million in restructuring charges reflecting a series of restructuring
initiatives announced and implemented during fiscal 2003 and a $20.7 million decrease in North America segment profitability dis-
cussed below. These decreases were mostly offset by the profitability associated with the VARTA acquisition. For further discussion of
restructuring and related charges see Note 15, Restructuring and Related Charges, of Notes to the Consolidated Financial Statements.
Net Income. Our net income in fiscal 2003 decreased $13.7 million to $15.5 million from $29.2 million the previous year. The
decrease was due to restructuring and related charges of $20.2 million, after tax, an increase in interest expense of $13.1 million,
after tax, North America retailer markdown programs of $3.8 million, after tax, non-operating expense of $1.9 million, after tax,
reflecting the write-off of unamortized debt issuance costs associated with the replacement of our previous credit facility, and the
decline in North America profitability, partially offset by the profitability of the VARTA acquisition. Fiscal 2002 includes a $7.5 mil-
lion, after tax, net bad debt expense related to the bankruptcy filing of a North America segment customer.
Management’s Discussion and Analysis of Financial Condition and Results of OperationsRayovac Corporation and Subsidiaries
Page 18/19

Segment Results. We evaluate segment profitability based on income from operations before corporate expense and restructuring
and related charges. Corporate expense includes corporate purchasing expense, general and administrative expense, and certain
research and development expenses.
Europe/ROW 2002 2003
Net sales from external customers $ 52.5 $421.1
Segment profit 5.1 49.7
Segment profit as a % of net sales 9.7% 11.8%
Assets $ 31.4 $537.4
The Europe/ROW segment was the segment most dramatically impacted by the VARTA acquisition. Increases in sales, segment prof-
itability and assets all reflect the significance of VARTA within the region and the favorable impact of foreign currency movements.
Intense sales, marketing, operational and administrative integration activities were implemented and substantially completed within
the region making identification of factors causing year-over-year variation difficult.
Profitability as a percent of net sales increased to 11.8% in fiscal 2003 from 9.7% in the previous year primarily reflecting the impact of
the VARTA acquisition and improved gross profit margins.
Intangible assets of $240.6 million, primarily related to the VARTA acquisition, now make up a substantial portion of the asset base
within the segment. The segment’s asset base as of September 30, 2003, includes the international operations of Remington.
North America 2002 2003
Net sales from external customers $435.6 $376.0
Segment profit 85.5 64.8
Segment profit as a % of net sales 19.6% 17.2%
Assets $256.4 $625.5
Our sales to external customers decreased $59.6 million, or 13.7%, to $376.0 million in fiscal 2003 from $435.6 million the previous
year due primarily to weakness in alkaline, zinc carbon, and rechargeable product line sales. Alkaline sales decreases of $54.3 million
were caused by intense competitive promotional pricing activity in this battery category, a $9.7 million decline in post-bankruptcy
sales to a customer, approximately $6.2 million in retailer markdown programs associated with the Company’s new alkaline pricing
program, and our inability to replace $4.0 million in sales to a discontinued low-margin OEM customer in the prior year. Zinc carbon
sales decreased $9.6 million compared to last year due to reduced distribution and general marketplace trends away from the use of
this type of battery. Rechargeable battery sales also decreased $2.6 million compared to last year due to lower sales in advance of the
I-C3 rechargeable battery system launched in the fourth quarter of fiscal 2003. Hearing aid battery sales increased $3.7 million, or
9.0% due to overall category strength.
Our profitability decreased $20.7 million to $64.8 million from $85.5 million the previous year. The decrease in profitability was
primarily attributable to lower gross profit due to the current year sales decrease partially offset by a $12.0 million net bad debt
expense related to the bankruptcy filing of a key customer recorded in the prior year. Due to the reasons mentioned above, our
profitability margins decreased 240 basis points to 17.2% from 19.6% the previous year.
Our assets increased to $625.5 million from $256.4 million the previous year primarily reflecting the impacts of the Remington
acquisition and intangible assets of approximately $283.0 million attributable to the transaction. The purchase price allocation for
the Remington acquisition is not yet final.
Latin America 2002 2003
Net sales from external customers $ 84.7 $125.0
Segment profit 5.3 17.7
Segment profit as a % of net sales 6.3% 14.2%
Assets $191.0 $203.9
Our sales to external customers increased $40.3 million, or 47.6% to $125.0 million in fiscal 2003 from $84.7 million the previous
year. The increase in sales is due to the impact of the VARTA acquisition and sales increases within Central America of $7.6 million
primarily reflecting improvements in our wholesaler and distributor channels. These increases were partially offset by currency
devaluations in the Dominican Republic contributing to a sales decrease of $4.3 million, declines caused by unfavorable economic
conditions and political uncertainties in Venezuela resulting in a sales decline of $2.3 million, and the unfavorable impacts of foreign
currency movements impacting other geographies within the region.
Management’s Discussion and Analysis of Financial Condition and Results of OperationsRayovac Corporation and Subsidiaries

Our profitability increased $12.4 million to $17.7 million and was primarily the result of the VARTA acquisition, improved profit-
ability in Central America partially offset by profit declines in Venezuela and Dominican Republic.
Our assets increased $12.9 million, or 6.8%, to $203.9 million from $191.0 million the previous year. The acquisition of the VARTA
business in Latin America resulted in asset increases across all asset categories, except for a reduction in accounts receivable reflect-
ing improvements in collections, a decrease in property, plant and equipment reflecting the closure of the Mexico manufacturing
facility. The closure and subsequent write-off of the Mexico manufacturing related assets are included in restructuring and related
charges in our Consolidated Statement of Operations (see Note 15, Restructuring and Related Charges, of Notes to the Consolidated
Financial Statements) and are not included in our Latin America segment results. The Remington acquisition had no effect on Latin
America segment assets.
Corporate Expense. Our corporate expenses increased $8.3 million to $40.0 million from $31.7 million in the previous year. As a
percentage of sales, our corporate expense was 4.3% in fiscal 2003, compared with 5.5% in the previous year. Fiscal 2003 corporate
expense includes higher legal expense associated with patent infringement litigation, a $1.5 million net charge associated with the
settlement of such litigation, generally higher costs associated with the integration of the VARTA businesses and other increases
in compensation expense, primarily reflecting an increase in unearned restricted stock compensation of $2.1 million. Fiscal 2002
included a loss of $1.5 million related to the bankruptcy filing of a freight payment service provider.
Restructuring and Related Charges. In fiscal 2003, we recorded restructuring and related charges of $32.6 million associated with
our cost reduction initiatives, as more fully described above under the heading “Cost Reduction Initiatives—Fiscal 2003,” relating
to: (i) approximately $13.0 million of employee termination benefits for approximately 650 notified employees and non cash costs
of approximately $0.7 million associated with the write-off of pension intangible assets reflecting the curtailment of our Madison,
Wisconsin packaging facility pension plan, (ii) approximately $12.8 million of equipment, inventory and other asset write-offs pri-
marily reflecting the abandonment of equipment and inventory associated with the closure of our Mexico City, Mexico plant and
inventory and fixed asset impairments related to the closure of our Wisconsin packaging and distribution locations, (iii) approxi-
mately $6.1 million of other expenses which include, distributor termination costs of approximately $0.9 million, research and
development contract termination costs of approximately $0.5 million, and other legal and facility shutdown expenses of approxi-
mately $4.7 million, net of a $0.3 million change in estimate reducing our anticipated costs to close our Wonewoc, Wisconsin facility.
In fiscal 2003, we recorded restructuring and related charges in cost of goods sold of approximately $21.1 million including amounts
related to: (i) the closure in October 2002 of our Mexico City, Mexico plant and integration of production into our Guatemala
City, Guatemala manufacturing location, resulting in charges of approximately $6.2 million, including termination payments of
approximately $1.4 million, fixed asset and inventory impairments of approximately $4.3 million, and other shutdown related
expenses of approximately $0.5 million, (ii) the closure of operations at our Madison, Wisconsin packaging facility and combination
with the Company’s Middleton, Wisconsin distribution center into a new leased complex in Dixon, Illinois resulting in charges of
approximately $12.4 million, including termination costs of approximately $2.4 million and non cash pension curtailment costs of
approximately $0.7 million, fixed asset and inventory impairments of approximately $6.9 million, and relocation expenses and other
shutdown related expenses of approximately $2.4 million, (iii) a series of restructuring initiatives impacting our manufacturing
functions in Europe, North America, and Latin America resulting in charges of approximately $2.8 million, including termination
benefits of approximately $1.8 million and inventory and asset impairments of approximately $1.0 million, and (iv) a change in
estimate relating to our anticipated costs to close our Wonewoc, Wisconsin facility resulting in a credit of $0.3 million.
In fiscal 2003, we recorded restructuring and related charges in operating expenses of approximately $11.5 million including amounts
related to: (i) the closure of operations at our Middleton, Wisconsin distribution center and combination with our Madison,
Wisconsin packaging facility into a new leased complex in Dixon, Illinois resulting in charges of approximately $1.4 million, includ-
ing termination costs of approximately $0.3 million, fixed asset impairments of approximately $0.3 million, and relocation expenses
and other shutdown related expenses of approximately $0.8 million, and (ii) a series of restructuring initiatives impacting our sales,
marketing, and administrative functions in Europe, North America, and Latin America resulting in charges of approximately $10.1
million, including termination costs of approximately $7.1 million, distributor termination costs of approximately $0.9 million,
research and development contract termination costs of approximately $0.5 million, fixed asset impairments of $0.3 million, and
legal and other expenses of approximately $1.3 million. The carrying value of assets held for sale under restructuring plans is
approximately $8.7 million, and is included in Prepaid expense and other in our Consolidated Balance Sheets.
Management’s Discussion and Analysis of Financial Condition and Results of OperationsRayovac Corporation and Subsidiaries
Page 20/21

In fiscal 2002, we recorded net restructuring and related charges in cost of goods sold of $1.2 million related to: (i) the closure of
our manufacturing facility in Santo Domingo, Dominican Republic and transfer of production to our Guatemala City, Guatemala
manufacturing facility and the outsourcing of a portion of our zinc carbon battery production previously manufactured at our
Mexico City, Mexico manufacturing facility, as more fully described above under the heading “Cost Reduction Initiatives—Fiscal
2002” and (ii) the reversal of $1.3 million of expenses related to the December 2000 restructuring announcement which were not
realized, primarily reflecting a change in estimated termination benefits of $1.0 million, due to lower estimates of outplacement
costs and costs attributable to fringe benefits, and the retention of selected employees.
The closure of the Dominican Republic manufacturing facility and outsourcing of Mexico zinc carbon production, in fiscal 2002,
resulted in $1.2 million of employee termination benefits for approximately 115 manufacturing employees, $0.9 million of charges
from the abandonment of equipment and inventory, net of a change in estimate of $0.4 million, associated with the closing of the
manufacturing facility and $0.3 million of other expenses. The change in estimate reflected our ability to utilize more inventory and
manufacturing equipment at our Guatemala City, Guatemala manufacturing location than originally anticipated.
Interest Expense. Interest expense increased $21.1 million to $37.2 million in fiscal 2003 due to the increase in debt to finance the
VARTA acquisition.
Non-Operating Expense. In fiscal 2003, we recorded non-operating expense of $3.1 million relating to the write-off of unamor-
tized debt fees associated with our previous credit facility, replaced in conjunction with the VARTA acquisition. There was no
non-operating expense in fiscal 2002.
Other (Income) Expense. Other (income) expense, net, improved $4.9 million to income of $3.6 million in fiscal 2003, primarily
attributable to foreign exchange transaction gains.
Income Tax Expense. Our effective tax rate was 32.8% for fiscal 2003, a decrease from 36.0% during the previous year. The decrease
in the effective tax rate from the prior year primarily reflects the net impact of certain tax credits realized during fiscal 2003, favor-
able adjustments to prior year deferred taxes, adjustments to prior year tax reserves reflecting the expiration of certain statute of
limitations, partially offset by non-deductible interest expense associated with our acquisition of VARTA.
Fiscal Year Ended September 30, 2002 Compared to Fiscal Year Ended September 30, 2001
Highlights of consolidated operating results
Net Sales. Our net sales decreased $43.5 million, or 7.1%, to $572.7 million in fiscal 2002 from $616.2 million the previous year.
Increases in hearing aid battery and lighting product sales were unable to offset declines in zinc carbon and alkaline sales.
Income from Operations. Our income from operations increased $8.6 million, or 15.8%, to $63.0 million in fiscal 2002 from $54.4
million the previous year. This increase was primarily due to reduction in restructuring charges of $21.1 million offset by a $12.0
million bad debt reserve, net of recoveries, resulting from the bankruptcy filing of a key customer.
Net Income. Our net income for fiscal 2002 increased $17.7 million, or 153.9%, to $29.2 million from $11.5 million the previous year.
The increase reflects a reduction in interest expense attributable to the retirement of $65.0 million of senior subordinated notes
following our June 2001 common stock offering, plus a $56.1 million reduction in debt during fiscal 2002 due to strong cash flow
from operations. In addition, fiscal 2001 results reflect a $22.3 million pretax restructuring charge and an $8.6 million pretax non-
operating expense. These improvements were partially offset by a bad debt reserve of $7.5 million, net of tax, recognized in fiscal
2002 related to the bankruptcy filing of a key customer.
North America 2001 2002
Net sales from external customers $448.8 $435.6
Segment profit 80.8 85.5
Segment profit as a % of net sales 18.0% 19.6%
Management’s Discussion and Analysis of Financial Condition and Results of OperationsRayovac Corporation and Subsidiaries

Our revenue from external customers decreased $13.2 million, or 2.9%, to $435.6 million in fiscal 2002 from $448.8 million the pre-
vious year. Zinc carbon sales decreases of $12.3 million reflect the trend in the industry toward alkaline and the discontinuation of
certain products at selected stores of a major retailer. Alkaline sales decreases of $4.8 million were attributable to the decline in sales
to a key customer in bankruptcy, a cautious retail inventory environment and continued promotional activity, and our inability to
replace sales to an OEM customer in the previous year. Increases in lighting products of $4.3 million resulted from new product
launches and distribution gains.
Our profitability increased $4.7 million to $85.5 million in fiscal 2002 from $80.8 million the previous year. This increase was prima-
rily attributable to the benefits of the 2001 plant closures and organizational restructurings as more fully described under the head-
ing “Cost Reduction Initiatives,” that lowered operating expenses and improved gross profit margins. This was partially offset by a
$12.0 million bad debt reserve, net of recoveries, resulting from the bankruptcy filing of a North America segment customer.
Latin America 2001 2002
Net sales from external customers $118.7 $84.7
Segment profit 16.9 5.3
Segment profit as a % of net sales 14.2% 6.3%
Our revenue from external customers decreased $34.0 million, or 28.6%, to $84.7 million in fiscal 2002 from $118.7 million the pre-
vious year due primarily to decreased sales of zinc carbon batteries. Net sales were impacted by unfavorable economic conditions
in Mexico, Argentina, and Venezuela, primarily due to general weakened market conditions. Also impacting net sales were curtail-
ments of shipments to certain distributors and wholesalers who were delinquent on payments, general political uncertainties and
instability in Argentina and Venezuela, and the unfavorable impacts of currency devaluation which contributed approximately
$9.3 million of the sales decline versus fiscal 2001.
We have a business presence in approximately 100 countries throughout the world, all of which are subject to varying degrees of
political and economic risk. In fiscal 2002, changes in the economic and political environments in Mexico, Argentina and Venezuela
subjected us to varying degrees of political and economic risks. While these markets collectively represent approximately 40.0% and
23.3% of our Latin America segment revenue and total assets, respectively, they collectively represent approximately 6.0% and 8.4%
of our consolidated revenue and total assets, respectively.
In spite of the sales decline, the segment remained profitable, with profit of $5.3 million in fiscal 2002. However, this was a decrease
of $11.6 million from the previous year. This decrease was primarily attributable to the impact of the sales decline, partially offset
by lower advertising expenses and a reduction in other operating expenses in the region. As of October 1, 2001, we adopted FASB
Statement No. 142 and were no longer required to amortize goodwill and certain intangibles with indefinite lives. This resulted in
a reduction of amortization expense of $3.0 million, within the segment, for the year. Segment profit margins decreased primarily
due to an unfavorable customer mix compounded by relatively fixed operating expenses spread over lower sales.
Europe/ROW 2001 2002
Net sales from external customers $48.7 $52.5
Segment profit 4.1 5.1
Segment profit as a % of net sales 8.4% 9.7%
Our revenue from external customers increased $3.8 million, or 7.8%, to $52.5 million in fiscal 2002 from $48.7 million the previous
year, primarily reflecting increased sales of alkaline and hearing aid batteries, and favorable impacts of foreign currency movements.
Our profitability increased $1.0 million, or 24.4%, due primarily to sales gains and a reduction in operating expenses due to the
cost reduction initiatives described above under the heading “Cost Reduction Initiatives—Fiscal 2001” and the adoption of FASB
Statement No. 142, which resulted in lower amortization expense.
Corporate Expenses. Our corporate expenses increased $6.6 million, or 26.3%, to $31.7 million in fiscal 2002 from $25.1 million the
previous year. The increase was primarily due to higher legal expenses, technology spending, and compensation expense.
Management’s Discussion and Analysis of Financial Condition and Results of OperationsRayovac Corporation and Subsidiaries
Page 22/23

Restructuring and Related Charges. In fiscal 2002, we recorded net restructuring and related charges of $1.2 million related to:
(i) the closure of our manufacturing facility in Santo Domingo, Dominican Republic and transfer of production to our Guatemala
City, Guatemala manufacturing facility and the outsourcing of a portion of our zinc carbon battery production previously manu-
factured at our Mexico City, Mexico manufacturing facility, as more fully described above under the heading “Cost Reduction
Initiatives—Fiscal 2002” and (ii) the reversal of $1.3 million of expenses related to the December 2000 restructuring announcement
which were not realized, primarily reflecting a change in estimated termination benefits of $1.0 million, due to lower estimates of
outplacement costs and costs attributable to fringe benefits, and the retention of selected employees.
The closure of the Dominican Republic manufacturing facility and outsourcing of Mexico zinc carbon production resulted in $1.2
million of employee termination benefits for approximately 115 manufacturing employees, $0.9 million of charges from the aban-
donment of equipment and inventory, net of a change in estimate of $0.4 million, associated with the closing of the manufacturing
facility and $0.3 million of other expenses. The change in estimate reflected our ability to utilize more inventory and manufacturing
equipment at our Guatemala City, Guatemala manufacturing location than originally anticipated.
The cost reduction initiatives undertaken in fiscal 2002 and described above are complete as of September 30, 2002. The remaining
accrued termination benefits were paid before December 2002. We believe cost reduction initiatives generated annual savings
approximating the cash costs of the restructuring initiatives.
We recorded restructuring and related charges of $22.3 million in fiscal 2001, reflecting $10.1 million of employee termination bene-
fits for approximately 570 employees, $10.2 million of equipment, inventory, and other asset write-offs and $2.0 million of other
expenses associated with the cost reduction initiatives described above under the heading “Cost Reduction Initiatives—Fiscal 2001,”
including: (i) an organizational restructuring in the U.S., (ii) the closure of the Tegucigalpa, Honduras facility and the rationalization
of our manufacturing and distribution processes in our Tegucigalpa, Honduras and Mexico City, Mexico manufacturing facilities
and in our European operations, (iii) the closure of our Wonewoc, Wisconsin manufacturing facility and (iv) the rationalization of
inefficient manufacturing processes, packaging operations and product lines at our Fennimore, Wisconsin manufacturing facility
and Madison, Wisconsin packaging location. In addition, “Restructuring and Related Charges” also reflected costs associated with
our June 2001 common stock offering.
The cost reduction initiatives undertaken in fiscal 2001 are complete and we do not anticipate any further material charges to result
from such initiatives.
Interest Expense. Interest expense decreased $11.2 million, or 41.2%, to $16.0 million in fiscal 2002 from $27.2 million in the
previous year primarily due to the retirement of $65.0 million of senior subordinated notes in June 2001 using proceeds from
our common stock offering and the repayment of $56.1 million in debt from our strong cash flow from operations.
Non-Operating Expense. In fiscal 2001, we recorded non-operating expense of $8.6 million resulting from the premium on the
repurchase of $65.0 million of Senior Subordinated Notes and the related write-off of unamortized debt issuance costs.
Income Tax Expense. Our effective tax rate for fiscal 2002 was 36.0% compared to 34.1% for fiscal 2001. The higher rate for fiscal
2002 primarily reflects a change in geographic profitability away from lower tax jurisdictions, primarily within Latin America, and
proportionately higher income in the United States.
Liquidity and Capital Resources For fiscal 2003, operating activities provided $76.2 million in net cash, an increase of $9.4
million over the previous year. Within operating cash flow, we recognized lower net income of $13.8 million reflecting the impacts
of the fiscal 2003 restructuring activities partially offset by the impacts of the VARTA acquisition. We also experienced an increase in
other non-cash adjustments primarily reflecting non-cash restructuring charges of $13.6 million, depreciation expense of $12.3 mil-
lion primarily reflecting the impacts of the VARTA acquisition, the write-off of the unamortized debt issuance costs of $3.1 million,
and amortization of unearned restricted stock compensation of $2.1 million partially offset by increases in deferred taxes of $13.8
million. Operating cash flow from changes in working capital was essentially unchanged from the previous year.
Net cash used by investing activities increased to $446.4 million for fiscal 2003, primarily reflecting payments associated with the
VARTA and Remington acquisitions, net of cash acquired, of $420.4 million. Capital expenditures of $26.1 million were primarily
for improvements to alkaline battery manufacturing and leasehold improvements on the Dixon, Illinois leased packaging and dis-
tribution center. Capital expenditures for fiscal 2004 are expected to be approximately $25.0 million, which are expected to include
spending for continued investment in our alkaline and hearing aid manufacturing operations, continued technology investments,
and spending associated with our recent Remington acquisition.
Management’s Discussion and Analysis of Financial Condition and Results of OperationsRayovac Corporation and Subsidiaries
During fiscal 2003 we granted approximately 1.2 million options to purchase shares of common stock to various employees of the
company. All grants have been at an exercise price equal to the market price of the common stock on the date of the grant. We also
granted approximately 0.4 million shares of restricted stock on October 1, 2002, from the 1997 incentive plan, to certain members
of management. The majority of these shares will vest on September 30, 2005, with the remainder vesting on September 30, 2006,
provided the recipient is still employed by us. The total market value of the restricted shares on date of grant totaled approximately
$4.8 million and has been recorded as unearned restricted stock compensation as a separate component of shareholders’ equity.
Unearned compensation is being amortized to expense over the vesting period. During fiscal 2003, restricted shares with a value
of approximately $0.3 million on the grant date were forfeited.
The Third Amended and Restated Credit Agreement (“Third Restated Agreement”), undertaken to acquire substantially all of the
consumer battery business of VARTA AG, and subsequently amended on January 29, 2003 (“First Amendment”), required, among
other provisions, that the recording and incurrence of restructuring charges meet certain definitions and time constraints to qualify
as additions in calculating Adjusted EBITDA, as defined, that we were to transform the German subsidiary acquired from VARTA
AG from a GmbH legal structure to a KGaA legal structure (the “Transformation”) on or before June 30, 2003, and that we obtain
consent of the Required Lenders to effect releases or substitutions of collateral pledges. Effective June 27, 2003, the Third Restated
Agreement was amended (“Second Amendment”): (i) to re-define and permit acceleration, recording, and incurrence of certain
Restructuring Charges, as defined in the Third Restated Agreement, (ii) to extend the deadline for the Transformation to on or
before March 31, 2004, and (iii) to consent to certain organizational restructurings (“Restructurings”), including releases and sub-
stitutions of collateral pledges, and disregarding application of certain basket amounts as necessary to effect the Restructurings.
Effective September 30, 2003, the Third Restated Agreement was amended (“Third Amendment”) to (i) permit the Remington
acquisition (the “Acquisition”) including issuance of $350.0 million of senior subordinated debt, increase the Dollar-denominated
revolver by $20.0 million, decrease the Euro-denominated revolver by €10.0 million and increase the Dollar-denominated Term B
facility by $50.0 million, (ii) permit incurrence of certain Restructuring Charges related to the Acquisition, (iii) amend certain
covenant ratios to allow for the effect of financing of the Acquisition, (iv) allow for organizational restructurings related to the
Acquisition including necessary releases and substitutions of collateral pledges, and (v) increase certain covenant basket amounts
to allow for operation of the resulting larger business entity.
We believe our cash flow from operating activities and periodic borrowings under our credit facilities will be adequate to meet the
short-term and long-term liquidity requirements of our existing business prior to the expiration of those credit facilities, although
no assurance can be given in this regard. Our current senior secured credit facilities include a revolving credit facility of $120.0
million, a revolving credit facility of €40.0 million, a term loan of $350.0 million, a term loan of €125.0 million and a term loan of
€50.0 million. As of September 30, 2003, the following amounts were outstanding under the senior secured facilities: $317.0 million
of the term loan and, €119.3 million and €42.5 million, respectively, of the Euro term loans. Approximately $6.0 million of the
availability under the U.S. Dollar revolver was utilized for outstanding letters of credit. As of September 30, 2003, our senior sub-
ordinated debt issued and outstanding includes $350.0 million of 8.5% notes issued by Rayovac and $56.0 million of 11.0% notes
issued by Remington (the “Remington Notes”). The Remington Notes were called for redemption, effective September 30, 2003,
and redeemed effective October 29, 2003, and consequently were reflected as current obligations at September 30, 2003. As of
September 30, 2003, we were in compliance with the provisions of our senior loan covenants and respective subordinated debt
indentures. We believe our future results from operations will be adequate to maintain compliance with such provisions although
no assurance can be given in this regard.
Off-Balance Sheet Arrangements We do not have any off-balance sheet arrangements that have or are reasonably likely to
have a current or future effect on our financial condition, changes in financial condition, revenues or expenses, results of operations,
liquidity, capital expenditures, or capital resources that are material to investors.
Critical Accounting Policies Our Consolidated Financial Statements have been prepared in accordance with accounting
principles generally accepted in the United States and fairly present our financial position and results of operations. We believe the
following accounting policies are critical to an understanding of our financial statements. The application of these policies requires
management judgment and estimates in areas that are inherently uncertain.
Management’s Discussion and Analysis of Financial Condition and Results of OperationsRayovac Corporation and Subsidiaries
Page 24/25
Valuation of Assets and Asset Impairment
We evaluate certain long-lived assets, such as property, plant and equipment, and certain intangibles for impairment based on the
expected future cash flows or earnings projections. An asset’s value is deemed impaired if the discounted cash flows or earnings
projections generated do not substantiate the carrying value of the asset. The estimation of such amounts requires management
judgment with respect to revenue and expense growth rates, changes in working capital, and selection of an appropriate discount
rate, as applicable. The use of different assumptions would increase or decrease discounted future operating cash flows or earnings
projections and could, therefore, change impairment determination.
We adopted FASB Statement No. 142, Goodwill and Other Intangible Assets, effective October 1, 2001. FASB Statement No. 142 requires
goodwill and other intangible assets with indefinite useful lives not be amortized, and that impairment of such assets be evaluated
as discussed above at least annually.
We evaluate deferred tax assets based on future earnings projections. An asset’s value is deemed impaired if the earnings projections
do not substantiate the carrying value of the asset. The estimation of such amounts requires significant management judgment with
respect to revenue and expense growth rates, changes in working capital, and other assumptions, as applicable. The use of different
assumptions would increase or decrease future earnings projections and could, therefore, change the determination of whether an
asset is realizable.
See Note 2(h), Note 2(i), Note 2(x), Note 4, Note 5, and Note 9 to the Consolidated Financial Statements for more information about
these assets.
Revenue Recognition and Concentration of Credit Risk
We recognize revenue from product sales upon shipment to the customer, which is the point at which all risks and rewards of own-
ership of the product are passed, provided that: there are no uncertainties regarding customer acceptance; persuasive evidence of an
arrangement exists; the price to the buyer is fixed or determinable; and collectibility is deemed reasonably assured. We are generally
not obligated to allow for, and our general policy is not to accept, product returns.
We enter into various promotional arrangements, primarily with retail customers, including arrangements entitling such retailers
to cash rebates from us based on the level of their purchases, which require us to estimate and accrue the estimated costs of the
promotional programs. These costs are generally treated as a reduction of net sales.
We also enter into promotional arrangements targeted to the consumer. Such arrangements are treated as either a reduction of
net sales or an increase in cost of sales, based on the type of promotional program. The income statement characterization of our
promotional arrangements complies with EITF 01-09, Accounting for Consideration Given by a Vendor to a Customer (Including a Reseller of the
Vendor’s Products).
Cash consideration, or an equivalent thereto, given to a customer is generally classified as a reduction of net sales. If we provide a
customer anything other than cash, the cost of the consideration is classified as an expense and included in cost of sales.
For all types of promotional arrangements and programs, we monitor our commitments and use statistical measures and past
experience to determine the amounts to be recorded for the estimate of the earned, but unpaid, promotional costs. The terms of
our customer-related promotional arrangements and programs are individualized to each customer and are generally documented
through written contracts, correspondence or other communications with the individual customers.
We also enter into various contractual arrangements, primarily with retail customers, which require us to make an upfront cash, or
“slotting” payment, to secure the right to distribute through such customer. We capitalize slotting payments, provided the payments
are supported by a time or volume based contractual arrangement with the retailer, and will amortize the associated payment over
the appropriate time or volume based term of the contractual arrangement. The amortization of the slotting payment is treated as a
reduction in net sales and the corresponding asset is included in “Deferred charges and other” in our Consolidated Balance Sheets.
Our trade receivables subject us to credit risk which is evaluated based on changing economic, political, and specific customer con-
ditions. We assess these risks and make provisions for collectibility based on our best estimate of the risks presented and information
available at the date of the financial statements. The use of different assumptions may change the estimate of collectibility. We extend
credit to our customers based upon an evaluation of the customer’s financial condition and credit history and generally do not
Management’s Discussion and Analysis of Financial Condition and Results of OperationsRayovac Corporation and Subsidiaries

require collateral. Our credit terms generally range between 30 and 90 days from invoice date, depending upon the evaluation of the
customer’s financial condition and history. We monitor our customers’ credit and financial conditions based on changing economic
conditions and adjust our credit policies with respect to any individual customer as we determine appropriate. These adjustments
may include, but are not limited to, restricting shipments to customers, reducing credit limits, shortening credit terms, requiring
cash payments in advance of shipment, or securing credit insurance. Our adjustments to our credit policies may not be effective
in reducing our credit risk associated with any particular customer. In 2002, we experienced a significant loss resulting from the
bankruptcy filing of a large retailer in the United States to which we had extended credit in accordance with our credit policy. In
the future, we may experience additional losses due to changing economic, political and specific customer conditions that may
adversely affect collectibility of trade receivables.
See Notes 2(b), 2(c), and 2(e) to the Consolidated Financial Statements for more information about our revenue recognition and
credit policies.
Pensions
Our accounting for pension benefits is primarily based on discount rate, expected and actual return on plan assets, and other assump-
tions made by management, and is impacted by outside factors such as equity and fixed income market performance. Pension lia-
bility is principally the estimated present value of future benefits, net of plan assets. In calculating the estimated present value of
future benefits, net of plan assets, for 2002 and 2003, we used a discount rate of 7.0% and 5.0% to 6.0%, respectively. In lowering the
discount rate from 2002 to 2003, we considered the change in the general market interest rates of debt rated Aaa or Aa by Moody’s
Investors Service from June 2002 to June 2003 and solicited the advice of its independent actuary. We believe the discount rate used
is reflective of the rate at which the pension benefits could be effectively settled. The decrease in our discount rate in fiscal 2003
contributed to an increase in our projected benefit obligation from the end of fiscal 2002 to the end of fiscal 2003.
Pension expense is principally the sum of interest and service cost of the plan, less the expected return on plan assets and the amor-
tization of the difference between our assumptions and actual experience. The expected return on plan assets is calculated by apply-
ing an assumed rate of return to the fair value of plan assets. In 2002 and 2003, we used an expected return on plan assets of 8.5% and
4.0% to 8.5%, respectively. Based on the advice of our independent actuary, we believe the expected rate of return is reflective of the
long-term average rate of earnings expected on the funds invested. An increase in the expected return on plan assets used by us
would have the effect of decreasing future pension expense. If such expected return were overstated, it would ultimately increase
future pension expense. Similarly, an understatement of the expected return would ultimately decrease future pension expense.
If plan assets decline due to poor performance by the markets and/or interest rate declines our pension liability would increase,
ultimately increasing future pension expense.
See Note 11 to the Consolidated Financial Statements for a more complete discussion of our employee benefit plans.
Restructuring
Restructuring liabilities are recorded for estimated costs of facility closures, significant organizational adjustments, and measures
undertaken by management to exit certain activities. Costs for such activities are estimated by management after evaluating detailed
analyses of the cost to be incurred. Such liabilities could include amounts for items such as severance costs and related benefits
(including settlements of pension plans), impairment of property and equipment and other current or long term assets, lease ter-
mination payments, plus any other items directly related to the exit activities. While the actions are carried out as expeditiously as
possible, restructuring charges are estimates. Changes in estimates resulting in an increase to or a reversal of a previously recorded
liability, may be required as management executes the restructuring plan. During fiscal 2003, we adopted the requirements of FASB
Statement No. 146, Accounting for Costs Associated with Exit or Disposal Activities, which impacts the timing of recognition of certain exit
or disposal costs.
We report restructuring charges relating to manufacturing and related initiatives in cost of goods sold. Restructuring and related
charges reflected in cost of goods sold include, but are not limited to, termination and related costs associated with manufacturing
employees, asset impairments relating to manufacturing initiatives, and other costs directly related to the restructuring initiatives
implemented.
We report restructuring charges relating to administrative functions in operating expenses, such as, initiatives impacting sales,
marketing, distribution, or other non-manufacturing related functions. Restructuring and related charges reflected in operating
Management’s Discussion and Analysis of Financial Condition and Results of OperationsRayovac Corporation and Subsidiaries
Page 26/27

expenses include, but are not limited to, termination and related costs, any asset impairments relating to the functional area
described above, and other costs directly related to the initiatives implemented.
See Note 2(x) and Note 15 to the Consolidated Financial Statements for a more complete discussion of recent restructuring
initiatives and related costs.
Loss Contingencies
Loss contingencies are recorded as liabilities when it is probable that a loss has been incurred and the amount of the loss can be
reasonably estimated. The outcome of existing litigation and the impact of environmental matters are examples of situations evalu-
ated as loss contingencies. Estimating the probability and magnitude of losses is often dependent upon management’s judgment of
potential actions by third parties and regulators. It is possible that changes in estimates or an increased probability of an unfavorable
outcome could materially affect future results of operations.
See further discussion in Note 13 to the Consolidated Financial Statements.
Other Significant Accounting Policies
Other significant accounting policies, primarily those with lower levels of uncertainty than those discussed above, are also critical to
understanding the Consolidated Financial Statements. Notes to the Consolidated Financial Statements contain additional informa-
tion related to our accounting policies and should be read in conjunction with this discussion.
QUANTITATIVE AND QUALITATIVE DISCLOSURES ABOUT MARKET RISK
Market Risk Factors We have market risk exposure from changes in interest rates, foreign currency exchange rates and com-
modity prices. We use derivative financial instruments for purposes other than trading to mitigate the risk from such exposures.
Interest Rate Risk We have bank lines of credit at variable interest rates. The general level of U.S. interest rates, LIBOR, and Euro
LIBOR primarily affects interest expense. We use interest rate swaps to manage such risk. The net amounts to be paid or received
under interest rate swap agreements are accrued as interest rates change, and are recognized over the life of the swap agreements,
as an adjustment to interest expense from the underlying debt to which the swap is designated. The related amounts payable to, or
receivable from, the contract counter-parties are included in accrued liabilities or accounts receivable.
Foreign Exchange Risk We are subject to risk from sales and loans to and from our subsidiaries as well as sales to, purchases
from and bank lines of credit with, third-party customers, suppliers and creditors, respectively, denominated in foreign currencies.
Foreign currency sales are made primarily in Euros, Pounds Sterling, Colombian Pesos, and Mexican Pesos. Foreign currency pur-
chases are made primarily in Euros, Pounds Sterling, Guatemalan Quetzals, Colombian Pesos, and Mexican Pesos. We also have
foreign currency sales and purchases in other currencies throughout the world. We manage our foreign exchange exposure from
anticipated sales, accounts receivable, inter-company loans, firm purchase commitments and credit obligations through the use of
naturally occurring offsetting positions (borrowing in local currency), forward foreign exchange contracts, foreign exchange rate
swaps and foreign exchange options. The related amounts payable to, or receivable from, the contract counter parties are included
in accounts payable or accounts receivable.
Commodity Price Risk We are exposed to fluctuations in market prices for purchases of zinc used in the manufacturing
process. We use commodity swaps, calls and puts to manage such risk. The maturity of, and the quantities covered by, the contracts
are closely correlated to our anticipated purchases of the commodities. The cost of calls, and the premiums received from the
puts, are amortized over the life of the contracts and are recorded in cost of goods sold, along with the effects of the swap, put
and call contracts. The related amounts payable to, or receivable from, the counterparties are included in accounts payable or
accounts receivable.
Sensitivity Analysis The analysis below is hypothetical and should not be considered a projection of future risks. Earnings
projections are before tax.
As of September 30, 2003, the potential change in fair value of outstanding interest rate derivative instruments, assuming a 1%
unfavorable shift in the underlying interest rates would be a loss of $3.9 million. The net impact on reported earnings, after also
including the reduction in one year’s interest expense on the related debt due to the same shift in interest rates, would be a net loss
of $0.8 million.
Management’s Discussion and Analysis of Financial Condition and Results of OperationsRayovac Corporation and Subsidiaries
As of September 30, 2003, the potential change in fair value of outstanding foreign exchange derivative instruments, assuming a
10% unfavorable shift in the underlying foreign exchange rates would be a loss of $1.4 million. The net impact on future cash flows,
after also including the gain in value on the related accounts receivable and accounts payable outstanding at September 30, 2003
due to the same change in exchange rates, would be zero.
As of September 30, 2003, the potential change in fair value of outstanding commodity price derivative instruments, assuming a
10% unfavorable change in the underlying commodity prices would be a loss of $1.0 million. The net impact on reported earnings,
after also including the reduction in cost of one year’s purchases of the related commodities due to the same change in commodity
prices, would be a net gain of $0.6 million.
A discussion of our accounting policies for derivative financial instruments is included in Note 2(r) to the Consolidated Financial
Statements.
Forward-Looking Statements We have made or implied certain forward-looking statements in this Annual Report. All state-
ments other than statements of historical facts included in this Annual Report, including the statements under “Management’s
Discussion and Analysis of Financial Condition and Results of Operations” regarding our business strategy, future operations,
financial position, estimated revenues, projected costs, projected synergies, prospects, plans and objectives of management, as
well as information concerning expected actions of third parties, are forward-looking statements. When used in this Annual Report,
the words “anticipate,” “intend,” “plan,” “estimate,” “believe,” “expect,” “project,” “could,” “will,” “should,” “may” and similar
expressions are also intended to identify forward-looking statements, although not all forward-looking statements contain such
identifying words.
Since these forward-looking statements are based upon current expectations of future events and projections and are subject to a
number of risks and uncertainties, many of which are beyond our control, actual results or outcomes may differ materially from
those expressed or implied herein, and you should not place undue reliance on these statements. Important factors that could cause
our actual results to differ materially from those expressed or implied herein include, without limitation:
• competitive promotional activity or spending by competitors or price reductions by competitors;
• the loss of, or a significant reduction in, sales to a significant retail customer;
• difficulties or delays in the integration of operations of acquired businesses;
• the introduction of new product features or technological developments by competitors and/or the development of new
competitors or competitive brands;
• the effects of general economic conditions, including inflation, labor costs and stock market volatility or changes in trade,
monetary or fiscal policies in the countries where we do business;
• our ability to develop and successfully introduce new products and protect our intellectual property;
• our ability to successfully implement, achieve and sustain manufacturing and distribution cost efficiencies and improvements,
and fully realize anticipated cost savings;
• the impact of unusual items resulting from the implementation of new business strategies, acquisitions and divestitures or
current and proposed restructuring activities;
• the cost and effect of unanticipated legal, tax or regulatory proceedings or new laws or regulations (including environmental
regulations);
• changes in accounting policies applicable to our business;
• interest rate, exchange rate and raw materials price fluctuations;
• the effects of political or economic conditions or unrest in international markets; and
• other risk factors included in our Annual Report on Form 10-K.
You should assume the information appearing in this Annual Report is accurate only as of September 30, 2003 or as otherwise
specified, as our business, financial condition, results of operations and prospects may have changed since that date. Except as
required by applicable law, including the securities laws of the United States and the rules and regulations of the Securities and
Exchange Commission, we undertake no obligation to publicly update or revise any forward-looking statement, whether as a
result of new information, future events or otherwise to reflect actual results or changes in factors or assumptions affecting such
forward-looking statement.
Management’s Discussion and Analysis of Financial Condition and Results of OperationsRayovac Corporation and Subsidiaries
Page 28/29

September 30,
(In thousands, except per share amounts) 2002 2003
AssetsCurrent assets:
Cash and cash equivalents $ 9,881 $ 107,774Receivables:
Trade accounts receivable, net of allowance for doubtful receivables of $3,293, and $22,911, respectively 128,927 255,205
Other 7,683 15,376Inventories 84,275 219,254Deferred income taxes 8,586 27,012Prepaid expenses and other 19,970 50,705
Total current assets 259,322 675,326
Property, plant and equipment, net 102,586 150,412Deferred charges and other 36,350 40,160Goodwill 30,567 398,380Intangible assets, net 88,858 253,067Deferred income taxes 12,343 31,036Debt issuance costs 3,207 28,111
Total assets $ 533,233 $1,576,492
Liabilities and Shareholders’ EquityCurrent liabilities:
Current maturities of long-term debt $ 13,400 $ 72,852Accounts payable 76,155 172,632Accrued liabilities:
Wages and benefits 8,910 36,580Income taxes payable 7,143 20,569Restructuring charges 1,701 5,750Accrued interest 1,664 4,894Other 9,811 83,737
Deferred income taxes — 8,511
Total current liabilities 118,784 405,525
Long-term debt, net of current maturities 188,471 870,540Employee benefit obligations, net of current portion 24,009 63,044Deferred income taxes 20,957 22,694Other 6,219 12,687
Total liabilities 358,440 1,374,490
Shareholders’ equity:Common stock, $.01 par value, authorized 150,000 shares; issued 61,594 and
61,999 shares, respectively; outstanding 32,058 and 32,463 shares, respectively 616 620Additional paid-in capital 180,823 185,561Retained earnings 149,221 164,703Accumulated other comprehensive loss (19,859) (12,457)Notes receivable from officers/shareholders (4,205) (3,605)
306,596 334,822Less treasury stock, at cost, 29,536 shares (130,070) (130,070)Less unearned restricted stock compensation (1,733) (2,750)
Total shareholders’ equity 174,793 202,002
Total liabilities and shareholders’ equity $ 533,233 $1,576,492
See accompanying notes to consolidated financial statements.
Consolidated Balance SheetsRayovac Corporation and Subsidiaries

Years Ended September 30,
(In thousands, except per share amounts) 2001 2002 2003
Net sales $616,172 $572,736 $922,122
Cost of goods sold 361,173 334,147 549,514
Restructuring and related charges 22,103 1,210 21,065
Gross profit 232,896 237,379 351,543
Operating expenses:
Selling 119,606 104,374 185,175
General and administrative 46,526 56,900 80,875
Research and development 12,191 13,084 14,364
Restructuring and related charges 204 — 11,487
178,527 174,358 291,901
Income from operations 54,369 63,021 59,642
Interest expense 27,189 16,048 37,182
Non-operating expense 8,587 — 3,072
Other expense (income), net 1,094 1,290 (3,647)
Income before income taxes 17,499 45,683 23,035
Income tax expense 5,965 16,446 7,553
Net income $ 11,534 $ 29,237 $ 15,482
Basic net income per common share:
Net income $ 0.40 $ 0.92 $ 0.49
Weighted average shares of common stock outstanding 28,746 31,775 31,847
Diluted net income per common share:
Net income $ 0.39 $ 0.90 $ 0.48
Weighted average shares of common stock and equivalents outstanding 29,702 32,414 32,556
See accompanying notes to consolidated financial statements.
Consolidated Statements of OperationsRayovac Corporation and Subsidiaries
Page 30/31

Years Ended September 30, 2001, 2002 and 2003
Notes
Receivable
Additional Other from TotalCommon Stock Paid-In Retained Comprehensive Officers/ Treasury Unearned Shareholders’
(In thousands) Shares Amount Capital Earnings Income (Loss) Shareholders Stock Compensation Equity
Balances at September 30, 2000 27,570 $571 $104,197 $108,450 $ 650 $ (3,190) $(129,982) $ — $ 80,696
Net income — — — 11,534 — — — — 11,534
Adjustment of additional minimum
pension liability — — — — (3,298) — — — (3,298)
Translation adjustment — — — — (1,141) — — — (1,141)
Cumulative effect of accounting change — — — — (150) — — — (150)
Net loss on derivative instruments and
available for sale securities — — — — (2,929) — — — (2,929)
Comprehensive income 4,016
Sale of common stock 3,500 35 64,144 — — — — — 64,179
Issuance of restricted stock 277 3 4,743 — — — — (4,746) —
Treasury stock acquired (5) — — — — — (88) — (88)
Exercise of stock options 701 7 7,668 — — — — — 7,675
Notes receivable from officers/shareholders — — — — — (475) — — (475)
Amortization of unearned compensation — — — — — — — 1,582 1,582
Balances at September 30, 2001 32,043 616 180,752 119,984 (6,868) (3,665) (130,070) (3,164) 157,585
Net income — — — 29,237 — — — — 29,237
Adjustment of additional minimum
pension liability — — — — (3,639) — — — (3,639)
Translation adjustment — — — — (7,875) — — — (7,875)
Net loss on derivative instruments and
available for sale securities — — — — (1,477) — — — (1,477)
Comprehensive income 16,246
Forfeiture of restricted stock (24) — (413) — — — — 413 —
Issuance of restricted stock 24 — 313 — — — — (313) —
Exercise of stock options 15 — 171 — — — — — 171
Notes receivable from officers/shareholders — — — — — (540) — — (540)
Amortization of unearned compensation — — — — — — — 1,331 1,331
Balances at September 30, 2002 32,058 616 180,823 149,221 (19,859) (4,205) (130,070) (1,733) 174,793
Net income — — — 15,482 — — — — 15,482
Adjustment of additional minimum
pension liability — — — — (690) — — — (690)
Translation adjustment — — — — 7,753 — — — 7,753
Net gain on derivative instruments and
available for sale securities — — — — 339 — — — 339
Comprehensive income 22,884
Issuance of restricted stock 393 4 4,786 — — — — (4,790) —
Forfeiture of restricted stock (28) — (347) — — — — 347 —
Exercise of stock options 40 — 299 — — — — — 299
Note payments from officers/shareholders — — — — — 600 — — 600
Amortization of unearned compensation — — — — — — — 3,426 3,426
Balances at September 30, 2003 32,463 $620 $185,561 $164,703 $(12,457) $(3,605) $(130,070) $(2,750) $202,002
See accompanying notes to consolidated financial statements.
Consolidated Statements of Shareholders’ EquityRayovac Corporation and Subsidiaries

Years Ended September 30,
(In thousands) 2001 2002 2003
Cash flows from operating activities:
Net income $ 11,534 $ 29,237 $ 15,482
Adjustments to reconcile net income to net cash provided by operating activities:
Depreciation 17,667 18,828 31,133
Non-cash restructuring charges 9,958 542 14,135
Loss on early retirement of debt 8,587 — 3,072
Amortization of debt issuance costs 2,055 1,642 1,957
Amortization 3,473 173 438
Amortization of unearned restricted stock compensation 1,582 1,331 3,426
Deferred income taxes (3,751) 4,257 (9,533)
Stock option income tax benefit 4,348 37 123
Loss on disposal of fixed assets and all other 187 224 1,593
Changes in assets and liabilities, net of acquisitions:
Accounts receivable (35,844) 26,272 6,002
Inventories 5,168 3,579 6,369
Prepaid expenses and other assets (1,577) (4,142) 15,105
Accounts payable and accrued liabilities (10,223) (11,310) (15,621)
Accrued restructuring charges 4,883 (3,844) 2,526
Net cash provided by operating activities 18,047 66,826 76,207
Cash flows from investing activities:
Purchases of property, plant and equipment (19,693) (15,641) (26,125)
Proceeds from sale of property, plant and equipment and investments 1,420 168 132
Payments for acquisitions, net of cash acquired — — (420,403)
Net cash used by investing activities (18,273) (15,473) (446,396)
Cash flows from financing activities:
Reduction of debt (416,699) (224,192) (433,832)
Proceeds from debt financing 421,914 169,100 1,062,580
Extinguishment of debt (69,652) (239) (126,573)
Debt issuance costs — (387) (29,933)
Payments on capital lease obligations (837) (590) (1,167)
(Loans to) payments from officers/shareholders (475) (540) 600
Proceeds from issuance of stock 64,179 — —
Acquisition of treasury stock (88) — —
Proceeds from exercise of stock options 3,327 134 176
Net cash provided (used) by financing activities 1,669 (56,714) 471,851
Effect of exchange rate changes on cash and cash equivalents 158 3,884 (3,769)
Net increase (decrease) in cash and cash equivalents 1,601 (1,477) 97,893
Cash and cash equivalents, beginning of period 9,757 11,358 9,881
Cash and cash equivalents, end of period $ 11,358 $ 9,881 $ 107,774
Supplemental disclosure of cash flow information:
Cash paid for interest $ 28,938 $ 14,671 $ 34,267
Cash paid for income taxes 8,166 11,373 7,555
See accompanying notes to consolidated financial statements.
Consolidated Statements of Cash FlowsRayovac Corporation and Subsidiaries
Page 32/33
(1) DESCRIPTION OF BUSINESS
Rayovac Corporation and its wholly owned subsidiaries (“Company”) manufacture and market consumer batteries and electric per-
sonal care products. Consumer batteries include general (alkaline, rechargeables, heavy duty, lantern and general purpose), button
cell and lithium batteries. The Company also markets a variety of battery powered lighting devices such as flashlights and lanterns.
On October 1, 2002, the Company acquired substantially all of the consumer battery business (“VARTA”) of VARTA AG for approx-
imately $275,300, including acquisition related expenditures. The acquisition consisted of the purchase of all of VARTA AG’s con-
sumer battery subsidiaries and business outside of Germany, excluding Brazil, and a controlling ownership and management interest
in a new joint venture entity that will operate the VARTA AG consumer battery business in Germany. The residual interest in the
joint venture is held by VARTA AG. With the acquisition of VARTA, the Company became a truly global battery manufacturer and
marketer and acquired additional low-cost manufacturing capacity and battery technology. (See also Acquisitions and Divestitures,
footnote 16, for additional information on the VARTA acquisition.)
On September 30, 2003, the Company acquired all of the equity interests of Remington Products Company, L.L.C. (“Remington”)
for approximately $174,000, including acquisition related expenditures, and the assumption of Remington’s outstanding debt of
approximately $180,400. Remington is now a wholly owned subsidiary of the Company. Remington is a leading designer and mar-
keter of electric shavers and accessories, electric grooming products and hair care appliances. (See also Acquisitions and Divestitures,
footnote 16, for additional information on the Remington acquisition.)
The Company’s products are sold on a global basis in over 100 countries in North America, Latin America, Europe, and the Far East
through a variety of channels, including mass merchandisers, home centers and hardware stores, consumer electronic stores, ware-
house clubs, food, drug and convenience stores, department stores, hearing aid professionals, industrial distributors and original
equipment manufacturers.
(2) SIGNIFICANT ACCOUNTING POLICIES AND PRACTICES
(a) Principles of Consolidation and Fiscal Year End The consolidated financial statements include the financial statements of Rayovac
Corporation and its wholly owned subsidiaries and are prepared in accordance with accounting principles generally accepted in
the United States of America. All intercompany transactions have been eliminated. The Company’s fiscal year ends September 30.
References herein to 2001, 2002 and 2003 refer to the fiscal years ended September 30, 2001, 2002 and 2003.
The Company’s Consolidated Balance Sheet as of September 30, 2003 and Consolidated Statement of Cash Flows for the year ended
September 30, 2003 give effect to the Remington acquisition, which occurred on September 30, 2003. Consequently, all Balance Sheet
footnote disclosures include the impacts of the Remington acquisition.
The Company’s Consolidated Statement of Operations for the year ended September 30, 2003, includes only the results attributable
to Rayovac and its subsidiaries prior to the Remington acquisition. Consequently, all Statement of Operations footnote disclosures
exclude the results of the Remington acquisition.
(b) Revenue Recognition The Company recognizes revenue from product sales upon shipment to the customer which is the point
at which all risks and rewards of ownership of the product is passed, provided that: there are no uncertainties regarding customer
acceptance; persuasive evidence of an arrangement exists; the price to the buyer is fixed or determinable; and collectibility is deemed
reasonably assured. The Company is not obligated to allow for, and the Company’s general policy is not to accept, product returns.
The Company enters into various promotional arrangements, primarily with retail customers, including arrangements entitling
such retailers to cash rebates from the Company based on the level of their purchases, which require the Company to estimate and
accrue the estimated costs of the promotional programs. These costs are generally treated as a reduction of net sales.
The Company also enters into promotional arrangements targeted to the ultimate consumer. Such arrangements are treated as
either a reduction of net sales or an increase of cost of sales, based on the type of promotional program. The income statement
characterization of the Company’s promotional arrangements complies with EITF 01-09, Accounting for Consideration Given by a Vendor
to a Customer (Including a Reseller of the Vendor’s Products).
Notes to Consolidated Financial StatementsRayovac Corporation and Subsidiaries
(In thousands, except per share amounts)

For all types of promotional arrangements and programs, the Company monitors its commitments and uses statistical measures
and past experience to determine amounts to be recorded for the estimate of the earned, but unpaid, promotional costs. The terms
of the Company’s customer-related promotional arrangements and programs are individualized to each customer and are generally
documented through written contracts, correspondence or other communications with the individual customers.
The Company also enters into various contractual arrangements, primarily with retail customers, which require the Company
to make upfront cash, or “slotting” payments, to secure the right to distribute through such customer. The Company capitalizes
slotting payments, provided the payments are supported by a time or volume based contractual arrangement with the retailer,
and will amortize the associated payment over the appropriate time or volume based term of the contractual arrangement. The
amortization of the slotting payment is treated as a reduction in net sales and the corresponding asset is included in Deferred
charges and other in the Consolidated Balance Sheets.
(c) Use of Estimates The preparation of financial statements in conformity with generally accepted accounting principles requires
management to make estimates and assumptions that affect the reported amounts of assets and liabilities and disclosure of contin-
gent assets and liabilities at the date of the financial statements and the reported amounts of revenues and expenses during the
reporting period. Actual results could differ from those estimates.
(d) Cash Equivalents For purposes of the statements of cash flows, the Company considers all highly liquid debt instruments
purchased with original maturities of three months or less to be cash equivalents.
(e) Concentrations of Credit Risk, Major Customers and Employees Trade receivables potentially subject the Company to credit
risk. The Company extends credit to its customers based upon an evaluation of the customer’s financial condition and credit history
and generally does not require collateral. The Company monitors its customers’ credit and financial condition based on changing
economic conditions and will make adjustments to credit policies as required. The Company has historically incurred minimal
credit losses, but in 2002 experienced a significant loss resulting from the bankruptcy filing of a large retailer in the United States.
The Company has a broad range of customers including many large retail outlet chains, one of which accounts for a significant
percentage of its sales volume. This major customer represented approximately 27%, 26%, and 13% of its net sales during 2001, 2002,
and 2003, respectively. This major customer also represented approximately 23% and 13%, respectively, of trade account receivables
as of September 30, 2002 and 2003.
Excluding the impacts of the Remington acquisition, approximately 59% of the Company’s sales occur outside of North America.
These sales and related receivables are subject to varying degrees of credit, currency, and political and economic risk. The Company
monitors these risks and makes appropriate provisions for collectibility based on an assessment of the risks present.
Approximately 16% of the total labor force is covered by collective bargaining agreements. The Company believes its relationship
with its employees is good and none of our facilities has experienced a work stoppage in the last ten years.
The Company has entered into collective bargaining agreements with expiration dates as follows:
Location Expiration Date
Guatemala City, Guatemala March 2004
Washington, UK December 2004
Fennimore, WI March 2005
Portage, WI June 2006
Bargaining agreements that expire by the end of fiscal 2004 represent approximately 5% of the total labor force.
(f ) Displays and Fixtures Temporary displays are generally disposable cardboard displays shipped to customers to facilitate display of
the Company’s products. Temporary displays are generally disposed after a single use by the customer.
Permanent fixtures are permanent in nature, generally made from wire or other permanent racking, which are shipped to customers
for display of the Company’s products. These permanent fixtures are restocked with the Company’s product multiple times over
the fixture’s useful life.
Notes to Consolidated Financial StatementsRayovac Corporation and Subsidiaries
(In thousands, except per share amounts)
Page 34/35

The costs of temporary displays are capitalized as a prepaid asset and are included in Prepaid expenses and other and are expensed in
the period in which they are shipped to customers. Permanent fixtures are capitalized as a prepaid asset and are included in Prepaid
expenses and other, and once they are shipped to customers are reflected in Deferred charges and other and are amortized over an
estimated useful life of one to two years.
(g) Inventories The Company’s inventories are valued at the lower of cost or market. Cost for the majority of inventories is deter-
mined using the first-in, first-out (FIFO) method with costs for other inventories determined primarily using the average or last-in,
first-out (LIFO) cost method. As of September 30, 2003, the excess of current replacement cost over LIFO cost of inventories was
not significant.
(h) Property, Plant and Equipment Property, plant and equipment are stated at cost. Depreciation on plant and equipment is calcu-
lated on the straight-line method over the estimated useful lives of the assets. Depreciable lives by major classification are as follows:
Building and improvements 20–30 years
Machinery, equipment and other 2–15 years
The Company reviews long-lived assets for impairment whenever events or changes in circumstances indicate that the carrying
amount of an asset may not be recoverable. The Company evaluates recoverability of assets to be held and used by comparing
the carrying amount of an asset to future net cash flows expected to be generated by the asset. If such assets are considered to be
impaired, the impairment to be recognized is measured by the amount by which the carrying amount of the assets exceeds the
fair value of the assets. Assets to be disposed of are reported at the lower of the carrying amount or fair value less costs to sell.
(i) Intangible Assets Intangible assets are recorded at cost. Non-compete agreements and proprietary technology intangibles are
amortized, using the straight-line method, over their estimated useful lives of approximately 5 to 19 years. Excess cost over fair
value of net assets acquired (goodwill) and trade name intangibles are not amortized. Goodwill is tested for impairment at least
annually at the reporting unit level. If impairment is indicated, a write-down to fair value (normally measured by discounting
estimated future cash flows) is recorded. Trade name intangibles are tested for impairment at least annually by comparing the
fair value with the carrying value.
Any excess of carrying value over fair value is recognized as an impairment loss in income from operations.
The Company assesses the recoverability of its intangible assets with finite useful lives by determining whether the amortization
of the remaining balance over its remaining life can be recovered through projected undiscounted future cash flows. If projected
future cash flows indicate that the unamortized carrying value of intangible assets with finite useful lives will not be recovered,
an adjustment would be made to reduce the carrying value to an amount equal to projected future cash flows discounted at the
Company’s incremental borrowing rate. Cash flow projections used by the Company are based on trends of historical performance
and management’s estimate of future performance, giving consideration to existing and anticipated competitive and economic
conditions. (See also Adoption of New Accounting Pronouncements, footnote 2 (x), and Intangible Assets, footnote 5.)
(j) Debt Issuance Costs Debt issuance costs are capitalized and amortized to interest expense over the lives of the related debt
agreements.
(k) Accounts Payable Included in accounts payable are book overdrafts on disbursement accounts that were replenished when
checks were presented for payment.
(l) Income Taxes Income taxes are accounted for under the asset and liability method. Deferred tax assets and liabilities are recog-
nized for the future tax consequences attributable to differences between the financial statement carrying amounts of existing assets
and liabilities and their respective tax bases and operating loss and tax credit carry forwards. Deferred tax assets and liabilities are
measured using enacted tax rates expected to apply to taxable income in the years in which those temporary differences are expected
to be recovered or settled. The effect on deferred tax assets and liabilities of a change in tax rates is recognized in income in the
period that includes the enactment date.
(m) Foreign Currency Translation Assets and liabilities of the Company’s foreign subsidiaries are translated at the rate of exchange
existing at year-end, with revenues, expenses, and cash flows translated at the average of the monthly exchange rates. Adjustments
resulting from translation of the financial statements are recorded as a component of accumulated other comprehensive income
(“OCI”). Also included in OCI are the effects of exchange rate changes on intercompany balances of a long-term nature and trans-
actions designated as hedges of net foreign investments.
Notes to Consolidated Financial StatementsRayovac Corporation and Subsidiaries
(In thousands, except per share amounts)
Currency devaluations in Argentina and Venezuela, along with the weakening currency in Mexico had significant negative impacts
on OCI in 2002 and 2003. The strengthening of the Euro versus the U.S. Dollar currency had a significant positive impact on OCI in
2003, primarily related to the translation of our Euro denominated net assets associated with the acquisition of the VARTA business
in 2003.
As of September 30, 2002 and 2003, foreign currency translation adjustment balances of $(8,314) and $(561), respectively, were
reflected in the Consolidated Balance Sheets in Accumulated other comprehensive loss.
Exchange losses (gains) on foreign currency transactions aggregating $2,091, $2,412, and $(2,637) for 2001, 2002 and 2003, respectively,
are included in Other expense (income), net, in the Consolidated Statements of Operations.
(n) Shipping and Handling Costs The Company incurred shipping and handling costs of $28,710, $24,081 and $45,573 in 2001, 2002
and 2003, respectively, which are included in Selling expense. Shipping and handling costs include costs incurred with third-party
carriers to transport products to customers and salaries and overhead costs related to activities to prepare the Company’s products
for shipment at the Company’s distribution facilities.
(o) Advertising Costs The Company incurred expenses for advertising of $19,367, $10,317 and $11,458 in 2001, 2002 and 2003, respec-
tively, which are included in Selling expense. The Company expenses advertising production costs the first time the advertising
takes place.
(p) Research and Development Costs Research and development costs are charged to expense in the year they are incurred.
(q) Net Income Per Common Share Basic net income per common share is computed by dividing net income available to common
shareholders by the weighted-average number of common shares outstanding for the period. Basic net income per common share
does not consider common stock equivalents. Diluted net income per common share reflects the dilution that would occur if con-
vertible debt securities, employee stock options, and restricted stock awards were exercised or converted into common shares or
resulted in the issuance of common shares that then shared in the net income of the entity. The computation of diluted net income
per common share uses the “if converted” and “treasury stock” methods to reflect dilution. The difference between the basic and
diluted number of shares is due to assumed conversion of employee stock options where the exercise price is less than the market
price of the underlying stock.
Net income per common share is calculated based upon the following shares:
2001 2002 2003
Basic 28,746 31,775 31,847
Effect of restricted stock and assumed
conversion of stock options 956 639 709
Diluted 29,702 32,414 32,556
In 2001, 2002, and 2003, respectively, approximately 1,031, 2,998 and 2,775 stock options were excluded from the calculation of diluted
earnings per share because their effect was antidilutive.
(r) Derivative Financial Instruments Derivative financial instruments are used by the Company principally in the management
of its interest rate, foreign currency and raw material price exposures. The Company does not hold or issue derivative financial
instruments for trading purposes.
The Company uses interest rate swaps to manage its interest rate risk. The swaps are designated as cash flow hedges with the fair
value recorded in Other Comprehensive Income (“OCI”) and as a hedge asset or liability, as applicable. The swaps settle periodically
in arrears with the related amounts for the current settlement period payable to, or receivable from, the counter-parties included in
accrued liabilities or accounts receivable and recognized in earnings as an adjustment to interest expense from the underlying debt
to which the swap is designated. During 2003, $4,647 of pretax derivative losses from such hedges were recorded as an adjustment to
interest expense. At September 30, 2003, the Company had a portfolio of interest rate swaps outstanding which effectively fixes the
interest rates on floating rate debt at rates as follows: 4.458% for a notional principal amount of $70,000 through July 2004, 3.974%
for a notional principal amount of $70,000 from July 2004 through October 2005, 3.769% for a notional principal amount of $100,000
through August 2004 and 3.799% for a notional principal amount of $100,000 from August 2004 through November 2005. The deriva-
tive net losses on these contracts recorded in OCI at September 30, 2003 was an after-tax loss of $4,553.
Notes to Consolidated Financial StatementsRayovac Corporation and Subsidiaries
(In thousands, except per share amounts)
Page 36/37

The Company enters into forward and swap foreign exchange contracts, to hedge the risk from forecasted settlement in local cur-
rencies of inter-company purchases and sales, trade sales, and trade purchases. These contracts generally require the Company to
exchange foreign currencies for U.S. dollars, Euros or Pounds Sterling. These contracts are designated as cash flow hedges with the
fair value recorded in OCI and as a hedge asset or liability, as applicable. Once the forecasted transaction has been recognized as a
purchase or sale and a related liability or asset recorded in the balance sheet, the gain or loss on the related derivative hedge con-
tract is reclassified from OCI into earnings as an offset to the change in value of the liability or asset. During 2003, $98 of pretax
derivative losses were recorded as an adjustment to earnings for forward and swap contracts settled at maturity. At September 30,
2003, the Company had a series of forward contracts outstanding with a contract value of $14,387. The derivative net losses on these
contracts recorded in OCI at September 30, 2003 was zero.
The Company periodically enters into forward foreign exchange contracts, to hedge the risk from changes in fair value from
unrecognized firm purchase commitments. These firm purchase commitments generally require the Company to exchange U.S.
dollars for foreign currencies. These hedge contracts are designated as fair value hedges with the fair value recorded in earnings
on a pretax basis and as a hedge asset or liability, as applicable. To the extent effective, changes in the value of the forward contracts
recorded in earnings will be offset by changes in the value of the hedged item, also recorded in earnings on a pretax basis and as
an asset or liability, as applicable. Once the firm purchase commitment has been consummated, the firm commitment asset or lia-
bility balance will be reclassified as an addition to or subtraction from, the carrying value of the purchased asset. During 2003, no
such foreign exchange derivative activity occurred. At September 30, 2003, the Company had no such foreign exchange derivative
contracts outstanding.
The Company is exposed to risk from fluctuating prices for zinc used in the manufacturing process. The Company hedges a portion
of this risk through the use of commodity swaps. The swaps are designated as cash flow hedges with the fair value recorded in OCI
and as a hedge asset or liability, as applicable. The fair value of the swaps is reclassified from OCI into earnings when the hedged
purchase of zinc metal-based items also affects earnings. The swaps effectively fix the floating price on a specified quantity of zinc
through a specified date. During 2003, $528 of pretax derivative losses were recorded as an adjustment to cost of sales for swap con-
tracts settled at maturity. At September 30, 2003, the Company had a series of swap contracts outstanding through October 2004
with a contract value of $9,684. The derivative net gains on these contracts recorded in OCI at September 30, 2003 was an after-tax
gain of $336.
(s) Fair Value of Financial Instruments The carrying values of cash and cash equivalents, accounts and notes receivable, accounts
payable and short-term debt approximate fair value. The fair values of long-term debt and derivative financial instruments are
generally based on quoted market prices.
The carrying value of financial instruments approximate the fair value of those instruments, except for the $350,000 of Senior
Subordinated Notes due September 30, 2013 with interest payable semiannually at 81⁄2% and Series B & D Senior Subordinated
Debentures of $56,010, due May 15, 2006, with interest payable semiannually at 11%. The fair value of the Notes and Debentures at
September 30, 2003 was approximately $360,509 and $57,037, respectively. (See also Derivative Financial Instruments, footnote 2(r),
and Debt, footnote 6.)
(t) Environmental Expenditures Environmental expenditures that relate to current ongoing operations or to conditions caused by
past operations are expensed. The Company determines its liability on a site-by-site basis and records a liability at the time when it
is probable and can be reasonably estimated. The estimated liability is not reduced for possible recoveries from insurance carriers.
(u) Reclassifications Certain prior year amounts have been reclassified to conform with the current year presentation.
(v) Comprehensive Income Comprehensive income includes foreign currency translation of assets and liabilities of foreign subsid-
iaries, effects of exchange rates changes on intercompany balances of a long-term nature and transactions designated as a hedge of
net foreign investments, derivative financial instruments designated as cash flow hedges, and additional minimum pension liabilities
associated with the Company’s pension plans.
Notes to Consolidated Financial StatementsRayovac Corporation and Subsidiaries
(In thousands, except per share amounts)

Amounts recorded in Other Comprehensive Income (Loss) on the Consolidated Statement of Shareholders’ Equity for the years
ended September 30, 2001, 2002 and 2003 are net of tax expense (benefit) in the amount of:
Pension Cash
Adjustment Flow Hedges Total
2001 $ — $(2,140) $(2,140)
2002 — (689) (689)
2003 (4,744) 76 (4,668)
In 2003, the Company recognized a deferred tax asset associated with its additional minimum pension liability. In years prior to 2003,
the tax benefit related to the minimum pension liability was inadvertently omitted from comprehensive income. The tax benefit
recorded in comprehensive income in 2003 related to prior years amounted to $2,656.
(w) Stock Compensation The Company has adopted the provisions of Statement No. 123, Accounting for Stock-Based Compensation,
and continues to apply Accounting Principles Board Opinion No. 25 and related interpretations in accounting for its stock plans.
Accordingly, the Company recognized $1,582, $1,331 and $3,426, respectively, of compensation cost, before tax, related to restricted
stock in 2001, 2002, and 2003, respectively, and no compensation cost, before tax, related to options for the stock plans. If the
Company had elected to recognize compensation cost for all of the plans based upon the fair value at the grant dates for awards
under those plans, consistent with an alternative method prescribed by Statement No. 123, net income per common share would
have been reduced to the pro forma amounts indicated below:
2001 2002 2003
Reported net income $11,534 $29,237 $15,482
Add: Stock-based compensation expense included
in reported net income, net of tax 965 812 2,090
Deduct: Total stock-based compensation expense
determined under fair value based method for
all awards, net of tax (4,567) (4,778) (6,739)
Pro forma net income $ 7,932 $25,271 $10,833
Basic earnings per share:
As reported $ 0.40 $ 0.92 $ 0.49
Pro forma $ 0.28 $ 0.80 $ 0.34
Diluted earnings per share:
As reported $ 0.39 $ 0.90 $ 0.48
Pro forma $ 0.27 $ 0.78 $ 0.34
The fair value of the Company’s stock options used to compute pro forma net income and basic and diluted net income per com-
mon share disclosures is the estimated fair value at grant date using the Black-Scholes option-pricing model with the following
weighted-average assumptions:2001 2002 2003
Assumptions used:
Volatility 34.7% 37.6% 40.3%
Risk-free interest rate 4.48% 3.40% 3.36%
Expected life 8 years 8 years 8 years
Dividend yield — — —
Weighted-average grant-date fair value
of options granted during period $7.27 $6.89 $5.99
The Black-Scholes option-pricing model was developed for use in estimating the fair value of traded options that have no vesting
restrictions and are fully transferable. In addition, option valuation models require the input of highly subjective assumptions,
including the expected stock price volatility. Because the Company’s options have characteristics significantly different from traded
options, and because changes in the subjective input assumptions can materially affect the fair value estimate, in the opinion of
management, the existing models do not necessarily provide a reliable single value of its options and may not be representative
of the future effects on reported net income or the future stock price of the Company. For purposes of proforma disclosure, the
estimated fair value of the options is amortized to expense over the option’s vesting period.
Notes to Consolidated Financial StatementsRayovac Corporation and Subsidiaries
(In thousands, except per share amounts)
Page 38/39
(x) Adoption of New Accounting Pronouncements Effective October 1, 2000, the Company adopted Financial Accounting Standards
Board (FASB) Statement No. 133, Accounting for Derivative Instruments and Hedging Activities, which establishes accounting and reporting
standards for derivative instruments, including certain derivative instruments embedded in other contracts and for hedging activities.
All derivatives, whether designated in hedging relationships or not, are required to be recorded on the balance sheet at fair value.
If the derivative is designated as a fair value hedge, the change in the fair value of the derivative and of the hedged item attributable
to the hedged risk are recognized in earnings. If the derivative is designated as a cash flow hedge, the effective portions of changes
in the fair value of the derivative are recorded in Other Comprehensive Income (OCI) and are recognized in the income statement
when the hedged item affects earnings. Ineffective portions of changes in the fair value of cash flow hedges are recognized in earnings.
The adoption of Statement No. 133 resulted in a pretax reduction to OCI of $317 ($150 after tax) in 2001. The reduction of OCI was
primarily attributable to losses of approximately $500 for foreign exchange forward cash flow hedges partially offset by gains of
approximately $200 on interest rate swap cash flow hedges. (See also footnote 2(r), Derivative Financial Instruments.)
Effective July 1, 2001, the Company adopted Statement No. 141, Business Combinations, and effective October 1, 2001, Statement No. 142,
Goodwill and Other Intangible Assets.
Statement No. 141 requires that the purchase method of accounting be used for all business combinations initiated or completed
on or after July 1, 2001. Statement No. 141 also specifies criteria that intangible assets acquired in a purchase method business com-
bination must meet to be recognized and reported apart from goodwill. Statement No. 142 requires that goodwill and intangible
assets with indefinite useful lives no longer be amortized, but instead be tested for impairment at least annually in accordance with
the provisions of Statement No. 142. Statement No. 142 also requires that intangible assets with estimable useful lives be amortized
over their respective estimated useful lives to their estimated residual values, and reviewed for impairment in accordance with
Statement No. 144, Accounting for the Impairment or Disposal of Long-Lived Assets. Upon the transition to Statement No. 142, no goodwill
was deemed to be impaired. (See also footnote 2(i), Intangible Assets.)
The table below presents net income and earnings per share information as if Statement No. 142 had been adopted at the beginning
of the periods presented:2001 2002 2003
Reported net income $11,534 $29,237 $15,482
Add back: Goodwill amortization, net of tax of $0 1,050 — —
Add back: Trade name amortization, net of tax of $855 1,395 — —
Adjusted net income $13,979 $29,237 $15,482
Basic Earnings Per Share:
Reported net income $ 0.40 $ 0.92 $ 0.49
Goodwill amortization 0.04 — —
Trade name amortization 0.05 — —
Adjusted net income $ 0.49 $ 0.92 $ 0.49
Diluted Earnings Per Share:
Reported net income $ 0.39 $ 0.90 $ 0.48
Goodwill amortization 0.03 — —
Trade name amortization 0.05 — —
Adjusted net income $ 0.47 $ 0.90 $ 0.48
In August 2001, the FASB issued Statement No. 143, Accounting for Asset Retirement Obligations. Statement No. 143 addresses financial
accounting and reporting for obligations associated with the retirement of tangible long-lived assets and the associated asset retire-
ment costs. The Company adopted the Statement on October 1, 2002. Adoption did not have a material effect on the consolidated
financial statements of the Company.
In October 2001, the FASB issued Statement No. 144, Accounting for the Impairment or Disposal of Long-Lived Assets. This statement supersedes
FASB Statement No. 121, Accounting for the Impairment of Long-Lived Assets and for Long-Lived Assets to be Disposed of, and the accounting and
reporting provisions of APB Opinion No. 30, Reporting the Results of Operations—Reporting the Effects of Disposal of a Segment of a Business, and
Extraordinary, Unusual and Infrequently Occurring Events and Transactions, for the disposal of a segment of a business. The Company adopted the
Statement on October 1, 2002. Adoption did not have a material effect on the consolidated financial statements of the Company.
Notes to Consolidated Financial StatementsRayovac Corporation and Subsidiaries
(In thousands, except per share amounts)

In April 2002, the FASB issued Statement No. 145, Rescission of FASB Statements No. 4, 44, and 64, Amendment of FASB Statement No. 13, and
Technical Corrections. The Statement addresses, among other things, the income statement treatment of gains and losses related to debt
extinguishments, requiring such expenses to no longer be treated as extraordinary items, unless the items meet the definition of
extraordinary per APB Opinion No. 30, Reporting the Results of Operations—Reporting the Effects of Disposal of a Segment of a Business, and Extra-
ordinary, Unusual and Infrequently Occurring Events and Transactions. The Company adopted this Statement on October 1, 2002. As a result, the
write-off of unamortized debt issuance costs of $3,072 associated with the replacement of our previous credit facility in October 2002
and $8,587 associated with our redemption of our subordinated debt in June 2001 are classified as Non-operating expense in our
Consolidated Statements of Operations for the years ended September 30, 2003 and 2001, respectively. Previously, the premium of
$8,587 associated with the redemption of our subordinated debt in 2001 was shown as an extraordinary item.
In July 2002, the FASB issued Statement No. 146, Accounting for Costs Associated with Exit or Disposal Activities. Statement No. 146 nullifies
EITF 94-3, Liability Recognition for Certain Employee Termination Benefits and Other Costs to Exit an Activity (including Certain Costs Incurred in a Restructur-
ing). According to the Statement, commitments to a plan to exit an activity or dispose of long-lived assets will no longer be enough
to record a one-time charge for most anticipated costs. Instead, companies will record exit or disposal costs when they are “incurred”
and can be measured at fair value, and they will subsequently adjust the recorded liability for changes in estimated fair value. State-
ment No. 146 also revises accounting for specified employee and contract terminations that are part of restructuring activities.
Statement No. 146 is effective for exit and disposal activities that are initiated after December 31, 2002. The Company applied the
provisions of EITF 94-3 to the restructuring initiatives announced and committed to, prior to December 31, 2002, during 2003 (See
2003 Restructuring summary within footnote 15, Restructuring Charges). The adoption of Statement No. 146 may impact the
timing of recognition of future exit or disposal activities. The Company believes that the adoption of Statement No. 146 will not
have a significant impact on its consolidated financial statements.
In November 2002, the FASB issued Interpretation No. 45, Guarantor’s Accounting and Disclosure Requirements for Guarantees, Including Indirect
Guarantees of Indebtedness of Others. This Interpretation addresses, among other things, the disclosure to be made by a guarantor in its
interim and annual financial statements about its obligations under guarantees. The Interpretation also requires the recognition of
a liability by a guarantor at the inception of certain guarantees. The Company has adopted the disclosure requirements of the Inter-
pretation, and applied the recognition and measurement provisions for all guarantees entered into or modified after December 31,
2002. Adoption did not have a material effect on the consolidated financial statements of the Company.
In December 2002, the FASB issued Statement No. 148, Accounting for Stock-Based Compensation—Transition and Disclosure. This Statement
amends FASB Statement No. 123, Accounting for Stock-Based Compensation, to provide alternative methods of transition for a voluntary
change to the fair value based method of accounting for stock-based employee compensation. In addition, this Statement amends
the disclosure requirements of Statement No. 123 to require prominent disclosures in both annual and interim financial statements
about the method of accounting for stock-based employee compensation and the effect of the method used on reported results.
The Company adopted the disclosure provisions of Statement No. 148 as seen in footnote 2(w), Stock Compensation.
In January 2003, the FASB issued Interpretation No. 46, Consolidation of Variable Interest Entities. Interpretation No. 46 addresses consolida-
tion by business enterprises of variable interest entities. The interpretation applies immediately for variable interest entities created
after January 31, 2003, and to variable interest entities in which an enterprise obtains an interest after that date. For existing variable
interest entities or investments in such, the interpretation applies in the first fiscal year or interim period beginning after December
15, 2003. Adoption did not have a material effect on the consolidated financial statements of the Company.
In April 2003, the FASB issued Statement No. 149, Amendment of Statement 133 on Derivative Instruments and Hedging Activities. FASB Statements
No. 133, Accounting for Derivative Instruments and Hedging Activities, and No. 138, Accounting for Certain Derivative Instruments and Certain Hedging
Activities, establish accounting and reporting standards for derivative instruments including derivatives embedded in other contracts
and for hedging activities. Statement No. 149 amends Statement No. 133 for certain decisions by the FASB as part of the Derivatives
Implementation Group (“DIG”) process. Statement No. 149 is effective for contracts entered into or modified after June 30, 2003, and
is effective for hedging relationships designated after June 30, 2003, except for certain transition and effective dates relating to other
amendments that principally resulted from the DIG process. Adoption did not have a material effect on the consolidated financial
statements of the Company.
Notes to Consolidated Financial StatementsRayovac Corporation and Subsidiaries
(In thousands, except per share amounts)
Page 40/41

In May 2003, the Emerging Issues Task Force (EITF) issued EITF Consensus No. 01-8, Determining Whether an Arrangement Contains a Lease.
Consensus No. 01-8 requires capital lease treatment for arrangements containing an embedded lease, thereby conveying the right
to control the use of property, plant or equipment (collectively, “the property”) whether the property is explicitly or implicitly
specified. The right is conveyed if the purchaser obtains physical or operational control of the property or takes substantially all
of its output. Consensus No. 01-8 applies prospectively to new or modified arrangements beginning after May 28, 2003. Adoption
of Consensus No. 01-8 did not have a significant impact on the consolidated financial statements of the Company.
In May 2003, the FASB issued Statement No. 150, Accounting for Certain Financial Instruments with Characteristics of both Liabilities and Equity. State-
ment No. 150 establishes standards for how an issuer classifies and measures certain financial instruments with characteristics of
both liabilities and equity. The Statement requires that certain types of freestanding financial instruments be treated as liabilities and
measured at fair value. The Statement is effective for financial instruments entered into or modified after May 21, 2003, and other-
wise is effective at the beginning of the first interim period beginning after June 15, 2003. Certain provisions of the Statement were
delayed indefinitely. Adoption of the implemented sections of the Statement did not have a significant impact on the consolidated
financial statements of the Company.
(3) INVENTORIES
Inventories consist of the following:September 30,
2002 2003
Raw materials $ 19,893 $ 60,732
Work-in-process 19,004 34,914
Finished goods 45,378 123,608
$ 84,275 $219,254
(4) PROPERTY, PLANT AND EQUIPMENT
Property, plant and equipment consist of the following:September 30,
2002 2003
Land, buildings and improvements $ 34,559 $ 51,195
Machinery, equipment and other 184,087 242,184
Construction in process 10,303 7,857
228,949 301,236
Less accumulated depreciation 126,363 150,824
$102,586 $150,412
Property, plant, and equipment includes equipment held under capitalized leases, net of amortization, totaling $615 and $20,420 at
September 30, 2002 and 2003, respectively. The significant increase in capital leases is due to leases assumed as part of the VARTA
acquisition.
During 2003, the Company closed its manufacturing operations in Mexico City, Mexico and its Madison, Wisconsin and Middleton,
Wisconsin packaging and distribution locations. The Company’s owned properties in Mexico City, Mexico and Madison, Wisconsin,
with an aggregate net book value of $8,680, are being treated as assets held for sale and are included in Prepaid expenses and other
in the Company’s Consolidated Balance Sheet at September 30, 2003.
Notes to Consolidated Financial StatementsRayovac Corporation and Subsidiaries
(In thousands, except per share amounts)

(5) INTANGIBLE ASSETS
Intangible assets consist of the following:September 30, 2002 September 30, 2003
Gross Gross
Carrying Accumulated Net Carrying Accumulated Net
Amount Amortization Intangible Amount Amortization Intangible
Amortized Intangible Assets
Non-compete agreement $ 700 $ 630 $ 70 $ 700 $ 700 $ —
Proprietary technology 525 308 217 12,534 490 12,044
Customer lists — — — 2,099 210 1,889
$ 1,225 $ 938 $ 287 $ 15,333 $1,400 $ 13,933
Pension Intangibles
Under-funded pension $ 3,446 $ — $ 3,446 $ 2,405 $ — $ 2,405
Unamortized Intangible Assets
Trade names balance as of beginning of year $90,000 $4,875 $85,125 $ 90,000 $4,875 $ 85,125
Trade name acquired during year — — — 128,642 — 128,642
Effect of translation — — — 22,962 — 22,962
Trade names balance as of end of year $90,000 $4,875 $85,125 $241,604 $4,875 $236,729
North Latin
America America Europe/ROW Total
Goodwill
Balance as of October 1, 2002, net $ 1,035 $26,884 $ 2,648 $ 30,567
Goodwill acquired during year 284,383 11,170 62,493 358,046
Effect of translation — (178) 9,945 9,767
Balance as of September 30, 2003, net $285,418 $37,876 $75,086 $398,380
During 2003, the Company completed the acquisitions of substantially all of the consumer battery business of VARTA AG and
Remington Products Company, L.L.C. The Company recognized intangible assets associated with the acquisitions, including propri-
etary manufacturing technology, customer lists, and VARTA trade name intangibles. The purchase price allocation for the VARTA
acquisition has been completed. The Company also recognized goodwill with both the VARTA and Remington acquisitions. The
purchase price allocation of the Remington acquisition is not yet finalized. Future allocation of the Remington purchase price will
impact the amount and or segment allocation of goodwill and other intangible assets acquired during the year. (See also footnote
16, Acquisitions and Divestitures, for additional discussion on the VARTA and Remington acquisitions.) No allocation to trade name
or other intangibles has been made in the Consolidated Balance Sheet as of September 30, 2003 as valuations relating to Remington
have not been completed.
The non-compete agreement was amortized on a straight-line basis over 5 years, proprietary technology assets are being amortized
on a straight-line basis over 10 to 19 years, and the customer list asset is being amortized on a straight-line basis over 10 years. The
Company has deemed that its trade name intangible assets have indefinite lives because they are expected to generate cash flows
indefinitely, the Company has no intention of selling the trade names and there are no legal, regulatory, or contractual provisions
that may limit the useful lives of the trade names. Goodwill and intangible assets deemed to have indefinite lives are tested for
impairment annually.
During 2003, the Company wrote-off a $702 pension intangible asset related to the Madison, Wisconsin packaging facility pension
plan. The write-off related to the closure of operations at the facility and curtailment of the pension plan and is reflected in Restruc-
turing charges in cost of goods sold in our Consolidated Statement of Operations. (See also Restructuring Charges, footnote 15, for
further discussion.)
Notes to Consolidated Financial StatementsRayovac Corporation and Subsidiaries
(In thousands, except per share amounts)
Page 42/43

The trade name asset and Latin America segment goodwill, prior to the adoption of FASB Statement No. 142, are associated with
the 1999 acquisition of ROV Limited and were being amortized on a straight-line basis over 40 years. The North America segment
goodwill, prior to the adoption of FASB Statement No. 142, is associated with the 1998 acquisition of Best Labs and was being amor-
tized on a straight-line basis over 15 years. The Europe/ROW segment goodwill, prior to the adoption of FASB Statement No. 142, is
associated with the 1998 acquisition of Brisco GmbH in Germany and was being amortized on a straight-line basis over 15 years.
The amortization expense for 2001, 2002, and 2003 are as follows:
2001 2002 2003
Amortization Expense
Goodwill amortization $1,050 $— $ —
Trade name amortization 2,250 — —
Customer list amortization — — 195
Non-compete and proprietary technology 173 173 243
$3,473 $173 $438
The annual amortization expense (based on September 30, 2003 exchange rates) for the next five fiscal years, is estimated to be
approximately:
2004 $950
2005 $950
2006 $850
2007 $850
2008 $850
The purchase price allocation for the Remington acquisition has not yet been finalized, consequently, changes in the purchase price
allocation could impact estimates of future amortization expense.
(6) DEBT
Debt consists of the following:September 30,
2002 2003
Revolving credit facility $174,500 $ —
Term loan facility 23,061 —
Euro revolving credit facility — —
Euro term A loan facility — 49,563
Euro term B loan facility — 139,067
Term B loan facility — 317,000
Series B Senior Subordinated Debentures, due May 15, 2006,
with interest at 11% payable semi-annually — 5,424
Series D Senior Subordinated Debentures, due May 15, 2006,
with interest at 11% payable semi-annually — 50,586
Senior Subordinated Notes, due September 30, 2013, with
interest at 81⁄2% payable semi-annually — 350,000
Capitalized lease obligations 500 24,100
Notes and obligations, weighted average interest rate of 51⁄2%
at September 30, 2003 3,810 7,652
201,871 943,392
Less current maturities 13,400 72,852
Long-term debt $188,471 $870,540
In connection with the acquisition of VARTA on October 1, 2002, the Company entered into an Amended and Restated Credit
Agreement (“Third Restated Agreement”). The Third Restated Agreement provides for senior bank facilities, including term and
revolving credit facilities in an initial aggregate amount (assuming an exchange rate of the Euro to the Dollar of 1 to 1) of approxi-
mately $625,000. The Third Restated Agreement includes a $100,000 six year revolving credit facility, a €50,000 six year revolving
credit facility, a $300,000 seven year amortizing term loan, a €125,000 seven year amortizing term loan and a €50,000 six year amor-
tizing term loan.
Notes to Consolidated Financial StatementsRayovac Corporation and Subsidiaries
(In thousands, except per share amounts)
The interest on Dollar-denominated borrowings is computed, at the Company’s option, based on the base rate, as defined (“Base
Rate”), or the London Interbank Offered Rate (“LIBOR”) for Dollar-denominated deposits. The Interest on Euro-denominated
borrowings is computed on LIBOR for Euro-denominated deposits. The fees associated with these facilities were capitalized and are
being amortized over the term of the facilities. Indebtedness under these facilities is secured by substantially all of the assets of the
Company, is guaranteed by certain of our subsidiaries and the Euro-denominated revolving facility is subject to a borrowing base
(“Borrowing Base”) of certain European assets.
The Third Restated Agreement required the Company to transform the German subsidiary, VARTA Geratebatterie, from a GmbH
legal structure to a KgaA legal structure (“Transformation”) on or before December 30, 2002. Effective January 29, 2003, the agree-
ment was amended (“First Amendment”) to extend the deadline for Transformation to on or before June 30, 2003. Effective June 27,
2003, the Third Restated Agreement was amended (“Second Amendment”) (i) to re-define and permit acceleration, recording,
and incurrence of certain Restructuring Charges, as defined in the Third Restated Agreement, (ii) to extend the deadline for
Transformation to on or before March 31, 2004 and (iii) to consent to certain organizational restructurings (“Restructurings”),
including releases and substitutions of collateral pledges, and disregarding application of certain basket amounts as necessary to
effect the Restructurings.
In connection with the acquisition of Remington, the Third Restated Agreement was amended (“Third Amendment”) effective
September 30, 2003 to (i) permit the Remington acquisition (“Acquisition”) including issuance of $350,000 of senior subordinated
debt, increase the Dollar-denominated revolver by $20,000, decrease the Euro-denominated revolver by €10,000 and increase the
Dollar-denominated seven-year term facility by $50,000, (ii) permit incurrence of certain Restructuring Charges related to the
Acquisition, (iii) amend certain covenant ratios to allow for the effect of financing of the Acquisition, (iv) allow for organizational
restructurings related to the Acquisition including necessary releases and substitutions of collateral pledges, and (v) increase certain
covenant basket amounts to allow for operation of the resulting larger business entity.
The term facilities, as amended in the Third Amendment, provide for quarterly amortization over their remaining terms (using the
September 30, 2003 exchange rate of the Dollar to the Euro of 1.16618 to 1) totaling approximately $6,818 in 2004, $16,276 in 2005,
2006 and 2007, $66,441 in 2008 and $383,543 in 2009. The term facility also provides for annual prepayments, over and above the
normal amortization. Such payments would be a portion of “Excess Cash Flow” (EBITDA, as defined, plus non-cash Restructuring
Charges, less certain operating expenditures including scheduled principal payments of long-term debt). The quarterly amortization
is reduced pro-rata for the effect of prepayments made as a result of Excess Cash Flow.
Interest on Dollar-denominated revolving borrowings is, at the Company’s option, at the Base Rate plus a margin (1.25% to 2.50%) per
annum (N/A at September 30, 2003) or Dollar-denominated LIBOR plus a margin (2.25% to 3.50%) per annum (N/A at September
30, 2003). Interest on Euro-denominated revolving borrowings and the Euro-denominated six-year term loan is Euro-denominated
LIBOR plus a margin (2.25% to 3.50%) per annum (5.62% at September 30, 2003). Interest on the Dollar-denominated seven-year
term loan is, at the Company’s option, at the Base Rate plus a fixed 2.75% margin per annum (N/A at September 30, 2003) or Dollar-
denominated LIBOR plus a fixed 3.75% margin per annum (4.87% at September 30, 2003). Interest on the Euro-denominated seven-
year term loan is Euro-denominated LIBOR plus a fixed 3.75% margin per annum (5.87% at September 30, 2003). The Company is
required to pay a commitment fee of 0.50% per annum on the average daily-unused portion of the revolving facilities. A fee (2.25%
to 3.50%) per annum (3.50% at September 30, 2003) is payable on the outstanding letters of credit, of which $6,005 were outstanding
at September 30, 2003. The Company also incurs a fee of 0.25% per annum of the average daily maximum amount available to be
drawn on each letter of credit issued. The margin on the revolving facilities, six-year amortizing term loan, and fees on outstanding
letters of credit may be adjusted if the Company’s leverage ratio, as defined, increases or decreases.
The Third Restated Agreement contains financial covenants with respect to borrowings, which include maintaining minimum
interest and fixed charge and maximum leverage ratios. In accordance with the Agreement, the limits imposed by such ratios
became more restrictive over time. In addition, the Third Restated Agreement restricts the Company’s ability to incur additional
indebtedness, create liens, make investments or specified payments, give guarantees, pay dividends, make capital expenditures, and
merge or acquire or sell assets.
Notes to Consolidated Financial StatementsRayovac Corporation and Subsidiaries
(In thousands, except per share amounts)
Page 44/45

Also in connection with the acquisition of Remington, the Company completed a debt offering of $350,000 of 8.5% Senior Subordi-
nated Notes due in 2013. The terms of the notes permit the holders to require the Company to repurchase all or a portion of the
notes in the event of a change of control. In addition, the terms of the notes restrict or limit the ability of the Company and its sub-
sidiaries to, among other things: (i) pay dividends or make other restricted payments, (ii) incur additional indebtedness and issue
preferred stock, (iii) create liens, (iv) incur dividend and other restrictions affecting subsidiaries, (v) enter into mergers, consolida-
tions, or sales of all or substantially all of the assets of the Company, (vi) make asset sales, (vii) enter into transactions with affiliates,
and (viii) issue or sell capital stock of wholly owned subsidiaries of the Company. Payment obligations of the notes are fully and
unconditionally guaranteed on a joint and several basis by all of the Company’s domestic subsidiaries, including ROV Holding, Inc.
The foreign subsidiaries of the Company, which do not guarantee the payment obligations under the notes, are directly and wholly
owned by ROV Holding, Inc.
Also in connection with the acquisition of Remington, the Company assumed $180,000 of 11.0% Senior Series B and D Subordinated
Debentures due in 2006. Effective September 30, 2003, $123,990 of the notes were tendered and redeemed leaving $56,010 outstand-
ing. In connection with the tender process, the Company received consents sufficient to substantially amend the indenture relating
to the notes. The amendments became effective with the Acquisition. The $56,010 of notes outstanding at September 30, 2003, were
called for redemption, effective September 30, 2003, and redeemed effective October 29, 2003, and consequently are reflected as
current obligations in our Consolidated Balance Sheet as of September 30, 2003.
The aggregate scheduled maturities of debt as of September 30, 2003 are as follows:
2004 $ 72,852
2005 17,771
2006 17,486
2007 17,353
2008 67,514
2009 and thereafter 750,416
$943,392
The carrying value of the debt instruments noted above are approximately 99% of their estimated fair value.
Aggregate capitalized lease obligations are payable in installments of $2,381 in 2004, $1,486 in 2005, $1,210 in 2006, $1,077 in 2007,
$1,073 in 2008, and $16,873 thereafter.
(7) SHAREHOLDERS’ EQUITY
On October 1, 2000, the Company granted approximately 277 shares of restricted stock to certain members of management. The
total market value of the restricted shares on date of grant was approximately $4,746 which was recorded as unearned compensation
as a separate component of shareholders’ equity. During 2002, the Company recognized the forfeiture of approximately 24 restricted
shares of stock. The total market value on the date of grant for the forfeited shares was approximately $413 which was recorded as
an adjustment to unearned compensation. Approximately 186 of these shares vested on September 30, 2003 as the recipients were
still employed by the Company. The remaining 67 shares vested one third each year from the date of grant. Unearned compensa-
tion was amortized to expense over the three-year vesting period. As of September 30, 2003, all share restrictions for the October 1,
2000 grant have been removed.
On June 22, 2001, the Company completed a primary offering of 3,500 shares of Common stock. The net proceeds of approximately
$64,200 after deducting the underwriting discounts and offering expenses, were used to repurchase approximately $64,800 principal
amount of 10.25% Series B Senior Subordinated Notes.
Concurrently, the Thomas H. Lee Group and its affiliates sold approximately 4,200 shares and certain Rayovac officers and employees
sold approximately 900 shares in a secondary offering of Common stock. The Company did not receive any proceeds from the sales
of the secondary offering shares but incurred expenses for the offering of approximately $200, which are included in Restructuring
charges in Operating expenses in our Consolidated Statement of Operations.
Notes to Consolidated Financial StatementsRayovac Corporation and Subsidiaries
(In thousands, except per share amounts)

On August 16, 2002, the Company granted approximately 24 shares of restricted stock to a certain member of management. These
shares vested on September 30, 2003, as the recipient was still employed with the Company. The total market value of the restricted
shares on the date of grant was approximately $313 which was recorded as unearned compensation as a separate component of share-
holders’ equity. Unearned compensation was amortized over the 13-month vesting period.
On October 1, 2002, the Company granted approximately 393 shares of restricted stock to certain members of management. The
total market value of the restricted shares on date of grant was approximately $4,790 which was recorded as unearned compensa-
tion as a separate component of shareholders’ equity. During 2003, the Company recognized the forfeiture of approximately 28
restricted shares of stock. The total market value on the date of grant for the forfeited shares was approximately $347 which was
recorded as an adjustment to unearned compensation. Approximately 101 of these shares vest on September 30, 2004, 243 shares
vest on September 30, 2005, and 21 shares vest on September 30, 2006, if the recipient is still employed by the Company. Unearned
compensation is being amortized to expense over the appropriate vesting period.
(8) STOCK OPTION PLANS
In 1996, the Company’s Board of Directors (“Board”) approved the Rayovac Corporation 1996 Stock Option Plan (“1996 Plan”).
Under the 1996 Plan, stock options to acquire up to 2,318 shares of Common stock, in the aggregate, may be granted to select
employees and directors of the Company under either or both a time-vesting or a performance-vesting formula at an exercise
price equal to the market price of the Common stock on the date of grant. The time-vesting options become exercisable primarily
in equal 20% increments over a five-year period. The performance-vesting options become exercisable at the end of ten years with
accelerated vesting over each of the first five years if the Company achieves certain performance goals. Accelerated vesting may
occur upon sale of the Company, as defined in the 1996 Plan. As of September 30, 2003, there were options with respect to 1,186
shares of Common stock outstanding under the 1996 Plan.
In 1997, the Board adopted the 1997 Rayovac Incentive Plan (“Incentive Plan”). The Incentive Plan replaces the 1996 Plan and no
further awards will be granted under the 1996 Plan other than awards of options for shares up to an amount equal to the number
of shares covered by options that terminate or expire prior to being exercised. Under the Incentive Plan, the Company may grant to
employees and non-employee directors stock options, stock appreciation rights (“SARs”), restricted stock, and other stock-based
awards, as well as cash-based annual and long-term incentive awards. Accelerated vesting will occur in the event of a change in con-
trol, as defined in the Incentive Plan. Up to 5,000 shares of Common stock may be issued under the Incentive Plan. The Incentive
Plan expires in August 2007. As of September 30, 2003, there were options with respect to 3,737 shares of Common stock outstanding
under the Incentive Plan.
A summary of the status of the Company’s plans is as follows:
2001 2002 2003
Weighted-Average Weighted-Average Weighted-Average
Options Exercise Price Options Exercise Price Options Exercise Price
Outstanding, beginning of period 3,276 $12.15 3,266 $14.12 4,105 $14.01
Granted 857 14.83 1,057 14.37 1,210 12.31
Exercised (701) 4.75 (15) 8.81 (40) 4.39
Forfeited (166) 18.43 (203) 11.30 (352) 15.73
Outstanding, end of period 3,266 $14.12 4,105 $14.01 4,923 $13.55
Options exercisable, end of period 1,304 $11.81 1,884 $11.39 2,553 $12.91
The Company also granted approximately 277, 24, and 393 shares of restricted stock during 2001, 2002, and 2003, respectively, under
the Incentive Plan. The restrictions on the 2001 grant lapsed over the three-year period ended September 30, 2003 and the restrictions
on the 2002 grant lapsed over the two-year period ended September 30, 2003. The restrictions on the 2003 grant lapse over the four-
year period ending September 30, 2006. As of September 30, 2003, the restrictions had lapsed on 277 of these shares and the Company
recognized the forfeiture of 52 of these shares.
Notes to Consolidated Financial StatementsRayovac Corporation and Subsidiaries
(In thousands, except per share amounts)
Page 46/47

The following table summarizes information about options outstanding and outstanding and exercisable as of September 30, 2003:
Options Outstanding Options Outstanding and Exercisable
Weighted-Average
Range of Number Remaining Weighted-Average Number Weighted-Average
Exercise Prices of Shares Contractual Life Exercise Price of Shares Exercise Price
$ 4.39 969 3.1 years $ 4.39 969 $ 4.39
$11.32–$20.94 3,211 7.8 14.29 1,037 15.93
$21.25–$29.50 743 5.6 22.26 547 22.30
(9) INCOME TAXES
Pretax income (income before income taxes) and income tax expense consist of the following:
2001 2002 2003
Pretax income (loss):
United States $ 5,073 $47,288 $(52,456)
Outside the United States 12,426 (1,605) 75,491
Total pretax income $17,499 $45,683 $ 23,035
Income tax expense (benefit):
Current:
Federal $ 3,614 $10,484 $ (8,817)
Foreign 6,217 895 25,697
State (115) 204 206
Total current 9,716 11,583 17,086
Deferred:
Federal (1,977) 6,666 2,165
Foreign (1,638) (2,374) (9,356)
State (136) 571 (2,342)
Total deferred (3,751) 4,863 (9,533)
$ 5,965 $16,446 $ 7,553
The following reconciles the Federal statutory income tax rate with the Company’s effective tax rate:
2001 2002 2003
Statutory federal income tax rate 35.0% 35.0% 35.0%
Foreign Sales Corporation/Extraterritorial Income
Exclusion benefit (2.1) (0.6) (1.5)
Non US permanent items 2.2 (0.5) 7.0
Foreign rate vs. statutory rate (1.0) 0.4 6.6
State income taxes and other 0.5 1.5 (6.0)
R&D credit, current and prior years — — (7.2)
Non deductible interest expense — — 5.7
Adjustment of prior year taxes (0.6) (0.5) (7.5)
Other 0.1 0.7 0.7
34.1% 36.0% 32.8%
Notes to Consolidated Financial StatementsRayovac Corporation and Subsidiaries
(In thousands, except per share amounts)

The tax effects of temporary differences, which give rise to significant portions of the deferred tax assets and deferred tax liabilities
are as follows:September 30,
2002 2003
Current deferred tax assets:
Employee benefits $ 970 $ 6,895
Restructuring and asset impairments 212 911
Inventories and receivables 2,105 7,917
Marketing and promotional accruals 351 185
Net operating loss carry forwards 1,861 4,432
Currency hedges 1,370 40
Other 1,717 6,833
Valuation allowance — (201)
Total current deferred tax assets 8,586 27,012
Current deferred tax liabilities:
Property, plant and equipment held for sale — (3,896)
Inventory — (4,597)
Other — (18)
Total current deferred tax liabilities — (8,511)
Net current deferred tax assets $ 8,586 $ 18,501
Noncurrent deferred tax assets:
Employee benefits $ 5,103 $ 9,724
Net operating loss and credit carry forwards 4,163 13,233
Property, plant and equipment 147 2,170
Other 2,930 9,752
Valuation allowance — (3,843)
Total noncurrent deferred tax assets 12,343 31,036
Noncurrent deferred tax liabilities:
Property, plant, and equipment (12,954) (9,458)
Intangibles (4,488) (11,123)
Employee benefits (2,200) —
Other (1,315) (2,113)
Total noncurrent deferred tax liabilities (20,957) (22,694)
Net noncurrent deferred tax (liabilities) assets $ (8,614) $ 8,342
Undistributed earnings of the Company’s foreign operations amounting to approximately $30,881 and $79,827 at September 30, 2002
and 2003, respectively, are intended to remain permanently invested to finance future growth and expansion. Accordingly, no U.S.
income taxes have been provided on those earnings at September 30, 2002 and 2003.
The Company, as of September 30, 2003, has state net operating loss carryforwards of approximately $30,033 which will expire
between 2008 and 2018. The Company has foreign net operating loss carryforwards, primarily relating to the Company’s Mexico
operations, of approximately $31,793, which will expire between 2006 and 2013. At September 30, 2003, the Company has recorded
a deferred tax asset for the benefit of these losses.
Notes to Consolidated Financial StatementsRayovac Corporation and Subsidiaries
(In thousands, except per share amounts)
Page 48/49

A valuation allowance is recorded when it is more likely than not that some portion or all of the deferred tax assets will not be
realized. The ultimate realization of the deferred tax assets depends on the ability to generate sufficient taxable income of the appro-
priate character in the future and in the appropriate taxing jurisdictions. For the year ended September 30, 2003, the Company has
established a valuation allowance for operating loss carryforwards in certain non-U.S. jurisdictions in the amount of $366.
As part of the Remington acquisition, the Company acquired foreign subsidiaries with foreign operating loss carryforwards of
approximately $18,408. A valuation allowance has been established for the deferred income tax benefits related to certain Remington
foreign subsidiary loss carryforwards that may not be realized in the amount of approximately $3,678.
(10) LEASES
Future minimum rental commitments under non-cancelable leases, principally pertaining to land, buildings and equipment,
are as follows:Operating Leases Capital Leases
2004 $14,395 $ 3,587
2005 12,154 2,642
2006 9,681 2,311
2007 7,864 2,122
2008 6,760 2,060
Thereafter 34,386 24,190
Total minimum lease payments $85,240 $36,912
Less: amount representing interest 12,812
Present value of minimum lease payments $24,100
Of the annual lease payments shown above, $4,122 are subject to inflationary increases each year. All of the leases expire during the
years 2004 through 2013.
Total rental expenses were $7,137, $7,341 and $12,315 for 2001, 2002 and 2003, respectively.
(11) EMPLOYEE BENEFIT PLANS
Pension Benefits The Company has various defined benefit pension plans covering substantially all of its employees in the United
States and certain employees in other countries. Plans generally provide benefits of stated amounts for each year of service. The
Company’s practice is to fund pension costs at amounts within the acceptable ranges established by the Employee Retirement
Income Security Act of 1974, as amended.
The Company also sponsors or participates in a number of other non-U.S. pension arrangements, including various retirement and
termination benefit plans, some of which are covered by local law or coordinated with government-sponsored plans, which are not
significant in the aggregate and therefore are not included in the information presented below.
The Company also has various nonqualified deferred compensation agreements with certain of its employees. Under certain agree-
ments, the Company has agreed to pay certain amounts annually for the first 15 years subsequent to retirement or to a designated
beneficiary upon death. It is management’s intent that life insurance contracts owned by the Company will fund these agreements.
Under the other agreements, the Company has agreed to pay such deferral amounts in up to 15 annual installments beginning on
a date specified by the employee, subsequent to retirement or disability, or to a designated beneficiary upon death. The Company
established a rabbi trust to fund these agreements.
Notes to Consolidated Financial StatementsRayovac Corporation and Subsidiaries
(In thousands, except per share amounts)

Other Benefits The Company provides certain health care and life insurance benefits to eligible retired employees. Participants
earn retiree health care benefits after reaching age 45 over the next 10 succeeding years of service and remain eligible until reaching
age 65. The plan is contributory; retiree contributions have been established as a flat dollar amount with contribution rates expected
to increase at the active medical trend rate. The plan is unfunded. The Company is amortizing the transition obligation over a
20-year period.Pension and Deferred
Compensation Benefits Other Benefits
2002 2003 2002 2003
Change in benefit obligation
Benefit obligation, beginning of year $ 20,619 $ 23,754 $ 2,677 $ 3,076
Liabilities assumed with acquisitions — 40,719 — —
Service cost 693 1,537 299 285
Interest cost 1,512 3,599 188 207
Amendments 677 — (20) —
Actuarial loss (gain) 1,132 4,729 (41) 28
Loss (gain) on curtailment — — — (385)
Benefits paid (879) (2,547) (27) (169)
Foreign currency exchange rate changes — 5,832 — —
Benefit obligation, end of year $ 23,754 $ 77,623 $ 3,076 $ 3,042
Change in plan assets
Fair value of plan assets, beginning of year $ 12,316 $ 11,494 $ — $ —
Assets acquired with acquisitions — 14,755 — —
Actual return on plan assets (1,279) 1,404 — —
Employer contributions 1,414 4,399 27 169
Employee contributions — 41 — —
Benefits paid (879) (1,650) (27) (169)
Plan expenses paid (78) (77) — —
Foreign currency exchange rate changes — 1,739 — —
Fair value of plan assets, end of year $ 11,494 $ 32,105 $ — $ —
Funded status $(12,260) $(45,518) $(3,076) $(3,042)
Unrecognized net transition obligation 168 121 309 246
Unrecognized prior service cost 3,278 2,281 — —
Unrecognized net actuarial loss (gain) 6,985 12,526 (161) (133)
Adjustment for minimum liability (10,435) (14,942) — —
Accrued benefit cost $(12,264) $(45,532) $(2,928) $(2,929)
Weighted-average assumptions:
Discount rate 7.0% 5.0%–6.0% 7.25% 6.0%
Expected return on plan assets 8.5% 4.0%–8.5% N.A. N.A.
Pension Benefits Other Benefits
2001 2002 2003 2001 2002 2003
Components of net periodic benefit cost
Service cost $ 616 $ 693 $ 1,537 $343 $299 $ 285
Interest cost 1,415 1,512 3,599 213 188 207
Actual return on assets 1,252 1,279 (1,404) — — —
Amortization of prior service cost 311 315 374 — — —
Loss/(gain) on curtailments — — 628 — — (354)
Recognized net actuarial (gain) loss (2,368) (2,433) (375) 61 32 32
Net periodic benefit cost $ 1,226 $ 1,366 $ 4,359 $617 $519 $ 170
Notes to Consolidated Financial StatementsRayovac Corporation and Subsidiaries
(In thousands, except per share amounts)
Page 50/51

Pension plan assets and obligations are measured at June 30 each year. The contributions to the pension plans between July 1 and
September 30 were $2,814 and $— in 2002 and 2003, respectively.
The Company has recorded an additional minimum pension liability of $10,435 and $14,942 at September 30, 2002 and 2003, respec-
tively, to recognize the under funded position of its benefit plans. An intangible asset of $3,446 and $2,405 at September 30, 2002 and
2003, respectively, equal to the unrecognized prior service cost of these plans, has also been recorded. The excess of the additional
minimum liability over the unrecognized prior service cost of $6,989 and $7,679 at September 30, 2002 and 2003, respectively, has
been recorded as a component of accumulated other comprehensive income, net of tax.
The Company sponsors a supplemental executive retirement plan for eligible employees. Currently, only our executive management
participate in the plan. Each October 1, we credit the account of each participant by an amount equal to 15% of the participant’s
salary. In addition, each quarter we credit each account by an amount equal to 2% of the participant’s account value. Each partici-
pant vests 20% per year in his account, with immediate full vesting occurring upon death, disability or a change in control of the
Company. As of September 30, 2002 and 2003, the Company had recorded an obligation of $929 and $1,812, respectively, related to
the plan. Participants will fully vest on September 30, 2005.
The Company sponsors a defined contribution pension plan for its domestic salaried employees, which allows participants to make
contributions by salary reduction pursuant to Section 401(k) of the Internal Revenue Code. The Company contributes annually
from 3% to 6% of participants’ compensation based on age, and may make additional discretionary contributions. The Company
also sponsors defined contribution pension plans for employees of certain foreign subsidiaries. Company contributions charged to
operations, including discretionary amounts, for 2001, 2002 and 2003 were $2,147, $1,804 and $1,729 respectively.
For measurement purposes, annual rates of increase of 8.0% in the per capita costs of covered health care benefits were assumed for
2001, with annual increases of 10.0% assumed for 2002 and 2003, gradually decreasing to 5.5% for 2001 and 5.25% for 2002 and 2003.
The health care cost trend rate assumption has a significant effect on the amounts reported. For example, increasing the assumed
health care cost trend rates by one percentage point in each year would increase the accumulated postretirement benefit obligation
as of September 30, 2003 by $176 and the aggregate of the service and interest cost components of net periodic postretirement benefit
cost for the year ended September 30, 2003 by $45. Decreasing the assumed health care cost trend rates by one percentage point in
each year would decrease the accumulated postretirement benefit obligation as of September 30, 2003 by $161 and the aggregate of
the service and interest cost components of net periodic postretirement benefit cost for the year ended September 30, 2003, by $40.
(12) SEGMENT INFORMATION
The Company manages operations in three reportable segments based upon geographic area. North America includes the United
States and Canada; Latin America includes Mexico, Central America, South America and the Caribbean; Europe/Rest of World
(“Europe/ROW”) includes the United Kingdom, continental Europe and all other countries in which the Company does business.
The Company, prior to the acquisition of Remington, manufactures and markets dry cell batteries including alkaline, zinc carbon,
alkaline rechargeable, hearing aid, and other specialty batteries and lighting products throughout the world. These product lines
are sold in all geographic areas. Latin America net sales have historically been derived primarily from zinc carbon and alkaline
batteries. With the acquisition of Remington, the Company also sells personal care products.
Net sales and cost of sales to other segments have been eliminated. The gross contribution of inter segment sales is included in the
segment selling the product to the external customer. Segment net sales are based upon the geographic area in which the product
is sold.
The reportable segment profits do not include interest expense, interest income, and income tax expense. Also not included in the
reportable segments are corporate expenses including corporate purchasing expense, general and administrative expense, certain
research and development expense, and restructuring charges. All depreciation and amortization included in income from operations
is related to reportable segments or corporate. Costs are identified to reportable segments or corporate, according to the function
of each cost center.
Notes to Consolidated Financial StatementsRayovac Corporation and Subsidiaries
(In thousands, except per share amounts)

The reportable segment assets do not include cash, deferred tax benefits, investments, long-term intercompany receivables, most
deferred charges, and miscellaneous assets. All capital expenditures are related to reportable segments. Variable allocations of assets
are not made for segment reporting.
Net sales from external customers 2001 2002 2003
Europe/ROW $ 48,719 $ 52,459 $ 421,143
North America 448,788 435,600 375,957
Latin America 118,665 84,677 125,022
Total segments $616,172 $572,736 $ 922,122
Inter segment net sales 2001 2002 2003
Europe/ROW $ 2,593 $ 2,504 $ 29,571
North America 30,634 34,069 32,298
Latin America 9,518 5,556 54
Total segments $ 42,745 $ 42,129 $ 61,923
Depreciation and amortization 2001 2002 2003
Europe/ROW $ 1,573 $ 715 $ 13,531
North America 14,174 15,407 15,464
Latin America 5,393 2,879 2,576
Total segments $ 21,140 $ 19,001 $ 31,571
Segment profit 2001 2002 2003
Europe/ROW $ 4,061 $ 5,087 $ 49,727
North America 80,774 85,490 64,829
Latin America 16,913 5,330 17,673
Total segments 101,748 95,907 132,229
Corporate expenses 25,072 31,676 40,035
Restructuring and related charges 22,307 1,210 32,552
Interest expense 27,189 16,048 37,182
Non-operating expense 8,587 — 3,072
Other expense (income), net 1,094 1,290 (3,647)
Income before income taxes $ 17,499 $ 45,683 $ 23,035
September 30,
Segment assets 2001 2002 2003
Europe/ROW $ 30,010 $ 31,356 $ 537,400
North America 289,215 256,446 625,463
Latin America 205,918 191,002 203,909
Total segments 525,143 478,804 1,366,772
Corporate 41,356 54,429 209,720
Total assets at year end $566,499 $533,233 $1,576,492
Expenditures for segment assets 2001 2002 2003
Europe/ROW $ 411 $ 969 $ 9,494
North America 17,521 13,158 14,607
Latin America 1,761 1,514 2,024
Total segments $ 19,693 $ 15,641 $ 26,125
Notes to Consolidated Financial StatementsRayovac Corporation and Subsidiaries
(In thousands, except per share amounts)
Page 52/53

Product line net sales 2001 2002 2003
Alkaline $302,900 $295,700 $454,900
Zinc carbon 139,100 96,500 152,500
Rechargeables 29,800 31,800 69,700
Hearing aid batteries 65,300 67,600 80,600
Specialty batteries 17,800 15,300 74,600
Lighting products 61,300 65,800 89,800
Total revenues from external customers $616,200 $572,700 $922,100
(13) COMMITMENTS AND CONTINGENCIES
In March 1998, the Company entered into an agreement to purchase certain equipment and to pay annual royalties. In connection
with this 1998 agreement, which supersedes previous agreements dated December 1991, and March 1994, the Company committed to
pay royalties of $2,000 in 1998 and 1999, $3,000 in 2000 through 2002, and $500 in each year thereafter, as long as the related equipment
patents are enforceable (until 2022). In December 2002, this agreement was modified such that royalty payments in 2003 through
2022 will be $250.
The Company has provided for the estimated costs associated with environmental remediation activities at some of its current and
former manufacturing sites. The Company believes that any additional liability in excess of the amounts provided of approximately
$5,500, which may result from resolution of these matters, will not have a material adverse effect on the financial condition, results
of operations, or cash flow of the Company.
The Company has certain other contingent liabilities with respect to litigation, claims and contractual agreements arising in the
ordinary course of business. Such litigation includes shareholder lawsuits, patent infringement claims by the Gillette Company and
its subsidiary Braun Gmbh, and a lawsuit alleging misleading advertising, filed by Norelco Consumer Products Company against the
Company’s subsidiary, Remington Products Company, L.L.C. In the opinion of management, it is either not likely or premature to
determine whether such contingent liabilities will have a material adverse effect on the financial condition, liquidity or cash flow of
the Company.
The suit filed against the Company by Eveready Battery Company was settled in December 2002, and the impact of such settlement
is included in results of operations for the year ended September 30, 2003. The net settlement, of $1.5 million, did not materially
impact the financial condition, results of operations, or cash flow of the Company.
(14) RELATED PARTY TRANSACTIONS
The Company and Thomas H. Lee Company (THL Co.) were parties to a Management Agreement pursuant to which the Company
engaged THL Co. to provide consulting and management advisory services for an initial period of five years through September
2001. The agreement was renewed for another year through 2002. The agreement was not renewed upon expiration in September
2002. The Company paid THL Co. aggregate fees and expenses of $473 and $364 for 2001 and 2002, respectively.
The Company has notes receivable from officers/shareholders in the amount of $4,205 and $3,605 at September 30, 2002 and 2003,
respectively, payable in fiscal 2005, which bear interest at 3.5%. Since the officers utilized the proceeds of the notes to purchase
common stock of the Company, directly or through the exercise of stock options, the notes have been recorded as a reduction of
shareholders’ equity.
Notes to Consolidated Financial StatementsRayovac Corporation and Subsidiaries
(In thousands, except per share amounts)

(15) RESTRUCTURING AND RELATED CHARGES
The Company reports restructuring charges relating to manufacturing and related initiatives in cost of goods sold. Restructuring
and related charges reflected in cost of goods sold include, but are not limited to, termination and related costs associated with
manufacturing employees, asset impairments relating to manufacturing initiatives, and other costs directly related to the restruc-
turing initiatives implemented.
The Company reports restructuring charges relating to administrative functions in operating expenses, such as, initiatives impact-
ing sales, marketing, distribution, or other non-manufacturing related functions. Restructuring and related charges reflected in
operating expenses include, but are not limited to, termination and related costs, any asset impairments relating to the functional
area described above, and other costs directly related to the initiatives implemented.
During 2001, the Company recorded restructuring and related charges related to: (i) an organizational restructuring in the U.S.,
(ii) manufacturing and distribution cost rationalization initiatives in the Company’s Tegucigalpa, Honduras and Mexico City, Mexico
manufacturing facilities and in our European operations, (iii) the closure of the Company’s Wonewoc, Wisconsin, manufacturing
facility, (iv) the rationalization of uneconomic manufacturing processes at the Company’s Fennimore, Wisconsin, manufacturing
facility, and rationalization of packaging operations and product lines, and (v) costs associated with our June 2001 secondary offer-
ing. The amount recorded includes $9,100 of employee termination benefits for approximately 570 employees, $9,900 of equipment,
inventory, and other asset write-offs, and $1,700 of other expenses, net of changes in estimates in 2002 and 2003. In 2003, the Company
revised its estimate, reducing restructuring and related costs, in cost of goods sold, by approximately $300 for the anticipated costs
to close its Wonewoc, Wisconsin facility. A summary of the 2001 restructuring activities follows:
Termination Other
2001 Restructuring Summary Benefits Costs Total
Expense accrued $ 5,000 $11,000 $16,000
Change in estimate 4,400 100 4,500
Expense as incurred 700 1,100 1,800
Cash expenditures (5,800) (1,300) (7,100)
Non cash charges — (9,300) (9,300)
Balance September 30, 2001 $ 4,300 $ 1,600 $ 5,900
Change in estimate (1,000) (300) (1,300)
Cash expenditures (3,100) — (3,100)
Non cash charges — (700) (700)
Balance September 30, 2002 200 600 800
Change in estimate — (300) (300)
Cash expenditures (200) (100) (300)
Balance September 30, 2003 $ — $ 200 $ 200
During 2002, the Company recorded restructuring and related charges related to: (i) the closure of the Company’s Santo Domingo,
Dominican Republic plant and transfer of production to the Company’s Guatemala City, Guatemala manufacturing facility, and
(ii) outsourcing a portion of the Company’s zinc carbon battery production previously manufactured at our Mexico City, Mexico
manufacturing facility. The amount recorded includes approximately $1,200 of employee termination benefits for approximately
115 manufacturing employees, $900 of charges from the abandonment of equipment and inventory, net of a change in estimate of
$400, associated with the closing of the manufacturing facility, and $300 of other expenses. The change in estimate reflected our
ability to utilize more inventory and manufacturing equipment at our Guatemala City, Guatemala manufacturing location than
Notes to Consolidated Financial StatementsRayovac Corporation and Subsidiaries
(In thousands, except per share amounts)
Page 54/55

we originally anticipated. All activities associated with the 2002 restructuring activities have been completed. A summary of the
2002 restructuring activities follows:Termination Other
2002 Restructuring Summary Benefits Costs Total
Expense accrued $ 1,200 $ 1,400 $ 2,600
Change in estimate — (400) (400)
Expense as incurred — 200 200
Cash expenditures (1,100) (200) (1,300)
Non cash charges — (1,000) (1,000)
Balance September 30, 2002 100 — 100
Cash expenditures (100) — (100)
Balance September 30, 2003 $ — $ — $ —
During 2003, the Company recorded restructuring and related charges including: (i) approximately $13,000 of employee termination
benefits for approximately 650 notified employees and non cash costs of approximately $700 associated with the write-off of pension
intangible assets reflecting the curtailment of the Company’s Madison, Wisconsin packaging facility pension plan, (ii) approximately
$12,800 of equipment, inventory and other asset write-offs primarily reflecting the abandonment of equipment and inventory asso-
ciated with the closure of the Mexico City, Mexico plant and inventory and fixed asset impairments related to the closure of the
Company’s Wisconsin packaging and distribution locations, (iii) approximately $6,400 of other expenses which include, distributor
termination costs of approximately $900, research and development contract termination costs of approximately $500, and other
legal and facility shutdown expenses of approximately $5,000.
During 2003, restructuring and related charges include amounts related to: (i) the closure in October 2002 of the Company’s Mexico
City, Mexico plant and integration of production into the Company’s Guatemala City, Guatemala manufacturing location, resulting
in charges of approximately $6,200, including termination payments of approximately $1,400, fixed asset and inventory impairments
of approximately $4,300, and other shutdown related expenses of approximately $500, (ii) the closure of operations at the Company’s
Madison, Wisconsin packaging facility and Middleton, Wisconsin distribution center and combination of the two operations into a
new leased complex currently being built in Dixon, Illinois resulting in charges of approximately $13,800, including termination
costs of approximately $2,700 and non cash costs of approximately $700 associated with the write-off of pension intangible assets
reflecting the curtailment of the Company’s Madison, Wisconsin packaging facility pension plan, fixed asset and inventory impair-
ments of approximately $7,200, and relocation expenses and other shutdown related expenses of approximately $3,200, and (iii) a
series of restructuring initiatives impacting the Company’s sales, marketing, operations and administrative functions in Europe,
North America, and Latin America resulting in charges of approximately $12,900, including termination benefits of approximately
$8,900, inventory and asset impairments of approximately $1,300, distributor termination costs of approximately $900, research and
development contract termination costs of approximately $500, and other costs primarily reflecting legal and other expenses of
approximately $1,300.
During 2003, restructuring and related charges included in cost of goods sold of approximately $21,400 include amounts related
to: (i) the closure in October 2002 of the Company’s Mexico City, Mexico plant and integration of production into the Company’s
Guatemala City, Guatemala manufacturing location, resulting in charges of approximately $6,200, including termination payments
of approximately $1,400, fixed asset and inventory impairments of approximately $4,300, and other shutdown related expenses of
approximately $500, (ii) the closure of operations at the Company’s Madison, Wisconsin packaging facility and combination with
the Company’s Middleton, Wisconsin distribution center into a new leased complex in Dixon, Illinois resulting in charges of approx-
imately $12,400, including termination costs of approximately $2,400 and non cash pension curtailment costs of approximately $700,
fixed asset and inventory impairments of approximately $6,900, and relocation expenses and other shutdown related expenses of
approximately $2,400, and (iii) a series of restructuring initiatives impacting the Company’s manufacturing functions in Europe,
North America, and Latin America resulting in charges of approximately $2,800, including termination benefits of approximately
$1,800 and inventory and asset impairments of approximately $1,000.
Notes to Consolidated Financial StatementsRayovac Corporation and Subsidiaries
(In thousands, except per share amounts)

During 2003, restructuring and related charges included in operating expenses of approximately $11,500 include amounts related
to: (i) the closure of operations at the Company’s Middleton, Wisconsin distribution center and combination with our Madison,
Wisconsin packaging facility into a new leased complex in Dixon, Illinois resulting in charges of approximately $1,400, including
termination costs of approximately $300, fixed asset impairments of approximately $300, and relocation expenses and other shut-
down related expenses of approximately $800, and (ii) a series of restructuring initiatives impacting the Company’s sales, marketing,
and administrative functions in Europe, North America, and Latin America resulting in charges of approximately $10,100, including
termination costs of approximately $7,100, distributor termination costs of approximately $900, research and development contract
termination costs of approximately $500, fixed asset impairments of $300, and legal and other expenses of approximately $1,300.
The move to the new combined distribution and packaging facility was completed in the third quarter of 2003 and the closure of
the Madison, Wisconsin and Middleton, Wisconsin facilities occurred in the fourth quarter of 2003. The sales, marketing, operations
and administrative restructuring initiatives were completed during the fourth quarter of 2003.
All activities associated with the 2003 restructuring activities have been completed, and the remaining cash payments and the
disposition of impaired assets are expected to be substantially complete by September 30, 2004.
The Company has reflected the carrying value of its Mexico City, Mexico manufacturing plant and the Company’s Madison,
Wisconsin packaging facility as assets held for sale. The carrying value of assets held for sale relating to restructuring initiatives
is $8,680 and is included in Prepaid expenses and other in the Company’s Consolidated Balance Sheet at September 30, 2003.
Termination Other
2003 Restructuring Summary Benefits Costs Total
Expense accrued $ 9,800 $15,600 $ 25,400
Expense as incurred 3,200 4,300 7,500
Cash expenditures (9,800) (4,500) (14,300)
Non cash charges — (9,400) (9,400)
Balance September 30, 2003 $ 3,200 $ 6,000 $ 9,200
(16) ACQUISITIONS AND DIVESTITURES
In 2002, the Company entered into agreements with a Hong Kong company for the cordless product line and licensing agreements
on other product lines not currently sold by the Company. The Company received promissory notes in the amount of $800 payable
over terms of up to five years. The Company will receive variable royalties on sales of product lines licensed. As a result of these
transactions, the Company recognized a pretax gain of $701.
On October 1, 2002, the Company acquired substantially all of the consumer battery business of VARTA AG. The acquisition con-
sisted of the purchase of all of VARTA AG’s consumer battery subsidiaries and business outside of Germany, excluding Brazil, and a
controlling ownership and management interest in a new joint venture entity that will operate the VARTA AG consumer battery
business in Germany. The residual interest in the joint venture is held by VARTA AG. With the acquisition of VARTA, the Company
became a truly global battery manufacturer and marketer and acquired additional low-cost manufacturing capacity and battery
technology. As a result of the acquisition of the VARTA AG consumer battery business, the Company is now selling in more than
100 countries and is one of the largest consumer battery companies in the world.
The results of VARTA’s operations, since the acquisition on October 1, 2002, are included in the Company’s Statement of Operations
for the year ended September 30, 2003.
Notes to Consolidated Financial StatementsRayovac Corporation and Subsidiaries
(In thousands, except per share amounts)
Page 56/57

The aggregate cash purchase price was approximately $275,300, which includes approximately $7,600 of acquisition related expendi-
tures. The following table summarizes the fair value of the assets acquired and liabilities assumed as of the date of the acquisition.
As of October 1, 2002 (in 000’s)
Current assets $168,000
Property, plant, and equipment 52,400
Intangible assets 140,200
Goodwill 75,100
Other assets 2,700
Total assets acquired $438,400
Current liabilities $ 90,700
Long-term liabilities 72,400
Total liabilities assumed $163,100
Net assets acquired $275,300
Of the approximately $140,200 of acquired intangible assets, approximately $128,600 was assigned to registered trademarks which are
not subject to amortization. The remaining acquired intangible assets of approximately $11,600 have a weighted-average useful life
of approximately 18 years. The intangibles comprising the $11,600 of amortizable intangible assets include a manufacturing technol-
ogy asset of approximately $9,900 (nineteen-year weighted-average useful life) and a customer list intangible asset of approximately
$1,700 (ten-year average useful life). The goodwill of approximately $75,100 was assigned to the North America, Latin America, and
Europe/ROW segments in the amounts of approximately $1,400, $11,200, and $62,500, respectively. Of the approximately $75,100 of
goodwill, none is expected to be deductible for tax purposes.
On September 30, 2003, the Company acquired all of the equity interests of Remington Products Company, L.L.C. Remington is a
leading consumer products company focusing on the development and marketing of personal care products. Remington designs
and distributes electric shavers and accessories, grooming products, hair care appliances and other small electrical consumer products.
The Company’s results of operations for the year ended September 30, 2003 do not include the impacts of the Remington transaction,
as the transaction took place after the close of business on September 30, 2003.
The cash purchase price was approximately $174,000, which includes approximately $9,000 of acquisition related expenditures, and
the Company assumed Remington’s debt of approximately $180,400. The following table summarizes the fair value of the assets
acquired and liabilities assumed as of the date of the acquisition. The Company is in the process of obtaining third-party valuations
of certain tangible and intangible assets; thus the allocation of the purchase price is subject to change.
As of September 30, 2003 (in 000’s)
Current assets $167,000
Property, plant, and equipment 6,700
Intangible assets —
Goodwill 283,000
Other assets 8,100
Total assets acquired $464,800
Current liabilities $105,900
Long-term liabilities 184,900
Total liabilities assumed $290,800
Net assets acquired $174,000
The goodwill of approximately $283,000 was assigned to the North America segment and will be subject to change, pending the
completion of the third-party valuations of certain tangible and intangible assets. Of the approximately $283,000 of goodwill, a
portion is expected to be deductible for tax purposes. The amount deductible is not available at the time of these filings and will
be available upon the completion of the third-party valuations.
Supplemental Pro Forma Information (unaudited): The following reflects the Company’s unaudited pro forma results had the
results of the VARTA and Remington acquisitions been included in our results of operations in 2002 and 2003. The VARTA pro
forma adjustments reflect the results of operations and related pro forma adjustments for the year ended September 30, 2002 and
Notes to Consolidated Financial StatementsRayovac Corporation and Subsidiaries
(In thousands, except per share amounts)

the Remington pro forma adjustments for 2002 reflect the results of operations and related pro forma adjustments for the year
ending December 31, 2002 and for 2003 reflect the results of operation and related pro forma adjustments for the year ending
June 30, 2003.2002 2003
Net Sales
Reported net sales $ 572,736 $ 922,122
VARTA pro forma adjustments 370,506 —
Remington pro forma adjustments 365,061 360,259
Pro forma net sales $1,308,303 $1,282,381
Net Income
Reported net income $ 29,237 $ 15,482
VARTA pro forma adjustments (2,657) —
Remington pro forma adjustments 5,688 8,613
Pro forma net income $ 32,268 $ 24,095
Basic Earnings Per Share
Reported net income $ 0.92 $ 0.49
VARTA pro forma adjustments (0.08) —
Remington pro forma adjustments 0.18 0.27
Pro forma net income $ 1.02 $ 0.76
Diluted Earnings Per Share
Reported net income $ 0.90 $ 0.48
VARTA pro forma adjustments (0.08) —
Remington pro forma adjustments 0.18 0.26
Pro forma net income $ 1.00 $ 0.74
(17) QUARTERLY RESULTS (UNAUDITED)Quarter Ended
December 29, March 30, June 29, September 30,
2002 2003 2003 2003
Net sales $260,222 $202,267 $207,673 $251,960
Gross profit 93,554 79,625 79,747 98,617
Net (loss) income (585) 282 2,869 12,916
Basic net (loss) income per common share (0.02) 0.01 0.09 0.40
Diluted net (loss) income per common share (0.02) 0.01 0.09 0.39
Quarter Ended
December 30, March 31, June 30, September 30,
2001 2002 2002 2002
Net sales $ 161,883 $ 121,153 $ 135,412 $ 154,288
Gross profit 62,732 49,934 54,401 70,312
Net income 402 5,380 10,314 13,141
Basic net income per common share 0.01 0.17 0.32 0.41
Diluted net income per common share 0.01 0.17 0.32 0.41
(18) CONDENSED CONSOLIDATING FINANCIAL STATEMENTS
The following condensed consolidating financial data illustrates the composition of the consolidated financial statements. Investments
in subsidiaries are accounted for using the equity method for purposes of the consolidating presentation. Earnings of subsidiaries
are therefore reflected in the Company’s and Guarantor Subsidiaries’ investment accounts and earnings. The principal elimination
entries eliminate investments in subsidiaries and intercompany balances and transactions. Separate financial statements of the
Guarantor Subsidiaries are not presented because management has determined that such financial statements would not be material
to investors.
Notes to Consolidated Financial StatementsRayovac Corporation and Subsidiaries
(In thousands, except per share amounts)
Page 58/59
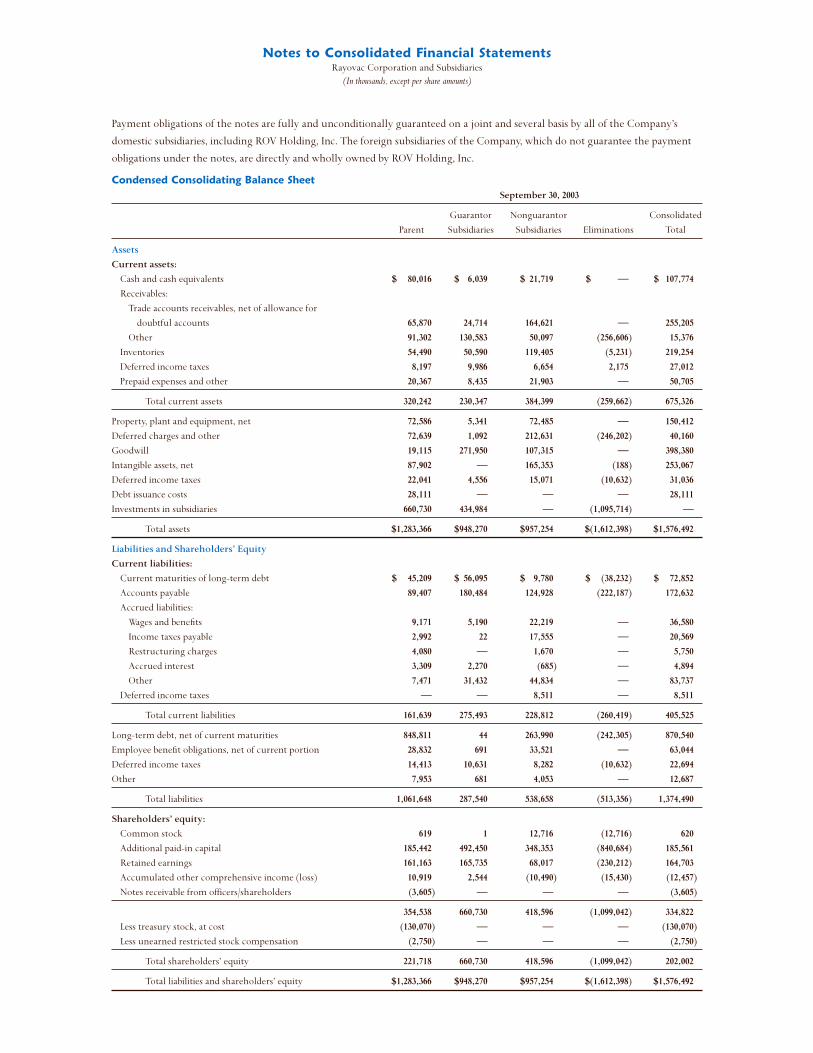
Payment obligations of the notes are fully and unconditionally guaranteed on a joint and several basis by all of the Company’s
domestic subsidiaries, including ROV Holding, Inc. The foreign subsidiaries of the Company, which do not guarantee the payment
obligations under the notes, are directly and wholly owned by ROV Holding, Inc.
Condensed Consolidating Balance Sheet
September 30, 2003
Guarantor Nonguarantor Consolidated
Parent Subsidiaries Subsidiaries Eliminations Total
Assets
Current assets:
Cash and cash equivalents $ 80,016 $ 6,039 $ 21,719 $ — $ 107,774
Receivables:
Trade accounts receivables, net of allowance for
doubtful accounts 65,870 24,714 164,621 — 255,205
Other 91,302 130,583 50,097 (256,606) 15,376
Inventories 54,490 50,590 119,405 (5,231) 219,254
Deferred income taxes 8,197 9,986 6,654 2,175 27,012
Prepaid expenses and other 20,367 8,435 21,903 — 50,705
Total current assets 320,242 230,347 384,399 (259,662) 675,326
Property, plant and equipment, net 72,586 5,341 72,485 — 150,412
Deferred charges and other 72,639 1,092 212,631 (246,202) 40,160
Goodwill 19,115 271,950 107,315 — 398,380
Intangible assets, net 87,902 — 165,353 (188) 253,067
Deferred income taxes 22,041 4,556 15,071 (10,632) 31,036
Debt issuance costs 28,111 — — — 28,111
Investments in subsidiaries 660,730 434,984 — (1,095,714) —
Total assets $1,283,366 $948,270 $957,254 $(1,612,398) $1,576,492
Liabilities and Shareholders’ Equity
Current liabilities:
Current maturities of long-term debt $ 45,209 $ 56,095 $ 9,780 $ (38,232) $ 72,852
Accounts payable 89,407 180,484 124,928 (222,187) 172,632
Accrued liabilities:
Wages and benefits 9,171 5,190 22,219 — 36,580
Income taxes payable 2,992 22 17,555 — 20,569
Restructuring charges 4,080 — 1,670 — 5,750
Accrued interest 3,309 2,270 (685) — 4,894
Other 7,471 31,432 44,834 — 83,737
Deferred income taxes — — 8,511 — 8,511
Total current liabilities 161,639 275,493 228,812 (260,419) 405,525
Long-term debt, net of current maturities 848,811 44 263,990 (242,305) 870,540
Employee benefit obligations, net of current portion 28,832 691 33,521 — 63,044
Deferred income taxes 14,413 10,631 8,282 (10,632) 22,694
Other 7,953 681 4,053 — 12,687
Total liabilities 1,061,648 287,540 538,658 (513,356) 1,374,490
Shareholders’ equity:
Common stock 619 1 12,716 (12,716) 620
Additional paid-in capital 185,442 492,450 348,353 (840,684) 185,561
Retained earnings 161,163 165,735 68,017 (230,212) 164,703
Accumulated other comprehensive income (loss) 10,919 2,544 (10,490) (15,430) (12,457)
Notes receivable from officers/shareholders (3,605) — — — (3,605)
354,538 660,730 418,596 (1,099,042) 334,822
Less treasury stock, at cost (130,070) — — — (130,070)
Less unearned restricted stock compensation (2,750) — — — (2,750)
Total shareholders’ equity 221,718 660,730 418,596 (1,099,042) 202,002
Total liabilities and shareholders’ equity $1,283,366 $948,270 $957,254 $(1,612,398) $1,576,492
Notes to Consolidated Financial StatementsRayovac Corporation and Subsidiaries
(In thousands, except per share amounts)

Condensed Consolidating Statement of Operations
Year Ended September 30, 2003
Guarantor Nonguarantor Consolidated
Parent Subsidiaries Subsidiaries Eliminations Total
Net sales $ 364,348 $ 41,562 $ 592,366 $ (76,154) $ 922,122
Cost of goods sold 209,121 40,314 373,495 (73,416) 549,514
Restructuring and related charges 12,497 — 8,568 — 21,065
Gross profit 142,730 1,248 210,303 (2,738) 351,543
Operating expenses:
Selling 70,205 818 114,506 (354) 185,175
General and administrative 51,077 (10,550) 40,348 — 80,875
Research and development 12,096 — 2,268 — 14,364
Restructuring and related charges 7,693 — 3,794 — 11,487
141,071 (9,732) 160,916 (354) 291,901
Income from operations 1,659 10,980 49,387 (2,384) 59,642
Interest expense 34,780 — 15,284 (12,882) 37,182
Equity income (57,423) (61,090) — 118,513 —
Non-operating expense 3,072 — — — 3,072
Other expense (income), net 28,236 (1,244) (43,771) 13,132 (3,647)
(Loss) income before income taxes (7,006) 73,314 77,874 (121,147) 23,035
Income tax (benefit) expense (22,236) 15,891 16,784 (2,886) 7,553
Net income $ 15,230 $ 57,423 $ 61,090 $(118,261) $ 15,482
Condensed Consolidating Statement of Cash Flows
Year Ended September 30, 2003
Guarantor Nonguarantor Consolidated
Parent Subsidiaries Subsidiaries Eliminations Total
Net cash (used) provided by operating activities $ 14,227 $ — $ 60,527 $ 1,453 $ 76,207
Cash flows from investing activities:
Purchases of property, plant and equipment (14,598) — (11,527) — (26,125)
Proceeds from sale of property, plant, and equipment — — 132 — 132
Payments for acquisitions, net of cash acquired (444,231) (237,853) (239,945) 501,626 (420,403)
Net cash (used) provided by investing activities (458,829) (237,853) (251,340) 501,626 (446,396)
Cash flows from financing activities:
Reduction of debt (431,592) — (2,240) — (433,832)
Proceeds from debt financing 1,059,821 — 2,759 — 1,062,580
Extinguishment of debt — (126,573) — — (126,573)
Debt issuance costs (29,933) — — — (29,933)
Payments of capital lease obligations (287) — (880) — (1,167)
(Advances related to) proceeds from intercompany transactions (107,525) 370,419 238,732 (501,626) —
Payments from officers/shareholders 600 — — — 600
Proceeds from exercise of stock options 176 — — — 176
Net cash provided (used) by financing activities 491,260 243,846 238,371 (501,626) 471,851
Effect of exchange rate changes on cash and cash equivalents 29,840 — (32,156) (1,453) (3,769)
Net increase in cash and cash equivalents 76,498 5,993 15,402 — 97,893
Cash and cash equivalents, beginning of period 3,518 46 6,317 — 9,881
Cash and cash equivalents, end of period $ 80,016 $ 6,039 $ 21,719 $ — $ 107,774
Notes to Consolidated Financial StatementsRayovac Corporation and Subsidiaries
(In thousands, except per share amounts)
Page 60/61
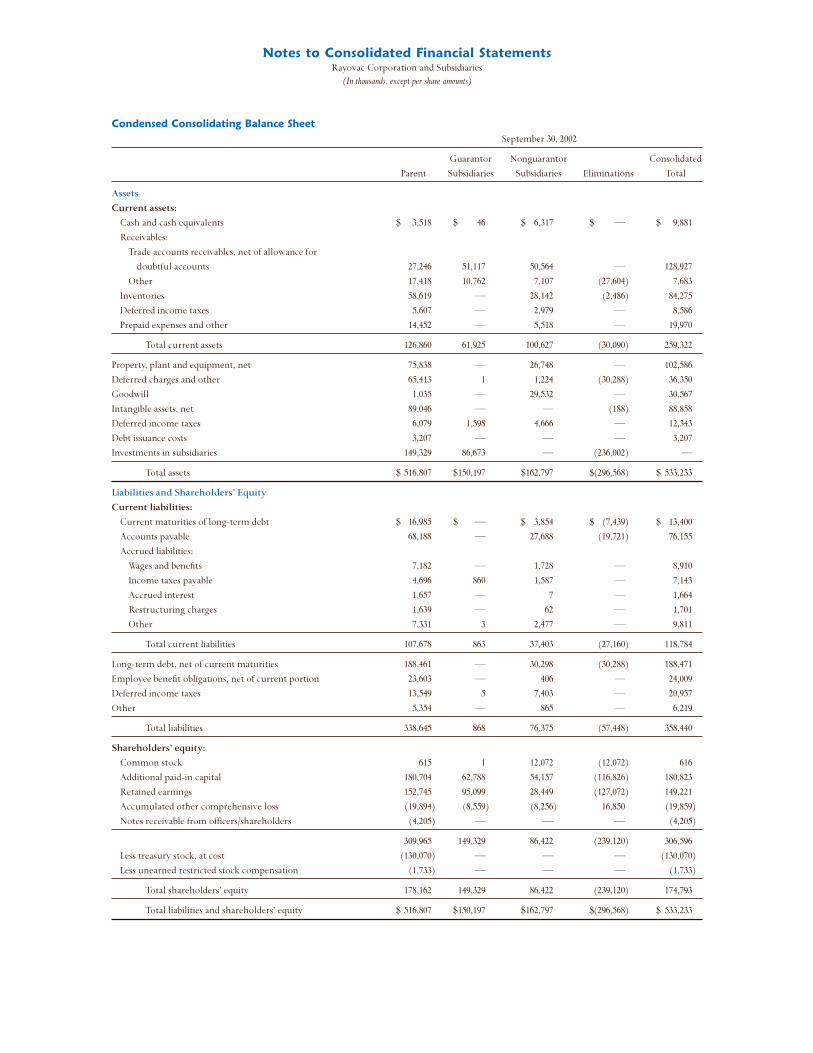
Condensed Consolidating Balance Sheet
September 30, 2002
Guarantor Nonguarantor Consolidated
Parent Subsidiaries Subsidiaries Eliminations Total
Assets
Current assets:
Cash and cash equivalents $ 3,518 $ 46 $ 6,317 $ — $ 9,881
Receivables:
Trade accounts receivables, net of allowance for
doubtful accounts 27,246 51,117 50,564 — 128,927
Other 17,418 10,762 7,107 (27,604) 7,683
Inventories 58,619 — 28,142 (2,486) 84,275
Deferred income taxes 5,607 — 2,979 — 8,586
Prepaid expenses and other 14,452 — 5,518 — 19,970
Total current assets 126,860 61,925 100,627 (30,090) 259,322
Property, plant and equipment, net 75,838 — 26,748 — 102,586
Deferred charges and other 65,413 1 1,224 (30,288) 36,350
Goodwill 1,035 — 29,532 — 30,567
Intangible assets, net 89,046 — — (188) 88,858
Deferred income taxes 6,079 1,598 4,666 — 12,343
Debt issuance costs 3,207 — — — 3,207
Investments in subsidiaries 149,329 86,673 — (236,002) —
Total assets $ 516,807 $150,197 $162,797 $(296,568) $ 533,233
Liabilities and Shareholders’ Equity
Current liabilities:
Current maturities of long-term debt $ 16,985 $ — $ 3,854 $ (7,439) $ 13,400
Accounts payable 68,188 — 27,688 (19,721) 76,155
Accrued liabilities:
Wages and benefits 7,182 — 1,728 — 8,910
Income taxes payable 4,696 860 1,587 — 7,143
Accrued interest 1,657 — 7 — 1,664
Restructuring charges 1,639 — 62 — 1,701
Other 7,331 3 2,477 — 9,811
Total current liabilities 107,678 863 37,403 (27,160) 118,784
Long-term debt, net of current maturities 188,461 — 30,298 (30,288) 188,471
Employee benefit obligations, net of current portion 23,603 — 406 — 24,009
Deferred income taxes 13,549 5 7,403 — 20,957
Other 5,354 — 865 — 6,219
Total liabilities 338,645 868 76,375 (57,448) 358,440
Shareholders’ equity:
Common stock 615 1 12,072 (12,072) 616
Additional paid-in capital 180,704 62,788 54,157 (116,826) 180,823
Retained earnings 152,745 95,099 28,449 (127,072) 149,221
Accumulated other comprehensive loss (19,894) (8,559) (8,256) 16,850 (19,859)
Notes receivable from officers/shareholders (4,205) — — — (4,205)
309,965 149,329 86,422 (239,120) 306,596
Less treasury stock, at cost (130,070) — — — (130,070)
Less unearned restricted stock compensation (1,733) — — — (1,733)
Total shareholders’ equity 178,162 149,329 86,422 (239,120) 174,793
Total liabilities and shareholders’ equity $ 516,807 $150,197 $162,797 $(296,568) $ 533,233
Notes to Consolidated Financial StatementsRayovac Corporation and Subsidiaries
(In thousands, except per share amounts)

Condensed Consolidating Statement of Operations
Year Ended September 30, 2002
Guarantor Nonguarantor Consolidated
Parent Subsidiaries Subsidiaries Eliminations Total
Net sales $ 424,199 $ 42,132 $160,926 $(54,521) $ 572,736
Cost of goods sold 237,431 40,869 108,742 (52,895) 334,147
Restructuring and related charges (1,063) — 2,273 — 1,210
Gross profit 187,831 1,263 49,911 (1,626) 237,379
Operating expenses:
Selling 71,389 818 32,557 (390) 104,374
General and administrative 53,543 (11,328) 14,685 — 56,900
Research and development 13,084 — — — 13,084
138,016 (10,510) 47,242 (390) 174,358
Income from operations 49,815 11,773 2,669 (1,236) 63,021
Interest expense 15,390 — 2,216 (1,558) 16,048
Equity (income) loss (10,697) 2,389 — 8,308 —
Other (income) expense, net (2,180) (469) 2,131 1,808 1,290
Income (loss) before income taxes 47,302 9,853 (1,678) (9,794) 45,683
Income tax expense (benefit) 16,579 (844) 711 — 16,446
Net income (loss) $ 30,723 $ 10,697 $ (2,389) $ (9,794) $ 29,237
Condensed Consolidating Statement of Cash Flows
Year Ended September 30, 2002
Guarantor Nonguarantor Consolidated
Parent Subsidiaries Subsidiaries Eliminations Total
Net cash provided by operating activities $ 65,250 $ — $ 6,615 $ (5,039) $ 66,826
Cash flows from investing activities:
Purchases of property, plant and equipment (13,154) — (2,487) — (15,641)
Proceeds from sale of property, plant, and equipment 42 — 126 — 168
Net cash used by investing activities (13,112) — (2,361) — (15,473)
Cash flows from financing activities:
Reduction of debt (219,343) — (5,088) — (224,431)
Proceeds from debt financing 169,100 — — — 169,100
Issuance of stock and exercise of stock options 134 — — — 134
Other (1,360) — (408) 251 (1,517)
Net cash used by financing activities (51,469) — (5,496) 251 (56,714)
Effect of exchange rate changes on cash and cash equivalents — — (904) 4,788 3,884
Net increase (decrease) in cash and cash equivalents 669 — (2,146) — (1,477)
Cash and cash equivalents, beginning of period 2,849 46 8,463 — 11,358
Cash and cash equivalents, end of period $ 3,518 $ 46 $ 6,317 $ — $ 9,881
Notes to Consolidated Financial StatementsRayovac Corporation and Subsidiaries
(In thousands, except per share amounts)
Page 62/63

Condensed Consolidating Statement of Operations
Year Ended September 30, 2001
Guarantor Nonguarantor Consolidated
Parent Subsidiaries Subsidiaries Eliminations Total
Net sales $ 431,602 $ 45,223 $194,157 $(54,810) $ 616,172
Cost of goods sold 249,496 43,866 121,902 (54,091) 361,173
Restructuring and related charges 17,399 — 4,704 — 22,103
Gross profit 164,707 1,357 67,551 (719) 232,896
Operating expenses:
Selling 82,340 681 36,585 — 119,606
General and administrative 43,384 (11,640) 14,782 — 46,526
Research and development 12,191 — — — 12,191
Restructuring and related charges 204 — — — 204
138,119 (10,959) 51,367 — 178,527
Income from operations 26,588 12,316 16,184 (719) 54,369
Interest expense 25,860 — 3,033 (1,704) 27,189
Non operating expense 8,587 — — — 8,587
Equity (income) (20,008) (6,640) — 26,648 —
Other (income) expense, net (1,491) (584) 1,465 1,704 1,094
Income before income taxes 13,640 19,540 11,686 (27,367) 17,499
Income tax expense (benefit) 1,387 (468) 5,046 — 5,965
Net income $ 12,253 $ 20,008 $ 6,640 $(27,367) $ 11,534
Condensed Consolidating Statement of Cash Flows
Year Ended September 30, 2001
Guarantor Nonguarantor Consolidated
Parent Subsidiaries Subsidiaries Eliminations Total
Net cash provided by operating activities $ 12,293 $ 2 $ 5,752 $ — $ 18,047
Cash flows from investing activities:
Purchases of property, plant and equipment (17,475) — (2,218) — (19,693)
Purchases of investments (500) — (297) — (797)
Proceeds from sale of investments — — 1,354 — 1,354
Proceeds from sale of property, plant, and equipment 78 — 785 — 863
Net cash used by investing activities (17,897) — (376) — (18,273)
Cash flows from financing activities:
Reduction of debt (412,815) — (3,884) — (416,699)
Extinguishment of debt (69,652) — — — (69,652)
Proceeds from debt financing 421,914 — — — 421,914
Issuance of stock and exercise of stock options 67,506 — — — 67,506
Other (1,191) — (209) — (1,400)
Net cash provided (used) by financing activities 5,762 — (4,093) — 1,669
Effect of exchange rate changes on cash and cash equivalents — — 158 — 158
Net increase in cash and cash equivalents 158 2 1,441 — 1,601
Cash and cash equivalents, beginning of period 2,691 44 7,022 — 9,757
Cash and cash equivalents, end of period $ 2,849 $ 46 $ 8,463 $ — $ 11,358
Notes to Consolidated Financial StatementsRayovac Corporation and Subsidiaries
(In thousands, except per share amounts)

Rayovac Corporation’s financial statements are prepared by management, which is responsible for their fairness, integrity and
objectivity. The accompanying financial statements have been prepared in conformity with generally accepted accounting prin-
ciples in the United States applied on a consistent basis except for accounting changes as disclosed and accordingly, include amounts
that are estimates and judgments. All historical financial information in this annual report is consistent with the accompanying
financial statements.
Rayovac maintains accounting systems, including internal accounting controls monitored by internal audit, that are designed to
provide reasonable assurance of the reliability of financial records and the protection of assets. The concept of reasonable assurance
is based on recognition that the cost of a system should not exceed the related benefits. The effectiveness of those systems depends
primarily upon the careful selection of financial and other managers, clear delegation of authority and assignment of accountability,
inculcation of high business ethics and conflict-of-interest standards, policies and procedures and the leadership and commitment
of top management.
Rayovac’s financial statements are audited by independent auditors, in accordance with generally accepted auditing standards in the
United States. These standards provide for a review of Rayovac’s internal accounting controls to the extent they deem appropriate
in order to issue their opinion on the financial statements.
The Audit Committee of the Board of Directors, which consists solely of non-employee directors, is responsible for overseeing the
functioning of the accounting system and related controls and the preparation of annual financial statements. The Audit Committee
members periodically meet with management to review and evaluate their accounting, auditing and financial reporting activities
and responsibilities. The independent accountants and internal audit have full and free access to the Audit Committee with and
without management present.
Management’s Statement of Responsibility for Financial StatementsRayovac Corporation and Subsidiaries
Page 64/65

The Board of Directors and Shareholders
Rayovac Corporation:
We have audited the accompanying consolidated balance sheets of Rayovac Corporation and subsidiaries as of September 30, 2002
and 2003, and the related consolidated statements of operations, shareholders’ equity, and cash flows for each of the years in the
three-year period ended September 30, 2003. These financial statements are the responsibility of the Company’s management. Our
responsibility is to express an opinion on these financial statements based on our audits.
We conducted our audits in accordance with auditing standards generally accepted in the United States of America. Those standards
require that we plan and perform the audit to obtain reasonable assurance about whether the financial statements are free of mate-
rial misstatement. An audit includes examining, on a test basis, evidence supporting the amounts and disclosures in the financial
statements. An audit also includes assessing the accounting principles used and significant estimates made by management, as well
as evaluating the overall financial statement presentation. We believe that our audits provide a reasonable basis for our opinion.
In our opinion, the consolidated financial statements referred to above present fairly, in all material respects, the financial position
of Rayovac Corporation and subsidiaries as of September 30, 2002 and 2003, and the results of their operations and their cash flows
for each of the years in the three-year period ended September 30, 2003 in conformity with accounting principles generally accepted
in the United States of America.
As discussed in Note 2(x) to the consolidated financial statements, the Company revised its presentation of loss on early extinguish-
ment of debt in the accompanying consolidated statement of operations for the year ended September 30, 2001 as required by State-
ment of Financial Accounting Standards No. 145, Recession of FASB Statements No. 4, 44, and 64, Amendment of FASB Statement No. 13, and
Technical Corrections, and in 2002 the Company changed its method of accounting for goodwill and indefinite-lived intangible assets
to conform with Statement of Financial Accounting Standards No. 142, Goodwill and Other Intangible Assets.
KPMG LLP
Chicago, Illinois
November 7, 2003
Independent Auditors’ Report

Our common stock, $0.01 par value per share (the “Common Stock”), is traded on the New York Stock Exchange (the “NYSE”)
under the symbol “ROV.” The Common Stock commenced public trading on November 21, 1997. As of December 1, 2003, there
were 244 holders of record of Common Stock based upon data provided by the transfer agent for the Common Stock. The follow-
ing table sets forth the reported high and low prices per share of the Common Stock as reported on the New York Stock Exchange
Composite Transaction Tape for the fiscal periods indicated:High Low
Fiscal 2003
Quarter ended December 29, 2002 $16.28 $11.20
Quarter ended March 30, 2003 $14.49 $10.50
Quarter ended June 29, 2003 $13.84 $ 9.93
Quarter ended September 30, 2003 $15.75 $12.68
Fiscal 2002
Quarter ended December 30, 2001 $18.05 $13.60
Quarter ended March 31, 2002 $17.93 $12.81
Quarter ended June 30, 2002 $19.10 $14.80
Quarter ended September 30, 2002 $18.52 $11.75
We have not declared or paid any cash dividends on the Common Stock since it commenced public trading in 1997 and we do not
anticipate paying cash dividends in the foreseeable future, but intend to retain any future earnings for reinvestment in our business.
In addition, the terms of our credit facility and the indentures governing our outstanding 81⁄2% senior subordinated notes due 2013
restrict our ability to pay dividends to our shareholders. Any future determination to pay cash dividends will be at the discretion of
the Board of Directors and will be dependent upon our financial condition, results of operations, capital requirements, contractual
restrictions and such other factors as the Board of Directors deems relevant.
Information regarding our equity compensation plans is set forth in Item 12 hereof under the caption “Equity Compensation
Plan Information.”
Market for the Registrant’s Common Equity and Related Stockholder MattersRayovac Corporation and Subsidiaries
Page 66